Introduction
Renal cell carcinoma (RCC) has been identified as
the most commonly diagnosed subtype of kidney cancer, accounting
for 2–3% of all malignancies (1).
According to specific histopathological and genetic
characteristics, three common pathologic types of RCC, including
clear cell RCC (CCRCC; 80–90%), papillary RCC (PRCC; 10–15%) and
chromophobe RCC (CRCC; 4–5%) account for 90% of all RCCs (2). At present, radical nephrectomy is an
effective treatment for early-stage and localized RCC (3). However, there are still a certain
part of patients diagnosed with advanced or metastatic RCC (mRCC)
at the first visit (4). Some
patients, although they have a small and localized RCC at the
beginning, may still develop metastatic RCC after radical
nephrectomy, where the underlying mechanisms are poorly understood.
Therefore, it is urgent to develop novel biomarkers for early
diagnosis and prognostic assessment. Although with the progress of
molecular biology, neoadjuvant therapy targeting VEGFR (5) has brought a new hope for advanced
mRCC, original drug resistance was seen in ≥50% of the patients,
and acquired drug resistances were developed monthly. Therefore, an
increasing understanding of the complex molecular basis of RCC is
needed for the clinical treatment of this aggressive
malignancy.
Translation of mRNA is a key process for protein
synthesis in eukaryotes, including initiation, elongation and
termination. Regulation of protein synthesis at translation
initiation level is essential for the control of cell proliferation
under normal physiological conditions. Eukaryotic translation
initiation factor 3 (eIF3) is the largest known multi-protein
complex containing 13 subunits (EIF3A-EIF3M), and is required for
eukaryotic protein synthesis by binding mRNA to 40S small ribosomal
subunits and preventing premature binding of large ribosomal
subunits (6). Interestingly,
misregulation of EIF3 expression is closely related to cancer
development and progression (6).
It was recently reported (7) that
overexpression of eIF3a could promote the growth of ovarian cancer
cells and decrease the sensitivity of ovarian cancer cells to
cisplatin. In addition, increased eIF3e expression was reported to
be associated with colon tumor development and poor prognosis,
whereas knockdown of eIF3e inhibited the proliferation of colon
cancer cells (8). EIF3D, one of
the core subunits of eIF3, was reported to play an oncogenic role
in prostate cancer, glioma, melanoma, colon cancer and non-small
cell lung cancer (NSCLC) (9–13).
However, the clinical significance and biological function of eIF3
in human RCC remains unclear.
Therefore, the objective of this study was to
explore the role of EIF3D in the pathogenesis of RCC, through IHC
staining of RCC specimens, oncomine dataset analysis, and
shRNA-mediated gene knockdown. The possible molecular mechanism
involved in EIF3D-mediated function was also investigated.
Materials and methods
Cancer specimens and tissue
microarray
In total 20 CCRCC tissue specimens and corresponding
paired paracarcinoma tissue specimens were provided by the
Department of Urinary Surgery of Shanghai Changzheng Hospital from
January 2015 to June 2015. All specimens were fixed in formalin and
embedded with paraffin. RCC tissue specimens and corresponding
paired paracarcinoma tissue specimens were snap frozen in liquid
nitrogen and stored at −80°C before use. None of the patients had
other renal diseases, other tumors or systemic diseases, and did
not undergo any surgery before the radical nephrectomy. RCC tissue
microarray containing 102 RCC specimens were obtained from the
Department of Urinary Surgery of Shanghai Changhai Hospital. Of the
102 RCC specimens, 92 were CCRCC, 6 were PRCC and the remaining 4
specimens were CRCC. This study was approved by the institutional
review board of the Second Military Medical University (Shanghai,
China). All the patients were required to provide written informed
consent before enrollment.
Cell lines
Human CCRCC cell lines 786-O, ACHN, A498, 769-P,
Caki-1 and Caki-2 were obtained from the cell bank of the Chinese
Academy of Sciences (Shanghai, China). 786-O and 769-P cell lines
were maintained in RPMI-1640 (Hyclone) with 10% fetal bovine serum
(FBS, Gibco). ACHN cell line was maintained in DMEM (Hyclone) with
10% FBS (Gibco). Caki-1, A498 and Caki-2 cell lines were maintained
in MEM (Hyclone) with 10% FBS (Gibco). All of these cells were
cultured in a humidified incubator containing 5% CO2 at
37°C.
Immunohistochemistry
Paraffin blocks were sliced into 5-μm sections, and
sequentially dewaxed in xylene, 100, 90, 80 and 70% ethanol and
ddH2O. The slides were first incubated with rabbit
anti-EIF3D antibody (1:200, ab155419, Abcam) at 4°C overnight,
labeled with biotinylated goat anti-rabbit serum and
streptavidin-peroxidase conjugate for 15 min, and developed with
diaminobenzidine (DAB). The positivity and intensity were assessed
under a light microscope by two independent pathologists in a
blinded manner. The distribution area (0, 0–20, 20–60 and 60–100%)
of EIF3D-positive staining cells was given 0, 1, 2 and 3 scores,
respectively. The specimen staining intensities, which were light
yellow, yellow, brown yellow and reddish brown, were given 0, 1, 2
and 3 scores, respectively. The final score was a combination of
the two scores, classified into four grades: negative (0), weak
(1), medium (2–4), and strong (5–6), respectively.
Lentivirus construction and
transfection
ShRNA sequence targeting human EIF3D (NM_003753.3)
(5′-GCGTCATTGA CATCTGCATGACTCGAGTCATGCAGATGTCAATGACG CTTTTTT-3′)
and the control shRNA sequence (5′-CTAGCC
CGGTTCTCCGAACGTGTCACGTATCTCGAGATACGTG ACACGTTCGGAGAATTTTTTTAAT-3′)
were designed and inserted into the plasmid pFH vector (Hollybio,
Shanghai, China) containing green fluorescent protein (GFP) as a
reporter gene. To generate recombinant lentivirus, the
reconstructed EIF3D silencing plasmid and two packaging plasmids
were cotransfected into HEK293T cells using calcium phosphate
precipitation method. Approximately 72 h after transfection,
recombinant lentivirus was harvested and purified by
ultracentrifugation. For lentiviral transduction, 786-O cells
(3×10⁴ cell/well) and ACHN cells (6×10⁴
cell/well) were seeded in 6-well plates overnight, and transduced
with lentivirus containing shEIF3D or shCon at MOIs of 25 and 20,
respectively. Transduction efficiency was monitored by relative GFP
expression under fluorescent microscopy at 72 h post-transduction.
At 120 h after transduction, cells were harvested to verify EIF3D
silencing efficiency using RT-PCR and western blotting.
Quantitative real-time PCR
Total RNA was isolated from cells and samples using
TRIzol reagent (Gibco) according to the manufacturer's
instructions. Total RNA (2 μg) was reverse transcribed into cDNA
using oligo(dT) primer and the M-MLV reverse transcriptase
(Promega). Total 10 μl 2X SYBR premix ex-taq, 0.5 μl primer, 5 μl
cDNA and 4.5 μl ddH2O were mixed for quantitative
real-time PCR (qRT-PCR) using CFX Connect™ Real-Time PCR Detection
System (Takara). The primer sequences used were: 5′-CTGGAGGAGGGCAAA
TACCT-3′ (forward) and 5′-CTCGGTGGAAGGACAAA CTC-3′ (reverse) for
EIF3D; 5′-GTGGACATCCGCAAA GAC-3′ (forward) and
5′-AAAGGGTGTAACGCAACTA-3′ (reverse) for β-actin. The
2−ΔΔCt method was used to calculate relative expression
level of EIF3D, being normalized to β-actin. The experiment was
performed in triplicate and repeated three times.
Western blotting
Cell samples and fresh RCC tissues were lysed in 2X
SDS lysis buffer at 4°C and boiled for 5 min. Then, the supernatant
was separated by centrifugation at 12,000 × g for 10 min at 4°C.
Protein quantification was carried out using BCA protein assay kit.
Proteins after quantification were separated in 10% SDS-PAGE gel
electrophoresis and transferred onto PVDF membranes. Next, the
transferred PVDF membranes were blocked in 5% non-fat milk
dissolved in TBST solution for 1 h at room temperature. Then, the
membrane was probed with the following primary antibodies: EIF3D
(ab155419, Abcam), RARP (#9542, Cell Signaling), Cyclin B1 (#21540,
SAB), CDC2 (#19532-1-AP, Proteintech), P21 (#2947, Cell Signaling)
and GAPDH (#10494-1-AP, Proteintech) at 4°C overnight, and then
incubated with horse-radish peroxidase-conjugated goat anti-rabbit
IgG antibody (#Sc-2054, Santa Cruz) for 1 h at room temperature.
The signals of proteins were detected with enhanced
chemiluminescence. GAPDH protein was used as an internal
control.
MTT assay
Cell viability after EIF3D knockdown was measured
using 3-(4, 5-dimethylthiazol-2-yl)-2,5-diphenyltetrazolium bromide
(MMT) assay. After 72-h infection, 786-O and ACHN cells from
different groups (Con, Lv-shCon, Lv-shEIF3D) were trypsinized,
suspended, counted and plated in a 96-well plate at a density of
3×10³ cells/well for five points in time (days 1, 2, 3,
4 and 5). At each time-point, cells were incubated with MTT
solution for 4 h and then incubated with acidified isopropanol
overnight. The absorbance at 595 nm was measured using microplate
reader. The experiment was performed three times and each group
sample had five repetitions.
Plate colony formation assay
After 72-h infection, 786-O and ACHN cells from
different groups (Con, Lv-shCon, Lv-shEIF3D) were trypsinized,
suspended, counted and plated in a 6-well plate at a density of 400
cells/well. Subsequently, culture medium was replaced every 3 days.
After incubation for 2 weeks, cells were fixed in 4%
paraformaldehyde for 30 min, and stained with Giemsa solution for
20 min. The number of colonies (>50 cells per colony) in each
well was counted under a light microscope and photographed using a
digital camera. The experiment was performed three times and each
group had three repetitions.
Cell cycle analysis
After 120-h infection, 786-O and ACHN cells from
different groups (Con, Lv-shCon, Lv-shEIF3D) were trypsinized,
centrifuged, washed with ice-cold PBS, fixed in 75% ethanol
overnight, washed again with PBS, centrifuged, and incubated in 500
μl PI staining solution (PI and RNase A) at 37°C for 1 h. Cell
cycle distribution was analyzed by flow cytometer (BD Biosciences,
USA). The experiment was performed three times in triplicate.
Bioinformatics meta-analysis using
ONCOMINE microarray datasets
To investigate the expression of EIF3D in RCC tissue
vs. normal kidney tissue, we conducted a meta-analysis on online
microarray data in the Oncomine database (www.onocomine.org) including previously published and
publicly available 715 datasets and 86,733 samples. The following
search terms were used: ‘EIF3D’, ‘Cancer vs. Normal Analysis’,
‘Kidney Cancer’ and ‘mRNA’. Then, six datasets were identified. One
dataset (Cutcliffe Renal, Clin Cancer Res, 2005) that did not
include a differential analysis of RCC vs. normal kidney was
excluded from our meta-analysis. All data are reported Log2
Median-Centered intensity in the Oncomine database. Correlation
analysis of two gene expressions was performed on the same dataset
(Jones Renal, Clin Cancer Res, 2005).
Statistical analysis
All results were drafted in diagrams by GraphPad
Prism 5 software. Wilcoxon signed rank test was carried out to
evaluate differences in EIF3D expression between RCC tissue and
paired paracarcinoma tissue. Chi-square test was used to analyze
EIF3D expression and patient characteristics of RCC tissue
microarray. Statistical comparisons on the continuous variables of
two groups (Lv-shCon vs. Lv-shEIF3D) were performed by the
Student's t-test. All statistical calculations were carried out
using SPSS version 19 (IBM Corp., USA), and P-value <0.05 was
considered statistically significant.
Results
EIF3D mRNA and protein are upregulated in
RCC tissue
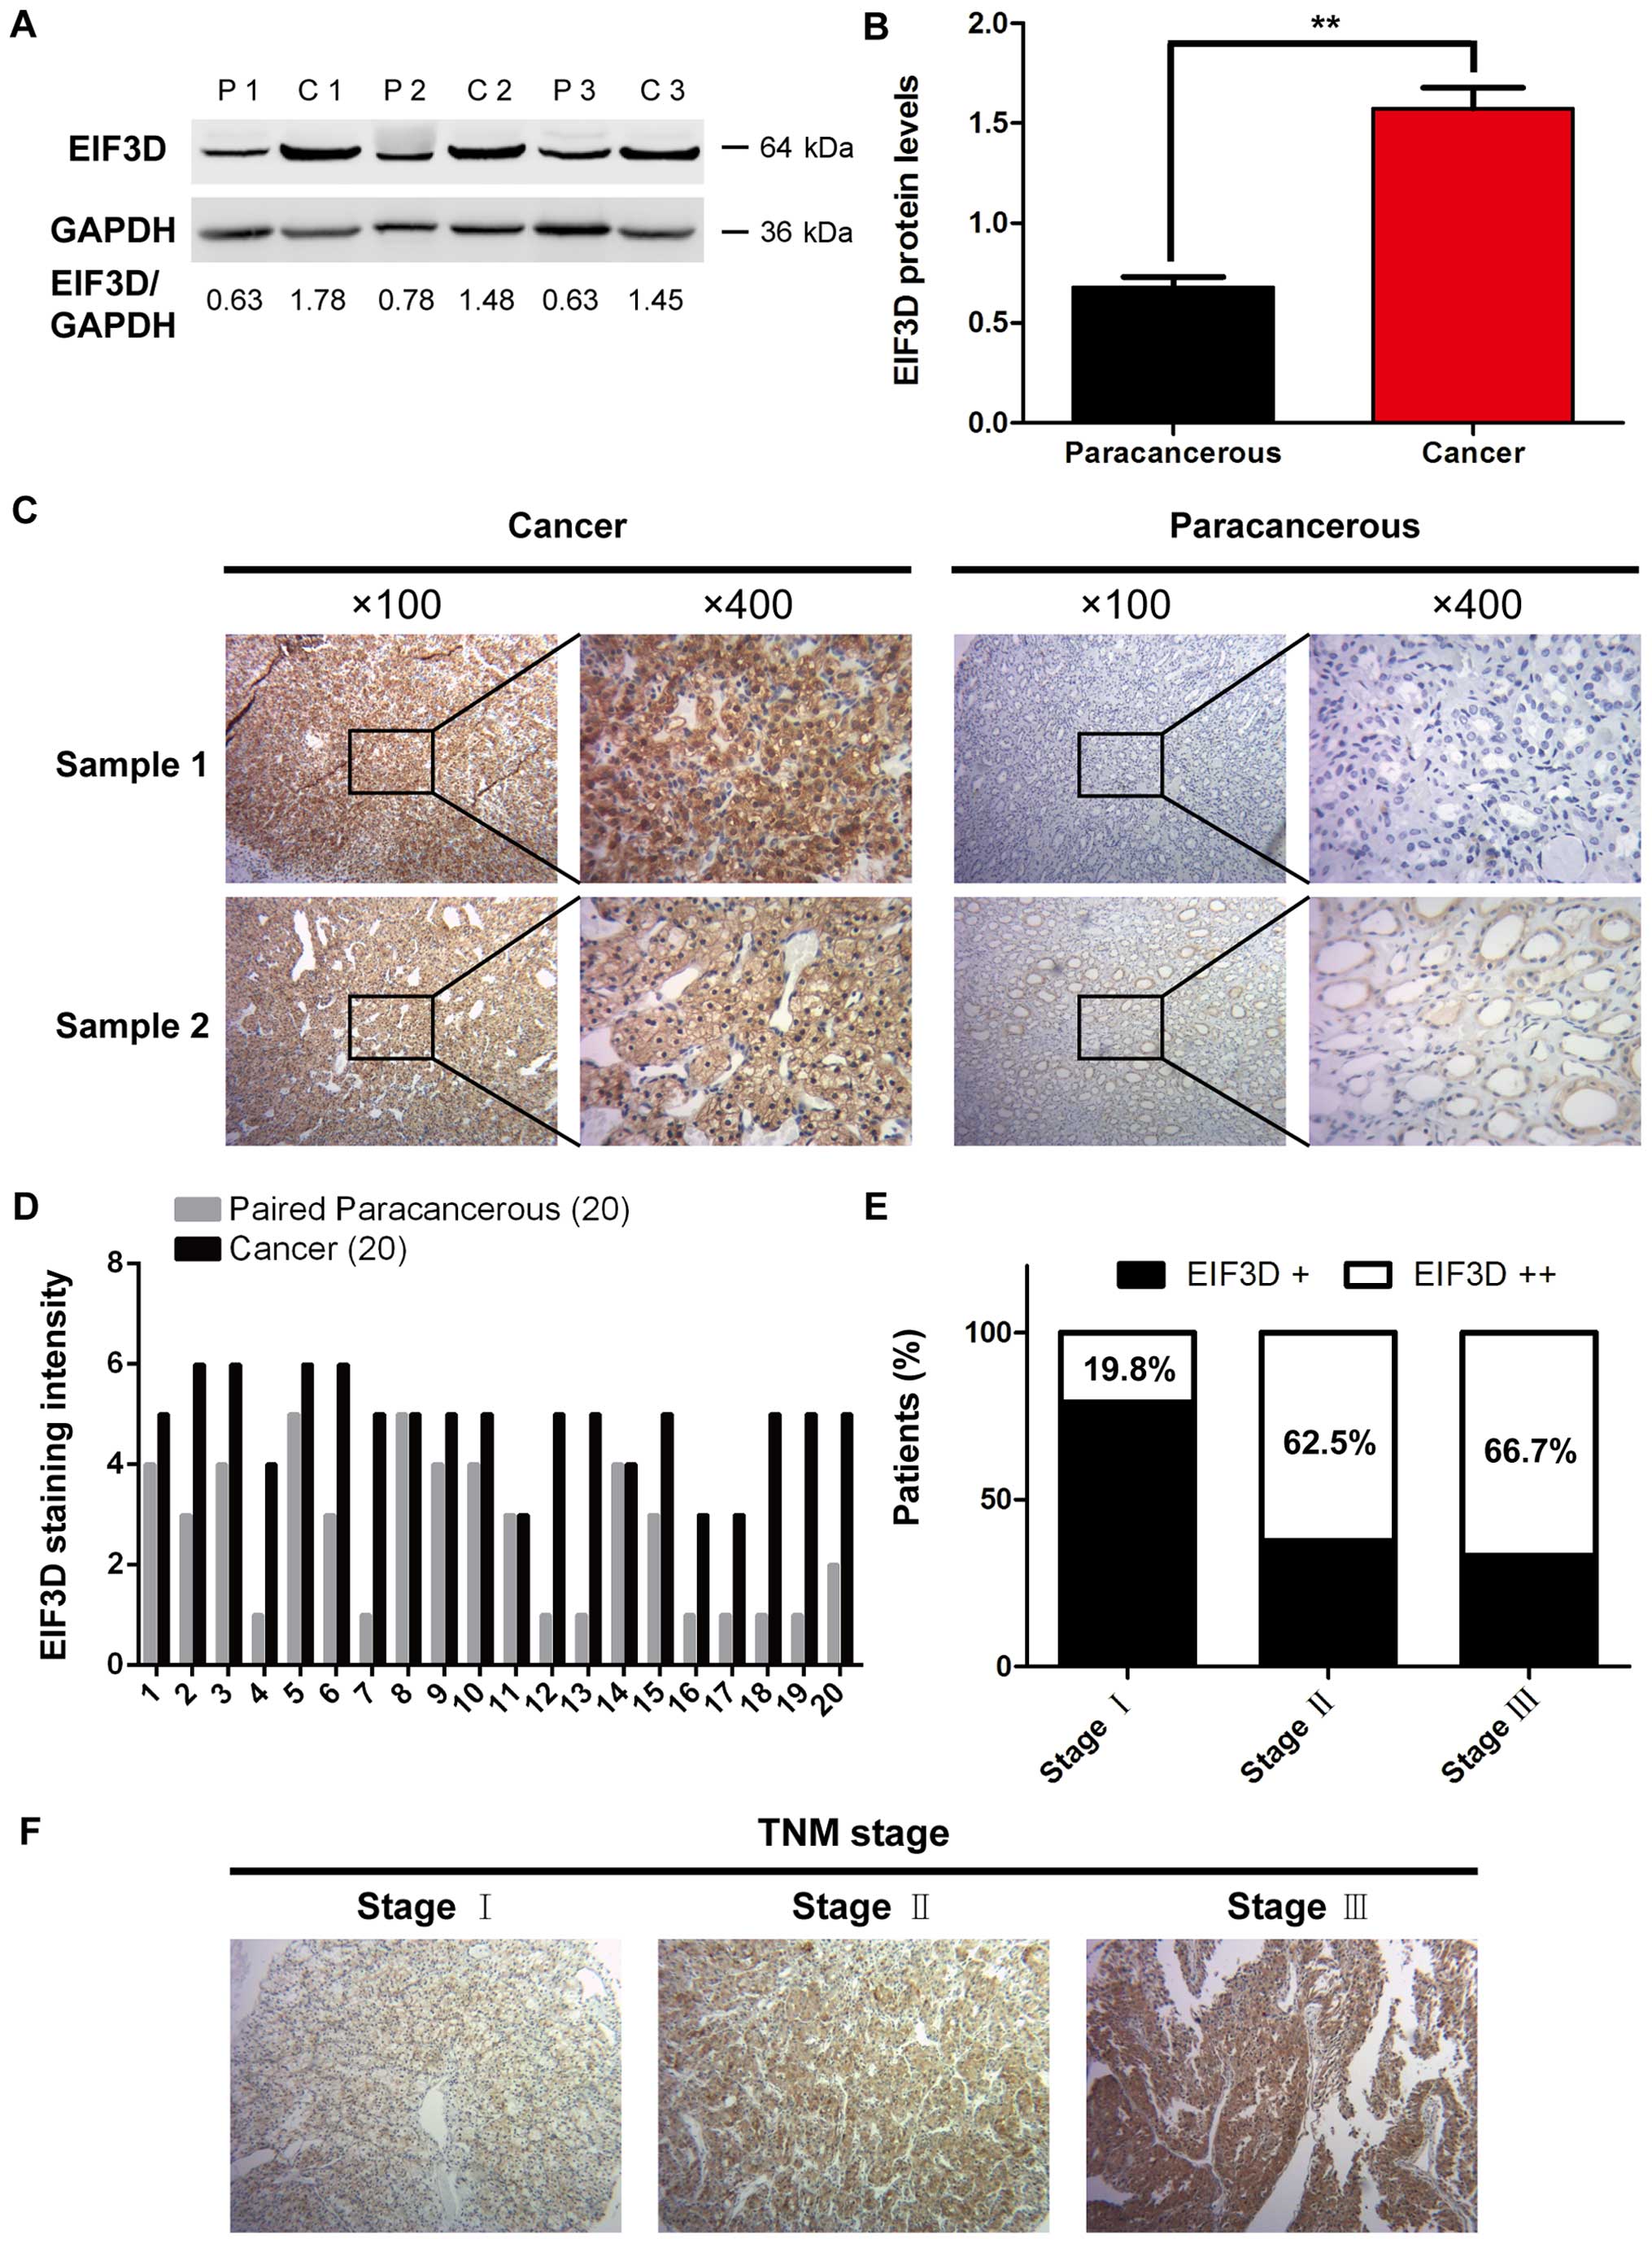
To compare the expression levels of EIF3D in
clinical RCC tissue and paired paracarcinoma tissue, three pairs of
fresh RCC tissues and paired paracarcinoma tissues were analyzed by
western blotting. It was found that the EIF3D expression level in
RCC tissue was significantly higher than that in the paracarcinoma
tissues (P=0.005) (Fig. 1A and B).
Representative images of EIF3D staining are shown in Fig. 1C. Moreover, EIF3D expressions in
RCC tissues was also significantly higher than that in the
paracarcinoma normal kidney tissues (Fig. 1D), and the difference was
considered to be statistically significant (Table I, P<0.001).
 | Table IIHC staining of EIF3D expression in
prostate cancer and paired paracarcinoma tissues. |
Table I
IHC staining of EIF3D expression in
prostate cancer and paired paracarcinoma tissues.
| | Positive level | |
|---|
| |
| |
|---|
| No. of
specimen | +/− | + | ++ | P-valuea |
|---|
| Cancer | 20 | 0 | 5 | 15 | <0.001 |
| Paracancerous | 20 | 8 | 10 | 2 | |
Correlations between EIF3D expression and
clinicopathologic features in RCC patients
To further confirm the clinical significance of
EIF3D in RCC, an RCC tissue microarray containing 102 cases of RCC
sections were used to assess the relationships between EIF3D
proteins and corresponding patient clinicopathological features by
Chi-square test. As shown in Table
II, EIF3D expression in RCC tissues was significantly
correlated with tumor size (P=0.004) and TNM stage (P=0.03), while
no significant associations were observed between EIF3D expression
and sex, age, Fuhrman grade, histologic type or metastasis.
Notably, the percentage of EIF3D staining intensity was positively
correlated with the TNM stage (Fig. 1E
and F).
| Table IICorrelations between EIF3D expression
and clinicopathologic parameters in patients with RCC using tissue
microarray analysis. |
Table II
Correlations between EIF3D expression
and clinicopathologic parameters in patients with RCC using tissue
microarray analysis.
| | Expression of
EIF3D | |
|---|
| |
| |
|---|
| Parameters | Total (n=102) | + (n=77, %) | ++ (n=25, %) | P-value (Chi-square
test) |
|---|
| Gender | | | | |
| Male | 71 (69.6) | 56 (72.7) | 15 (60.0) | 0.229 |
| Female | 31 (30.4) | 21 (27.3) | 10 (40.0) | |
| Tumor size
(cm) | | | |
0.004a |
| ≤4 | 58 (56.9) | 50 (64.9) | 8 (32.0) | |
| >4 | 44 (43.1) | 27 (35.1) | 17 (68.0) | |
| TNM stage | | | |
0.03a |
| I | 91 (89.2) | 73 (94.8) | 18 (72.0) | |
| II | 8 (7.8) | 3 (3.9) | 5 (20.0) | |
| III | 3 (2.9) | 1 (1.3) | 2 (8.0) | |
| Fuhrman grade | | | | 0.269 |
| 1 | 35 (34.3) | 28 (36.4) | 7 (28.0) | |
| 2 | 55 (53.9) | 40 (51.9) | 15 (60.0) | |
| 3 | 11 (10.9) | 9 (11.7) | 2 (8.0) | |
| 4 | 1 (1.0) | 0 | 1 (4.0) | |
| Histology | | | | 0.355 |
| CCRCC | 92 (90.2) | 68 (88.3) | 24 (96.0) | |
| PRCC | 6 (5.9) | 6 (7.8) | 0 | |
| CRCC | 4 (3.9) | 3 (3.9) | 1 (4.0) | |
| Metastases | | | | 0.314 |
| Yes | 6 (5.9) | 3 (3.9) | 3 (12.0) | |
| No | 96 (94.1) | 74 (96.1) | 22 (88.0) | |
Knockdown of EIF3D in RCC cells through
lentivirus-mediated expression of shRNA
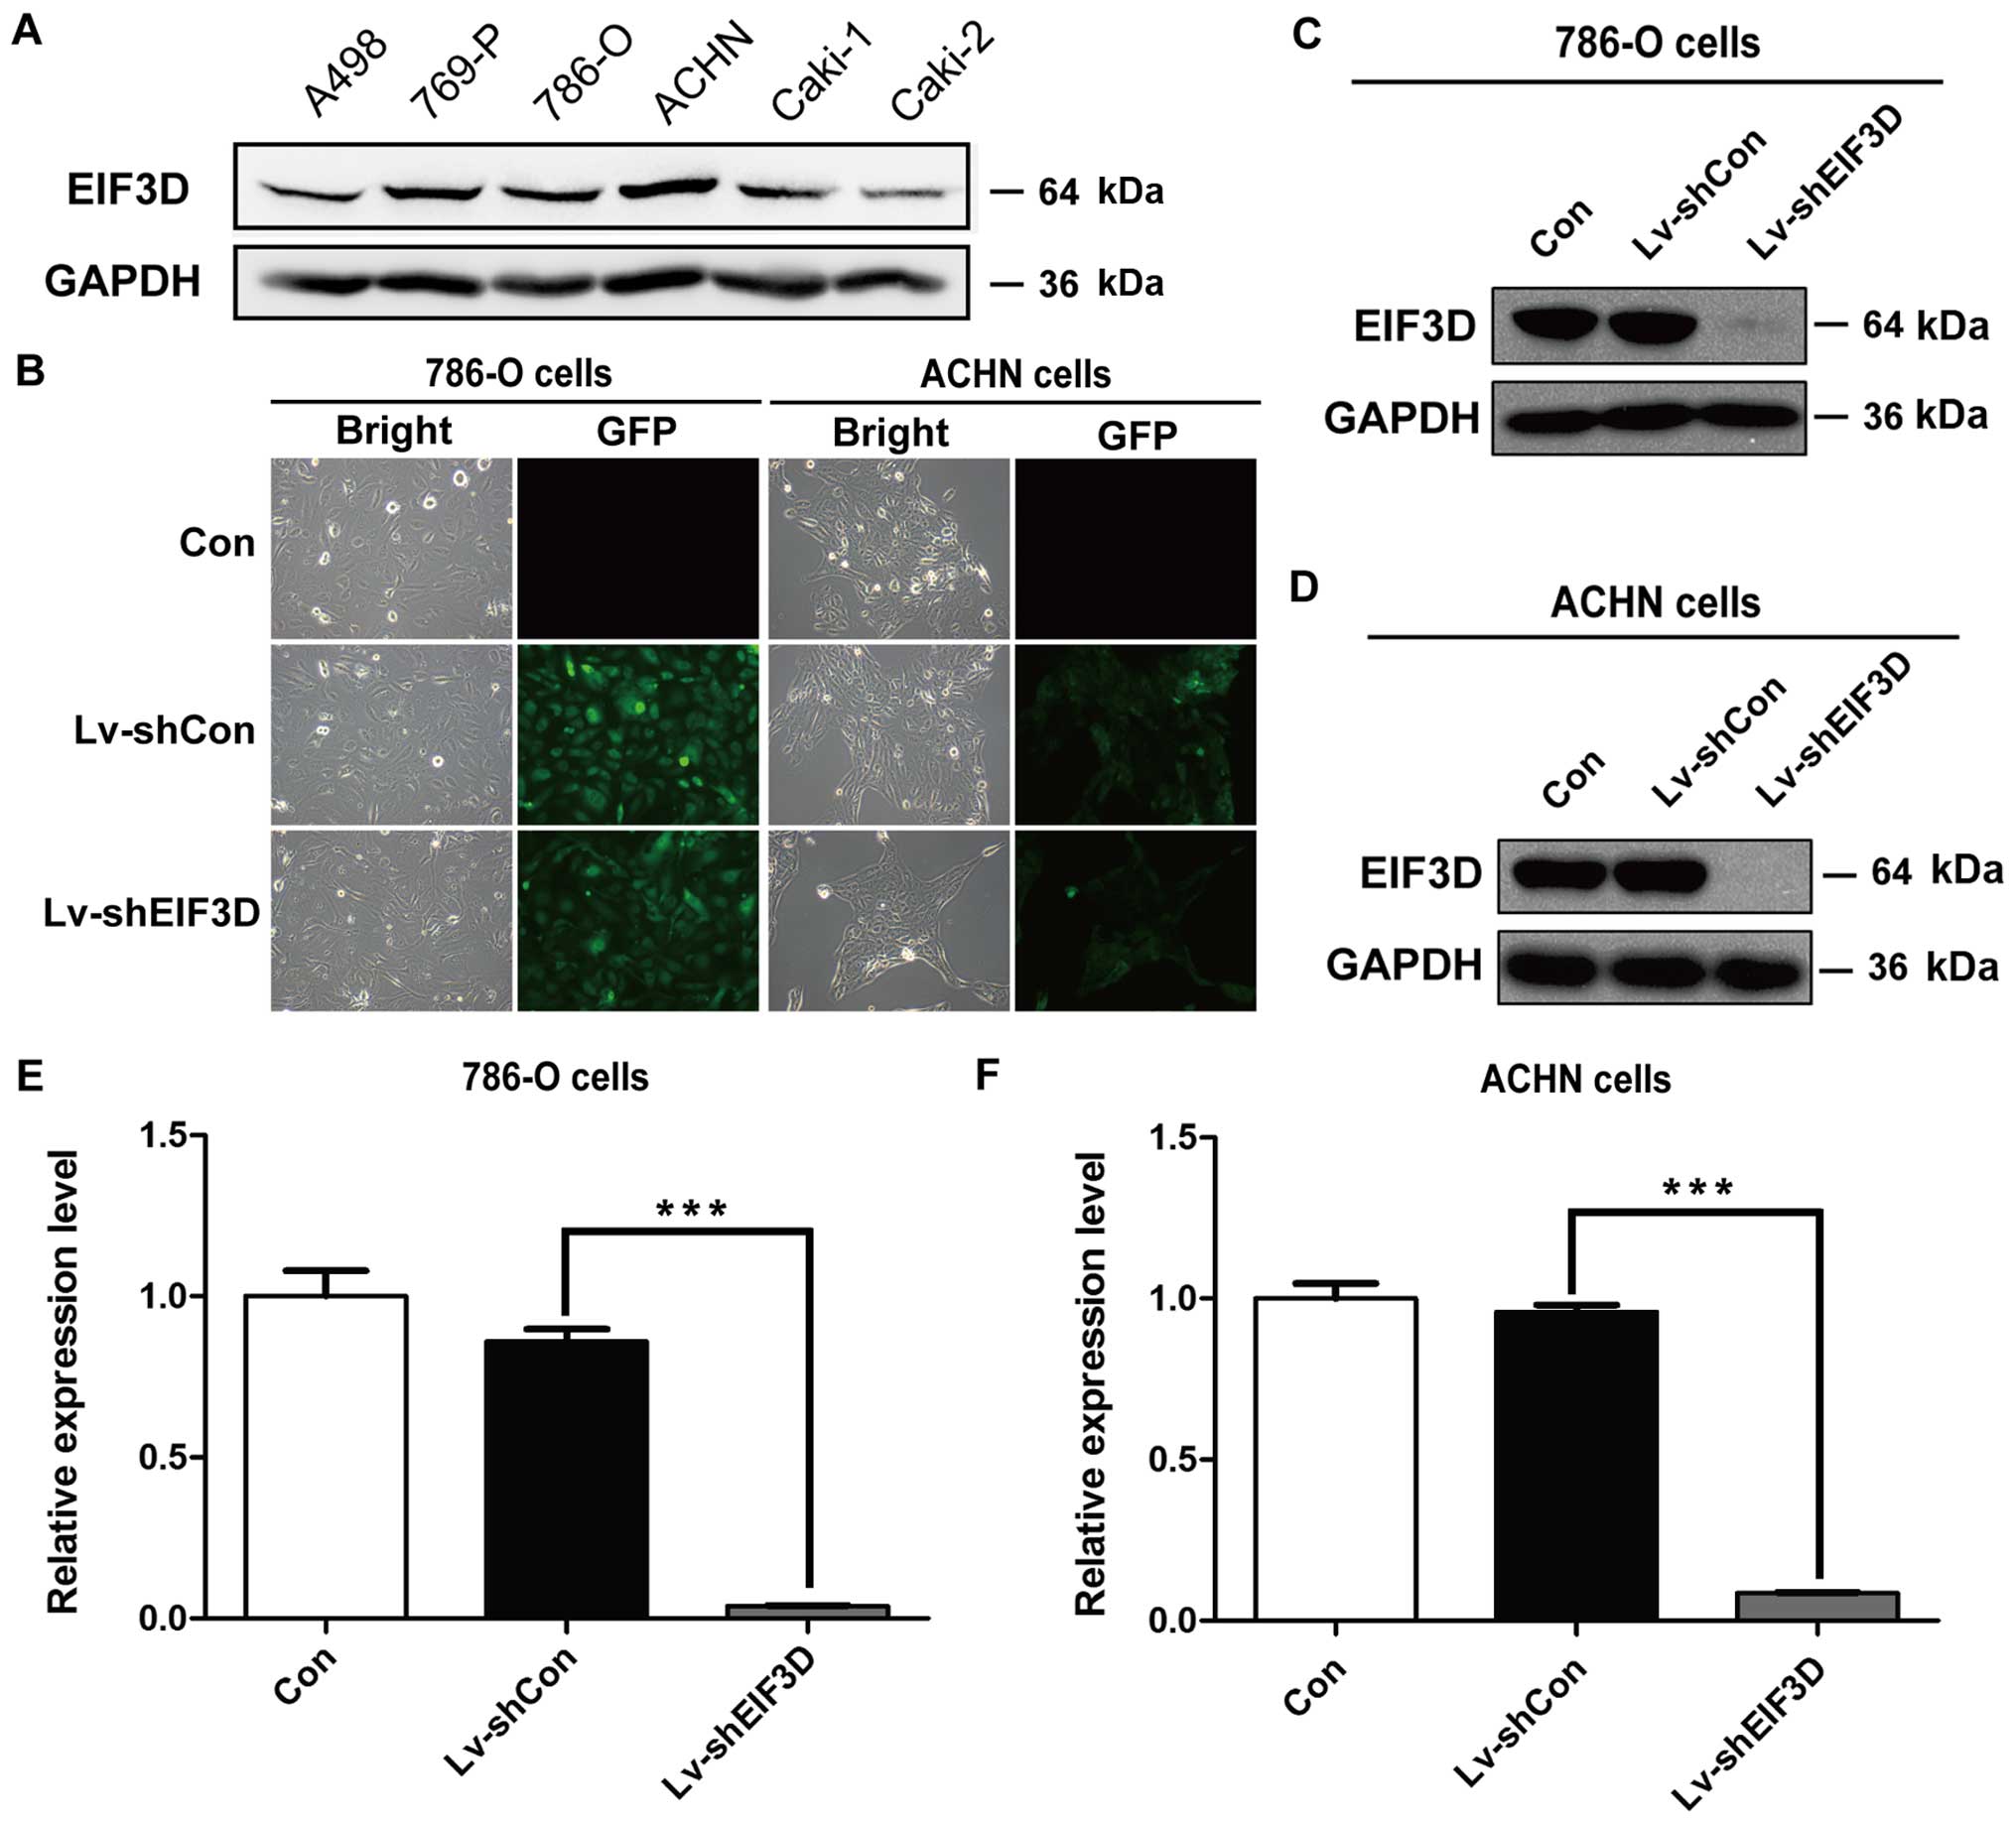
Considering that EIF3D was upregulated in RCC and
correlated to tumor stage, we further explored the cellular
functions of this protein in RCC cell lines. Consistent with the
findings in RCC tissues, the expression of EIF3D protein was
overexpressed in RCC cell lines, including A498, 769-P, 786-O,
ACHN, Caki-1 and Caki-2 (Fig. 2A).
Two RCC cell lines, 786-O and ACHN cell lines, with relatively
higher EIF3D expression were selected for loss-of-function study.
Lentivirus-introduced shRNA was used to silence EIF3D expression in
786-O and ACHN cells. As shown in Fig.
2B, most of the cells presented GFP-positive signals of >90%
under fluorescence microscopy, indicating successful infection
efficiency. To further determine EIF3D silencing efficiency, the
level of EIF3D protein and mRNA was analyzed through RT-PCR and
western blotting in the 786-O and ACHN cells after EIF3D knockdown.
As shown in Fig. 2C and D, EIF3D
protein expression in Lv-shEIF3D group of the two cell lines was
significantly suppressed as compared with those in Lv-shCon group.
In addition, the mRNA levels of EIF3D were significantly reduced by
95.5% in 786-O cells and 91.1% in ACHN cells after EIF3D knockdown
(Fig. 2E and F, P<0.001),
suggesting that shRNA targeting EIF3D successfully inhibited gene
expression.
Knockdown of EIF3D impaired RCC cell
proliferation and colony formation ability
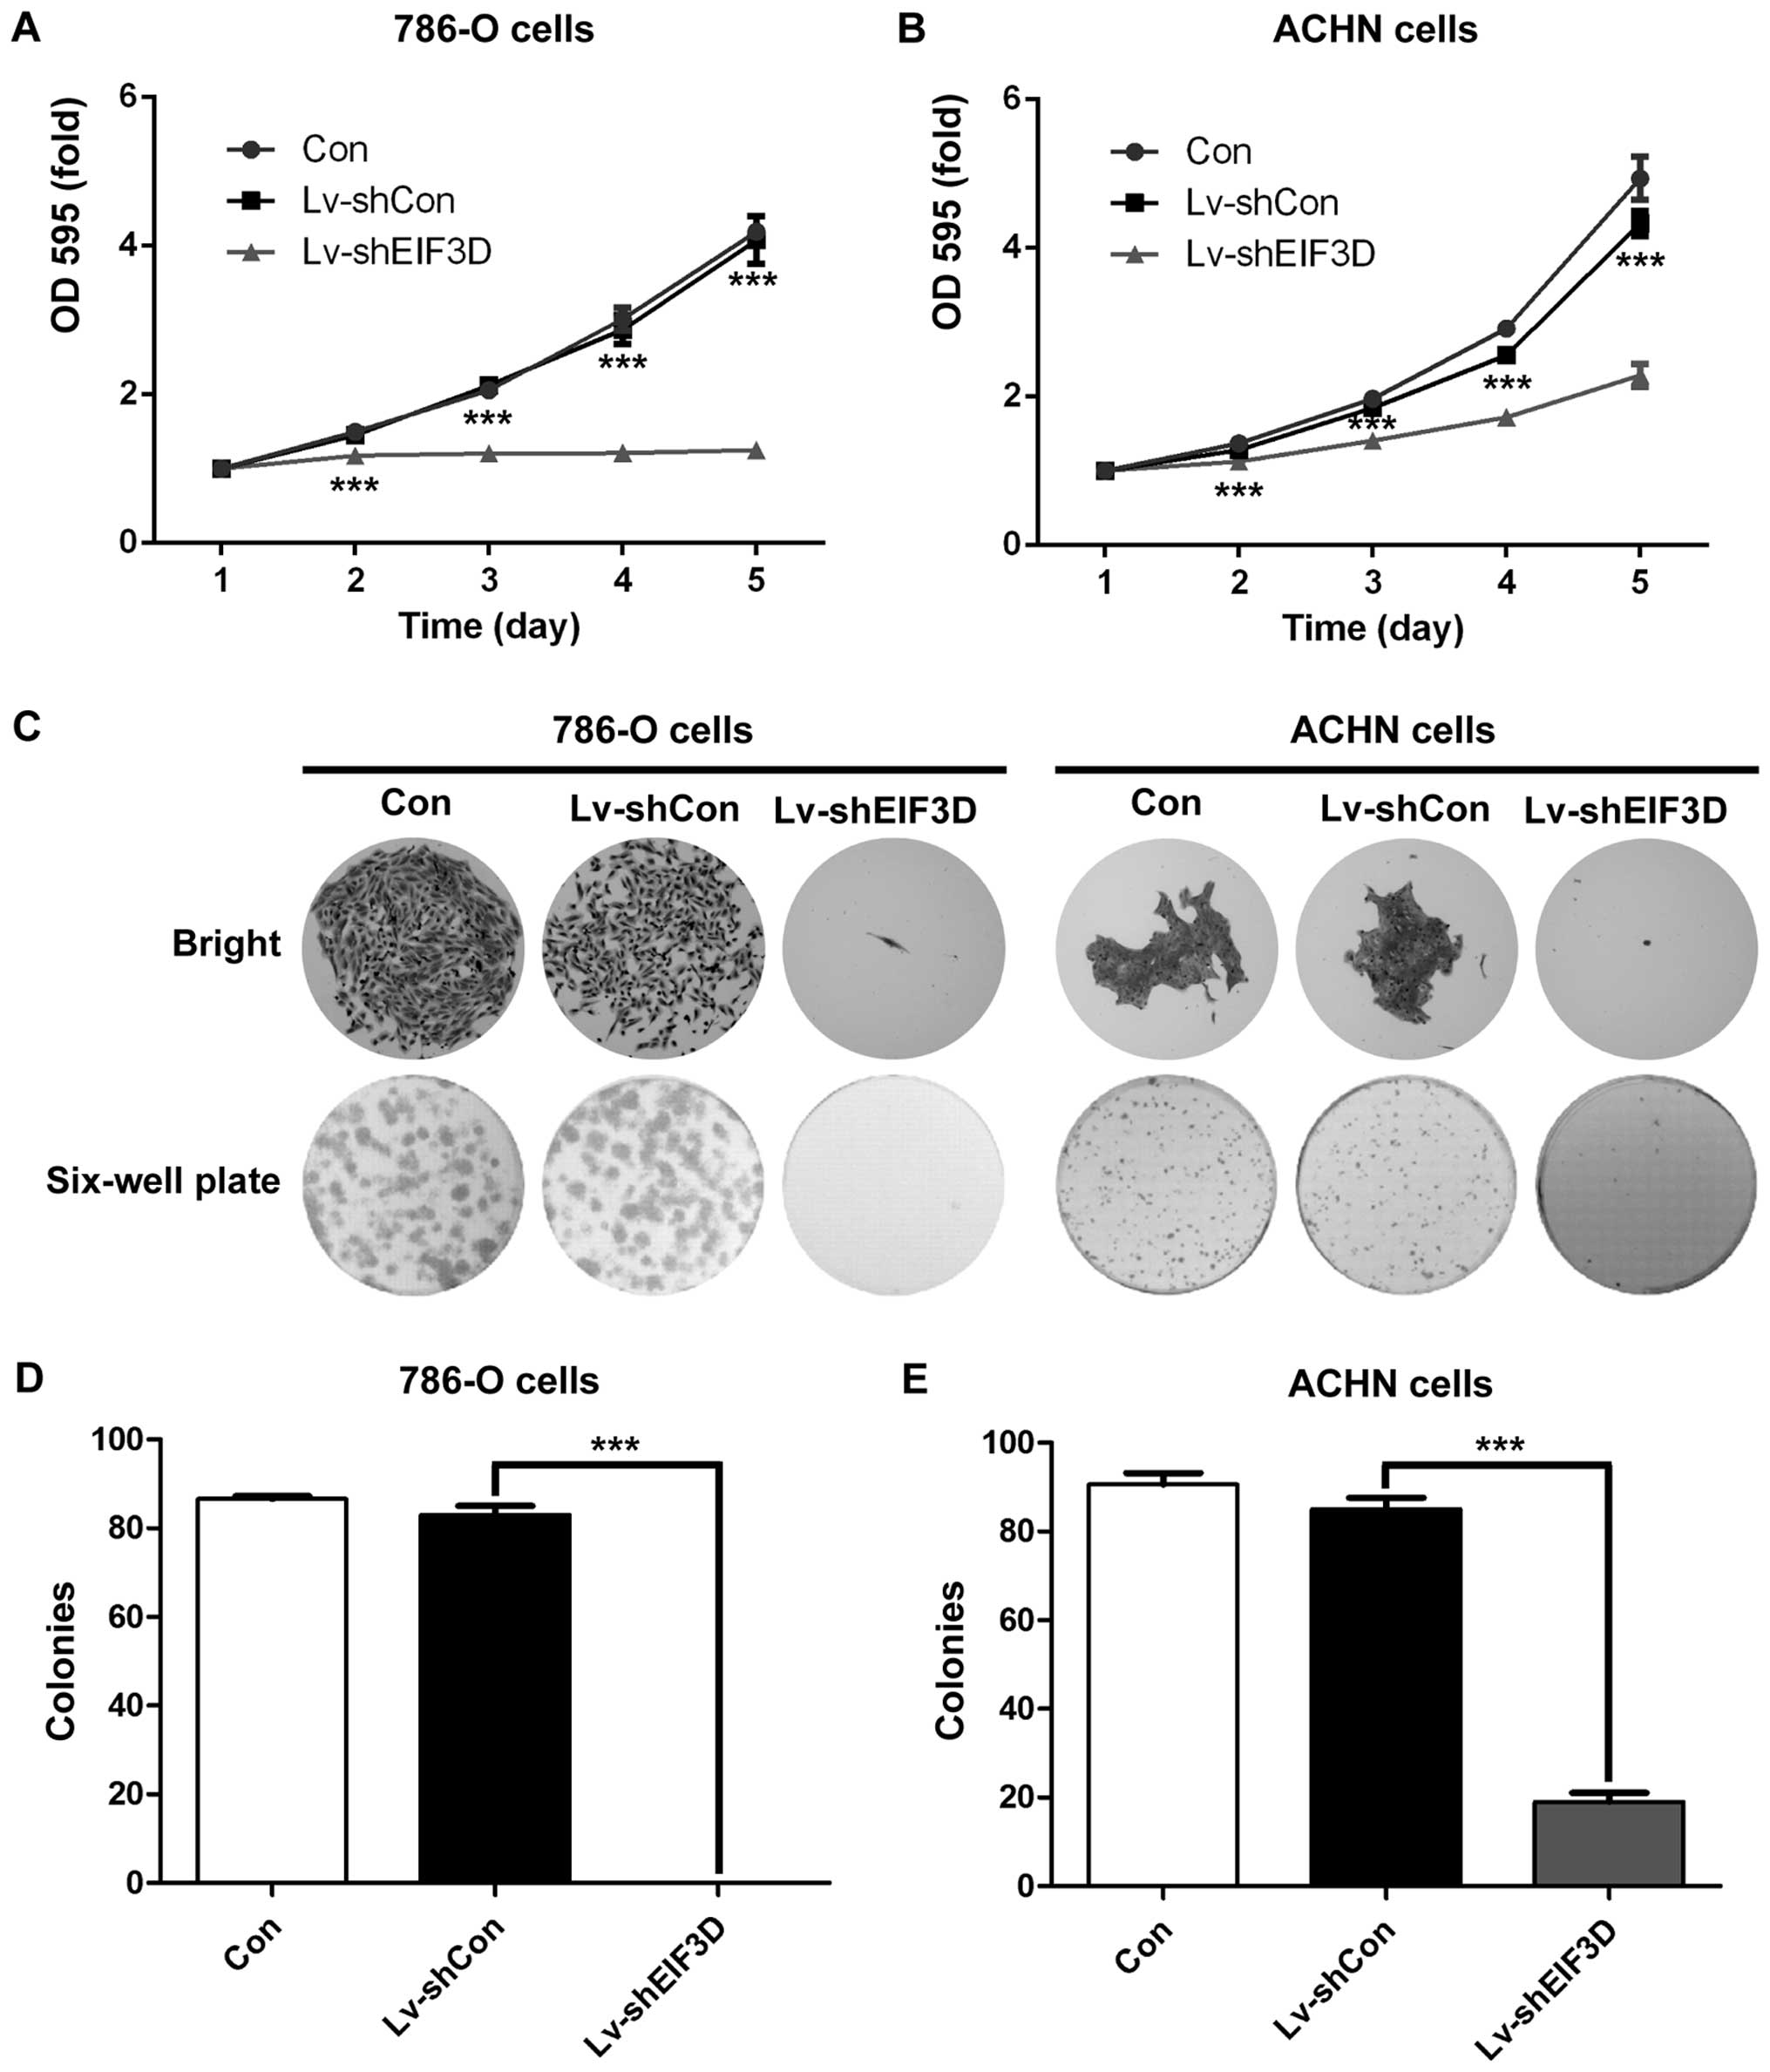
To investigate the function of EIF3D in RCC cells,
we examined whether reduction of EIF3D expression has an effect on
cell proliferation and colony formation ability. MTT assay was used
to measure cell viability in 786-O and ACHN cells after knockdown
of EIF3D. As shown in Fig. 3A and
B, the growth curves of 786-O and ACHN cells remarkably
declined upon EIF3D knockdown. The number of viable cells was
greatly reduced in Lv-shEIF3D groups than that in Lv-shCon groups
in 786-O and ACHN cells (P<0.001). Moreover, cell colony
formation assay was performed to gain additional insight into the
effect of EIF3D on malignant proliferation of RCC cells. There was
a significant difference in the colony sizes between Lv-shEIF3D
group and Lv-shCon group (Fig.
3C), especially in 786-O cell line. The number of colonies of
the two RCC cell lines was decreased significantly in Lv-shEIF3D
group as compared with that in Lv-shCon group (786-O cells: 0.0±0.0
vs. 83.0±2.0, P=0.001; ACHN cells: 19.0±2.0 vs. 85.0±2.6,
P<0.001) (Fig. 3C and D). These
results indicated that EIF3D plays a vital role in the malignant
growth of RCC cells.
Silencing of EIF3D induces G2/M phase
arrest in RCC cells
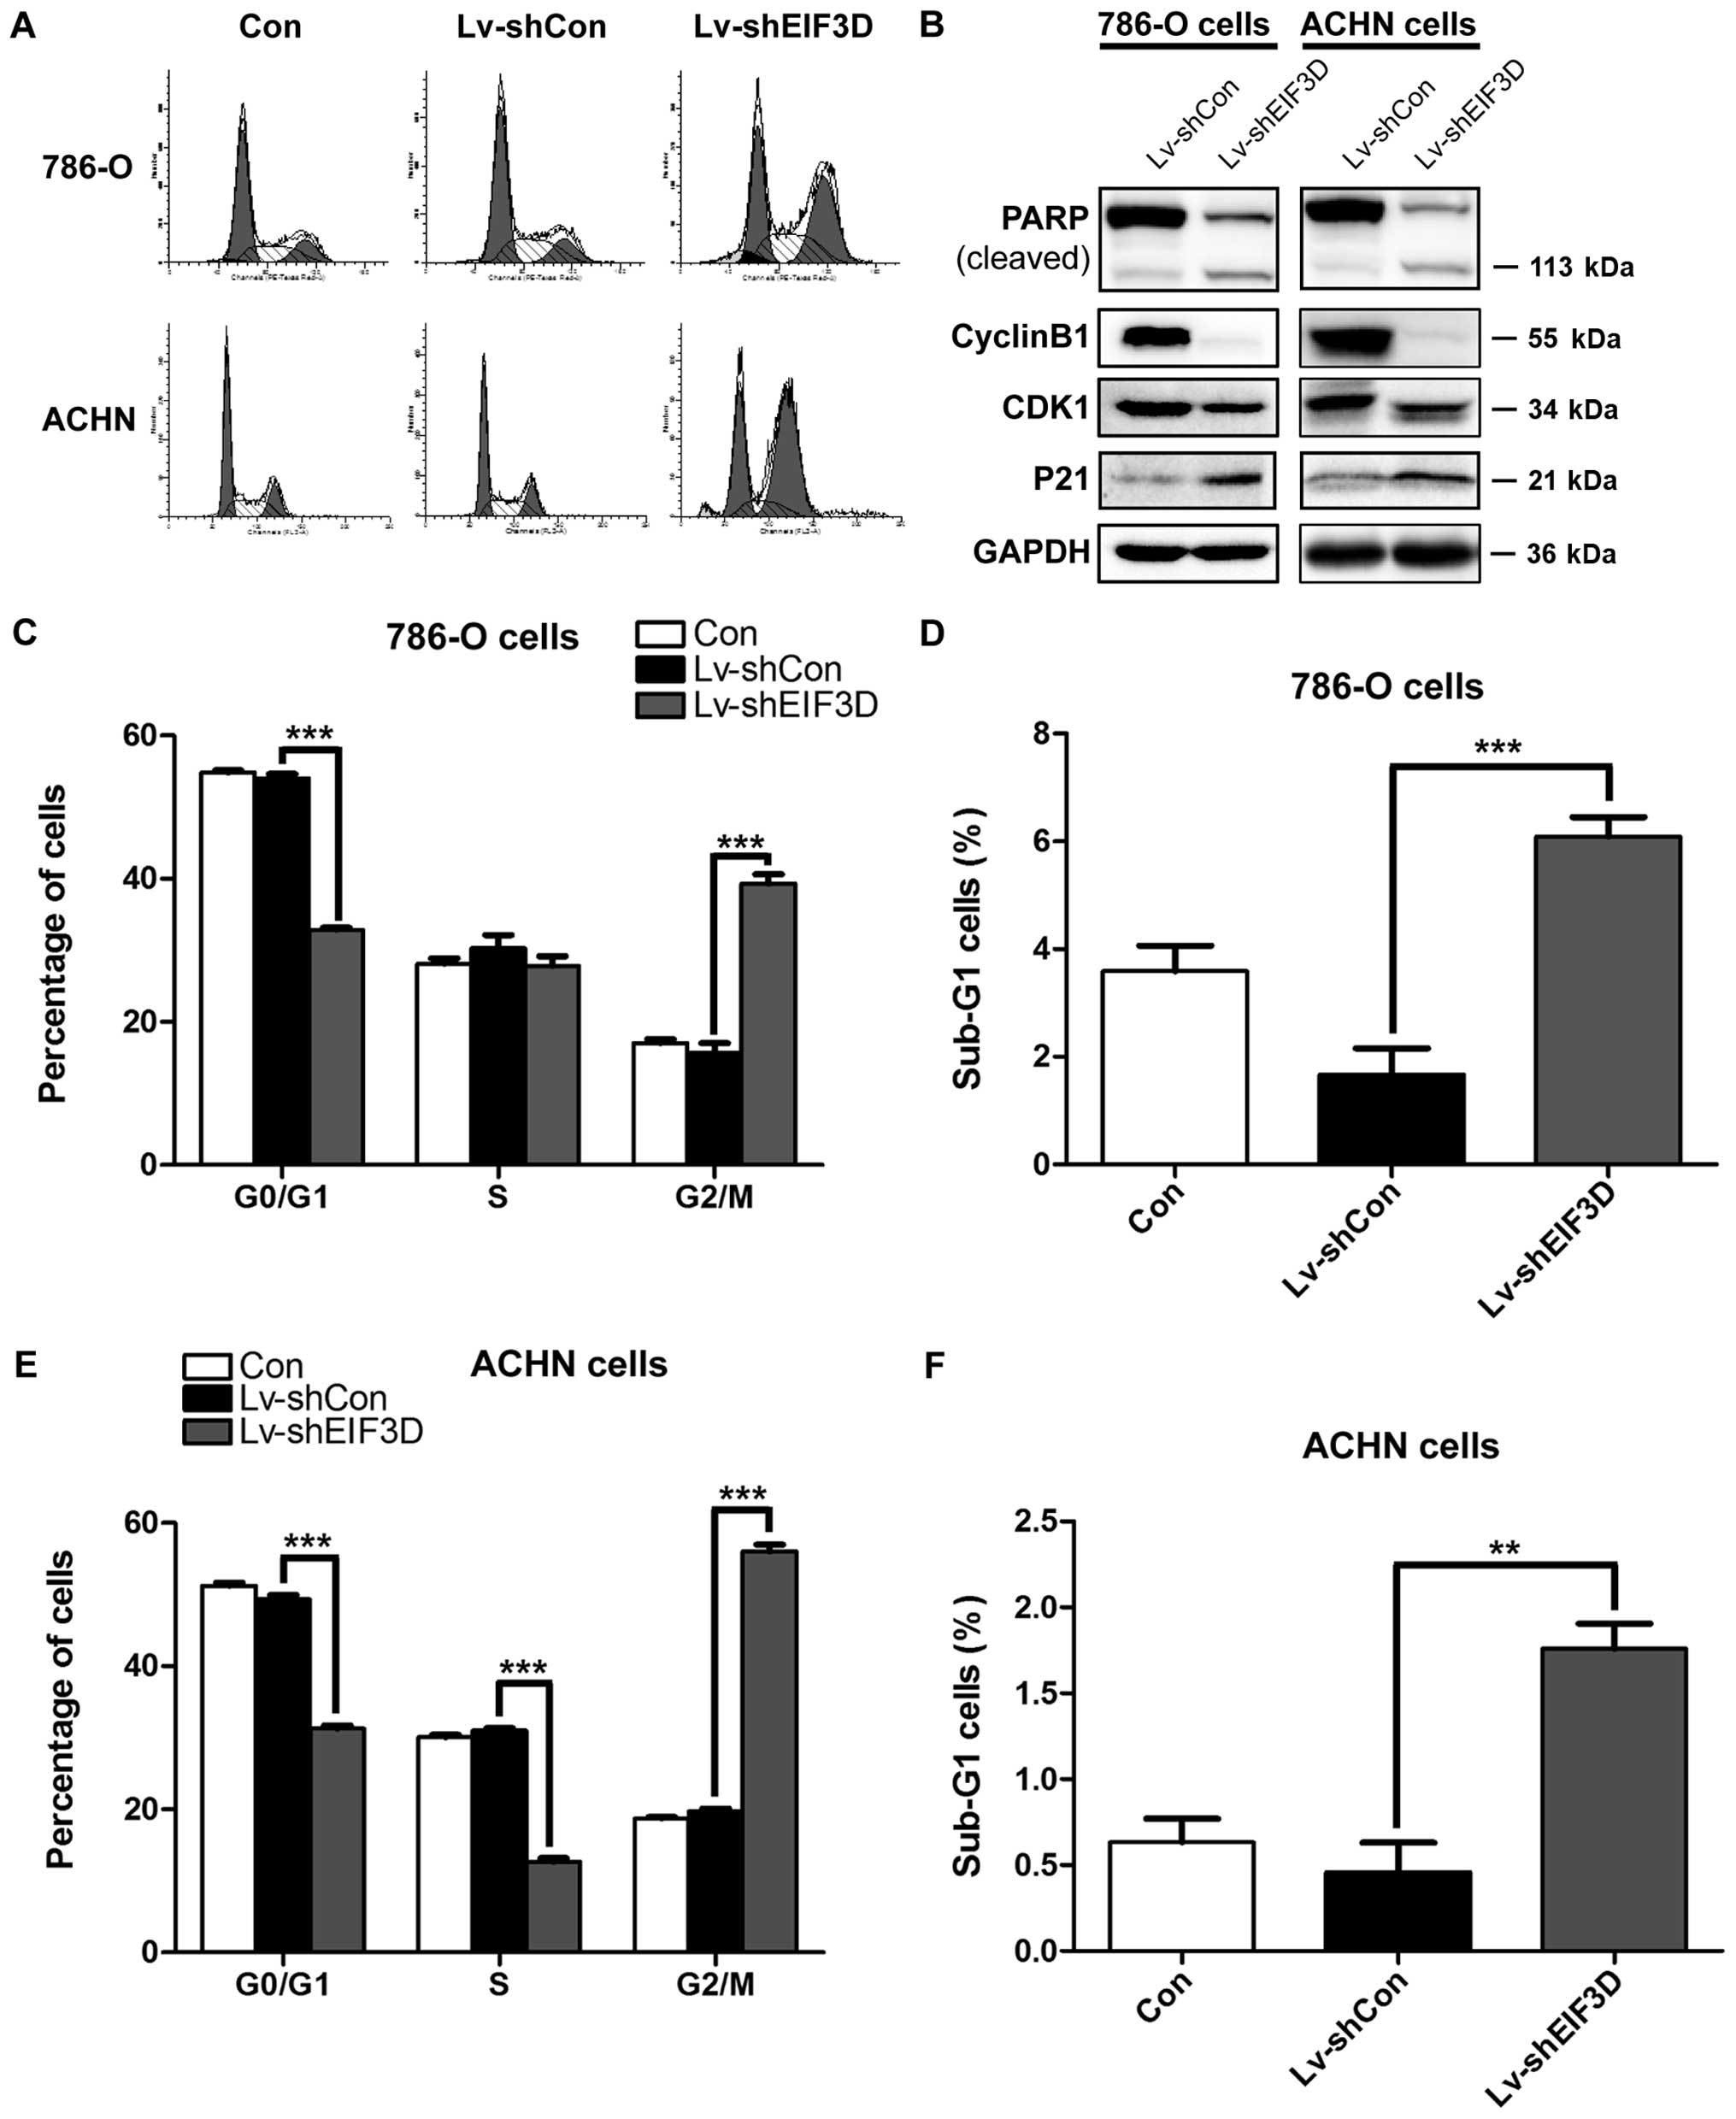
To explore the potential mechanism underlying the
suppressive effect of EIF3D silencing on tumor cell proliferation,
cell cycle distribution was evaluated using flow cytometry. As
shown in Fig. 4A and C and E,
knockdown of EIF3D in 786-O and ACHN cells significantly increased
the percentage of cells in G2/M phase (786-O cells: 39.33±1.27 vs.
15.74±1.28%, P<0.001; ACHN cells: 56.04±0.92 vs. 19.70%±0.43%,
P<0.001) and decreased the percentage of cells in G0/G1 phase
(786-O cells: 32.85±0.34 vs. 54.00±0.61%, P<0.001; ACHN cells:
31.27±0.48 vs. 49.31±0.64%, P<0.001). Moreover, the number of
S-phase ACHN cells treated with Lv-shEIF3D was also markedly
decreased (12.69±0.48 vs. 30.99±0.35%, P<0.001). Besides, more
cells were accumulated in sub-G1 phase in 786-O and ACHN cells
after EIF3D knockdown as compared with the control (786-O cells:
6.09±0.36 vs. 1.67±0.48%, P=0.001; ACHN cells: 1.76±0.25 vs.
0.46±0.30%, P=0.01) (Fig. 4D and
F), suggesting that knockdown of EIF3D might induce cell
apoptosis.
To further understand the mechanism underlying G2/M
phase arrest, the expression alterations of cell cycle regulators
were detected in 786-O and ACHN cells after EIF3D knockdown using
western blot analysis. As shown in Fig. 4B, the expression levels of CDK1 and
Cyclin B1, associated with G2-M transition, were decreased in
Lv-shEIF3D groups, whereas the expression levels of p21 and RARP
cleavage were increased in 786-O and ACHN cells following
Lv-shEIF3D transduction.
Meta-analysis of EIF3D expression in RCC
vs. normal kidney tissues using ONCOMINE microarray database
To further confirm our findings that EIF3D is
overexpressed in RCC, public microarray datasets from ONCOMINE
database were used to carry out meta-analysis of EIF3D gene
expression. A total of five online microarray datasets containing
mRNA level test of cancer vs. normal tissue were included in our
study, which contains 136 CCRCC and 58 normal kidney tissues. As
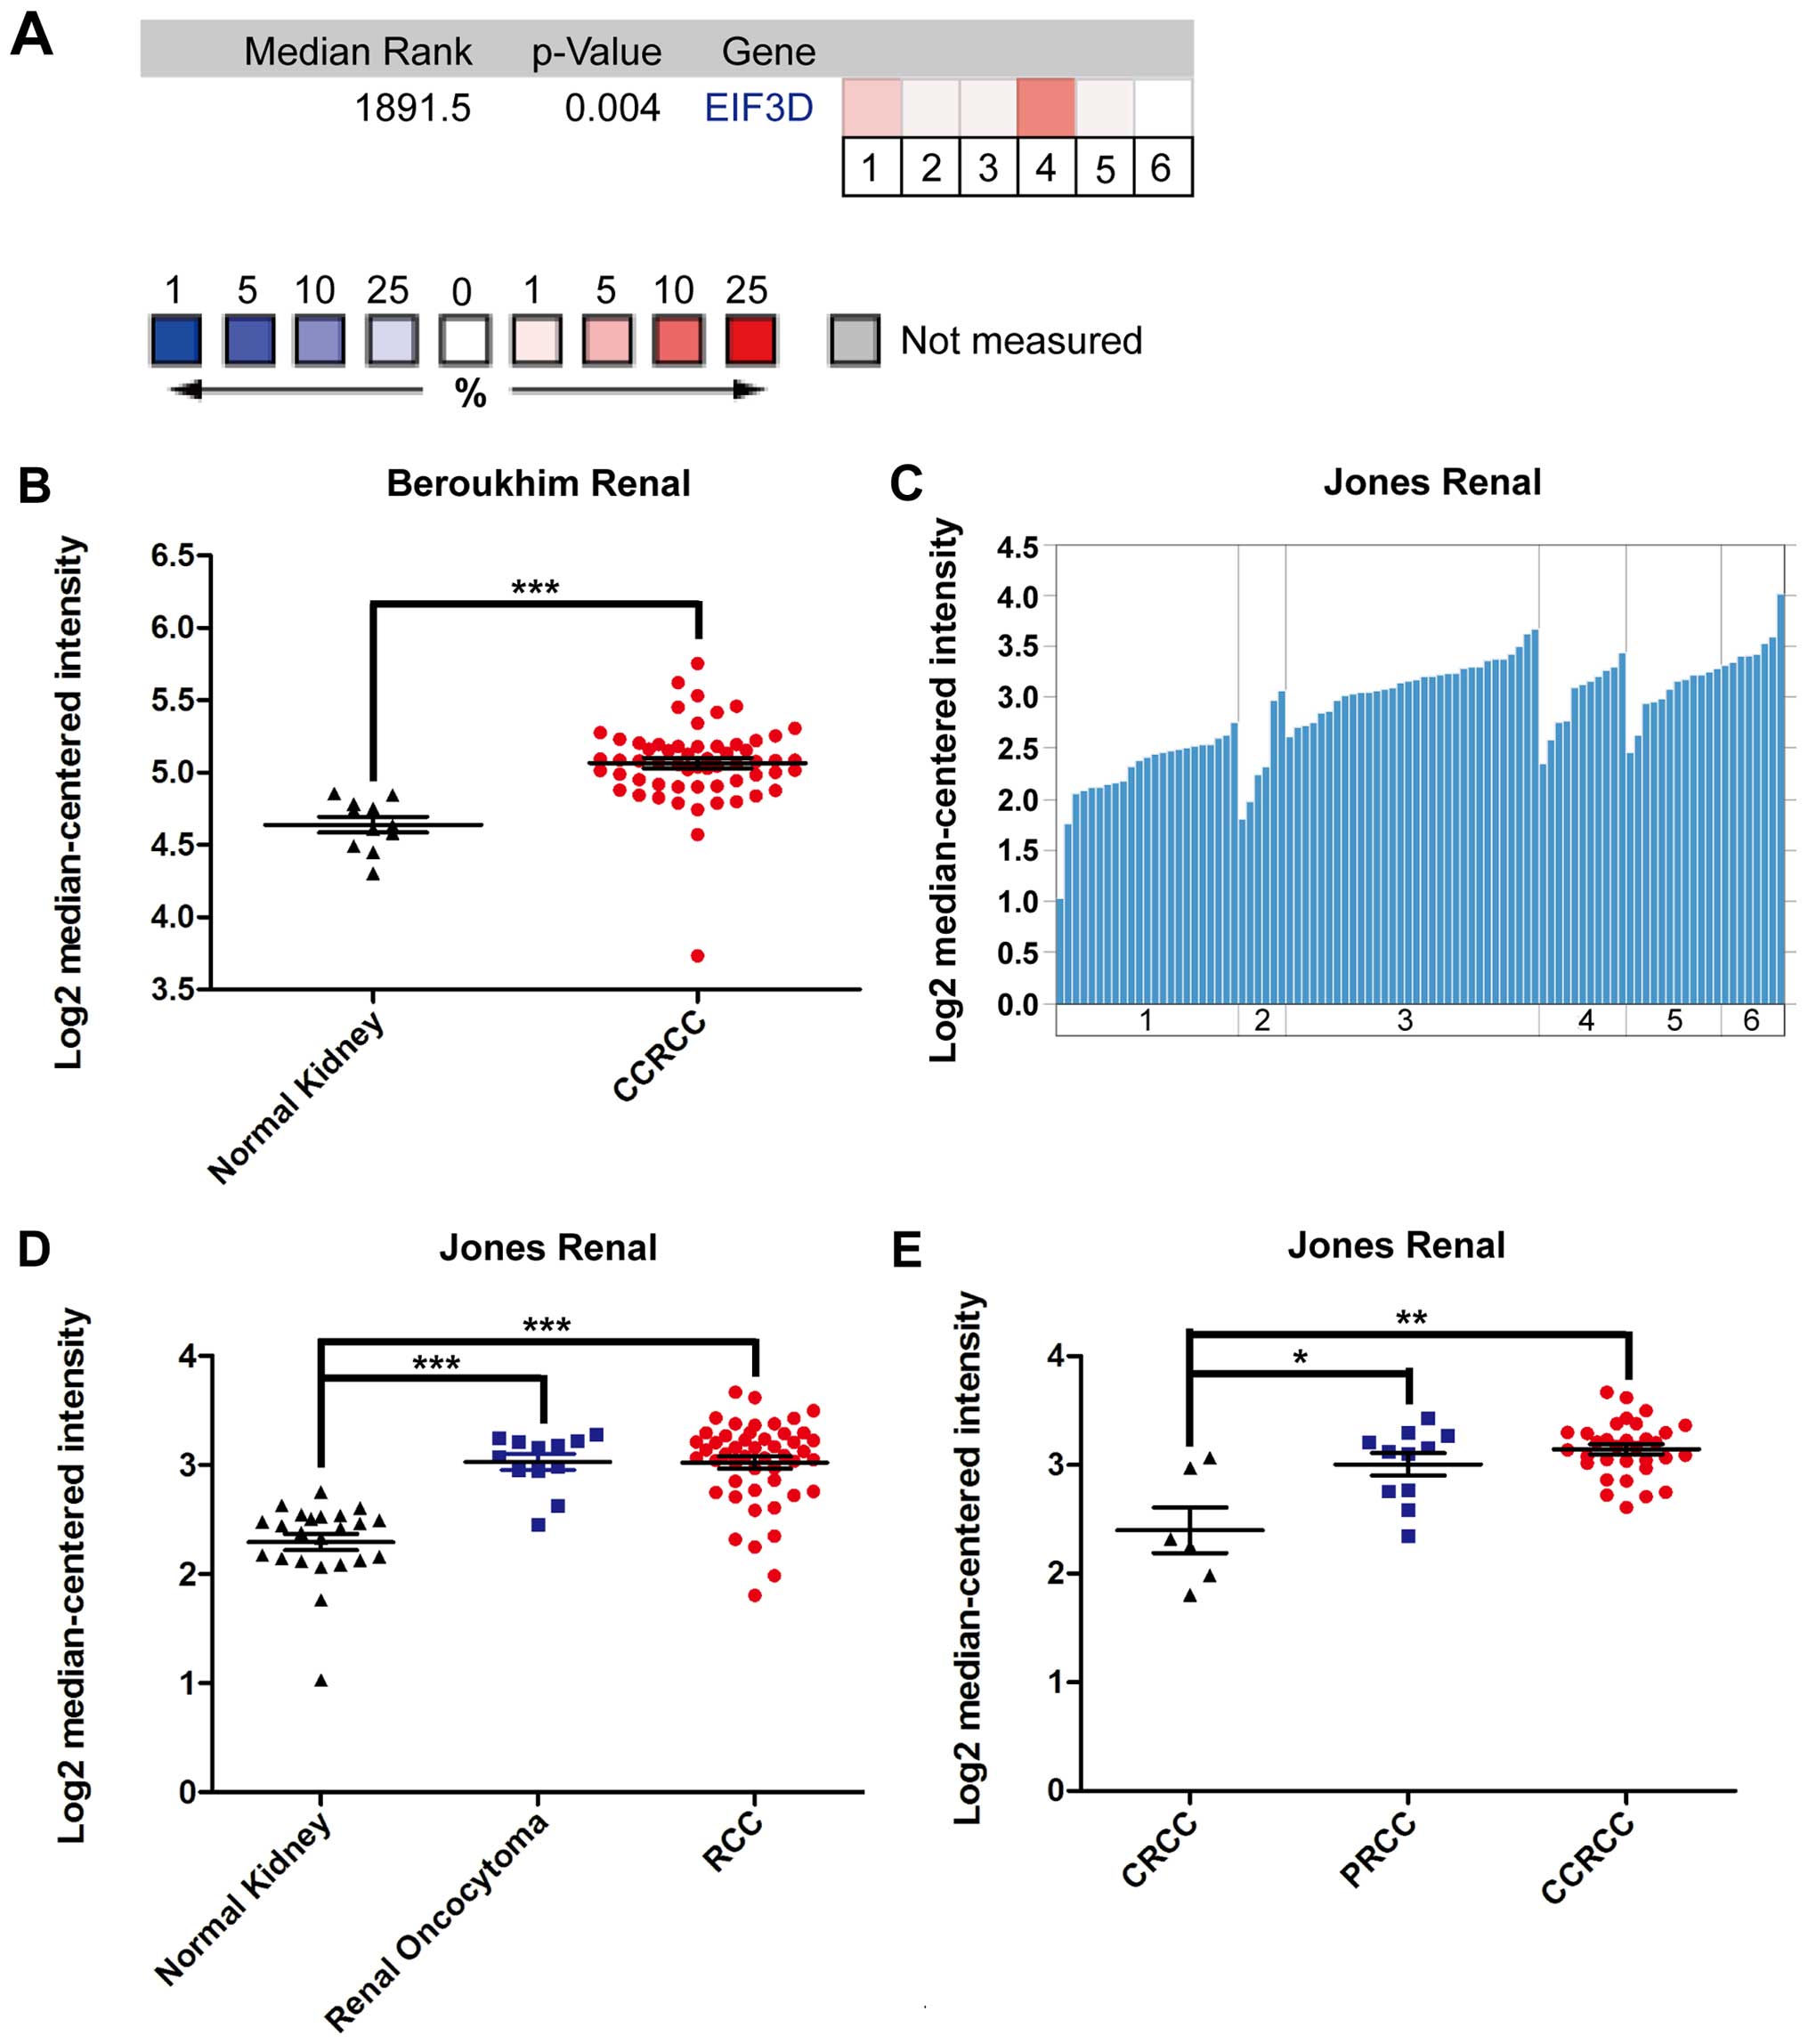
shown in Table III, EIF3D was
significantly overexpressed in the CCRCC samples in Jones,
Beroukhim, Lenburg and Cumz datasets, and slightly upregulated
CCRCC samples in Yusenko datasets. Meta-analysis of the five
datasets collectively revealed that increased EIF3D mRNA expression
was associated with CCRCC as compared with the normal kidney tissue
(gene median rank: 1891.5, P=0.004) (Fig. 5A). In the Beroukhim renal
microarray dataset, EIF3D mRNA expression in CCRCC containing
hereditary CCRCC and non-hereditary CCRCC exhibited a significant
difference as compared with the normal tissue (P<0.001)
(Fig. 5B). To study whether EIF3D
is differentially expressed in distinct RCC subtypes, Jones renal
dataset (Fig. 5C) was further
analyzed. It was found that RCC tended to have higher EIF3D
expression than renal oncocytoma, a benign renal tumor (P=0.187)
(Fig. 5D). Among RCCs, CCRCC had
significantly higher EIF3D expression than CRCC and PRCC (Fig. 5E, CCRCC vs. PRCC: P=0.01; CRCC vs.
PRCC: P=0.05; CCRC vs. CRCC: P=0.157).
| Table IIIEIF3D expressions in ONCOMINE
microarray datasets. |
Table III
EIF3D expressions in ONCOMINE
microarray datasets.
| Dataset | Subtype | N
(cancer/normal) | P-valuea (cancer/normal) | Fold change
(cancer/normal) | % Gene ranking | Database
references |
|---|
| Jones | CCRCC | 32/23 | 5.14E-12 | 1.824 | 572 | Clin Cancer Res
2005/08/15 |
| PRCC | 11/23 | 7.32E-06 | 1.637 | 1,552 | |
| CRCC | 6/23 | 0.326 | 1.076 | 7,495 | |
| Beroukhim | Hereditary
CCRCC | 32/11 | 3.08E-07 | 1.393 | 1,059 | Cancer Res
2009/06/01 |
| Non-hereditary
CCRCC | 27/11 | 1.32E-04 | 1.286 | 1,731 | |
| Lenburg | CCRCC | 9/9 | 0.007 | 1.323 | 2,052 | BMC Cancer
2003/11/27 |
| Cumz | CCRCC | 10/10 | 0.004 | 1.321 | 2,139 | Clin Cancer Res
2007/08/15 |
| Yusenko | CCRCC | 26/5 | 0.105 | 1.339 | 7,645 | BMC Cancer
2009/05/18 |
| PRCC | 19/5 | 0.127 | 1.236 | 8,673 | |
| CRCC | 4/5 | 0.127 | 1.542 | 8,039 | |
EIF3D is positively correlated with PCNA,
Cyclin B1 and CDK1
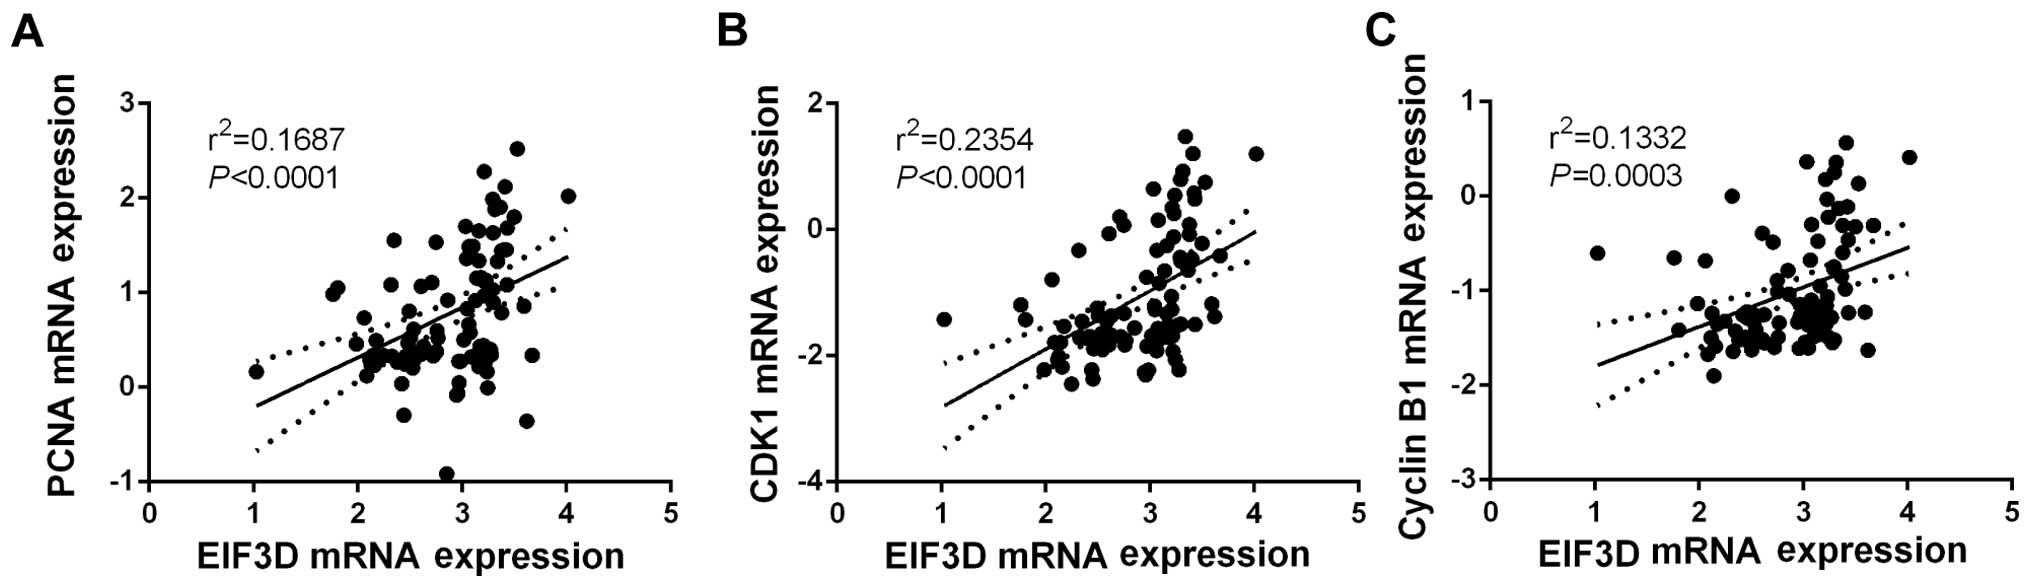
We also investigated the correlation of EIF3D and
potential downstream signaling molecules using ONCOMINE datasets.
As depicted in Fig. 6, EIF3D was
positively correlated with PCNA, a proliferative biomarker
(r2=0.1687, P<0.0001), suggesting a correlation of
EIF3D with the malignant growth of RCC. In addition, EIF3D
expression was also positively correlated with Cyclin B1
(r2=0.2354, P<0.0001) and CDK1 (r2=0.1332,
P=0.0003) expressions in RCC, providing evidence at the in
vivo level that EIF3D may regulate cell cycle progression in
RCC.
Discussion
Gene transcription and mRNA translation are two
indispensable processes of eukaryotic gene expression. When
eukaryotic mRNA translation is out of control, the process of gene
expression will be deregulated, resulting in uncontrolled cell
growth or even leading to tumor formation (14). Hence, targeting abnormal
translation factors in human cancers may be a potential targeted
treatment strategy. EIF3D, as a subunit of EIF3 complex, has been
reported to participate in nearly all stages of translation and
associated with various cancers. However, its clinical significance
and cellular functions in RCC has not been reported yet. Here, we
observed that EIF3D was overexpressed in RCC tissues, especially in
CCRCC specimens, and that EIF3D expression was positively
correlated with malignant features of RCC. Silencing EIF3D by shRNA
inhibited malignant growth of 786-O and ACHN RCC cell lines, caused
G2/M arrest, and induced apoptosis, through misregulation of cell
cycle regulators. These results suggested that increased EIF3D
expression was associated with malignant transformation of RCC, and
may serve as a biomarker for RCC.
CCRCC is the major histologic subtype of RCC, also
called conventional RCC, accounting for >80% RCC (15). There are no effective therapies for
advanced mCCRCC, except for VEGFR inhibitors with about only 50%
response rate. To identify novel targets and biomarkers for RCC is
of great importance in treating RCC. Here, we demonstrated that
EIF3D protein expression in RCC tissues was significantly higher
than that in the paracarcinoma tissues among 20 clinical specimens.
EIF3D mRNA was obviously elevated in 136 CCRCC tissues compared to
58 normal tissues from ONCOMINE database. EIF3D expression in 102
RCC tissue microarray was positively correlated with tumor size
(P=0.004) and TNM stage (P=0.03). Moreover, EIF3D expression was
significantly increased in CCRCC with a higher malignancy compared
with CRCC and PRCC in Jones renal dataset. To further explore the
biological function of EIF3D in CCRCC, shRNA was used to knockdown
the expression of EIF3D in CCRCC cell lines, 786-O and ACHN cells.
Functional analysis indicated that knockdown of EIF3D observably
inhibited the capacity of cell proliferation and colony formation,
which is in agreement with the effect of EIF3D-silencing observed
in prostate cancer, glioma, melanoma, colon cancer and NSCLC cells
(9–13). These results implied that EIF3D is
a potential proto-oncogene, participating in malignant
transformation of RCC.
We found that EIF3D knockdown induced G2/M phase
arrest. Consistent with our results, G2/M phase arrest induced by
EIF3D knockdown has also been observed in different types of
malignant cells (10,11,13,14).
However, the potential molecular mechanisms of EIF3D affecting the
cell cycle distribution has not yet been reported. G2/M checkpoint
in eukaryotic cells is an important cell cycle DNA damage
checkpoint, which play an important role in regulating cell cycle
progression (16). G2/M arrest is
considered to prevent eukaryotic cells from entering the process of
mitosis and could be an effective antitumor strategy (17,18).
In eukaryotes, cell cycle is regulated by cyclins, cyclin-dependent
kinases (CDKs) and cyclin-dependent kinase inhibitors (CDKIs)
(19). Cell cycle G2 phase into M
phase for mitosis was reported to be regulated by activation of
Cyclin B1/Cdk1 complex (19,20).
Cyclin-dependent kinase inhibitors (CDKIs) that bind to cyclin/Cdk
complexes regulated cell cycle by suppressing the kinase activity
of cyclin/Cdk complexes (21).
p21, a downstream target of p53 and an important CDKI that induces
G2/M phase arrest, was reported to work with proliferating cell
nuclear antigen (PCNA)/Cdk complexes to regulate DNA repair
(22–24). Our results showed that EIF3D
knockdown increased the protein expression of p21 and decreased the
protein expression of Cyclin B1 and CDK1, indicating that
EIF3D-silencing arrested cell cycle at G2/M phase in CCRCC cells.
Furthermore, gene correlation analysis using ONCOMINE microarray
database also demonstrated that EIF3D mRNA expression was
positively association with the mRNA expression of Cyclin B1, CDK1
and PCNA. These results have been demonstrated by Wu et al,
who showed that G2/M arrest was attributed to the downregulation of
Cyclin B1 and CDK1 and upregulation of p21 (25).
Promoting cell apoptosis is another important
mechanism underlying the inhibitory effect of antitumor therapy on
the growth of tumor cells (26).
Our study demonstrated that silencing of EIF3D markedly induced
more cells accumulated in sub-G1 phase in CCRCC cells, suggesting
that the percentage of apoptosis cells increased after knockdown of
EIF3D. PARP is a vital protein that plays an important role in DNA
repair and programmed cell death (27). Once the PARP has been cut by the
cleavage of caspases, apoptosis will be induced (28). Western blotting in this study
showed that cleaved PARP was upregulated in Lv-shEIF3D group as
compared with Lv-shCON group. Recently, it was reported that
5-Nitro-5′-hydroxy-indirubin-3′-oxime (AGM130) induced cell
apoptosis through upregulating the level of cleaved PARP to inhibit
the growth of A549 NSCLC cells (29). In brief, silencing of EIF3D
expression in CCRCC cells increased the production of cleaved PARP
to suppress cell growth.
In conclusion, this study provides insights into the
clinical significance of EIF3D in RCC, demonstrated that knockdown
of EIF3D in RCC cells significantly induced cell growth suppression
and cell cycle arrest through down regulation of Cyclin/CDK1
signaling. These results provide reasonable evidence that EIF3D may
function as a potential oncogenic molecule that plays a pivotal
role in the occurrence and progression of RCC.
Acknowledgements
This study was supported by grants from the National
Natural Science Foundation of China for Youths (nos. 81202020 and
81001136); the National Natural Science Foundation of China (no.
81170637); Shanghai Committee of Science and Technology General
Program for Medicine (no. 11JC1402302); the Military Fund for
Health Care (CWS13BJ09); and the Key Project of Science and
Innovation Foundation of Shanghai Ministry of Education
(14zz084).
References
|
1
|
Siegel R, Naishadham D and Jemal A: Cancer
statistics, 2012. CA Cancer J Clin. 62:10–29. 2012. View Article : Google Scholar : PubMed/NCBI
|
|
2
|
Hes O: International Society of Urological
Pathology (ISUP) Vancouver Classification of Renal Neoplasia 2012.
Cesk Patol. 50:137–141. 2014.(In Czech).
|
|
3
|
Jiang Z, Chu PG, Woda BA, Liu Q, Balaji
KC, Rock KL and Wu CL: Combination of quantitative IMP3 and tumor
stage: A new system to predict metastasis for patients with
localized renal cell carcinomas. Clin Cancer Res. 14:5579–5584.
2008. View Article : Google Scholar : PubMed/NCBI
|
|
4
|
Zhao J, Huang X, Sun F, Ma R, Wang H, Shao
K, Zhu Y, Zhou W, Xu Z and Shen Z: Prognostic factors for overall
survival with targeted therapy in Chinese patients with metastatic
renal cell carcinoma. Can Urol Assoc J. 8:E821–E827. 2014.
View Article : Google Scholar : PubMed/NCBI
|
|
5
|
Sciarra A, Gentile V, Salciccia S,
Alfarone A and Di Silverio F: New anti-angiogenic targeted therapy
in advanced renal cell carcinoma (RCC): Current status and future
prospects. Rev Recent Clin Trials. 3:97–103. 2008. View Article : Google Scholar : PubMed/NCBI
|
|
6
|
Spilka R, Ernst C, Mehta AK and Haybaeck
J: Eukaryotic translation initiation factors in cancer development
and progression. Cancer Lett. 340:9–21. 2013. View Article : Google Scholar : PubMed/NCBI
|
|
7
|
Zhang Y, Yu JJ, Tian Y, Li ZZ, Zhang CY,
Zhang SF, Cao LQ, Zhang Y, Qian CY, Zhang W, et al: eIF3a improve
cisplatin sensitivity in ovarian cancer by regulating XPC and
p27Kip1 translation. Oncotarget. 6:25441–25451. 2015. View Article : Google Scholar : PubMed/NCBI
|
|
8
|
Li Z, Lin S, Jiang T, Wang J, Lu H, Tang
H, Teng M and Fan J: Overexpression of eIF3e is correlated with
colon tumor development and poor prognosis. Int J Clin Exp Pathol.
7:6462–6474. 2014.PubMed/NCBI
|
|
9
|
Lin Z, Xiong L and Lin Q: Knockdown of
eIF3d inhibits cell proliferation through G2/M phase arrest in
non-small cell lung cancer. Med Oncol. 32:1832015. View Article : Google Scholar : PubMed/NCBI
|
|
10
|
Yu X, Zheng B and Chai R:
Lentivirus-mediated knockdown of eukaryotic translation initiation
factor 3 subunit D inhibits proliferation of HCT116 colon cancer
cells. Biosci Rep. 34:e001612014. View Article : Google Scholar : PubMed/NCBI
|
|
11
|
Ren M, Zhou C, Liang H, Wang X and Xu L:
RNAi-mediated silencing of EIF3D alleviates proliferation and
migration of glioma U251 and U87MG cells. Chem Biol Drug Des.
86:715–722. 2015. View Article : Google Scholar : PubMed/NCBI
|
|
12
|
Gao Y, Teng J, Hong Y, Qu F, Ren J, Li L,
Pan X, Chen L, Yin L, Xu D, et al: The oncogenic role of EIF3D is
associated with increased cell cycle progression and motility in
prostate cancer. Med Oncol. 32:5182015. View Article : Google Scholar : PubMed/NCBI
|
|
13
|
Li H, Zhou F, Wang H, Lin D, Chen G, Zuo
X, Sun L, Zhang X and Yang S: Knockdown of EIF3D suppresses
proliferation of human melanoma cells through G2/M phase arrest.
Biotechnol Appl Biochem. 62:615–620. 2015. View Article : Google Scholar
|
|
14
|
Silvera D, Arju R, Darvishian F, Levine
PH, Zolfaghari L, Goldberg J, Hochman T, Formenti SC and Schneider
RJ: Essential role for eIF4GI overexpression in the pathogenesis of
inflammatory breast cancer. Nat Cell Biol. 11:903–908. 2009.
View Article : Google Scholar : PubMed/NCBI
|
|
15
|
Dagher J, Dugay F, Rioux-Leclercq N,
Verhoest G, Oger E, Bensalah K, Cabillic F, Jouan F,
Kammerer-Jacquet SF, Fergelot P, et al: Cytoplasmic PAR-3 protein
expression is associated with adverse prognostic factors in clear
cell renal cell carcinoma and independently impacts survival. Hum
Pathol. 45:1639–1646. 2014. View Article : Google Scholar : PubMed/NCBI
|
|
16
|
Cuddihy AR and O'Connell MJ: Cell-cycle
responses to DNA damage in G2. Int Rev Cytol. 222:99–140. 2003.
View Article : Google Scholar
|
|
17
|
Hu X, Zhang Z, Liu T, Song L, Zhu J, Guo
Z, Cai J and Yu R: Polypeptide fraction from Arca subcrenata
induces apoptosis and G2/M phase arrest in HeLa cells via
ROS-mediated MAPKs pathways. Evid Based Complement Alternat Med.
2015:9302492015. View Article : Google Scholar : PubMed/NCBI
|
|
18
|
Su CC: Tanshinone IIA inhibits gastric
carcinoma AGS cells through increasing p-p38, p-JNK and p53 but
reducing p-ERK, CDC2 and cyclin B1 expression. Anticancer Res.
34:7097–7110. 2014.PubMed/NCBI
|
|
19
|
Li JP, Yang YX, Liu QL, Pan ST, He ZX,
Zhang X, Yang T, Chen XW, Wang D, Qiu JX, et al: The
investigational Aurora kinase A inhibitor alisertib (MLN8237)
induces cell cycle G2/M arrest, apoptosis, and autophagy via p38
MAPK and Akt/mTOR signaling pathways in human breast cancer cells.
Drug Des Devel Ther. 9:1627–1652. 2015.PubMed/NCBI
|
|
20
|
Wang J, Wu A, Xu Y, Liu J and Qian X:
M(2)-A induces apoptosis and G(2)-M arrest via inhibiting PI3K/Akt
pathway in HL60 cells. Cancer Lett. 283:193–202. 2009. View Article : Google Scholar : PubMed/NCBI
|
|
21
|
King KL and Cidlowski JA: Cell cycle
regulation and apoptosis. Annu Rev Physiol. 60:601–617. 1998.
View Article : Google Scholar : PubMed/NCBI
|
|
22
|
Boonstra J and Post JA: Molecular events
associated with reactive oxygen species and cell cycle progression
in mammalian cells. Gene. 337:1–13. 2004. View Article : Google Scholar : PubMed/NCBI
|
|
23
|
Michieli P, Chedid M, Lin D, Pierce JH,
Mercer WE and Givol D: Induction of WAF1/CIP1 by a p53-independent
pathway. Cancer Res. 54:3391–3395. 1994.PubMed/NCBI
|
|
24
|
Abbas T and Dutta A: p21 in cancer:
Intricate networks and multiple activities. Nat Rev Cancer.
9:400–414. 2009. View
Article : Google Scholar : PubMed/NCBI
|
|
25
|
Wu CF and Efferth T: Miltirone induces
G2/M cell cycle arrest and apoptosis in CCRF-CEM acute
lymphoblastic leukemia cells. J Nat Prod. 78:1339–1347. 2015.
View Article : Google Scholar : PubMed/NCBI
|
|
26
|
Abaza MS, Orabi KY, Al-Quattan E and
Al-Attiyah RJ: Growth inhibitory and chemo-sensitization effects of
naringenin, a natural flavanone purified from Thymus vulgaris, on
human breast and colorectal cancer. Cancer Cell Int. 15:462015.
View Article : Google Scholar : PubMed/NCBI
|
|
27
|
Piskunova TS, Yurova MN, Ovsyannikov AI,
Semenchenko AV, Zabezhinski MA, Popovich IG, Wang ZQ and Anisimov
VN: Deficiency in poly(ADP-ribose) polymerase-1 (PARP-1)
accelerates aging and spontaneous carcinogenesis in mice. Curr
Gerontol Geriatr Res. 2008:7541902008. View Article : Google Scholar
|
|
28
|
Ghavami S, Hashemi M, Ande SR, Yeganeh B,
Xiao W, Eshraghi M, Bus CJ, Kadkhoda K, Wiechec E, Halayko AJ, et
al: Apoptosis and cancer: Mutations within caspase genes. J Med
Genet. 46:497–510. 2009. View Article : Google Scholar : PubMed/NCBI
|
|
29
|
Ahn MY, Kim TH, Kwon SM, Yoon HE, Kim HS,
Kim JI, Kim YC, Kang KW, Ahn SG and Yoon JH:
5-Nitro-5′-hydroxy-indirubin-3′-oxime (AGM130), an
indirubin-3′-oxime derivative, inhibits tumor growth by inducing
apoptosis against non-small cell lung cancer in vitro and in vivo.
Eur J Pharm Sci. 79:122–131. 2015. View Article : Google Scholar : PubMed/NCBI
|