Introduction
Breast cancer is the most frequently diagnosed
cancer and the leading cause of cancer death worldwide (1). It alone accounts for 25% of all
cancer cases and 15% of all cancer deaths among females (1). However, breast cancer presents as a
heterogeneous disease, not only from clinical and histological
perspectives but also from the view of genetic expression (2). Gene microarray profiling have led to
the re-categorization of invasive breast carcinomas into 5 distinct
subtypes; luminal A, luminal B, normal breast like, human
epithelial growth factor receptor-2 (Her-2) overexpressing, and
basal-like (2,3). Basal-like and Her-2 groups, however,
have more aggressive clinical behavior than the others (4). The basal-like subtype is the least
prevalent and the most aggressive one, but it lacks a target based
therapy since its triple-negative characteristic (5). miRs are small, non-coding RNAs that
negatively regulate gene expression by their interaction with
3′-untranslated region (3′-UTR) of specific target miRs (6), each of which is capable of regulating
hundreds of protein-coding genes (7). miRs are involved in biological and
pathologic processes, including cell differentiation,
proliferation, apoptosis and metabolism (8). Accumulating evidence indicates that
the dysregulation of miRs has been identified in human cancer, but
only a few of these miRs have been functionally documented in
breast cancer (6,9). Some previous studies showed distinct
differences in miR expression patterns and function between breast
cancer cells and NC (10–12).
miR-205 dysregulationg was identified with a series
of tumors in recent studies (13).
miR-205 was downregulated and functioned as a tumor suppressor gene
in breast cancer (14) and
prostate cancer (15), miR-205 was
an esophageal squamous cell carcinoma-specific miR that exerts
tumor-suppressive activities with epithelial mesenchymal transition
inhibition by targeting zinc finger E-box binding homeobox (ZEB)2
(16), miR-205 was a
glioma-specific tumor suppressor by targeting vascular endothelial
growth factor-A(17), miR-205 was
a candidate tumor suppressor that targets ZEB2 in renal clear cell
carcinoma (18). miR-205 acts
either as a tumor suppressor through inhibiting proliferation and
invasion, or as an oncogene through facilitating tumor initiation
and proliferation, depending on the specific tumor context and
target genes (19). Krüppel-like
factor (KLF) and share a three-C2H2 zinc finger DNA binding domain
which are involved in cell proliferation and differentiation in
both normal and pathological situations (20). KLF family members play an important
role in the growth and metastasis and cell cycle of different tumor
types (20). KLF12, members of KLF
family, binds to the CAGTGGG sequence within target gene promoter
regions and represses target gene expression through an N-terminal
Pro-Xaa-Asp-Leu-Ser sequence that promotes a physical interaction
with the co-repressor C-terminal binding protein 1 (CtBP1)
(21). Several studies revealed
the differentially expressed KLF12 in human tissues. Nakamura et
al introduced KLF12 cDNA into NIH3T3 and AZ-521 cell lines and
found that overexpression significantly enhanced their invasive
potential (22). Shen et al
reported that KLF12, suppressed by 8-Br-cyclic adenosine
monophosphate and medroxyprogesterone acetate, negatively regulated
human endometrial stromal cells decidualization by inhibiting
decidual prolactin and insulin-like growth factor binding protein-1
expression (23).
miR-205 dysregulation was identified with a series
of tumour. However, there was little information on the functional
roles of miRs specific and its target gene for basal-like breast
carcinoma (BLBC). In our previously miRs microarray assay,
differentially expression miRs were identified in BLBC. Further
bioinformatic analysis revealed KLF12 may be directly targeted by
miR-205. Therefore, the study was designed to identify specifically
expression miRs and its target gene and distinct biological actions
in BLBC.
Materials and methods
Breast tumor samples
Human breast cancer tissues and paired non-cancerous
tissues were collected at Shanghai 6th People's Hospital Jinshan
Branch. The samples were immediately snap-frozen in liquid nitrogen
and stored at −80°C for DNA/RNA extraction. Hematoxylin and eosin
(H&E) sections were reviewed by two pathologists. Assessment of
histological grade were using Bloom (25) and Richardson methods modified by
Elston and Ellis (24). The study
was approved by Shanghai 6th People's Hospital Jinshan Branch
Medical Ethics Committee and an informed consent was obtained for
the use of tissue samples from each patient.
Cell lines and culture
The human mammary epithelial cell lines MCF-10A and
the basal-like breast cancer cell lines MDA-MB-468 (basal-like)
(26) were obtained from the
Chinese Academy of Sciences Cell Bank (Shanghai, China). MCF-10A
cells were maintained in DMEM/F12 (1:1) supplemented with 5% horse
serum (both from Invitrogen), EGF (20 ng/ml; Peprotech),
hydrocortisone (0.5 μg/ml), cholera toxin (100 ng/ml), insulin (10
μg/ml) (all from Sigma) cultured in 5% CO2 at 37°C.
MDA-MB-468 cells were maintained in L-15 supplemented with 10%
fetal bovine serum (FBS), cultured in 100% air at 37°C.
Transfection
Cells were plated in 12-well plates and transfected
at 80–90% confluence with GenePharma (Shanghai, China) miR mimics
(miR-205 mimics, miR-205 mimics NC) and inhibitors (miR-205
inhibitor, miR-205 inhibitor NC) at a final concentration of 100 nM
in OPTI-MEM using Lipofectamine 2000 (Invitrogen) according to
manufacturer's instruction. L-15 containing 10% FBS was added 6 h
after transfection. The transfected cells were used for functional
studies or harvested for RNA and protein analyses as described
after 48 h culture.
Immunohistochemistry (IHC) and
fluorescence in situ hybridization (FISH)
Breast tissue samples were fixed in 4%
formalin/phosphate-buffered saline. Tissues were dehydrated,
embedded in paraffin and cut. Consecutive 4 μm thick sections were
analyzed by IHC using a panel of antibodies against estrogen
receptor (ER; 1:100), progesterone receptor (PR; 1:100) (both from
Neomarkers), cytokeratin (CK) 5/6 (1:100; Dako), CK14 (Dako), p63
(1:500; Neomarkers), epidermal growth factor receptor (EGFR; 1:50),
p53 (1:100), and Ki-67 (1:75) (all from Dako) in order to identify
BLBC molecular subtypes (2,3,27).
KLF12 (1:100; Santa Cruz Biotechnology, Inc., Santa Cruz, CA, USA)
expression pattern was also analyzed using IHC. IHC staining was
performed according to manufacturer's instructions.
3,3N-Diaminobenzidine Tertrahydrochloride (Dako) systems were used
for detection. Her-2 was stained with a HercepTest kit (Dako). For
each stain, the percentage of positive cells was recorded. Marker
expression over 10% within tumor cells was considered positive.
Marker expression under 10% within tumor cells was considered
negative. For Her-2, only cases with a membranous staining score of
3 were considered positive.
FISH was performed for the detection of Her-2
amplification. The probe mix consisted of a mixture of
Texas-Red-labeled DNA probes covering a 218-kb region including the
Her-2 gene on chromosome-17 (CEN-17) and a mixture of
fluorescence-labeled DNA probes targeted at the centromere region
of CEN-17. Section preparation and hybridization were performed
according to manufacturer's instructions (Dako). Wherever possible,
we calculated 30 nuclei per tissue specimen. Specimens with
Her-2/CEN-17 ratios over 2.2 were considered to have
undergone Her-2. For specimens with borderline ratios
(1.8–2.2), an additional 30 nuclei were counted and the ratio was
recalculated with 60 nuclei. Specimens with Her-2/CEN-17
ratios under 1.8 were considered to be free of Her-2
amplification.
RNA extraction
Total RNA was isolated including tissue samples and
cultured cells using TRIzol reagent (Invitrogen) and then treated
with RNase-free DNaseI (Promega). Quality of total RNA was
determined on an RNA Nano kit (Bioanalyzer), and the RNA was
quantified using a spectrophotometer (Nanodrop-1000; NanoDrop).
Extracted RNA samples were stored at −80°C until used.
LNA-based miR microarray and
bioinformatics analysis
To identify miRs specific for BLBC, total RNA was
extracted from BLBC tissues and paired non-cancerous tissues. The
isolated RNA samples were subjected to comprehensive analysis of
miRs expression patterns with the microarray-based technology.
Purified RNA was labeled with a miRCURY Hy3/Hy5 labeling kit
(Exiqon). The Hy3™-labeled samples and Hy5™-labeled reference pool
RNA samples were then mixed pair-wise and hybridized to the miRCURY
LNA array version 11.0 (Exiqon). The hybridization was performed
according to the manufacturer's instructions. To identify miRs that
were differentially expressed between the BLBC tissues and NC,
supervised analysis was performed using hierarchical clustering
analysis (Cluster 3.0).
GO analysis was used to organize genes into
hierarchical categories and revealed the miR-gene regulatory
network on the basis of biological process and molecular functions
(28–30). In detail, the one-sided Fisher's
exact test and χ2-test were used to establish GO
categories, and the false discovery rate (FDR) was calculated to
correct the p-values (31–33). Only GOs that had p-values <0.01
and FDRs <0.05 were chosen. Three datasets of miRs and their
predicted targets were also used in this study: TargetScan, PicTar
and miRanda (34–37). SigTerms software was used to
perform GOs analysis simultaneously (38). SigTerms were developed as a set of
Excel macros through Excel Visual Basic for Applications using both
the selected gene set and the entire set of gene-to-miR
associations (38). Affymetrix
probe identifiers were mapped to Entrez gene identifiers using
version 21 of the U133A annotation. The network of miR-mRNA
interactions, representing the critical miRs and their targets, was
established according to the miRs degree (38). For interactive viewing of the
network, Pajek software was used to process networks of miR-mRNA
interaction (39).
qRT-PCR
Expression levels of miRs and KLF12 which showed
significant differences based on the microarray and bioinformatic
results were analyzed by qRT-PCR using cell lines and tissue
samples. cDNA was prepared from total RNA using an All-in-One miRNA
qRT-PCR detection kit (GeneCopoeia) following the protocol provided
by the manufacturer. All PCR reactions were performed in 20 μl
aliquots containing 2 μl first-strand cDNA with 18 μl PCR master
mixture (10 μl qPCR mix, 2 μl qPCR primer, 2 μl universal Adaptor
PCR Primer and 2 μl RNase-free water), and run in triplicate on the
iQ5 real-time PCR detection system (Bio-Rad). Thermal cycling was
initiated with a first denaturation step at 95°C for 10 min,
followed by 40 cycles of 95°C for 10 sec and 60°C for 20 sec and
72°C for 30 sec. The cycle passing threshold (Ct) was recorded.
After normalization to glyceraldehyde 3-phosphate dehydrogenase
(GAPDH) mRNA, relative expression levels and fold induction of each
target gene were calculated using the comparative CT (ΔΔCT) methods
(40).
Western blot analysis
Total protein was extracted using the Total Protein
Extraction kit (Thermo Pierce). Tissues and cells were lysed in
RIPA buffer supplemented with protease inhibitors according to the
manufacturer's instructions. Lysates were separated on a 10%
acrylamide gel and subjected to western blot analysis. Immunoblots
were incubated overnight at 4°C with the following primary
antibodies: anti-KLF12 (1:200) and anti-β-actin (1:2,000) (both
from Santa Cruz Biotechnology, Inc.) were used as loading controls.
Peroxidase-labeled secondary antibodies (1:2,000; Santa Cruz
Biotechnology, Inc.) were used to visualize bands using the
enhanced chemiluminescence kit (Amersham) on gel image analysis
system (Tanon).
Cell proliferation assay
Cell proliferation was determined by the cell
counting kit-8 assay (CCK-8; Obio Technology, Shanghai, China).
After transfection and culture for 48 h, MDA-MB-468 cells were
plated at a density of 2×10⁴ cells/ml on 96-well plates
and cultured in 100% CO2 at 37°C. In each detection
point, 10 μl CCK-8 solution reagent was added to each well. Four
hours later, the plates were read in a microplate autoreader
(infinite M1000; Tecan) at wavelength of 450 nm. The results were
expressed as the mean optical density for selected paradigms
performed in triplicate.
Transwell invasion assay
Matrigel invasion assay was performed using a
24-well invasion chamber system (BD Biosciences) with polycarbonic
membrane (diameter: 6.5 mm, pore size 8 μm). Cells were plated on
the top of Matrigel-coated invasion chambers in a serum-free L-15.
As a chemo-attractant, L-15 containing 10% of FBS was added to the
lower compartment of the chamber. The cells were incubated for 24
h. Invasion of cells to the underside of the Matrigel-coated
membrane was detected by staining the cells with Mayer's
hematoxylin solution and visualizing the cells under a microscope.
After staining, cells were counted under a microscope in four
random fields (magnification, ×100) and results were expressed in
the form of a bar graph. Assays were done in triplicate for each
experiment, and each experiment was repeated three times.
Quantitation of apoptosis
The Annexin V-fluorescein isothiocyanate (FITC)
apoptosis detection kit (Beyotime) was used to detect and quantify
apoptosis by flow cytometry. In brief, L-15 containing 10% FBS was
added 6 h after transfection. Then, cells were cultured 72 h and
collected by centrifugation for 5 m at 2,000 rpm. Cells were
resuspended at a density of 1–5×10⁶ cells/ml by added
500 μl binding buffer, then 5 μl Annexin V-EGFP and 5 μl propidium
iodide were added for 5–10 min, and analyzed by FACSVerse™ Flow
Cytometer (Becton-Dickinson) in 1 h. The data obtained were
analyzed using CellQuest software.
KLF12 3′-UTR construction and luciferase
reporter assay
For the luciferase reporter assays, KLF12 3′-UTR,
including the XhoI and NotI restriction sites, was
synthesised and then cloned into the psiCHECK-2 Vector (Promega)
using the XhoI and NotI (both from NEB) restriction
sites. HEK-293T cells were seeded into 48-well plate at a density
of 70–80% cells/well. After overnight incubation, the cells were
treated with transfection mixture consisting of 25 μl of serum-free
medium diluting 100 ng psiCHECK-KLF12 (V1), 25 μl of serum-free
medium diluting mir-205 (V2) and 25 μl of serum-free medium
diluting Lipofectamine 2000 (V3; Invitrogen). Forty-eight hours
post-transfection Renilla and Firefly luciferase activities
were measured using the Dual-Luciferase Reporter assay system
(Promega). Firefly activity was normalized to Renilla
activity to control the transfection efficiency.
Statistical analysis
All data were expressed as mean ± SD. The
differences between groups were analyzed using the Student's
t-test. Statistical difference at p-values <0.05 and
significantly statistical difference at p-values <0.01. The
statistical software SPSS 16.0 (IBM, Armonk, NY, USA) was used for
analysis of Student's t-test.
Results
BLBC identification, miR microarray and
GO analysis
Eighteen cases were identified as BLBC (ER, PR and
Her-2 negative; CK5/6, CK14, p63, EGFR and p53 positive;
Ki-67 high proliferation index; Her-2 no-amplification)
(Fig. 1A).
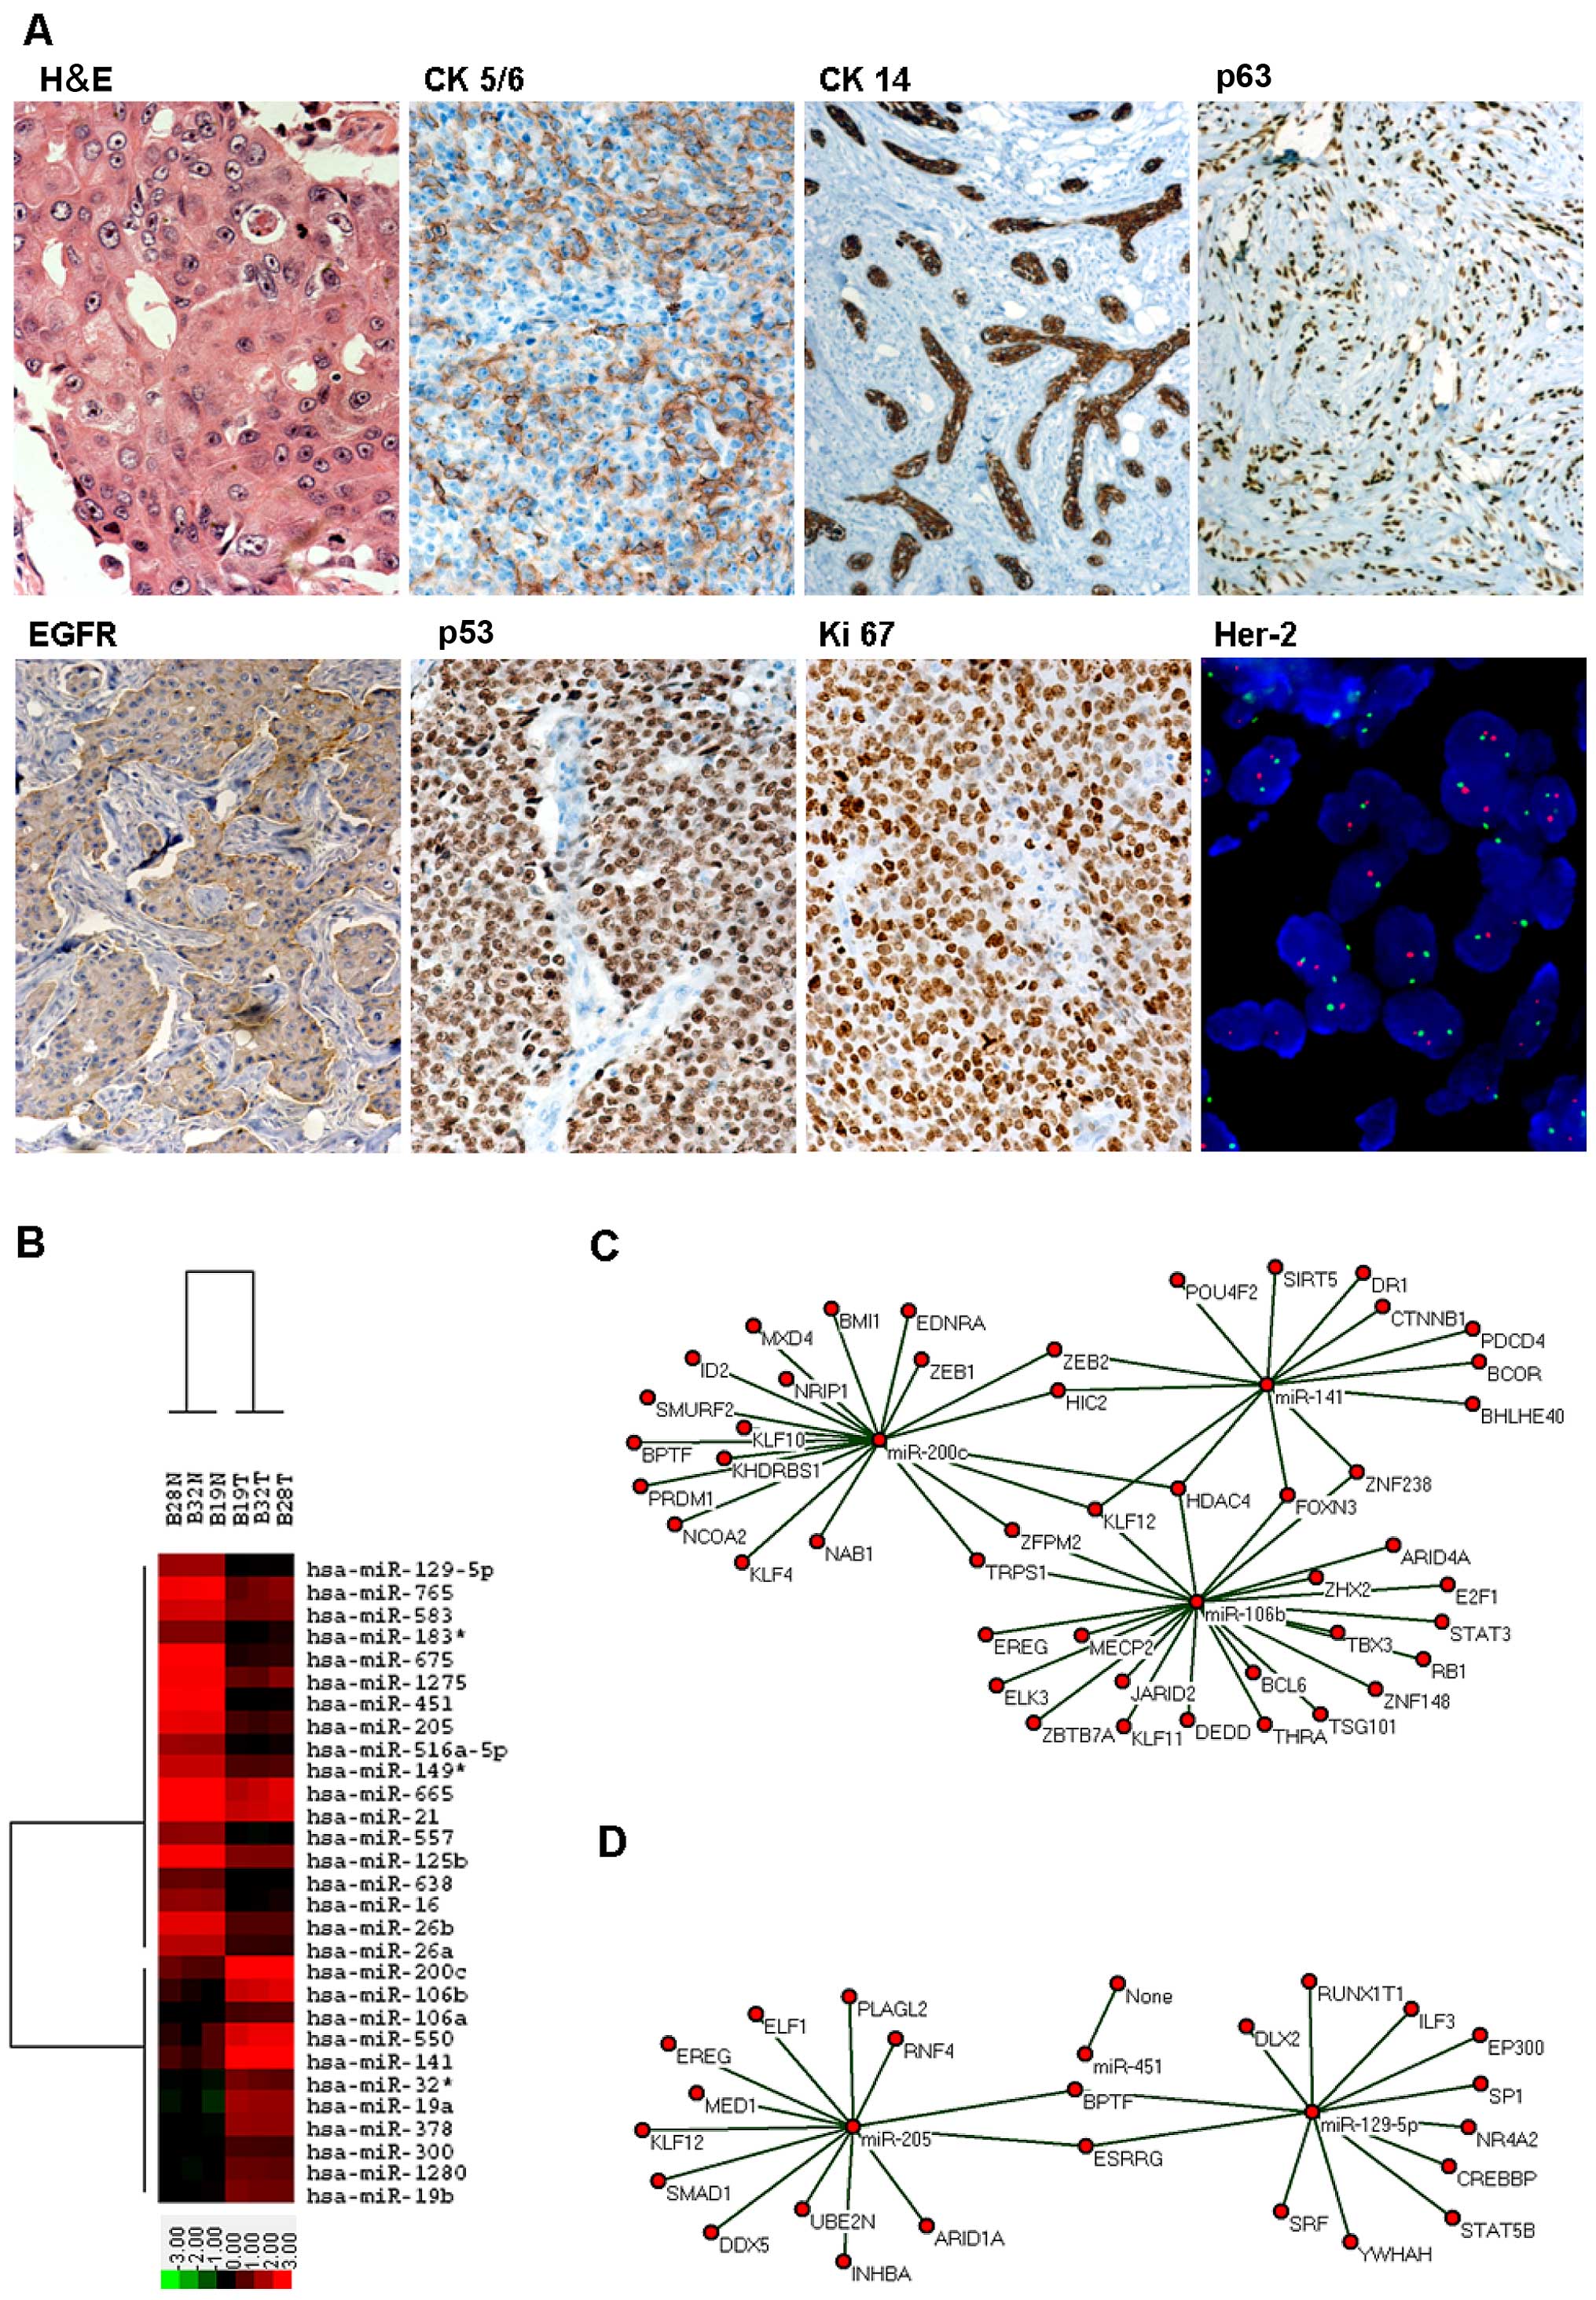 | Figure 1BLBC identification and miR
microarray and bioinformatics analysis. (A) Identification of BLBC:
HE showed large tumor cells, eosinophilic cytoplasm and obvious
nucleoli; IHC showed CK5/6 cytoplasm positive (x400), CK14
cytoplasm positive (x400), p63 nucleus positive (x400), EGFR
membrane positive (x400), p53 nucleus positive (x400), Ki-67 high
proliferation index (x400); FISH showed no Her-2
amplification (x400). (B) Heat map summarizes the biological
replicates for BLBC and its normal control, the highest expression
value corresponds to bright red and the lowest to bright green,
gene names are listed on the right. (C and D) Network analysis
displayed the BLBC up/downregulation miR-mRNA network, KLF12
had the highest degree of 4 in the network, red cycle nodes
represente miRNA and mRNA, respectively, edges describe the
inhibitive effect of miRNA on mRNA. |
Using the miR microarray, it first evaluated the miR
expression profiles in BLBC (n=3) and NC (n=3). The expression
profiles of 265 miRs were determined to differ between BLBC and NC
which were sufficient to separate samples into biologically
interpretable groups. Thus, 11 miRs were identified as upregulated
(>2-fold) and 18 miRs were identified as downregulated
(<0.5-fold) between BLBC and NC (Fig. 1B and Table I).
 | Table IThe miR microarray identified between
BLBC and NC. |
Table I
The miR microarray identified between
BLBC and NC.
| miRNA | Genomic
location | Normal control
mean | Basal-like breast
carcinoma mean | Fold- change | P-value | Function |
|---|
| Upregulated
microRNAs | | | | | | |
| hsa-miR-19a |
chr13:92003145–92003226 [+] | 0.621 | 6.427 | 10.349 | 0.001 | |
| hsa-miR-19b |
chr13:92003446–92003532 [+] | 1.201 | 4.173 | 3.475 | 0.002 | |
|
hsa-miR-32* |
chr9:110848330–110848399 (−) | 0.728 | 3.689 | 5.067 | 0.007 | |
| hsa-miR-106a |
chrX:133131894–133131974 (−) | 0.886 | 2.812 | 3.174 | 4.99E-05 | |
| hsa-miR-106b |
chr7:99529552–99529633 (−) | 1.721 | 12.367 | 7.186 | 0.009 | Negative regulation
of nucleobase, nucleoside, nucleotide and nucleic acid metabolic
process |
| hsa-miR-141 |
chr12:6943521–6943615 (+) | 2.690 | 33.968 | 12.628 | 0.006 | Negative regulation
of nucleobase, nucleoside, nucleotide and nucleic acid metabolic
process |
| hsa-miR-200c |
chr12:6943123–6943190 (+) | 3.218 | 28.935 | 8.992 | 2.52E-06 | Negative regulation
of nucleobase, nucleoside, nucleotide and nucleic acid metabolic
process |
| hsa-miR-300 |
chr14:100577453–100577535 (+) | 0.990 | 2.609 | 2.635 | 0.002 | |
| hsa-miR-378 |
chr5:149092581–149092646 (+) | 0.861 | 5.812 | 6.750 | 8.33E-06 | |
| hsa-miR-550 |
chr7:30295935–30296031 (+) | 1.993 | 15.519 | 7.787 | 0.004 | |
| hsa-miR-1280 |
chr3:128081008–128081101 [+] | 0.784 | 3.505 | 4.471 | 3.98E-05 | |
| Downregulated
microRNAs | | | | | | |
| hsa-miR-16 |
chr13:49521110–49521198 (−) | 5.741 | 1.436 | 0.250 | 6.92E-06 | |
| hsa-miR-21 |
chr17:55273409–55273480 (+) | 44.750 | 11.610 | 0.259 | 4.08E-05 | |
| hsa-miR-26a |
chr3:37985899–37985975 (+) | 8.999 | 2.059 | 0.229 | 3.29E-07 | |
| hsa-miR-26b |
chr2:218975613–218975689 (+) | 14.630 | 2.872 | 0.196 | 5.05E-07 | |
| hsa-miR-125b |
chr11:121475675–121475762 (−) | 19.029 | 4.617 | 0.243 | 1.03E-08 | |
| hsa-miR-129-5p |
chr7:127635161–127635232 (+) | 6.690 | 1.356 | 0.203 | 8.08E-07 | Positive regulation
of nucleobase, nucleoside, nucleotide and nucleic acid metabolic
process |
|
hsa-miR-149* |
chr2:241044091–241044179 (+) | 10.663 | 2.809 | 0.263 | 3.92E-08 | |
|
hsa-miR-183* |
chr7:129201981–129202090 (−) | 4.862 | 1.391 | 0.286 | 0.001 | |
| hsa-miR-205 |
chr1:207672101–207672210 (+) | 15.581 | 2.492 | 0.159 | 2.05E-07 | Positive regulation
of nucleobase, nucleoside, nucleotide and nucleic acid metabolic
process |
| hsa-miR-451 |
chr17:24212513–24212584 (−) | 20.532 | 1.310 | 0.064 | 0.001 | Positive regulation
of nucleobase, nucleoside, nucleotide and nucleic acid metabolic
process |
|
hsa-miR-516a-5p |
chr19:58951807–58951896 (+) | 6.400 | 1.439 | 0.225 | 9.62E-06 | |
| hsa-miR-557 |
chr1:166611386–166611483 (+) | 5.742 | 0.803 | 0.139 | 2.33E-06 | |
| hsa-miR-583 |
chr5:95440598–95440672 (+) | 12.464 | 4.260 | 0.342 | 3.52E-06 | |
| hsa-miR-638 |
chr19:10690080–10690179 (+) | 3.504 | 0.843 | 0.241 | 1.53E-05 | |
| hsa-miR-665 |
chr14:100411123–100411194 (+) | 31.180 | 11.014 | 0.353 | 0.001 | |
| hsa-miR-675 |
chr11:1974565–1974637 (−) | 21.107 | 1.905 | 0.09 | 0.001 | |
| hsa-miR-765 |
chr1:155172547–155172660 (−) | 18.603 | 4.282 | 0.230 | 6.04E-05 | |
| hsa-miR-1275 |
chr6:33967749–33967828 [−] | 18.712 | 3.899 | 0.208 | 0.001 | |
GOs analysis displayed up/downregulation of miRs
which were significantly involved in the positive/negative
regulation of nucleobase, nucleoside, nucleotide and nucleic acid
metabolic processes (Tables II
and III). miRs were found to
interact with the genes relating to those processes, suggesting
miRs play an important role in the pathogenesis of BLBC. The
miR-mRNA regulatory networks based on positive/negative regulation
of nucleobase, nucleoside, nucleotide, and nucleic acid metabolic
processes were established (Fig. 1C
and D and Tables IV and
V), and the assumed targeted mRNAs
of up/downregulation miRs were identified. Three upregulation miRs
(miR-141/106b/200c) displayed the most targeted mRNAs of three
(degree 3). Two downregulation miRs (miR-205/129-5p) showed the
most targeted mRNAs of two (degree 2). All three upregulation miRs
(miR-141/106b/200c) targeted KLF12 and only one downregulation miR
(miR-205) targeted KLF12. So, KLF12 had the highest degree of four
(degree 4) in the up/downregulation miR-mRNA regulatory network. GO
analysis suggested KLF12 may be targeted by miR-205/141/106b/200c
and showed potentially the most important genes affecting
positive/negative regulation of nucleobase-, nucleoside-,
nucleotide- and nucleic-acid-metabolic-related processes.
| Table IIGO analysis significant terms based
on upregulated miRs. |
Table II
GO analysis significant terms based
on upregulated miRs.
| Category | Term | Count in selected
genes | Count in total
population | P-value |
|---|
| GO | Regulation of
transcription from RNA polymerase II promoter | 82 | 379 | 1.49E-07 |
| GO | Positive regulation
of transcription from RNA polymerase II promoter | 34 | 121 | 2.15E-06 |
| GO | Transcription
factor activity | 127 | 715 | 7.79E-06 |
| GO | Positive regulation
of transcription, DNA-dependent | 45 | 196 | 2.07E-05 |
| GO | Positive regulation
of RNA metabolic process | 45 | 197 | 2.37E-05 |
| GO | Regulation of gene
expression | 257 | 1668 | 2.73E-05 |
| GO | Transcription
regulator activity | 164 | 1003 | 4.85E-05 |
| GO | Regulation of
transcription | 240 | 1579 | 0.000133 |
| GO | Positive regulation
of transcription | 48 | 234 | 0.000221 |
| GO | Regulation of
macromolecule biosynthetic process | 253 | 1689 | 0.000222 |
| GO | Regulation of
nucleobase, nucleoside, nucleotide and nucleic acid metabolic
process | 245 | 1630 | 0.00023 |
| GO | Regulation of
cellular biosynthetic process | 255 | 1705 | 0.000231 |
| GO | Regulation of
biosynthetic process | 255 | 1706 | 0.00024 |
| GO | Positive regulation
of gene expression | 48 | 235 | 0.000245 |
| GO | Regulation of RNA
metabolic process | 228 | 1509 | 0.000289 |
| GO | Positive regulation
of nucleobase, nucleoside, nucleotide and nucleic acid metabolic
process | 49 | 243 | 0.000292 |
| GO | Regulation of
transcription, DNA-dependent | 225 | 1495 | 0.000402 |
| GO | Regulation of
macromolecule metabolic process | 267 | 1831 | 0.000827 |
| GO | Regulation of
cellular metabolic process | 267 | 1834 | 0.000914 |
| GO | Positive regulation
of progression through cell cycle | 4 | 5 | 0.001029 |
| GO | Transcriptional
repressor activity | 19 | 73 | 0.001033 |
| GO | Rhythmic
process | 14 | 47 | 0.001134 |
| GO | Negative regulation
of transcription, DNA-dependent | 35 | 169 | 0.00125 |
| GO | Positive regulation
of macromolecule biosynthetic process | 50 | 266 | 0.001342 |
| GO | Regulation of
metabolic process | 270 | 1869 | 0.001361 |
| GO | Negative regulation
of RNA metabolic process | 35 | 170 | 0.001392 |
| GO | Actin
cytoskeleton | 21 | 87 | 0.00164 |
| GO | Negative regulation
of transcription | 45 | 236 | 0.001697 |
| GO | Suckling
behavior | 3 | 3 | 0.001859 |
| GO | Negative regulation
of gene expression | 45 | 238 | 0.002019 |
| GO | Positive regulation
of cellular biosynthetic process | 50 | 273 | 0.00237 |
| GO | Positive regulation
of biosynthetic process | 50 | 275 | 0.002768 |
| GO | Histone
acetyltransferase binding | 4 | 6 | 0.002786 |
| GO | Protein
serine/threonine kinase activity | 59 | 339 | 0.003442 |
| GO | Phosphate metabolic
process | 103 | 651 | 0.003751 |
| GO | Phosphorus
metabolic process | 103 | 651 | 0.003751 |
| GO | Phosphoprotein
phosphatase activity | 25 | 117 | 0.003804 |
| GO | Protein amino acid
dephosphorylation | 23 | 105 | 0.003889 |
| GO | Centrosome | 13 | 48 | 0.004262 |
| GO | Protein
serine/threonine phosphatase complex | 9 | 28 | 0.004889 |
| GO | Negative regulation
of nucleobase, nucleoside, nucleotide and nucleic acid metabolic
process | 46 | 257 | 0.0054 |
| GO | Post-translational
protein modification | 123 | 806 | 0.005639 |
| GO | Protein kinase
cascade | 26 | 128 | 0.006487 |
| GO | Synapse
organization and biogenesis | 3 | 4 | 0.006751 |
| GO | Skeletal muscle
development | 3 | 4 | 0.006751 |
| GO | Vascular
endothelial growth factor receptor activity | 5 | 11 | 0.006817 |
| GO | Golgi stack | 5 | 11 | 0.006817 |
| GO | MAP kinase kinase
kinase activity | 5 | 11 | 0.006817 |
| GO | Negative regulation
of cellular biosynthetic process | 48 | 275 | 0.00739 |
| GO | Negative regulation
of transcription from RNA polymerase II promoter | 24 | 117 | 0.007676 |
| GO | System
development | 60 | 359 | 0.007845 |
| GO | Negative regulation
of biosynthetic process | 48 | 276 | 0.00791 |
| GO | Protein
serine/threonine phosphatase activity | 8 | 25 | 0.008086 |
| GO | Protein kinase
activity | 73 | 452 | 0.008364 |
| GO | Actin cytoskeleton
organization and biogenesis | 17 | 75 | 0.008522 |
| GO |
Dephosphorylation | 24 | 118 | 0.008544 |
| GO | Small conjugating
protein ligase activity | 23 | 112 | 0.008812 |
| GO | Positive regulation
of myeloid cell differentiation | 6 | 16 | 0.009191 |
| GO | Regulation of
myeloid cell differentiation | 10 | 36 | 0.009608 |
| Table IIIGO analysis significant terms based
on downregulated miRs. |
Table III
GO analysis significant terms based
on downregulated miRs.
| Category | Term | Count in selected
genes | Count in total
population | P-value |
|---|
| GO | Positive regulation
of nucleobase, nucleoside, nucleotide and nucleic acid metabolic
process | 23 | 243 | 0.000412 |
| GO | Positive regulation
of myeloid cell differentiation | 5 | 16 | 0.000459 |
| GO | Transcription
factor activity | 49 | 715 | 0.001111 |
| GO | Transcriptional
repressor activity | 10 | 73 | 0.001221 |
| GO | Regulation of
translation | 9 | 61 | 0.001244 |
| GO | Positive regulation
of transcription | 21 | 234 | 0.001431 |
| GO | Positive regulation
of gene expression | 21 | 235 | 0.001509 |
| GO | UBC13-MMS2
complex | 2 | 2 | 0.00191 |
| GO | mRNA binding | 6 | 32 | 0.002334 |
| GO | Positive regulation
of transcription, DNA-dependent | 18 | 196 | 0.002374 |
| GO | Transcriptional
activator activity | 11 | 93 | 0.002388 |
| GO | Positive regulation
of RNA metabolic process | 18 | 197 | 0.00251 |
| GO | Positive regulation
of macromolecule biosynthetic process | 22 | 266 | 0.003118 |
| GO |
Post-transcriptional regulation of gene
expression | 10 | 83 | 0.003241 |
| GO | Chromatin
modification | 14 | 141 | 0.003473 |
| GO | Positive regulation
of cellular biosynthetic process | 22 | 273 | 0.004261 |
| GO | Regulation of
myeloid cell differentiation | 6 | 36 | 0.004328 |
| GO | Positive regulation
of biosynthetic process | 22 | 275 | 0.004646 |
| GO | Natural killer cell
differentiation | 2 | 3 | 0.005564 |
| GO | Ubiquitin
conjugating enzyme complex | 2 | 3 | 0.005564 |
| GO | Positive regulation
of macromolecule metabolic process | 23 | 305 | 0.007789 |
| GO | Positive regulation
of cellular metabolic process | 23 | 310 | 0.009385 |
| GO | Regulation of gene
expression | 92 | 1,668 | 0.009564 |
| Table IVDatasets of up-go miRs and its
targets for interactive viewing of the network using Pajek desktop
software. |
Table IV
Datasets of up-go miRs and its
targets for interactive viewing of the network using Pajek desktop
software.
|
Vertices* | 49 |
|---|
| 1 | miR-106b |
| 2 | miR-141 |
| 3 | miR-200c |
| 4 | ZNF238 |
| 5 | NCOA2 |
| 6 | MXD4 |
| 7 | KHDRBS1 |
| 8 | FOXN3 |
| 9 | KLF12 |
| 10 | CTNNB1 |
| 11 | DR1 |
| 12 | E2F1 |
| 13 | EDNRA |
| 14 | ELK3 |
| 15 | EREG |
| 16 | BPTF |
| 17 | ZHX2 |
| 18 | HIC2 |
| 19 | SIRT5 |
| 20 | ZFPM2 |
| 21 | PDCD4 |
| 22 | ID2 |
| 23 | JARID2 |
| 24 | MECP2 |
| 25 | NAB1 |
| 26 | ZBTB7A |
| 27 | POU4F2 |
| 28 | BCOR |
| 29 | RB1 |
| 30 | ARID4A |
| 31 | BCL6 |
| 32 | PRDM1 |
| 33 | SMURF2 |
| 34 | BMI1 |
| 35 | STAT3 |
| 36 | TBX3 |
| 37 | ZEB1 |
| 38 | THRA |
| 39 | KLF10 |
| 40 | TRPS1 |
| 41 | TSG101 |
| 42 | ZNF148 |
| 43 | NRIP1 |
| 44 | KLF11 |
| 45 | BHLHE40 |
| 46 | DEDD |
| 47 | KLF4 |
| 48 | HDAC4 |
| 49 | ZEB2 |
|
|
Edges* |
|
| 1 | 4 |
| 1 | 8 |
| 1 | 9 |
| 1 | 12 |
| 1 | 14 |
| 1 | 15 |
| 1 | 17 |
| 1 | 20 |
| 1 | 23 |
| 1 | 24 |
| 1 | 26 |
| 1 | 29 |
| 1 | 30 |
| 1 | 31 |
| 1 | 35 |
| 1 | 36 |
| 1 | 38 |
| 1 | 40 |
| 1 | 41 |
| 1 | 42 |
| 1 | 44 |
| 1 | 46 |
| 1 | 48 |
| 2 | 4 |
| 2 | 8 |
| 2 | 9 |
| 2 | 10 |
| 2 | 11 |
| 2 | 18 |
| 2 | 19 |
| 2 | 21 |
| 2 | 27 |
| 2 | 28 |
| 2 | 45 |
| 2 | 48 |
| 2 | 49 |
| 3 | 5 |
| 3 | 6 |
| 3 | 7 |
| 3 | 9 |
| 3 | 13 |
| 3 | 16 |
| 3 | 18 |
| 3 | 20 |
| 3 | 22 |
| 3 | 25 |
| 3 | 32 |
| 3 | 33 |
| 3 | 34 |
| 3 | 37 |
| 3 | 39 |
| 3 | 40 |
| 3 | 43 |
| 3 | 47 |
| 3 | 48 |
| 3 | 49 |
| Table VDatasets of down-go miRs and its
targets for interactive viewing of the network using Pajek desktop
software. |
Table V
Datasets of down-go miRs and its
targets for interactive viewing of the network using Pajek desktop
software.
|
Vertices* | 26 |
|---|
| 1 | miR-129-5p |
| 2 | miR-205 |
| 3 | miR-451 |
| 4 | KLF12 |
| 5 | CREBBP |
| 6 | DDX5 |
| 7 | DLX2 |
| 8 | ELF1 |
| 9 | EP300 |
| 10 | EREG |
| 11 | ESRRG |
| 12 | BPTF |
| 13 | ILF3 |
| 14 | INHBA |
| 15 | SMAD1 |
| 16 | NR4A2 |
| 17 | PLAGL2 |
| 18 | MED1 |
| 19 | RNF4 |
| 20 | SP1 |
| 21 | SRF |
| 22 | STAT5B |
| 23 | UBE2N |
| 24 | YWHAH |
| 25 | ARID1A |
| 26 | RUNX1T1 |
|
|
Edges* |
|
| 1 | 5 |
| 1 | 7 |
| 1 | 9 |
| 1 | 11 |
| 1 | 12 |
| 1 | 13 |
| 1 | 16 |
| 1 | 20 |
| 1 | 21 |
| 1 | 22 |
| 1 | 24 |
| 1 | 26 |
| 2 | 4 |
| 2 | 6 |
| 2 | 8 |
| 2 | 10 |
| 2 | 11 |
| 2 | 12 |
| 2 | 14 |
| 2 | 15 |
| 2 | 17 |
| 2 | 18 |
| 2 | 19 |
| 2 | 23 |
| 2 | 25 |
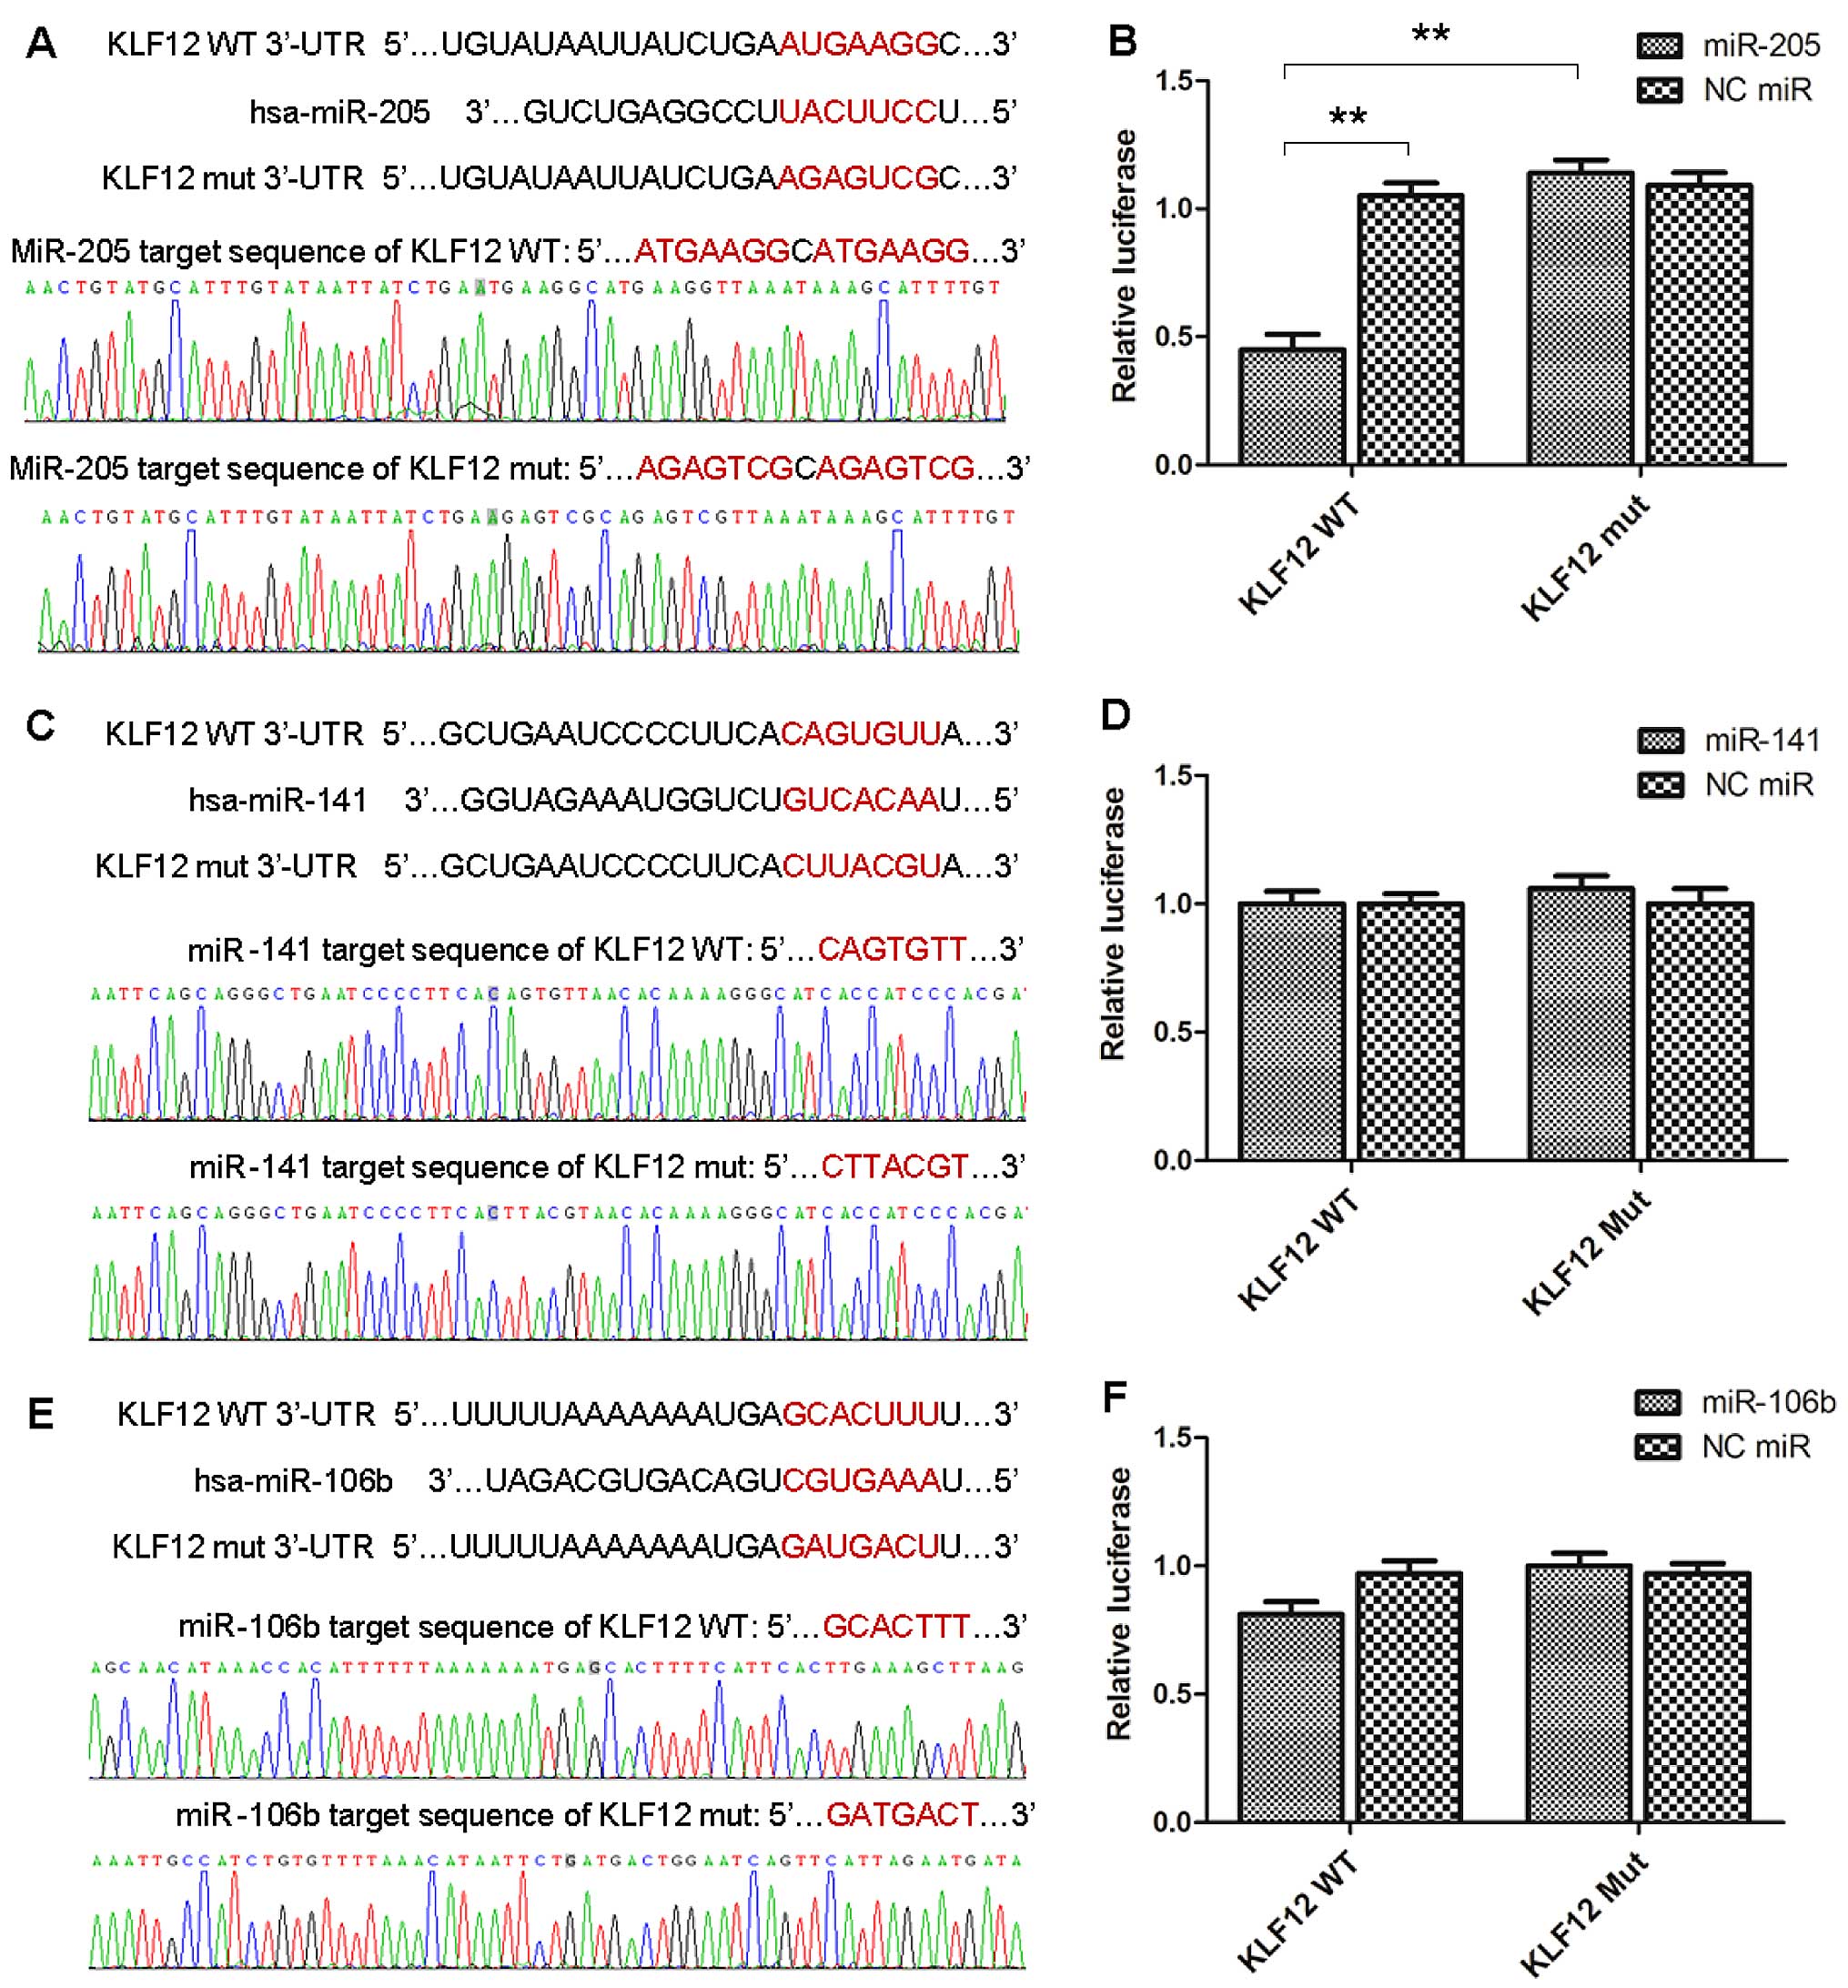
miR-205 directly targeted KLF12 through
binding its 3′-UTR
To determine whether KLF12 was directly targeted by
miR-205/141/106b (miR-200c context score percentile was too low and
was discard), the wild-type 3′-UTR of KLF12 and mutant were
constructed and inserted into the luciferase reporter plasmid. The
wild-type or mutant vectors were co-transfected with
miR-205/141/106b mimics or negative control miRs in MDA-MB-468
cells. Co-transfection of the reporter plasmid along with miR-205
resulted in significantly reducing KLF12-WT-3′-UTR-luciferase
expression than its NC miR + KLF12-WT (p=0.0016) or miR-205 +
KLF12-Mut (p=0.0011) (Fig. 2A and
B) groups; however, no KLF12-Mut-3′-UTR-luciferase expression
variation was observed compared to its NC miR + KLF12-Mut (Fig. 2A and B). Co-transfection of the
reporter plasmid along with miR-141/106b did not result in the
reduction of KLF12-WT/Mut-3′-UTR-luciferase expression compared to
its NC miR + KLF12-WT/Mut (Fig.
2–F). This supported miR-205 was likely to target KLF12
directly.
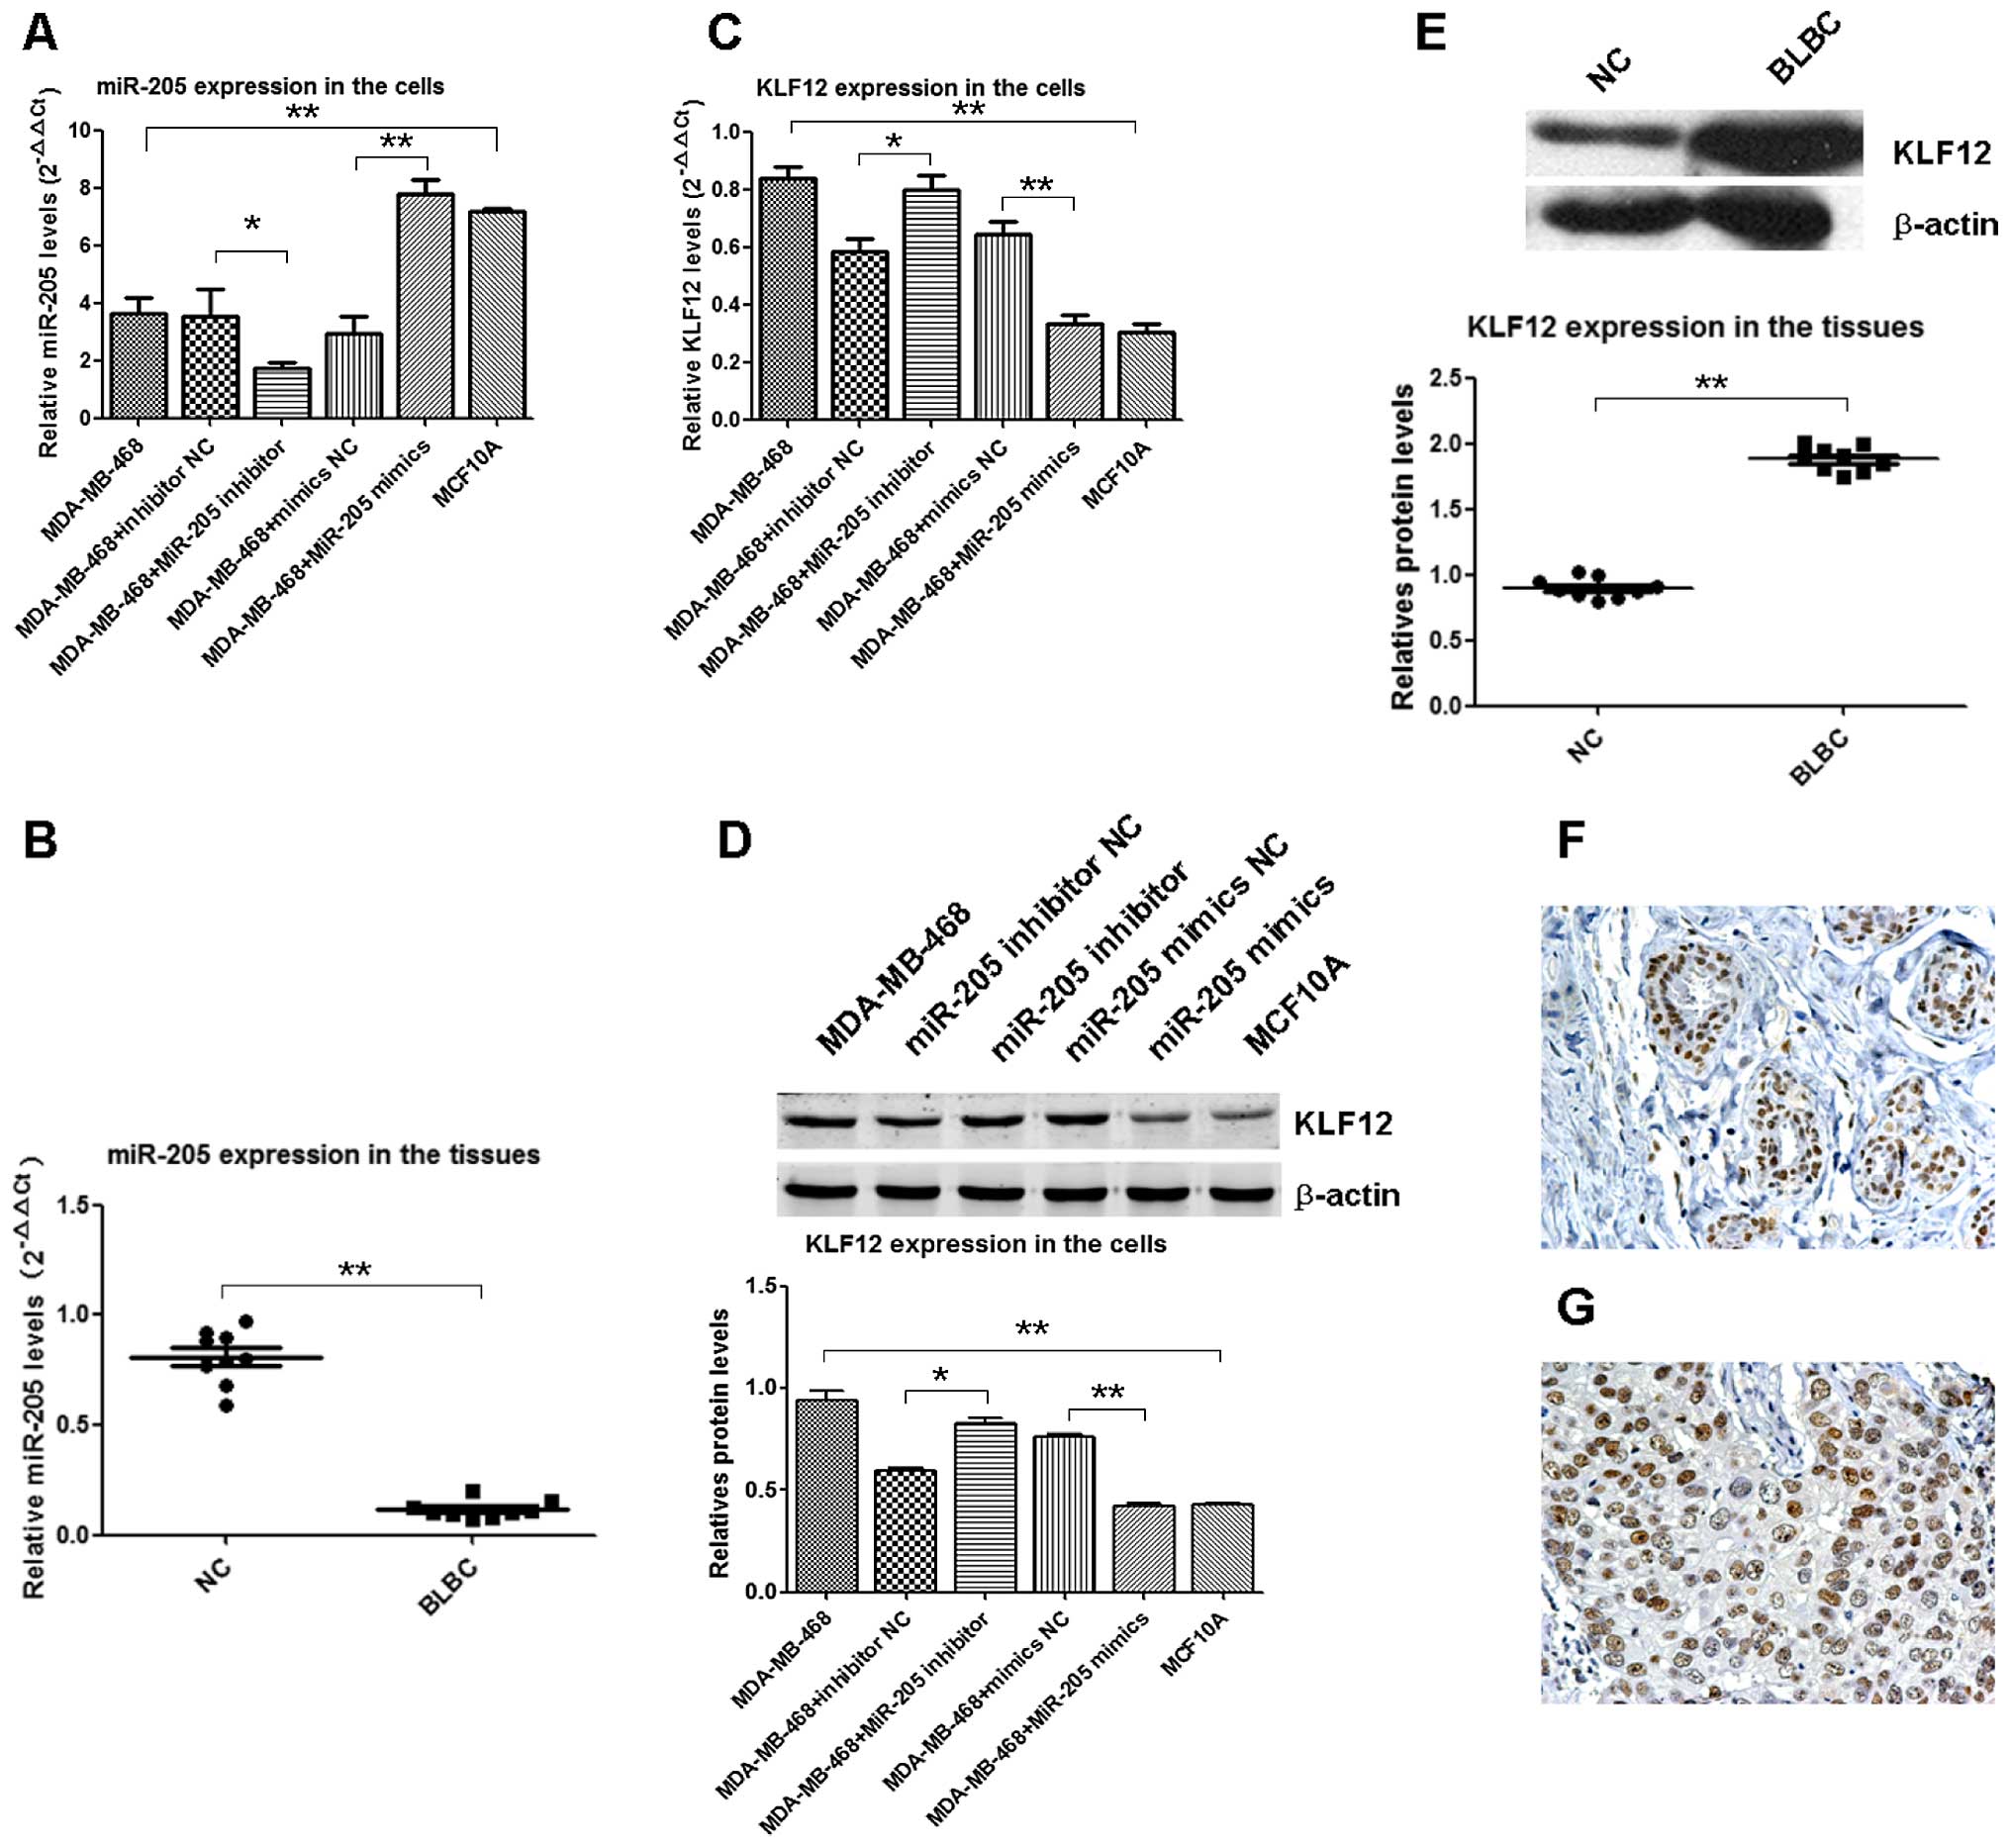
miR-205 downregulates in BLBC
cells/tissues and negatively modulates KLF12
Based on the microarray and bioinformation and
luciferase assay, qRT-PCR and western blot analysis were used to
relatively quantify expression levels of miR-205 and KLF-12.
miR-205 had low expression in MDA-MB-468 cells, significantly lower
than in MCF10A cells (p=0.007) (Fig.
3A); knock-up of miR-205 by transfection with miR-205 mimics in
MDA-MB-468 cells, its expression levels substantially increased,
and was significantly higher than in mimics of NC in cell lines
(p=0.0021) (Fig. 3A); knockdown of
miR-205 by transfection with miR-205 inhibitor in MDA-MB-468 cells,
its expression levels substantially reduced, and was lower than in
inhibitor NC in cell lines (p=0.034) (Fig. 3A). In BLBC tumor tissues, miR-205
had significantly lower expression levels than in the NC (n=9;
p=0.0074) (Fig. 3B). KLF12 had
high expression in MDA-MB-468 cells, significantly higher than it
in MCF10A cells (p=0.0026) (Fig.
3C); knock-up of miR-205 by transfection with miR-205 mimics in
MDA-MB-468 cells, its expression levels substantially reduced, and
was significantly lower than in mimics of NC in cell lines
(p=0.0038) (Fig. 3C); knockdown of
miR-205 by transfection with miR-205 inhibitor in MDA-MB-468 cells,
its expression levels substantially increased, and was higher than
in inhibitor NC in cell lines (p=0.043) (Fig. 3C). KLF12 protein showed high
expression levels in MDA-MB-468 cells, significantly higher than in
MCF10A cells (p=0.0079) (Fig. 3D);
knock-up of miR-205 by transfection with miR-205 mimics in
MDA-MB-468 cells, its expression level substantially reduced, and
was significantly lower than in the mimics of NC in cell lines
(p=0.009) (Fig. 3D); knockdown of
miR-205 by transfection with miR-205 inhibitor in MDA-MB-468 cells,
its expression levels substantially increased, and was higher than
in inhibitor NC in cell lines (p=0.035) (Fig. 3D). In BLBC tumor tissues, KLF12
protein was higher expressed than in NC (n=9; p=0.0083) (Fig. 3E). IHC results displayed positive
rates of KLF12 at 88.9% (16/18) in BLBC and 0% in normal breast
non-cancerous tissues, and its expression pattern was nuclear
positive in the normal ductal inner epithelium and outer
myoepithelial cells (Fig. 3F) but
diffuse nuclear positive in BLBC tumor cells (Fig. 3G). It indicated downregulation of
miR-205 was specific to BLBC, and negatively regulated KLF12
expression by directly targeted its 3′-UTR.
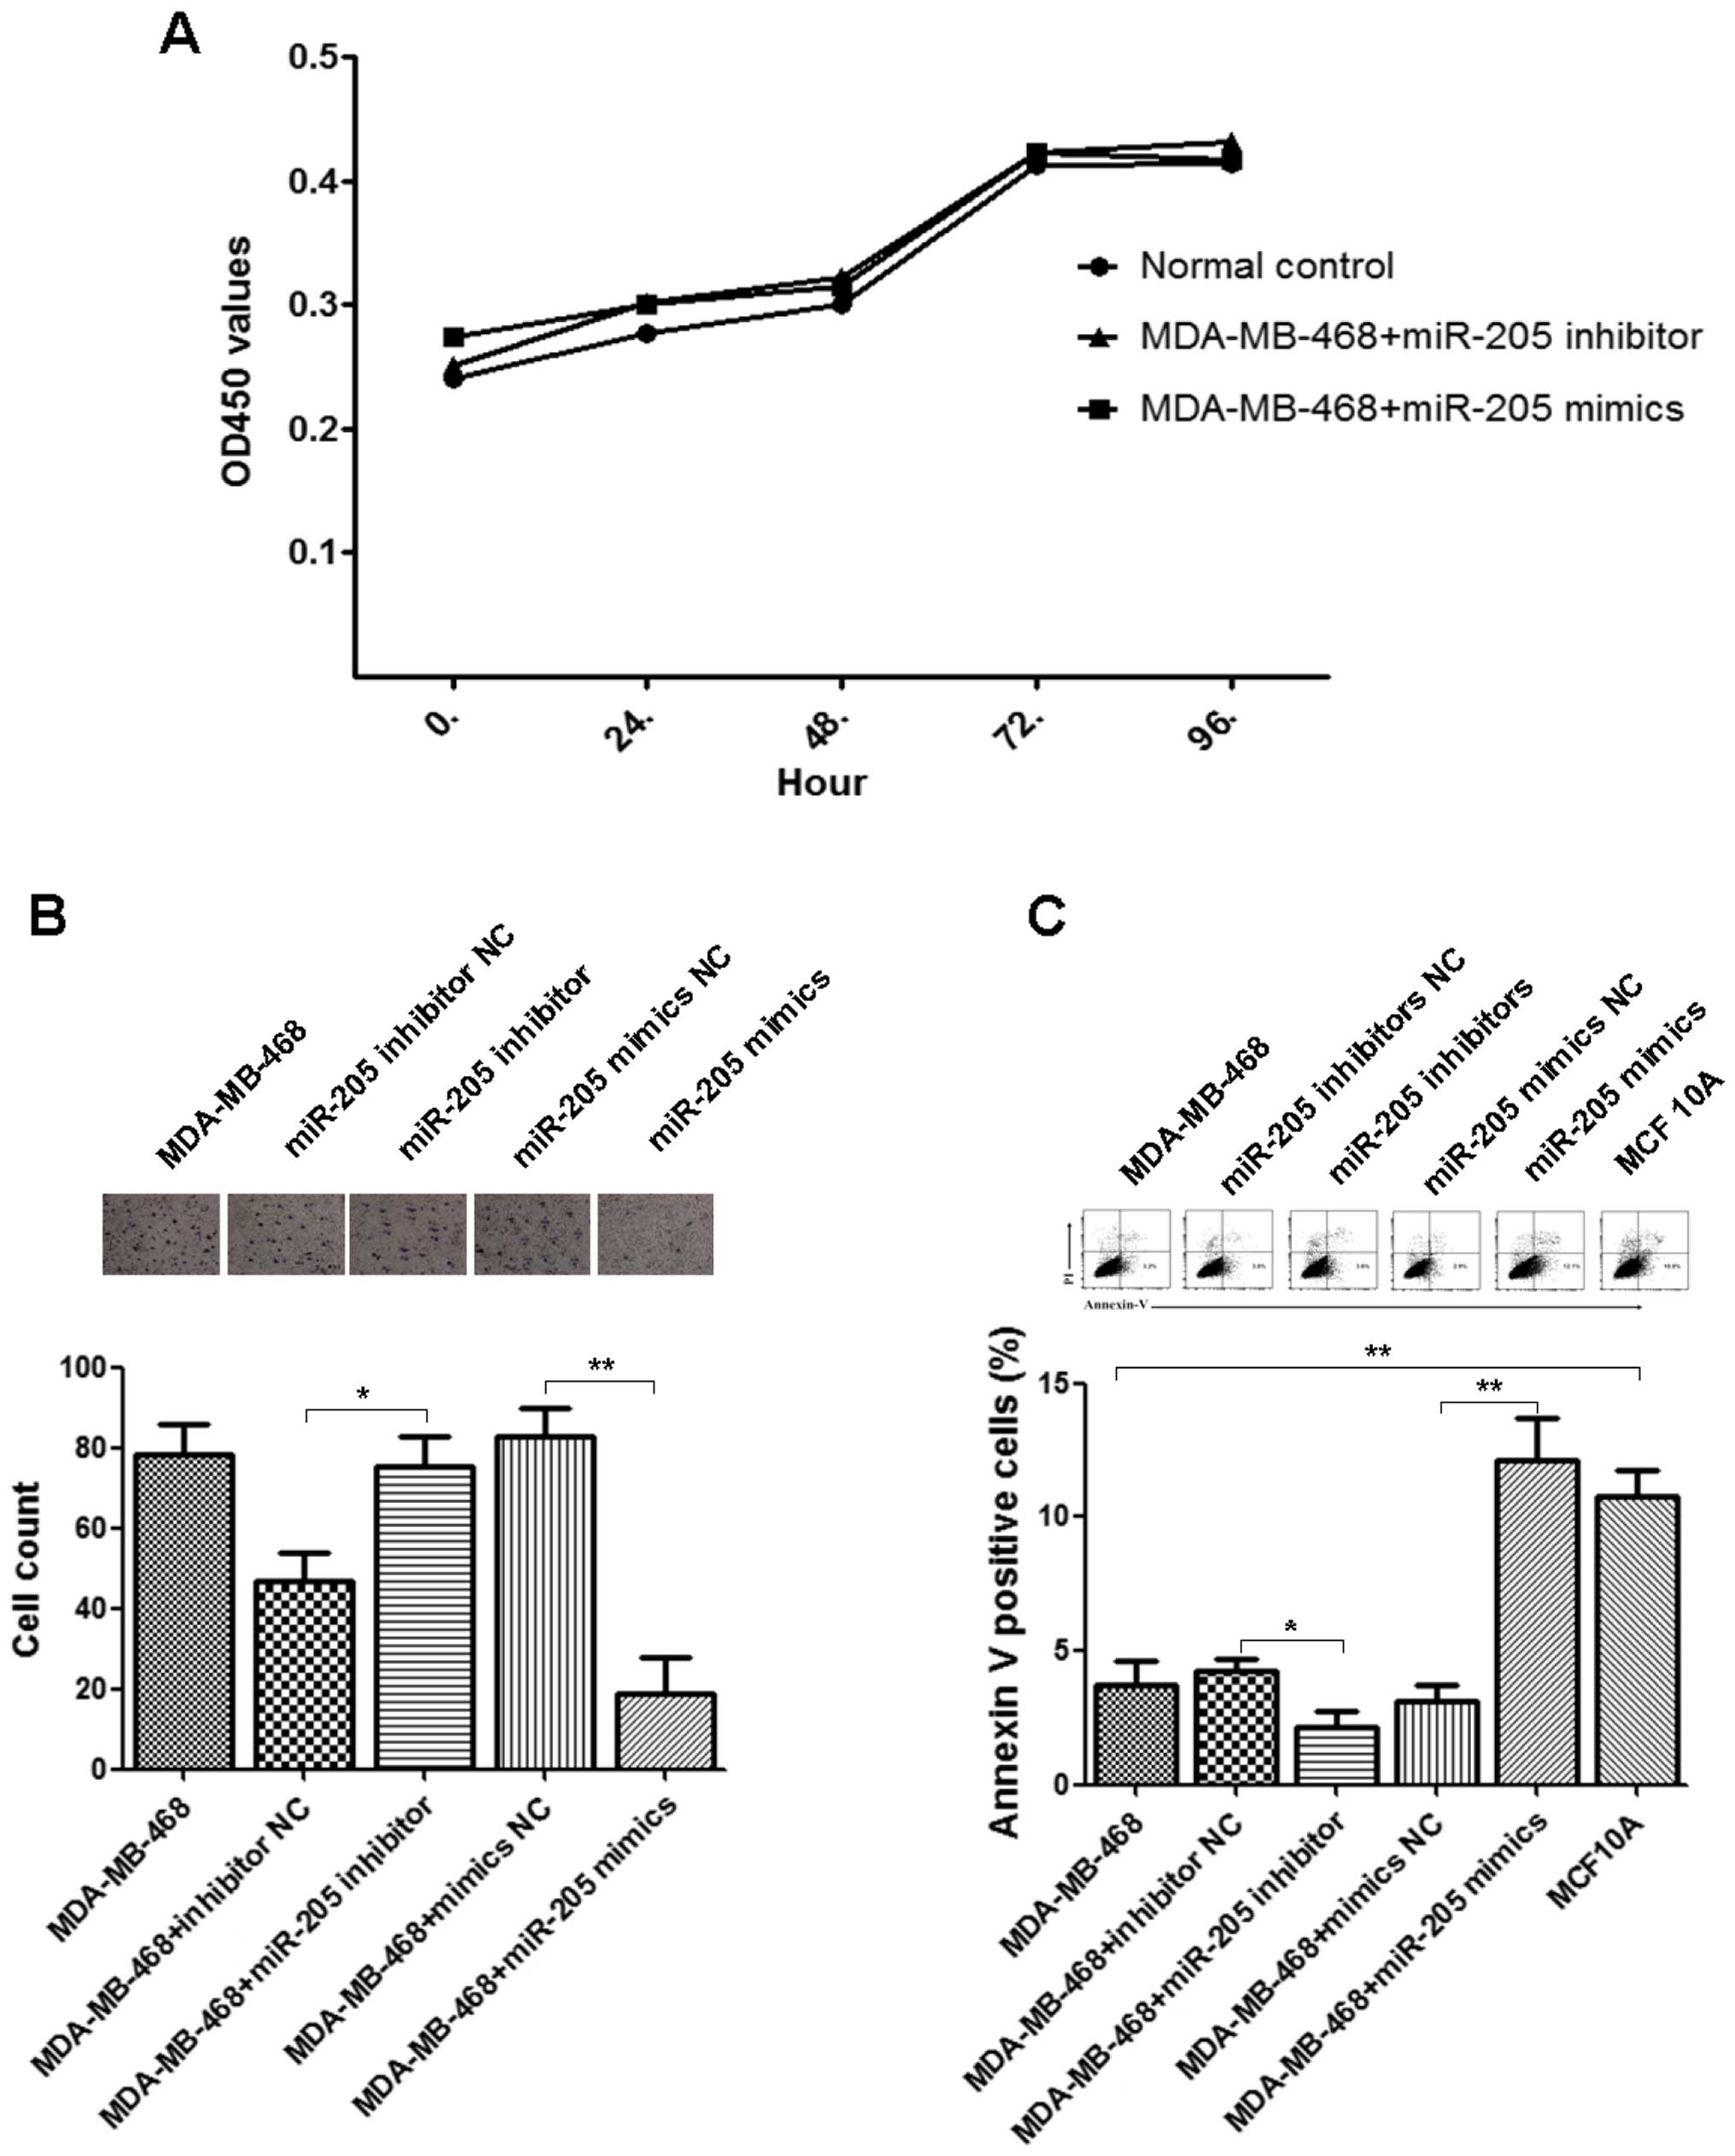
miR-205 is not involved in cellular
proliferation
Knock-up/down of miR-205 by transfection with
miR-205 mimics/inhibitor with sufficient concentrations to
increase/decrease miR-205 expression levels, respectively, had no
significant impact on the optical densities of CCK-8 assays
(Fig. 4A).
miR-205 involved in cellular invasion and
apoptosis
The Transwell Matrigel invasion assay was performed
to evaluate the impact of miR-205 on invasive ability of MDA-MB-468
cells. Knock-up of miR-205 by transfection with miR-205 mimics
significantly inhibited the transmembrane ability when compared
with miR-205 mimics NC (p=0.00175) (Fig. 4B) in vitro. Knockdown of
miR-205 by transfection with miR-205 inhibitor promoted the
transmembrane ability when compared with miR-205 inhibitor NC
(p=0.033) (Fig. 4B) in
vitro. It supported dysregulation of miR-205 was involved in
BLBC cell invasion.
The flow cytometric analyses of propidium
iodide-stained cells were performed to detect BLBC cell apoptosis
rates. The apoptosis rates were significantly different between
MDA-MB-468 and MCF-10A cells (p=0.0075) (Fig. 4C) in vitro. Knock-up of
miR-205 by transfection with miR-205 mimics significantly increased
apoptosis rates when compared with miR-205 mimics of NC (p=0.006)
(Fig. 4C) in vitro.
Knockdown of miR-205 by transfection with miR-205 inhibitor
inhibited the apoptosis rates when compared with miR-205 inhibitor
of NC (p=0.041) (Fig. 4C) in
vitro. It indicated dysregulation of miR-205 impaired the BLBC
cell apoptosis.
Discussion
BLBC is more common in younger patient and related
to high histological grade, aggressive clinical course, distant
metastasis, poor prognosis, and relatively high mortality rate
(41). Owning to its
triple-negative phenotype, patients with BLBC are not likely to
benefit from endocrine therapies or trastuzumab, but are likely to
benefit from systemic chemotherapy (41). Genetic, morphological and IHC
features of BLBC were reported, however, there was no universal
definition and specific biomarker which could identify those tumors
in routine diagnostics (41).
Previously studies revealed miR dysregulation and dysfunction in
breast cancer (10–12), and miR-205 was significantly
under-expressed in breast tumors compared with matched normal
breast tissue (42). In breast
cancer cell lines, including MCF-7 and MDA-MB-231, miR-205
expressed lower levels than non-malignant MCF-10A cells (42). Only a few studies which associated
with triple- negative breast cancer revealed that miR-205 was
directly transactivated by oncosuppressor p53 (43). In our studies, miR-205 was
significantly downregulated in BLBC tumor tissues and MDA-MB-468
cell lines.
Each miR is capable of regulating hundreds of
protein-coding genes. Previous studies revealed that most miR-205
target genes were Her-2/3 and ZEB1/2/3 in breast cancer (42,44).
Some others studies also identified that miR-205 directly targeted
phosphatase and tensin homolog deleted on chromosome ten and
interleukin-24 in A549 cells and human KB oral cancer cells
(45). miR-205 in cancer is an
angel or a devil depending on the specific tumor context and target
genes (19). KLF12 played an
important role in poorly differentiated gastric cancer progression
and negatively regulated human endometrial stromal cell
decidualization (22,23). miR-181a played a functionally
important role in human endometrial stromal cell decidualization
in vitro by inhibiting KLF12 (46). Ectopic expression of miR-205
significantly inhibits proliferation, growth and invasion as well
as impairs apoptosis. These findings established the tumor
suppressive role of miR-205, which was probably through directly
targeting oncogenes such as Her-2/3 and ZEB1/2/3 (42,44).
In our studies, miR-205 directly targeted KLF12 3′-UTR in
luciferase assays, KLF12 was negatively regulated by miR-205 in
expression analysis, overexpression of miR-205 significantly
inhibited invasion and promoted apoptosis in functional
investigation. Our finds suggested miR-205/KLF12 functioned as
tumor suppressor gene/proto-oncogene in BLBC, respectively.
The mechanism of miR-205-KLF12, apoptosis is an
interesting question. From the literature reviews, we found that
activating protein-2 (AP-2) factors executed important
functions during embryonic development and malignant transformation
(21). AP-2α and
AP-2γ overexpression in breast cancer cells direct
transcriptional activated Her-2 (47) and correlated with regulation of
multiple growth factor signaling pathways (21). Specifically, interaction of AP-2
with the c-Myc-Max heterodimer negatively regulated c-Myc target
genes and c-Myc-induced apoptotic cell death, it proposed AP-2
genes were involved in programming cell survival (48,49).
The adenoviral oncoprotein E1A activated expression of the
endogenous AP-2α gene. Furthermore, activation of AP-2α
transcription was dependent on the presence of a functional
E1A-CtBP1 interaction motif and involves inactivation of the
transcriptional silencer AP-2rep (KLF12) by directly interaction
with the corepressor CtBP1 (21).
Combined with previous studies and our experiments, we speculated
that down-regulation of miR-205 negatively regulated KLF12
overexpression, was involved in activation of the transcriptional
silencer AP-2rep (KLF12) by direct interaction with the corepressor
CtBP1 and inactivation of E1A-CtBP1 interaction motif, led to
inactivation of AP-2α transcription, negatively regulating
c-Myc-induced apoptotic cell death and repressing transcriptional
activation of Her-2 in BLBC. So, we thought miR-205-KLF12-AP-2α
axis played an important role in negatively regulated c-Myc-induced
apoptotic cell death and repressed transcriptional activation of
Her-2 in BLBC. However, further experimental studies are required,
and the mechanism of miR-205-KLF12-invasion remains unclear.
In previously studies, the mainly used public miRs
target prediction databases facilitate gene-by-gene searches
PicTar, TargetScan and miRanda algorithms (34–37).
However, its disadvantage was too many target genes to be predicted
and many of them were false positive. On the other hand,
integration of miR-mRNA target predictions with gene expression
data on a large scale using these databases currently is cumbersome
and time-consuming for researchers. So, we employed the
bioinformatics tool including GOs analysis (28–30)
and SigTerms (38) in this study.
An analysis of significant differences in GOs, which was based on
the reported and predicted target genes of these miRs, was
developed to highlight whether particular functions were enriched
in BLBC. GO organized genes targeted by differential miRs into
hierarchical categories based on biological process and then
outlined the effects of miRs on BLBC through significantly
differences of GOs (31,38). SigTerms for a given target
prediction database, retrieves all miR-mRNA functional pairs
represented by an experimentally derived set of genes. Furthermore,
for each miR, the software computed an enrichment statistic for
over-representation of predicted targets within the gene set, which
could help to implicate roles for specific miRs and miR-regulated
genes in the system under study. Currently, the software supported
searching of results from PicTar, TargetScan and miRanda
algorithms. Gunaratne et al (ref.?) discussed the
latest methodologies for determining genome-wide miRs and gene
expression changes and considered three programs (SigTerms, CORNA
and MMIA) to be essential for determining the false positive and
negative rates of existing algorithms and refining our knowledge on
the rules of miR-mRNA relationships. The advantage of GOs and
SigTerms was the accuracy in miR target prediction, but specific
training for researchers was needed.
The expression pattern of KLF12 was less known in
tumor tissues. In our studies, KLF12 was diffusely nuclear positive
in BLBC tumor tissues, but nuclear positive in the normal ductal
inner epithelium and outer myoepithelial cells, respectively. Basal
markers (CK14, CK5/6 and EGFR) and myoepithelial markers (smooth
muscle actin and p63) were positive in myoepithelial cells, and
epithelial markers (epithelial membrane antigen, cytokeratin
Cam5.2) were positive in luminal epithelial. So, the double
staining characteristics of KLF12 were helpful for the differential
diagnosis between benign lesion and invasive ductal carcinoma. It
also suggested that KLF12 may function as molecular biomarker for
BLBC combination with other biomarkers, but this requires further
studies in clinical specimens.
In conclusion, miR-205 is miR-specific in BLBC
functioning as tumor suppressor gene through directly targeted and
negatively regulated proto-oncogene KLF12. miR-205 dysregulation
was involved in invasion and apoptosis in MDA-MB-468 cells in
vitro. miR-205 and KLF12 provide potential diagnostic
biomarkers and therapeutic approach for BLBC.
Acknowledgements
The study reported in this publication was funded by
grants from the Medical Guide Program of Science and Technology of
Shanghai Municipal Science and Technology Commission, Shanghai,
China (134119b2800) and the General Program of Shanghai Jinshan
District Health and Family Planning Commission, Shanghai, China
(JSKJ-KTMS-2014-14).
Abbreviations:
|
BLBC
|
basal-like breast carcinoma
|
|
miR
|
microRNA
|
|
qRT-PCR
|
quantitative reverse
transcription-polymerase chain reaction
|
|
IHC
|
immunohistochemistry
|
|
NC
|
normal control
|
|
GO
|
gene ontology
|
|
KLF12
|
Krüppel-like factor 12
|
|
UTR
|
untranslated region
|
|
AP-2
|
activating protein-2
|
|
Her-2
|
human epidermalgrowth factor
receptor-2
|
|
ZEB
|
zinc finger E-box binding homeobox
|
|
CtBP1
|
C-terminal-binding protein 1
|
|
H&E
|
hematoxylin and eosin
|
|
FBS
|
fetal bovine serum
|
|
FISH
|
fluorescence in situ
hybridization
|
|
ER
|
estrogen receptor
|
|
PR
|
progesterone receptor
|
|
CK
|
cytokeratin
|
|
EGFR
|
epidermal growth factor receptor
|
|
FDR
|
false discovery rate
|
|
GAPDH
|
glyceraldehyde 3-phosphate
dehydrogenase
|
|
CCK-8
|
cell counting kit-8 assay
|
|
FITC
|
fluorescein isothiocyanate
|
References
|
1
|
Torre LA, Bray F, Siegel RL, Ferlay J,
Lortet-Tieulent J and Jemal A: Global cancer statistics, 2012. CA
Cancer J Clin. 65:87–108. 2015. View Article : Google Scholar : PubMed/NCBI
|
|
2
|
Badve S, Dabbs DJ, Schnitt SJ, Baehner FL,
Decker T, Eusebi V, Fox SB, Ichihara S, Jacquemier J, Lakhani SR,
et al: Basal-like and triple-negative breast cancers: A critical
review with an emphasis on the implications for pathologists and
oncologists. Mod Pathol. 24:157–167. 2011. View Article : Google Scholar
|
|
3
|
Haupt B, Ro JY and Schwartz MR: Basal-like
breast carcinoma: A phenotypically distinct entity. Arch Pathol Lab
Med. 134:130–133. 2010.PubMed/NCBI
|
|
4
|
Rakha E and Reis-Filho JS: Basal-like
breast carcinoma: From expression profiling to routine practice.
Arch Pathol Lab Med. 133:860–868. 2009.PubMed/NCBI
|
|
5
|
Silva F, Carvalho S, Milanezi F and
Schmitt FC: Basal-like carcinoma of the breast. Acta Med Port.
21:373–378. 2008.(In Portuguese). PubMed/NCBI
|
|
6
|
Su CM, Wang MY, Hong CC, et al: miR-520h
is crucial for DAPK2 regulation and breast cancer progression.
Oncogene. 2015.
|
|
7
|
Baek D, Villén J, Shin C, Camargo FD, Gygi
SP and Bartel DP: The impact of microRNAs on protein output.
Nature. 455:64–71. 2008. View Article : Google Scholar : PubMed/NCBI
|
|
8
|
Schmittgen TD: Regulation of microRNA
processing in development, differentiation and cancer. J Cell Mol
Med. 12:1811–1819. 2008. View Article : Google Scholar : PubMed/NCBI
|
|
9
|
Croce CM: Causes and consequences of
microRNA dysregulation in cancer. Nat Rev Genet. 10:704–714. 2009.
View Article : Google Scholar : PubMed/NCBI
|
|
10
|
Vilquin P, Donini CF, Villedieu M, Grisard
E, Corbo L, Bachelot T, Vendrell JA and Cohen PA: MicroRNA-125b
upregulation confers aromatase inhibitor resistance and is a novel
marker of poor prognosis in breast cancer. Breast Cancer Res.
17:132015. View Article : Google Scholar : PubMed/NCBI
|
|
11
|
Hu Y, Xu K and Yagüe E: miR-218 targets
survivin and regulates resistance to chemotherapeutics in breast
cancer. Breast Cancer Res Treat. 151:269–280. 2015. View Article : Google Scholar : PubMed/NCBI
|
|
12
|
Liu R, Liu C, Chen D, Yang WH, Liu X, Liu
CG, Dugas CM, Tang F, Zheng P, Liu Y, et al: FOXP3 controls a
miR-146/NF-κB negative feedback loop that inhibits apoptosis in
breast cancer cells. Cancer Res. 75:1703–1713. 2015. View Article : Google Scholar : PubMed/NCBI
|
|
13
|
Zhang G, Hou X, Li Y and Zhao M: MiR-205
inhibits cell apoptosis by targeting phosphatase and tensin homolog
deleted on chromosome ten in endometrial cancer Ishikawa cells. BMC
Cancer. 14:4402014. View Article : Google Scholar : PubMed/NCBI
|
|
14
|
Iorio MV, Casalini P, Piovan C, Di Leva G,
Merlo A, Triulzi T, Ménard S, Croce CM and Tagliabue E:
microRNA-205 regulates HER3 in human breast cancer. Cancer Res.
69:2195–2200. 2009. View Article : Google Scholar : PubMed/NCBI
|
|
15
|
Verdoodt B, Neid M, Vogt M, Kuhn V,
Liffers ST, Palisaar RJ, Noldus J, Tannapfel A and
Mirmohammadsadegh A: MicroRNA-205, a novel regulator of the
anti-apoptotic protein Bcl2, is downregulated in prostate cancer.
Int J Oncol. 43:307–314. 2013.PubMed/NCBI
|
|
16
|
Matsushima K, Isomoto H, Yamaguchi N,
Inoue N, Machida H, Nakayama T, Hayashi T, Kunizaki M, Hidaka S,
Nagayasu T, et al: MiRNA-205 modulates cellular invasion and
migration via regulating zinc finger E-box binding homeobox 2
expression in esophageal squamous cell carcinoma cells. J Transl
Med. 9:302011. View Article : Google Scholar : PubMed/NCBI
|
|
17
|
Yue X, Wang P, Xu J, Zhu Y, Sun G, Pang Q
and Tao R: MicroRNA-205 functions as a tumor suppressor in human
glioblastoma cells by targeting VEGF-A. Oncol Rep. 27:1200–1206.
2012.
|
|
18
|
Chen Z, Tang ZY, He Y, Liu LF, Li DJ and
Chen X: miRNA-205 is a candidate tumor suppressor that targets ZEB2
in renal cell carcinoma. Oncol Res Treat. 37:658–664. 2014.
View Article : Google Scholar : PubMed/NCBI
|
|
19
|
Qin AY, Zhang XW, Liu L, Yu JP, Li H, Wang
SZ, Ren XB and Cao S: MiR-205 in cancer: An angel or a devil? Eur J
Cell Biol. 92:54–60. 2013. View Article : Google Scholar : PubMed/NCBI
|
|
20
|
Bureau C, Hanoun N, Torrisani J, Vinel JP,
Buscail L and Cordelier P: Expression and function of Kruppel
like-factors (KLF) in carcinogenesis. Curr Genomics. 10:353–360.
2009. View Article : Google Scholar :
|
|
21
|
Schuierer M, Hilger-Eversheim K, Dobner T,
Bosserhoff AK, Moser M, Turner J, Crossley M and Buettner R:
Induction of AP-2alpha expression by adenoviral infection involves
inactivation of the AP-2rep transcriptional corepressor CtBP1. J
Biol Chem. 276:27944–27949. 2001. View Article : Google Scholar : PubMed/NCBI
|
|
22
|
Nakamura Y, Migita T, Hosoda F, Okada N,
Gotoh M, Arai Y, Fukushima M, Ohki M, Miyata S, Takeuchi K, et al:
Kruppel-like factor 12 plays a significant role in poorly
differentiated gastric cancer progression. Int J Cancer.
125:1859–1867. 2009. View Article : Google Scholar : PubMed/NCBI
|
|
23
|
Shen X, Hu Y, Jiang Y, Liu H, Zhu L, Jin
X, Shan H, Zhen X, Sun L, Yan G, et al: Krüppel-like factor 12
negatively regulates human endometrial stromal cell
decidualization. Biochem Biophys Res Commun. 433:11–17. 2013.
View Article : Google Scholar : PubMed/NCBI
|
|
24
|
Bloom HJ: Complications following
radiotherapy of the thorax and abdomen. Proc R Soc Med. 52:495–500.
1959.PubMed/NCBI
|
|
25
|
Elston CW and Ellis IO: Pathological
prognostic factors in breast cancer. I The value of histological
grade in breast cancer: Experience from a large study with
long-term follow-up. Histopathology. 19:403–410. 1991. View Article : Google Scholar : PubMed/NCBI
|
|
26
|
Finn RS, Dering J, Ginther C, Wilson CA,
Glaspy P, Tchekmedyian N and Slamon DJ: Dasatinib, an orally active
small molecule inhibitor of both the src and abl kinases,
selectively inhibits growth of basal-type/'triple-negative' breast
cancer cell lines growing in vitro. Breast Cancer Res Treat.
105:319–326. 2007. View Article : Google Scholar : PubMed/NCBI
|
|
27
|
Nielsen TO, Hsu FD, Jensen K, Cheang M,
Karaca G, Hu Z, Hernandez-Boussard T, Livasy C, Cowan D, Dressler
L, et al: Immunohistochemical and clinical characterization of the
basal-like subtype of invasive breast carcinoma. Clin Cancer Res.
10:5367–5374. 2004. View Article : Google Scholar : PubMed/NCBI
|
|
28
|
Gene Ontology Consortium. The Gene
Ontology (GO) project in 2006. Nucleic Acids Res. 34:D322–D326.
2006. View Article : Google Scholar :
|
|
29
|
Blake JA and Harris MA: The Gene Ontology
(GO) project: structured vocabularies for molecular biology and
their application to genome and expression analysis. Curr Protoc
Bioinformatics. Chapter 7(Unit 7): 22008.PubMed/NCBI
|
|
30
|
Camon E, Magrane M, Barrell D, Binns D,
Fleischmann W, Kersey P, Mulder N, Oinn T, Maslen J, Cox A, et al:
The Gene Ontology Annotation (GOA) project: Implementation of GO in
SWISS-PROT, TrEMBL, and InterPro. Genome Res. 13:662–672. 2003.
View Article : Google Scholar : PubMed/NCBI
|
|
31
|
Guo CJ, Pan Q, Li DG, Sun H and Liu BW:
miR-15b and miR-16 are implicated in activation of the rat hepatic
stellate cell: An essential role for apoptosis. J Hepatol.
50:766–778. 2009. View Article : Google Scholar : PubMed/NCBI
|
|
32
|
Rajewsky N: microRNA target predictions in
animals. Nat Genet. 38(Suppl): S8–S13. 2006. View Article : Google Scholar : PubMed/NCBI
|
|
33
|
Storey JD and Tibshirani R: Statistical
significance for genomewide studies. Proc Natl Acad Sci USA.
100:9440–9445. 2003. View Article : Google Scholar : PubMed/NCBI
|
|
34
|
Lewis BP, Burge CB and Bartel DP:
Conserved seed pairing, often flanked by adenosines, indicates that
thousands of human genes are microRNA targets. Cell. 120:15–20.
2005. View Article : Google Scholar : PubMed/NCBI
|
|
35
|
Lewis BP, Shih IH, Jones-Rhoades MW,
Bartel DP and Burge CB: Prediction of mammalian microRNA targets.
Cell. 115:787–798. 2003. View Article : Google Scholar : PubMed/NCBI
|
|
36
|
Krek A, Grün D, Poy MN, Wolf R, Rosenberg
L, Epstein EJ, MacMenamin P, da Piedade I, Gunsalus KC, Stoffel M,
et al: Combinatorial microRNA target predictions. Nat Genet.
37:495–500. 2005. View
Article : Google Scholar : PubMed/NCBI
|
|
37
|
John B, Enright AJ, Aravin A, Tuschl T,
Sander C and Marks DS: Human microRNA targets. PLoS Biol.
2:e3632004. View Article : Google Scholar : PubMed/NCBI
|
|
38
|
Creighton CJ, Nagaraja AK, Hanash SM,
Matzuk MM and Gunaratne PH: A bioinformatics tool for linking gene
expression profiling results with public databases of microRNA
target predictions. RNA. 14:2290–2296. 2008. View Article : Google Scholar : PubMed/NCBI
|
|
39
|
Shalgi R, Lieber D, Oren M and Pilpel Y:
Global and local architecture of the mammalian
microRNA-transcription factor regulatory network. PLoS Comput Biol.
3:e1312007. View Article : Google Scholar : PubMed/NCBI
|
|
40
|
Livak KJ and Schmittgen TD: Analysis of
relative gene expression data using real-time quantitative PCR and
the 2(−Delta Delta C(T)) method. Methods. 25:402–408. 2001.
View Article : Google Scholar
|
|
41
|
Ishihara A, Tsuda H, Kitagawa K, Yoneda M
and Shiraishi T: Morphological characteristics of basal-like
subtype of breast carcinoma with special reference to
cytopathological features. Breast Cancer. 16:179–185. 2009.
View Article : Google Scholar : PubMed/NCBI
|
|
42
|
Wu H and Mo YY: Targeting miR-205 in
breast cancer. Expert Opin Ther Targets. 13:1439–1448. 2009.
View Article : Google Scholar : PubMed/NCBI
|
|
43
|
Piovan C, Palmieri D, Di Leva G, Braccioli
L, Casalini P, Nuovo G, Tortoreto M, Sasso M, Plantamura I, Triulzi
T, et al: Oncosuppressive role of p53-induced miR-205 in triple
negative breast cancer. Mol Oncol. 6:458–472. 2012. View Article : Google Scholar : PubMed/NCBI
|
|
44
|
Wang S, Huang J, Lyu H, Lee CK, Tan J,
Wang J and Liu B: Functional cooperation of miR-125a, miR-125b, and
miR-205 in entinostat-induced downregulation of erbB2/erbB3 and
apoptosis in breast cancer cells. Cell Death Dis. 4:e5562013.
View Article : Google Scholar : PubMed/NCBI
|
|
45
|
Kim JS, Yu SK, Lee MH, Park MG, Park E,
Kim SG, Lee SY, Kim CS, Kim HJ, Chun HS, et al: MicroRNA-205
directly regulates the tumor suppressor, interleukin-24, in human
KB oral cancer cells. Mol Cells. 35:17–24. 2013. View Article : Google Scholar
|
|
46
|
Zhang Q, Zhang H, Jiang Y, Xue B, Diao Z,
Ding L, Zhen X, Sun H, Yan G and Hu Y: MicroRNA-181a is involved in
the regulation of human endometrial stromal cell decidualization by
inhibiting Krüppel-like factor 12. Reprod Biol Endocrinol.
13:232015. View Article : Google Scholar
|
|
47
|
Bosher JM, Williams T and Hurst HC: The
developmentally regulated transcription factor AP-2 is involved in
c-erbB-2 over-expression in human mammary carcinoma. Proc Natl Acad
Sci USA. 92:744–747. 1995. View Article : Google Scholar
|
|
48
|
Moser M, Pscherer A, Roth C, Becker J,
Mücher G, Zerres K, Dixkens C, Weis J, Guay-Woodford L, Buettner R,
et al: Enhanced apoptotic cell death of renal epithelial cells in
mice lacking transcription factor AP-2beta. Genes Dev.
11:1938–1948. 1997. View Article : Google Scholar : PubMed/NCBI
|
|
49
|
Gaubatz S, Imhof A, Dosch R, Werner O,
Mitchell P, Buettner R and Eilers M: Transcriptional activation by
Myc is under negative control by the transcription factor AP-2.
EMBO J. 14:1508–1519. 1995.PubMed/NCBI
|