Introduction
p53 is the tumor-suppressor gene most
frequently mutated in various types of cancer. p53 is
activated in response to cellular stress, thus resulting in
expression of many genes and antitumor effects through regulation
of the cell cycle, apoptosis and senescence (1). However, not only cell cycle arrest
and apoptosis but also other mechanisms, such as metabolic
regulation, are essential for p53-mediated tumor suppression
(2), thus suggesting the existence
of unidentified p53 downstream pathways that play a crucial role in
this process.
Colorectal cancer (CRC) is the third and second most
common cause of cancer death in men and women, respectively,
worldwide. The number of new cases and deaths in 2013 were
estimated to be 1.6 million and 0.7 million, respectively (3). Moreover, the average age at diagnosis
is decreasing (4). A multistep
mutation mechanism drives normal colon mucosal cells toward CRC
(5). Causal genes include the
tumor-suppressor genes adenomatous polyposis coli (APC),
KRAS, and p53. Initially, APC is inactivated, and this
is followed by activating mutation of KRAS; p53
mutation and loss of heterozygosity at chromosome 18q then induce
early carcinoma. Accordingly, p53 mutations have been found
in 50–75% of CRC cases (6). In
addition, p53 mutations are significantly associated with
poor prognosis (7,8). Therefore, identification of p53
targets in colorectal cancer cells is an important step in
understanding the molecular pathogenesis of CRC.
In this study, we analyzed multi-omics data for
HCT116 p53+/+ and p53−/− colon
cancer cell lines treated with Adriamycin and colon cancer data
from the Cancer Genome Atlas Research Network (TCGA, https://tcgadata.nci.nih.gov/tcga/). Adriamycin
was used for genotoxic stress to activate p53 in many cell lines
including HCT116 cells in previous studies (9–11).
Therefore, we used HCT116 cells and Adriamycin in this study. Our
analyses identified MICALL1 (Molecule Interacting with CasL-like 1)
as a novel p53 target. MICALL1, together with EHD1 and RAB8A, has
been found to affect membrane tubulation of recycling endosomes
(12). Herein, we explored the
association between tubular recycling endosome biogenesis and the
p53-MICALL1 pathway in the DNA damage response.
Materials and methods
Cell culture and treatment
Human cancer cell lines HCT116 (colorectal
adenocarcinoma) and H1299 (non-small cell lung cancer) were
purchased from American Type Cell Collection (Rockville, MD, USA).
HCT116 p53+/+ and HCT116 p53−/−
cells were gifts from Dr B. Vogelstein (Johns Hopkins University,
Baltimore, MD, USA). Human embryonic kidney cells (HEK293T: a
subclone of HEK293 cells engineered to express the SV40 large T
antigen) were purchased from Riken Cell Bank (Ibaraki, Japan).
Cells were incubated in a 37°C incubator containing 5%
CO2. HEK293T cells were transfected with Fugene6
(Promega, Madison, WI, USA). small interfering RNA oligonucleotides
were purchased from Sigma Genosis (Woollands, TX, USA) and
transfected with Lipofectamine RNAiMAX reagent (Invitrogen). We
generated and purified replication-deficient recombinant viruses
expressing p53 (Ad-p53) or LacZ (Ad-LacZ), as previously described
(13). H1299 (p53-null)
cells were infected with viral solutions at various multiplicities
of infection (MOIs) and incubated at 37°C until being harvested.
HCT116 cells were treated with 2 µg/ml ADR for 2 h to induce
genotoxic stress.
Mass-spectrometry and proteome data
HCT116 p53+/+ or
p53−/− cells were harvested at 12, 24, 48, or 72
h after adriamycin (ADR) treatment or no treatment as control.
Cells were lysed in buffer [8 M urea, 50 mM HEPES-NaOH, pH 8.0],
and proteins were reduced with 10 mM Tris (2-carboxyethyl)
phosphine (Sigma-Aldrich, St. Louis, MO, USA) at 37°C for 30 min,
then subjected to alkylation with 50 mM iodoacetamide
(Sigma-Aldrich) at 25°C in the dark for 45 min. The proteins were
then digested with immobilized trypsin (Thermo Fisher Scientific,
Bremen, Germany) at 37°C for 6 h. The resulting peptides were
desalted with solid phase extraction (Oasis HLB µ-elution
plate, Waters Corp., Milford, MA, USA) and analyzed by mass
spectrometer (Linear Trap Quadropole Orbitrap Velos mass
spectrometry, Thermo Fisher Scientific) combined with liquid
chromatography (UltiMate 3000 RSLC nano-flow HPLC system, DIONEX
Corporation, Sunnyvale, CA, USA). The LC/MS spectra were searched
against the Homo sapiens protein sequence database in SwissProt
using proteome analysis software (Proteome Discoverer 1.4 software,
Thermo Fisher Scientific); a false discovery rate of 1% was set for
both peptide and protein identification filters. Differential
peptide quantification analysis (label-free quantification
analysis) for 10 samples was performed on the Expressionist server
platform (Genedata AG, Basel, Switzerland), as previously described
(14). The fold change after ADR
treatment was calculated with the following formula: f1 = Median
peak intensity in [(p53+/+ with ADR at 12, 24,
48, 72 h) / (Maximum peak intensity in (p53+/+
and p53−/− without ADR and
p53−/− with ADR at 12, 24, 48, 72 h) +1].
For the proteome analysis, we analyzed 47,534 peaks
(derived from 22,276 genes) on the basis of the following criteria:
fold induction >2 and p<0.05. Candidates demonstrating at
least one peptide satisfying the criteria were included.
cDNA microarray and transcriptome
data
Gene expression analysis was carried out using
microarray kit (Sure print G3 Human GE 8×60 K microarray, Agilent
Technology, Santa Clara, CA, USA) according to the manufacturer's
protocol. Briefly, HCT116 p53+/+ and
p53−/− cells were treated with 2 µg/ml ADR
and incubated at 37°C until being harvested. Total RNA was isolated
from the cells through standard protocols. Each sample was labeled
and hybridized to array slides.
The fold change after ADR treatment was calculated
with the following formula: f2 = Median expression of probe in
(p53+/+ with ADR at 12, 24, 48 h)/Maximum
expression of probe in (p53+/+ and
p53−/− without ADR and p53−/−
with ADR at 12, 24, 48 h).
In the transcriptome analysis, we filtered 62,976
peaks (derived from 24,220 genes) on the basis of the following
criteria: fold induction >2 and p<0.05. Genes demonstrating
at least one probe satisfying the criteria were included.
TCGA analysis
MICALL1 expression and p53 mutation
status in colorectal tumor samples were obtained from the Cancer
Genome Atlas (TCGA) project by using cBioPortal. The expression
levels of four sample categories, normal tissues (n=41), tumor
tissues (n=389), tumor tissues with wild-type p53 (n=149), and
tumor tissues with mutant p53 (n=114), were compared using
Mann-Whitney U tests. We filtered candidates on the basis of the
following criteria: i) a median expression level of normal tissues
higher than the median expression level of tumor tissues
(p<0.05); ii) a median expression level of p53 wild-type
tumor tissues higher than the median expression level of p53
mutant tumor tissues (p<0.05). All analyses were performed with
the EZR program (15).
Plasmid construction
cDNA fragments of MICALL1 or CD2AP amplified with
KOD-plus DNA polymerase (Toyobo, Osaka, Japan) were cloned into the
pCAGGS expression vector. The primers used for amplification are
shown in Table I.
 | Table ISequence of primers and
oligonucleotides. |
Table I
Sequence of primers and
oligonucleotides.
| siRNA | Sense | Antisense |
|---|
| siMICALL1-1 |
GGACAAUGUCUUCGAGAAUTT |
AUUCUCGAAGACAUUGUCCTT |
| siMICALL1-2 |
CCACAAAGAAGGCCACCAATT |
UUGGUGGCCUUCUUUGUGGTT |
| sip53 |
GACUCCAGUGGUAAUCUACTT |
GUAGAUUACCACUGGAGUCTT |
| siEGFP |
GCAGCACGACUUCUUCAAGTT |
CUUGAAGAAGUCGUGCUGCTT |
|
| qPCR | Forward | Reverse |
|
| MICALL1 |
TTGGAAGCCATGATCAAGAA |
CCCTTCTTCTTGCCCTCAG |
| β-actin |
CCCTGGAGAAGAGCTACGAG |
TGAAGGTAGTTTCGTGGATGC |
| RE1 (ChIP) |
GGAGACAGTCAAACTGGAACTTT |
CCTTAATTCAGTGCTGTTTTGTTTT |
|
| Cloning | Forward | Reverse |
|
| MICALL1 |
AAAGAATTCGGGGTCATGGCTGGGCCGCG |
AAACTCGAGGCTCTTGTCTCTGGGGGACT |
| CD2AP |
AAAGGTACCCCCAGCATGGTTGACTATATTG |
AAACTCGAGAGAAGACAGGACAGCTTTTTTCAGCTTCTC |
| p53BS |
AAACTCGAGGGAGACAGTCAAACTGGAACTTT |
AAAGATATCCCTTAATTCAGTGCTGTTTTGTTTT |
| RE1mt | AGTTTTTAACTCCTG
GCCTTGGCTCCC |
AAAACAACCTGGGCAATATAGGGAGAC |
| RE2mt |
CACTGTTCCTGGCCCCATTTCTTAATT |
GCTAATACCTGTAATCCCAACACTTTG |
Quantitative real-time PCR
Total RNA from human cell lines was extracted with
RNeasy Plus Mini kit (Qiagen, Valencia, CA, USA) according to the
manufacturer's protocol. Complementary DNAs were synthesized with
superscript III reverse transcriptase (Invitrogen). Quantitative
real-time PCR was performed with SYBR Green Master Mix and a Light
Cycler 96 (Roche, Basel, Switzerland). Primer sequences are shown
in Table I. The PCR cycling
condition were as follows: initial melting at 95°C for 5 sec,
followed by 45 cycles at 55°C for 10 sec and 72°C for 10 sec.
Analysis of the melting curve for the primers was conducted to
confirm the specificity of the PCR product.
Western blot analysis
Cells were harvested and lysed with RIPA buffer
containing 1 mM PMSF, 0.1 mM DTT, and 0.1% Calbiochem Protease
Inhibitor Cocktail set III, EDTA-free (Merck Millipore, Darmstadt,
Germany). The lysed samples were sonicated with a 30 sec on/30 sec
off cycle for 15 min with a Bioruptor UCD-200 (Cosmobio, Tokyo,
Japan). The cell lysates were centrifuged at 14,000 × g for 15 min
and boiled after addition of SDS sample buffer (Bio-Rad, Hercules,
CA, USA). Each sample was separated by SDS-PAGE and transferred to
nitrocellulose membranes that were blocked using 5% skim milk
(198-1-605, wako Pure Chemical Industries, Tokyo, Japan). Membranes
were incubated at 4°C overnight with a mouse monoclonal
anti-MICALL1 antibody (1:100, sc-398397, Santa Cruz Biotechnology,
Santa Cruz, CA, USA), a rabbit monoclonal anti-CD2AP antibody
(1:100, sc-9137, Santa Cruz Biotechnology), a rabbit monoclonal
anti-FLAG antibody (1:2000, F7425, Sigma-Aldrich), a rat monoclonal
anti-HA antibody (1:2000, 3F10, Sigma-Aldrich), a mouse monoclonal
anti-p53 antibody (1:1000, DO-1, Santa Cruz Biotechnology), a mouse
monoclonal anti-p21 antibody (1;100, OP64, Merck Millipore), or a
mouse monoclonal anti-β-actin antibody (1:1000, AC-15, Abcam,
Cambridge, MA, USA). Membranes were washed and probed with the
secondary antibody conjugated to horseradish peroxidase against
mouse, rabbit, or rat (all 1:30000, Santa Cruz Biotechnology, ref
sc-2005, sc-2004 and sc-2006, respectively). Finally, proteins were
visualized by chemiluminescent detection (Amersham ECL Western
Blotting Detection Reagent (GE Health Care, Freiburg, Germany).
Co-immunoprecipitation
Protein-protein interactions were investigated by
co-immunoprecipitation experiments. HA-tagged MICALL1 proteins and
FLAG-tagged CD2AP proteins were expressed in HEK293T cells with
Fugene6 (E2692, 30 µl per dish, Promega). The cells were
harvested after 36 h of transfection and lysed for one hour with
0.5% NP40 buffer containing 50 mM Tris pH 7.4, 150 mM NaCl and
protease inhibitor cocktail. Whole cell extracts were subjected to
immunoprecipitation overnight with anti-Flag (Sigma-Aldrich) and
anti-HA (Sigma-Aldrich) antibodies cross-linked to agarose beads at
4°C. Endogenous protein interactions in HCT116
p53+/+ cells were also assessed by
immunoprecipitation experiments using an anti-MICALL1 antibody
(Santa Cruz Biotechnology). HCT116 p53+/+ cells
were incubated in 100-mm dishes and treated with 2 µg/ml
ADR. After incubation for 48 h, the cells were harvested and lysed
for one hour with the same buffer cocktail described above. The
samples were incubated overnight with a mouse anti-MICALL1 antibody
at 4°C. The exogenous and endogenous immunoprecipitates were
separated by SDS-polyacrylamide gel electrophoresis (SDS-PAGE) and
immunoblotted using antibodies against MICALL1 and CD2AP.
Gene reporter assay
A DNA fragment including two potential p53 binding
sequences of MICALL1 was amplified and cloned into the pGL4.24
vector (Promega). For mutagenesis, point mutations were introduced
with site-directed mutagenesis at the 4th and 14th nucleotides (C
to T mutations) and the 7th and 17th nucleotides (G to T mutations)
within the consensus p53 binding sequence (16). Reporter assays were performed using
a Dual Luciferase Assay system (pGL3-promoter) (Promega) or
Dual-Glo Luciferase Assay System (pGL4.24) (Promega), as previously
described (17). The sequences of
the primers used for amplification and site-directed mutagenesis
are shown in Table I. Cells were
not treated with Adriamycin in this experiment.
Chromatin immunoprecipitation assay
We carried out a Chromatin immunoprecipitation
(ChIP) assay with an EZ-Magna ChIP G Chromatin Immunoprecipitation
kit (Merck Millipore), per the manufacturer's protocol. H1299 cells
(1×10⁶ cells per samples) infected with Ad-p53 or
Ad-LacZ at a MOI of 10 were cross-linked with 1% form-aldehyde for
10 min, washed with PBS, and lysed using nuclear lysis buffer. The
sample lysates were sonicated with a Bioruptor UCD-200 (CosmoBio),
and DNA was sheared to 200–1000 base pair. Each sample was
immunoprecipitated with an anti-p53 antibody (OP-40; Merck
Millipore) or normal mouse IgG (sc-2025; Santa Cruz Biotechnology).
Column-purified DNA was quantified by qPCR. Cells were not treated
with Adriamycin in this experiment.
Immunocytochemistry
HCT116 p53−/− or
p53+/+ cells were grown on cover glasses,
transfected with Lipofectamine RNAiMAX (Thermo Fisher Scientific)
for 36 h and fixed with 4% paraformaldehyde (163-20145-500 ml,
Wako) for 10 min. The fixed cells were permeabilized with 0.2%
Triton X100 in PBS (both from Sigma-Aldrich, ref X100-6X500ML and
P4417-100TAB, respectively) for 5 min. Cells were blocked with
blocking buffer [0.2% Triton X-100 and 3% BSA (bovine serum
albumin, 001-000-162, Jackson Immunoresearch Laboratories, Inc.,
West Grove, PA, USA), in PBS 1X] for 1 h. After that, cells were
incubated with mouse monoclonal anti-MICALL1 antibody (1:50,
sc-398397, Santa Cruz Biotechnology) and rabbit monoclonal
anti-CD2AP antibody (1:50, sc-9137, Santa Cruz Biotechnology) or
rabbit monoclonal anti-RAB8A (1:200, #6975, Cell Signaling
Technology) in staining solution (0.2% Triton X-100 and 3% BSA in
PBS) for 2 h at room temperature. After washes with PBS, cells were
incubated with a goat anti-mouse-Alexa Fluor 594- and a goat
anti-rabbit-Alexa Fluor 488-labeled secondary antibodies (both
1:2000, from Thermo Fisher Scientific, ref A-11008 and A-11005),
prepared in staining solution for 1 h at room temperature. Nuclei
were stained with DAPI (H1200, Vector Laboratories, Youngstown, OH,
USA) for 25 min and visualized with FluoView FV1000 confocal
microscope (Olympus, Tokyo, Japan).
Colony formation assay
HCT116 cells were plated at 1×10⁴ cells
per 35-mm culture well one day before transfection with MICALL1. On
the second day after transfection, the culture medium was replaced
by one containing 0.5 mg/ml G418 (G-418 Sulfate, 070-05183, Wako)
every 2 days. Surviving colonies were fixed with methanol and
stained with 1% crystal violet, and visible colonies were
counted.
Results
Induction of MICALL1 by cellular
stress
To identify novel p53 targets that play important
roles in colorectal carcinogenesis, we previously performed
transcriptome and proteome analyses using HCT116
p53+/+ and p53−/− cells
(18,19). After treatment with 2 µg/ml
ADR for 2 h, cells were harvested at different time points; i.e.,
12, 24, 48 and 72 h (72 h only for samples used for mass
spectrometry). Cells without ADR treatment were used as
controls.
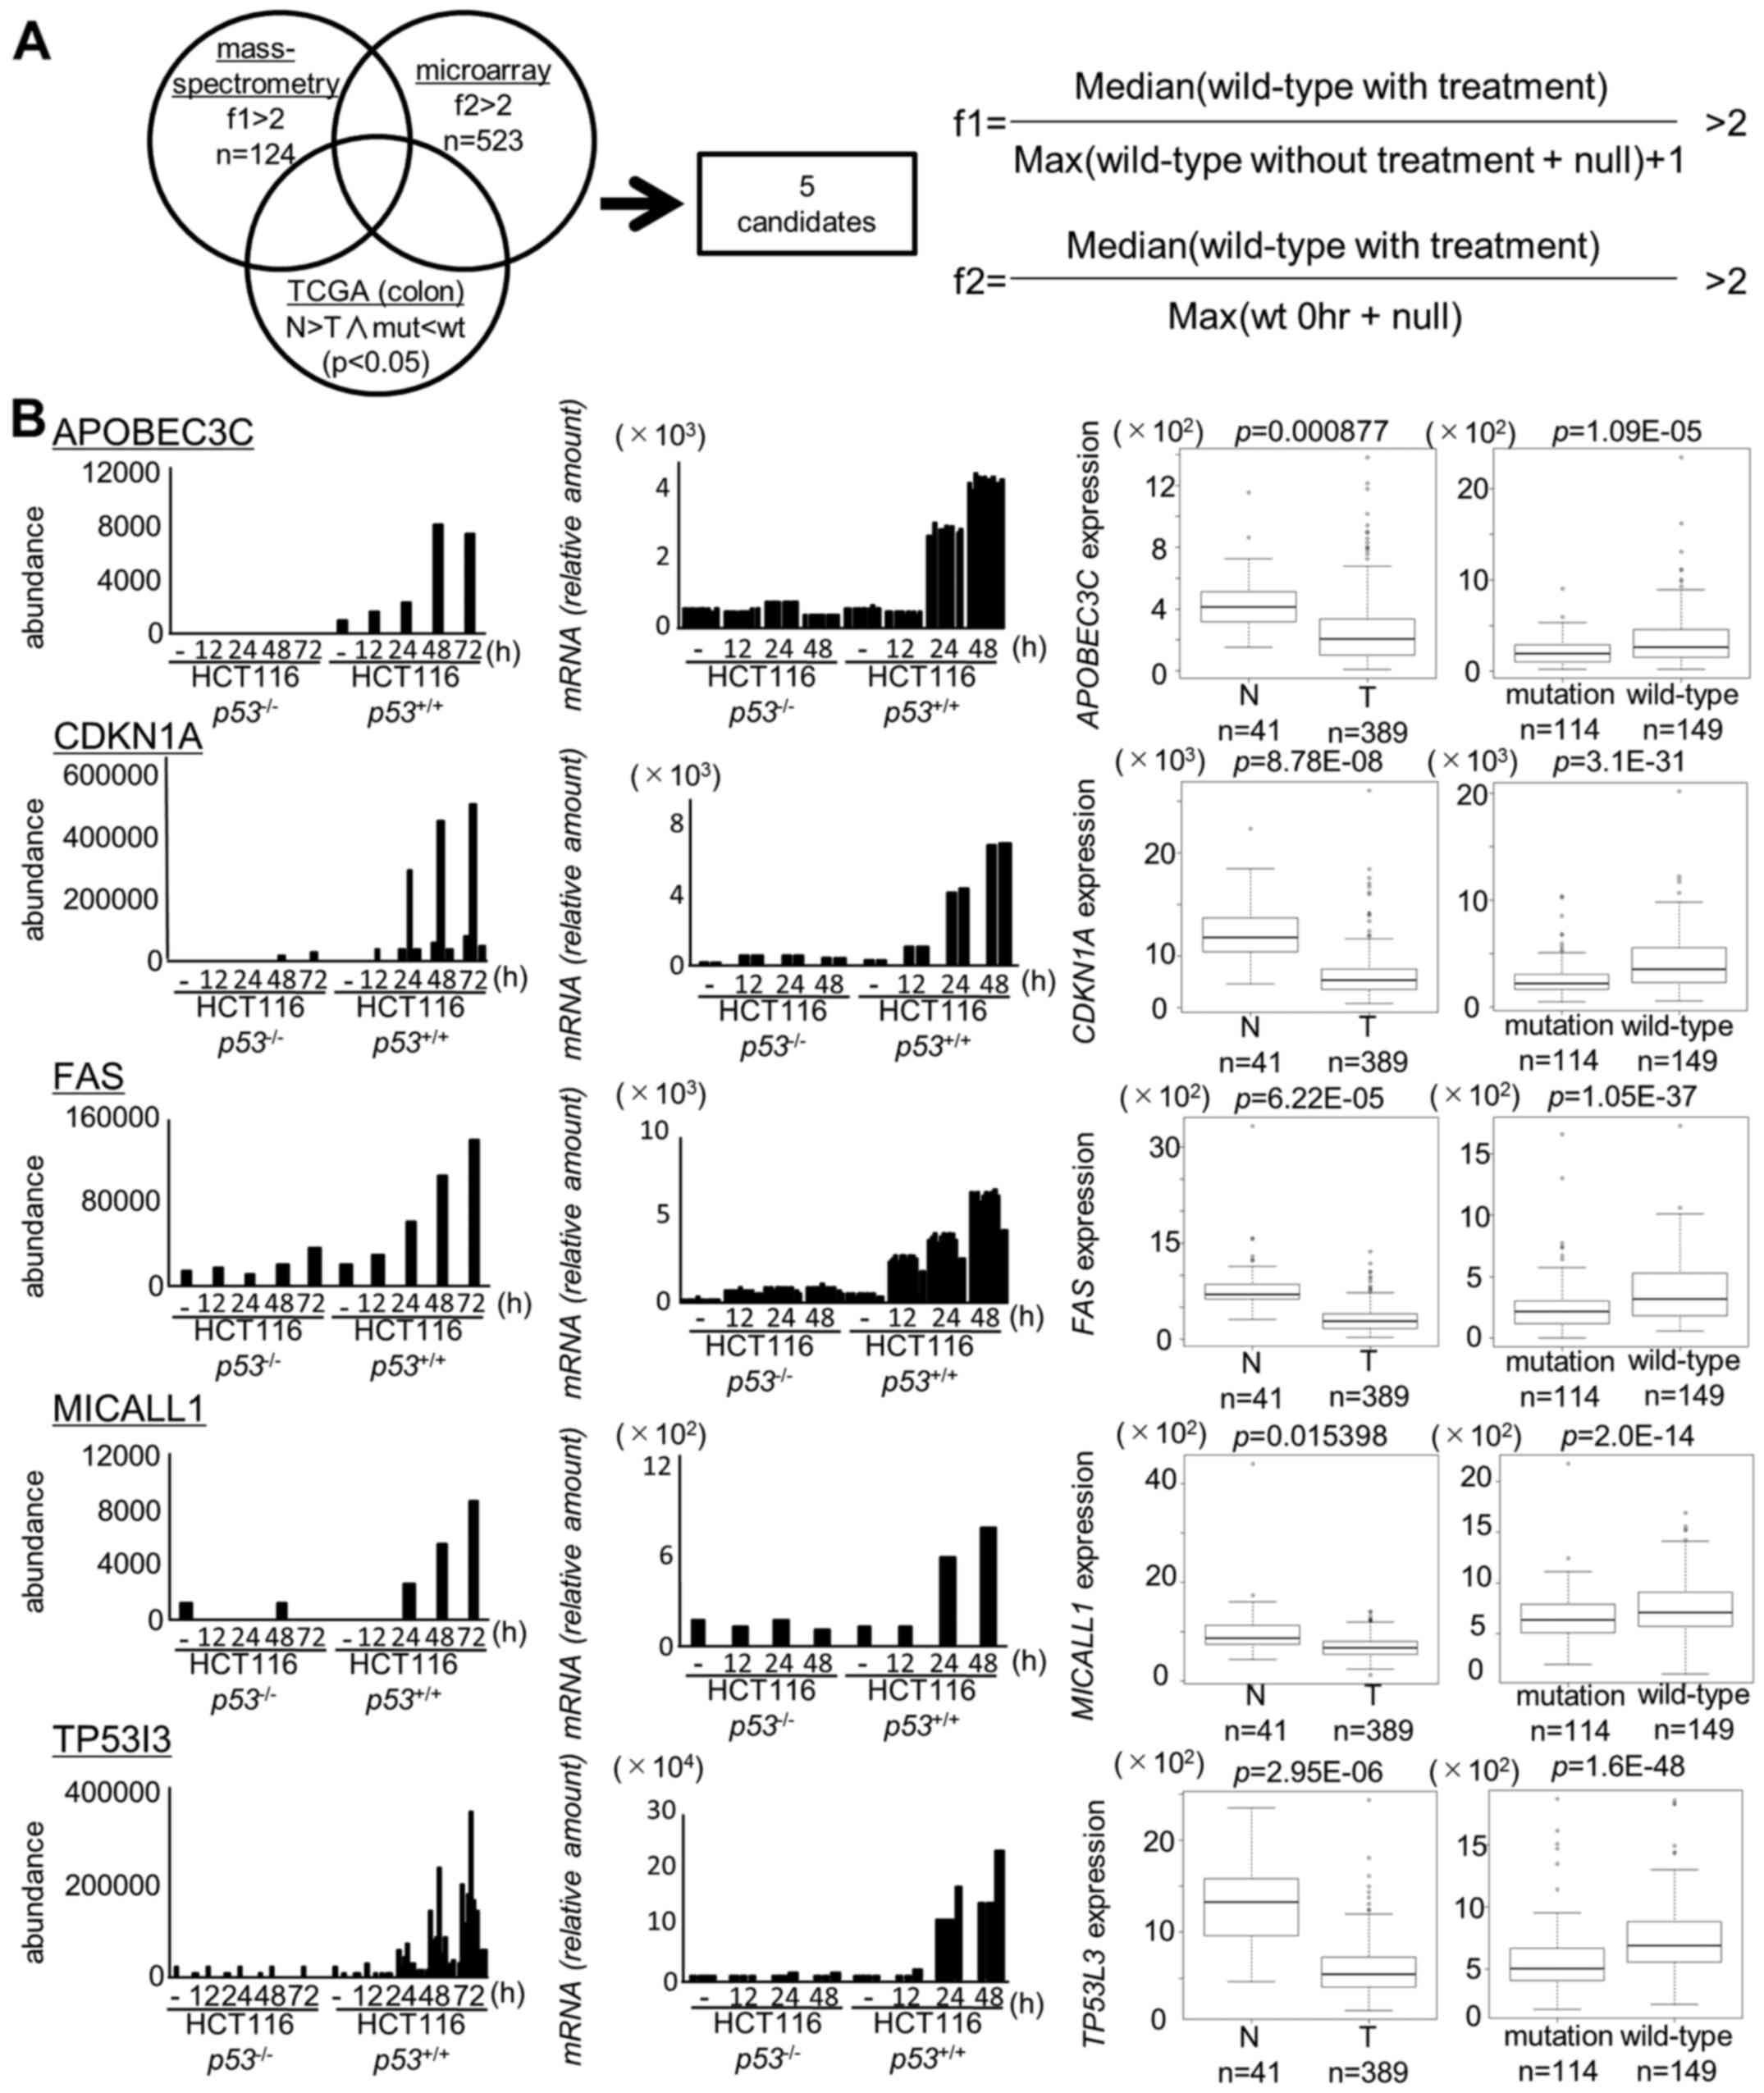
We identified 124 candidates on the basis of the
proteome analysis at f1 >2 (p<0.05, Table II) and 523 candidates on the basis
of the transcriptome analysis at f2 >2 (p<0.05, Table III). Ultimately, we identified 28
genes through mass spectrometry and microarray screening.
| Table IICandidates from mass spectrometry
data. |
Table II
Candidates from mass spectrometry
data.
| Protein | Fold induction | CST3 | 3.5 | IBTK | 2.5 | PSAT1 | 8155.1 |
|---|
| A2M | 4776.6 | CTSD | 2.3 | ICA1L | 2.2 | PSPH | 2.5 |
| AARS | 2.3 | DDB2 | 18.9 | IGHM | 29185.6 | RAC2 | 17334.9 |
| ACOT7 | 2.6 | DGKA | 733.0 | IKBIP | 2.2 | RAN | 3.8 |
| ACTC1 | 7529.5 | DHX9 | 22436.4 | INPP1 | 5.3 | RHOC | 3.2 |
| AK1 | 11361.7 | DOHH | 2.5 | ISG15 | 23278.4 | RNH1 | 2.1 |
| AKR1A1 | 12455.7 | EEF1A1 | 16457.0 | ISYNA1 | 2.6 | RRM2B | 1296.7 |
| ALDH1A3 | 2.3 | EIF4G2 | 3.0 | KIAA0284 | 1356.2 | S100A13 | 9890.4 |
| ALDOA | 2.9 | EPPK1 | 130023.0 | KRT1 | 2.7 | S100A2 | 4.5 |
| ANXA4 | 11.6 | EPS8L2 | 30581.1 | KRT15 | 3534.4 | S100A6 | 2.2 |
| APOB | 2744.6 | FABP5 | 2.1 | KRT20 | 1590.2 | SARS | 6.6 |
| APOBEC3C | 5.9 | FAM129B | 3.1 | KRTAP2-2 | 14236.0 | SEC31A | 3710.3 |
| APOC3 | 3.2 | FAS | 2.5 | LARS | 2.4 | SERPINB1 | 2.4 |
| ARF5 | 3.1 | FBXO2 | 3.5 | LGALS3BP | 2.9 | SERPINB5 | 13228.3 |
| ARVCF | 2032.4 | FCN3 | 14826.8 | MAP1S | 527.0 | SERPINE1 | 2.7 |
| ASS1 | 4130.2 | FDXR | 2870.3 | MDM2 | 2628.4 | SFN | 3.3 |
| BLVRB | 12875.3 | FGA | 4701.4 | MICALL1 | 3.3 | SNX2 | 2.5 |
| C12orf23 | 2.3 | FLNA | 17199.7 | NPEPPS | 1289.0 | STAT1 | 3.8 |
| C4BPA | 3.5 | FLNC | 15972.6 | NSF | 4200.4 | STAT3 | 5728.8 |
| CA2 | 820.7 | FN1 | 163688.8 | NTPCR | 11802.5 | TERF2IP | 4.7 |
| CAPG | 2.8 | FSCN1 | 3780.2 | NUP54 | 2.3 | TIGAR | 7.0 |
| CASP8 | 2.7 | GAA | 875.9 | OPTN | 1665.6 | TKT | 2.5 |
| CCNDBP1 | 2.8 | GAST | 4742.3 | OR1E2 | 2942.6 | TOP1 | 481.2 |
| CDKN1A | 33800.2 | GDF15 | 19719.2 | PEPD | 2.2 | TP53 | 82559.3 |
| CEACAM1 | 2916.0 | GSS | 3.3 | PIR | 5.0 | TP53I3 | 68584.0 |
| CFL1 | 2.1 | GSTP1 | 4.2 | PML | 4518.9 | TUBA1A | 6062.4 |
| CLTC | 2.7 | HADHA | 2.5 | PNP | 6.3 | UBE2L6 | 2432.5 |
| CMBL | 3.6 | HARS | 15435.0 | PODXL | 4.5 | UMPS | 4894.2 |
| CMPK1 | 2.2 | HEBP1 | 2.5 | PPM1A | 2.1 | VWF | 76930.1 |
| COPG1 | 1078.7 | HLA-B | 2.4 | PRDX1 | 1088.3 | YWHAB | 2.4 |
| CRIP2 | 2.7 | HSPA4L | 13458.7 | PRKRA | 2.1 | YWHAG | 6.5 |
| Table IIICandidates from microarray data. |
Table III
Candidates from microarray data.
| Gene | Fold induction | COL2A1 | 25.2 | GNAS | 2.3 |
LOC390660 | 3.4 | PRINS | 4.5 |
SIGLEC14 | 14.1 |
|---|
| ABCA1 | 15.6 | CORO2A | 2.3 | GNMT | 2.5 |
LOC440149 | 2.8 | PRKX | 2.1 | SLC11A1 | 7.0 |
| ABCA12 | 10.2 | CRIP2 | 2.4 | GPC5 | 3.9 |
LOC643401 | 3.8 | PROC | 2.6 | SLC12A4 | 2.1 |
| ABCA3 | 3.2 | CRYBA1 | 3.6 | GPR124 | 2.5 |
LOC643401 | 5.4 | PRODH | 9.2 | SLC44A4 | 8.2 |
| ABCB9 | 3.6 | CSH1 | 4.2 | GPR153 | 2.1 |
LOC643401 | 4.3 | PROM2 | 10.2 | SLC4A11 | 2.5 |
| ABCD1 | 3.1 | CST3 | 2.4 | GPR56 | 2.8 |
LOC646268 | 3.5 | PRSS56 | 2.2 | SLC6A14 | 2.7 |
| ABCG4 | 3.3 | CST5 | 2.1 | GPR87 | 7.5 |
LOC728978 | 25.9 | PSAPL1 | 3.6 | SLC7A10 | 4.3 |
| ACER2 | 2.4 | CSTA | 2.5 | GPRIN2 | 2.0 |
LOC729770 | 2.4 | PSTPIP2 | 2.1 | SLCO2B1 | 2.6 |
| ACP5 | 2.2 | CTAG1A | 2.2 | GRAP | 2.1 |
LOC730227 | 5.1 | PTAFR | 4.9 | SMTNL2 | 11.3 |
| ACSL6 | 5.4 | CXCL11 | 5.6 | GRHL3 | 2.7 | LOXL4 | 3.1 | PTGES | 2.3 | SNAI3 | 6.4 |
| ACTA2 | 12.4 | CXCR2 | 5.1 | GRID2IP | 2.1 | LPHN3 | 2.2 | PTH1R | 3.7 | SORCS2 | 439.0 |
| ADAMTS8 | 4.9 | CXorf65 | 9.0 | GRIN2C | 10.1 | LRP1 | 2.4 | PTPRE | 2.4 | SPANXB2 | 2.1 |
| ADCK3 | 2.9 | CYFIP2 | 5.0 | GRIN3B | 4.6 | LRP10 | 2.3 | PTPRU | 2.7 | SPNS2 | 2.5 |
| ADRB2 | 9.7 | CYP4F12 | 2.2 | H19 | 26.3 | LSP1 | 7.9 | PVRL4 | 9.9 | SPNS3 | 2.3 |
| AK1 | 2.2 | CYP4F2 | 2.3 | HAR1B | 2.3 | LY6D | 6.5 | PVT1 | 2.1 | SPRY1 | 2.1 |
| AKR1B10 | 27.4 | CYP4F3 | 10.5 | HEG1 | 2.1 | LYL1 | 4.6 | PXDN | 3.7 | SRGAP3 | 4.7 |
| AKR1B15 | 22.0 | DDB2 | 2.7 | HES2 | 2.5 | LYNX1 | 2.6 | Q6TXG5 | 12.6 |
ST6GALNAC2 | 2.5 |
| ALDH1L1 | 3.7 | DDIT4 | 2.4 | HES6 | 2.5 | LYZL4 | 22.9 | Q8E8P5 | 4.1 | STARD10 | 2.1 |
| ALOX5 | 31.2 | DFNB31 | 2.4 | HHAT | 2.2 | MAGEA11 | 2.7 | RAB37 | 4.4 | STAT4 | 2.6 |
| AMOT | 2.6 | DGCR10 | 2.9 |
HLA-DQB1 | 2.5 | MAST4 | 3.9 | RABEPK | 2.1 | SULF2 | 29.0 |
| ANKMY1 | 3.0 | DIO3OS | 2.2 |
HLA-DRB4 | 2.9 | MBP | 3.8 | RALGDS | 2.8 | SULT1A2 | 2.1 |
|
ANKRD20A8P | 2.3 |
DKFZp451A211 | 2.6 |
HLA-DRB5 | 2.5 | MC1R | 2.2 | RASAL1 | 3.0 | SV2A | 2.1 |
| ANKRD43 | 5.1 | DLL1 | 2.2 |
HLA-DRB6 | 3.2 | MDFI | 2.0 | RASGRF1 | 2.1 | SYK | 4.2 |
| ANKRD58 | 2.3 | DMBT1 | 5.0 | HOGA1 | 2.2 | MDM2 | 4.5 | RASSF4 | 2.5 | SYNM | 2.5 |
| ANKRD65 | 4.4 | DNAH3 | 3.9 | HOXB13 | 2.0 | METTL7A | 2.2 | RD3 | 8.6 | SYT12 | 2.2 |
| ANKUB1 | 4.8 | DPEP2 | 2.6 | HRCT1 | 2.2 | MFSD4 | 2.6 | REEP2 | 4.0 | SULT1A2 | 2.1 |
| ANXA4 | 2.4 | DPYSL4 | 12.4 | HS3ST6 | 6.1 | MFSD6L | 2.8 | RET | 2.5 | SV2A | 2.1 |
| ANXA8L2 | 5.3 | DRAM1 | 2.7 | HSD17B1 | 2.9 | MGAT3 | 4.4 | RGL1 | 3.2 | SYK | 4.2 |
|
APOBEC3C | 3.9 | DRD2 | 2.1 | HSD17B7 | 2.1 |
MGC20647 | 17.5 | RGS16 | 3.2 | SYNM | 2.5 |
|
APOBEC3F | 4.0 | DSC3 | 5.5 | HSD3B1 | 9.4 | MICALL1 | 3.2 | RHOD | 3.4 | SYT12 | 2.2 |
|
APOBEC3H | 6.9 | DUOX1 | 4.4 | HSD3B2 | 2.6 | MLPH | 2.1 | RIC3 | 12.8 | SYT8 | 3.9 |
| APOC1 | 2.5 | DUSP13 | 8.6 | HSPB7 | 2.6 | MOV10L1 | 2.3 | RIIAD1 | 2.4 | SYTL1 | 2.8 |
| APOL2 | 2.2 | DUSP26 | 4.2 | HSPG2 | 2.8 |
MRPL23-AS1 | 8.1 | RIMBP3 | 2.1 | TAP1 | 3.9 |
| AQP3 | 2.5 | EBI3 | 4.0 | HTRA1 | 2.5 | MS4A15 | 2.3 | RIMS4 | 3.1 | TCERG1L | 2.4 |
| ARAP1 | 2.5 | EDN2 | 10.1 | HYAL1 | 2.7 | MTMR9LP | 2.6 | RIN1 | 2.8 | TCF15 | 2.1 |
| ARVCF | 5.1 | EFCAB10 | 3.9 | ICAM2 | 2.8 | MX1 | 4.2 | RINL | 2.3 | TDRD6 | 5.2 |
| ARX | 2.1 | EFNB1 | 2.4 | ICAM4 | 7.8 | MYBPHL | 22.1 | ROM1 | 2.3 | TFEC | 2.4 |
| ASS1 | 2.6 | EIF2AK4 | 2.2 | IFITM10 | 2.4 | MYH16 | 4.4 | ROR1 | 2.6 | TGM5 | 2.3 |
| ASTN2 | 3.0 | EIF4E3 | 2.6 | IGFBP3 | 15.9 | MYL10 | 2.4 | RPS27L | 2.5 | TLR3 | 6.0 |
| BAI1 | 2.6 | EMX1 | 2.9 | IKBIP | 3.8 | MYO1A | 5.6 | RRM2B | 4.2 |
TMEM151B | 3.4 |
| BBC3 | 7.2 | EPB49 | 2.2 | IL27 | 2.2 | MYO7A | 3.6 | RSPO1 | 2.4 | TMEM173 | 2.7 |
| BBS9 | 7.9 | EPN3 | 2.5 | IL4I1 | 5.4 | NACAD | 2.5 | RYR1 | 5.9 |
TMEM229B | 2.7 |
| BDKRB2 | 2.2 | EPPK1 | 3.8 | INPP5D | 13.4 | NADSYN1 | 4.0 | S1PR4 | 4.0 | TMEM40 | 2.8 |
| BLNK | 2.1 | EPS8L2 | 4.7 | ISG15 | 2.6 | NDN | 3.2 | SAC3D1 | 2.2 | TMEM52 | 2.4 |
| BMP7 | 3.1 | ERAP2 | 2.9 | ISYNA1 | 2.9 | NHLH2 | 2.8 | SATB1 | 4.2 | TMEM8B | 2.7 |
| BTG2 | 6.5 | ERN2 | 2.2 | ITGA4 | 2.6 | NINJ1 | 4.2 | SCARF2 | 2.3 | TNFAIP8 | 2.7 |
|
C12orf45 | 2.1 | ETV7 | 24.6 | ITGB2 | 4.0 | NLRP13 | 3.1 |
SCARNA9L | 2.6 |
TNFRSF10C | 26.5 |
| C12orf5 | 2.2 | EXD3 | 2.4 | ITLN2 | 2.4 | NLRX1 | 3.1 | SCGB1D1 | 5.6 |
TNFRSF14 | 18.7 |
|
C14orf176 | 2.3 | EXOC3L4 | 2.6 | IZUMO1 | 3.7 | NODAL | 3.5 | SCGB1D2 | 10.6 | TNNC2 | 9.0 |
| C16orf5 | 6.2 | EYA1 | 4.3 | IZUMO4 | 2.0 | NOTCH1 | 2.1 | PVT1 | 2.1 | TNNI2 | 7.2 |
|
C17orf109 | 3.1 | F10 | 2.0 | KANK3 | 3.6 | NPPC | 4.0 | PXDN | 3.7 | TP53 | 2.7 |
|
C17orf82 | 2.3 | FAM167A | 2.0 | KCNB1 | 7.4 | NPTX1 | 4.0 | Q6TXG5 | 12.6 | TP53I11 | 3.6 |
|
C1orf170 | 2.7 | FAM183A | 4.4 | KCNF1 | 5.4 | NR1I2 | 8.5 | Q8E8P5 | 4.1 | TP53I3 | 16.1 |
|
C1orf187 | 5.9 | FAM183B | 3.2 | KCNIP2 | 2.0 | NRG1 | 2.8 | RAB37 | 4.4 |
TP53INP1 | 4.5 |
| C1S | 4.5 | FAM184A | 2.2 | KCNJ12 | 3.8 | NRG2 | 2.5 | RABEPK | 2.1 | TPSD1 | 2.0 |
|
C20orf108 | 4.6 | FAM198B | 3.6 | KCNK7 | 4.8 | NRP2 | 2.9 | RALGDS | 2.8 | TRANK1 | 2.5 |
| C2orf88 | 2.8 | FAM71B | 4.7 | KCTD11 | 2.3 | NTN1 | 9.1 | RASAL1 | 3.0 | TREH | 2.3 |
| C3P1 | 2.9 | FAM87B | 3.8 | KEL | 19.5 | NUAK2 | 2.6 | RASGRF1 | 2.1 | TREM2 | 12.2 |
| C4B | 3.8 | FAM92B | 3.9 |
KIAA0247 | 2.8 | NUDT8 | 2.3 | RASSF4 | 2.5 | TREML1 | 5.0 |
|
C6orf154 | 2.2 | FAS | 4.0 |
KIAA1324 | 4.3 | NUPR1 | 8.5 | RD3 | 8.6 | TRIM22 | 2.4 |
|
C9orf135 | 3.4 | FBLIM1 | 2.7 |
KIAA1751 | 3.9 | ODF3L1 | 4.5 | REEP2 | 4.0 | TRIM29 | 2.5 |
|
C9orf169 | 2.1 | FBLN2 | 2.4 | KLHL30 | 24.1 | ODZ4 | 3.2 | RET | 2.5 | TRIM55 | 2.3 |
| CA12 | 2.8 | FCER1A | 2.2 | KNDC1 | 2.8 | ORAI3 | 3.0 | RGL1 | 3.2 | TRPM6 | 2.2 |
| CACNA1I | 2.1 | FCGBP | 2.5 | KRT17 | 9.1 | OSBPL7 | 2.3 | RGS16 | 3.2 | TRPV6 | 4.2 |
| CAMK2B | 3.1 | FCHSD2 | 2.1 | KRT5 | 10.3 | OTP | 5.1 | RHOD | 3.4 | TSGA10 | 2.4 |
| CARNS1 | 4.2 | FCRLA | 2.0 | LACC1 | 2.0 | P2RY2 | 2.0 | RIC3 | 12.8 | TSPAN10 | 3.4 |
| CASP1 | 2.2 | FDXR | 4.3 | LAMP3 | 5.1 | PADI3 | 9.5 | RIIAD1 | 2.4 | TSPAN11 | 2.2 |
| CASP10 | 3.7 | FLG | 11.0 | LANCL3 | 2.2 | PADI4 | 5.3 | RIMBP3 | 2.1 | TSPAN18 | 2.2 |
| CASZ1 | 3.3 |
FLJ30838 | 2.1 | LAPTM5 | 4.7 | PARP10 | 4.1 | RIMS4 | 3.1 | UCN3 | 2.1 |
| CBS | 21.6 |
FLJ32255 | 7.7 | LARGE | 2.2 | PCDHAC1 | 10.2 | RIN1 | 2.8 | UCP2 | 2.1 |
| CCDC108 | 4.6 |
FLJ36000 | 2.3 | LCE1B | 10.3 | PDE6C | 5.4 | RINL | 2.3 | UNC45B | 2.5 |
|
CCDC144A | 2.1 |
FLJ37786 | 2.3 | LCE1C | 45.4 | PDGFRB | 4.0 | ROM1 | 2.3 | UNC5B | 2.1 |
| CCDC3 | 3.5 |
FLJ41350 | 3.0 | LCN15 | 25.1 | PDYN | 3.2 | ROR1 | 2.6 | USH1G | 2.2 |
| CD36 | 4.5 |
FLJ42969 | 2.1 | LCN2 | 2.1 | PHLDA3 | 5.5 | RPS27L | 2.5 | USHBP1 | 2.2 |
| CD72 | 4.2 |
FLJ43663 | 2.6 | LDLRAD1 | 13.3 | PHLDB3 | 2.2 | RRM2B | 4.2 | USP29 | 3.1 |
| CD79B | 2.9 |
FLJ44896 | 22.6 | LEMD1 | 3.3 | PIDD | 4.1 | RSPO1 | 2.4 | VIL1 | 6.8 |
| CD82 | 6.7 | FLT3LG | 2.7 | LGALS7 | 8.8 | PKNOX2 | 2.3 | RYR1 | 5.9 | WDR63 | 7.0 |
| CDH16 | 15.0 | FOXP1 | 2.2 | LGALS9 | 5.2 | PLA2G4C | 2.2 | S1PR4 | 4.0 | WNT11 | 4.0 |
| CDKN1A | 8.0 | FP588 | 2.3 | LGALS9C | 12.8 | PLA2G4D | 6.6 | SAC3D1 | 2.2 | WNT4 | 4.4 |
| CDSN | 3.3 | FRMPD2 | 2.2 | LHFPL1 | 2.4 | PLCL2 | 9.6 | SATB1 | 4.2 | WNT7A | 3.8 |
| CEACAM1 | 6.9 | FXYD2 | 6.4 |
LINC00087 | 2.0 | PLK3 | 3.4 | SCARF2 | 2.3 | WNT7B | 3.3 |
| CELA3B | 2.1 | FXYD3 | 3.9 |
LINC00320 | 2.1 | PLK5 | 2.5 |
SCARNA9L | 2.6 | XG | 2.9 |
| CFTR | 5.0 | GABRE | 3.6 |
LINC00324 | 2.0 | PLXNB1 | 2.3 | SCGB1D1 | 5.6 |
XLOC_004323 | 3.7 |
| CGB | 2.7 | GADD45G | 2.2 |
LOC100133669 | 4.5 | PLXNB3 | 6.0 | SCGB1D2 | 10.6 |
XLOC_011803 | 2.5 |
| CHD2 | 2.2 | GDF15 | 5.7 |
LOC100289026 | 8.4 | PML | 3.1 | SCN3B | 4.1 |
XLOC_l2_000159 | 3.7 |
| CHGA | 2.9 | GGTLC1 | 2.1 |
LOC100506305 | 2.1 |
PNLIPRP2 | 5.1 | SDPR | 4.3 |
XLOC_l2_010751 | 8.0 |
| CHI3L2 | 2.4 | GGTLC2 | 2.6 |
LOC151760 | 3.0 | PODXL | 3.3 | SEMA3B | 4.3 |
XLOC_l2_014832 | 2.1 |
| CHRNA6 | 3.0 | GH1 | 3.2 |
LOC283050 | 2.5 | POLH | 2.9 | SEMA3F | 2.9 | XPC | 2.5 |
| CKM | 4.5 | GH2 | 15.1 |
LOC283710 | 5.7 | POU2AF1 | 4.5 |
SERPINA11 | 2.3 | ZMAT3 | 4.2 |
| CLCA2 | 6.0 | GIMAP5 | 2.3 |
LOC284837 | 2.1 | POU3F2 | 2.6 |
SERPINB4 | 2.6 | ZNF658 | 2.2 |
| CMBL | 3.6 | GJD3 | 6.1 |
LOC285548 | 2.1 | PPY | 2.9 |
SERPINB5 | 2.3 |
ZNF664-FAM101A | 3.3 |
| CMKLR1 | 2.8 | GLIPR2 | 2.1 |
LOC375295 | 2.3 | PPY2 | 2.3 |
SERPINE1 | 3.1 | ZNF69 | 2.8 |
| COBLL1 | 2.2 | GLS2 | 3.7 |
LOC388242 | 3.3 | PRAMEF3 | 2.1 | SESN1 | 5.5 | ZNF850 | 2.3 |
| COL17A1 | 4.0 | GMFG | 2.1 |
LOC388780 | 4.0 | PRDM1 | 8.8 | SH3TC1 | 2.1 | | |
We then further screened these 28 genes by using a
TCGA dataset consisting of 624 colorectal tumor samples. We
selected genes as follows; i) significantly (p<0.05) higher
expression in normal colon tissues than in tumor tissues and ii)
significantly (p<0.05) higher expression in tumor tissues with
wild-type p53 than in tissues with mutant p53
(Fig. 1).
As a result, two novel p53 targets (MICALL1 and
APOBEC3C) and three known p53 targets (CDKN1A, FAS, TP53I3) were
identified in our screening (Fig.
1B). Among the two novel candidates, induction of MICALL1 was
validated by both qPCR and western blotting (Fig. 2A and B). Therefore, we selected
MICALL1 for further analysis. We also found that MICALL1 was
induced in H1299 cells infected by Ad-p53 but not in
Ad-LacZ-infected cells (Fig.
2C).
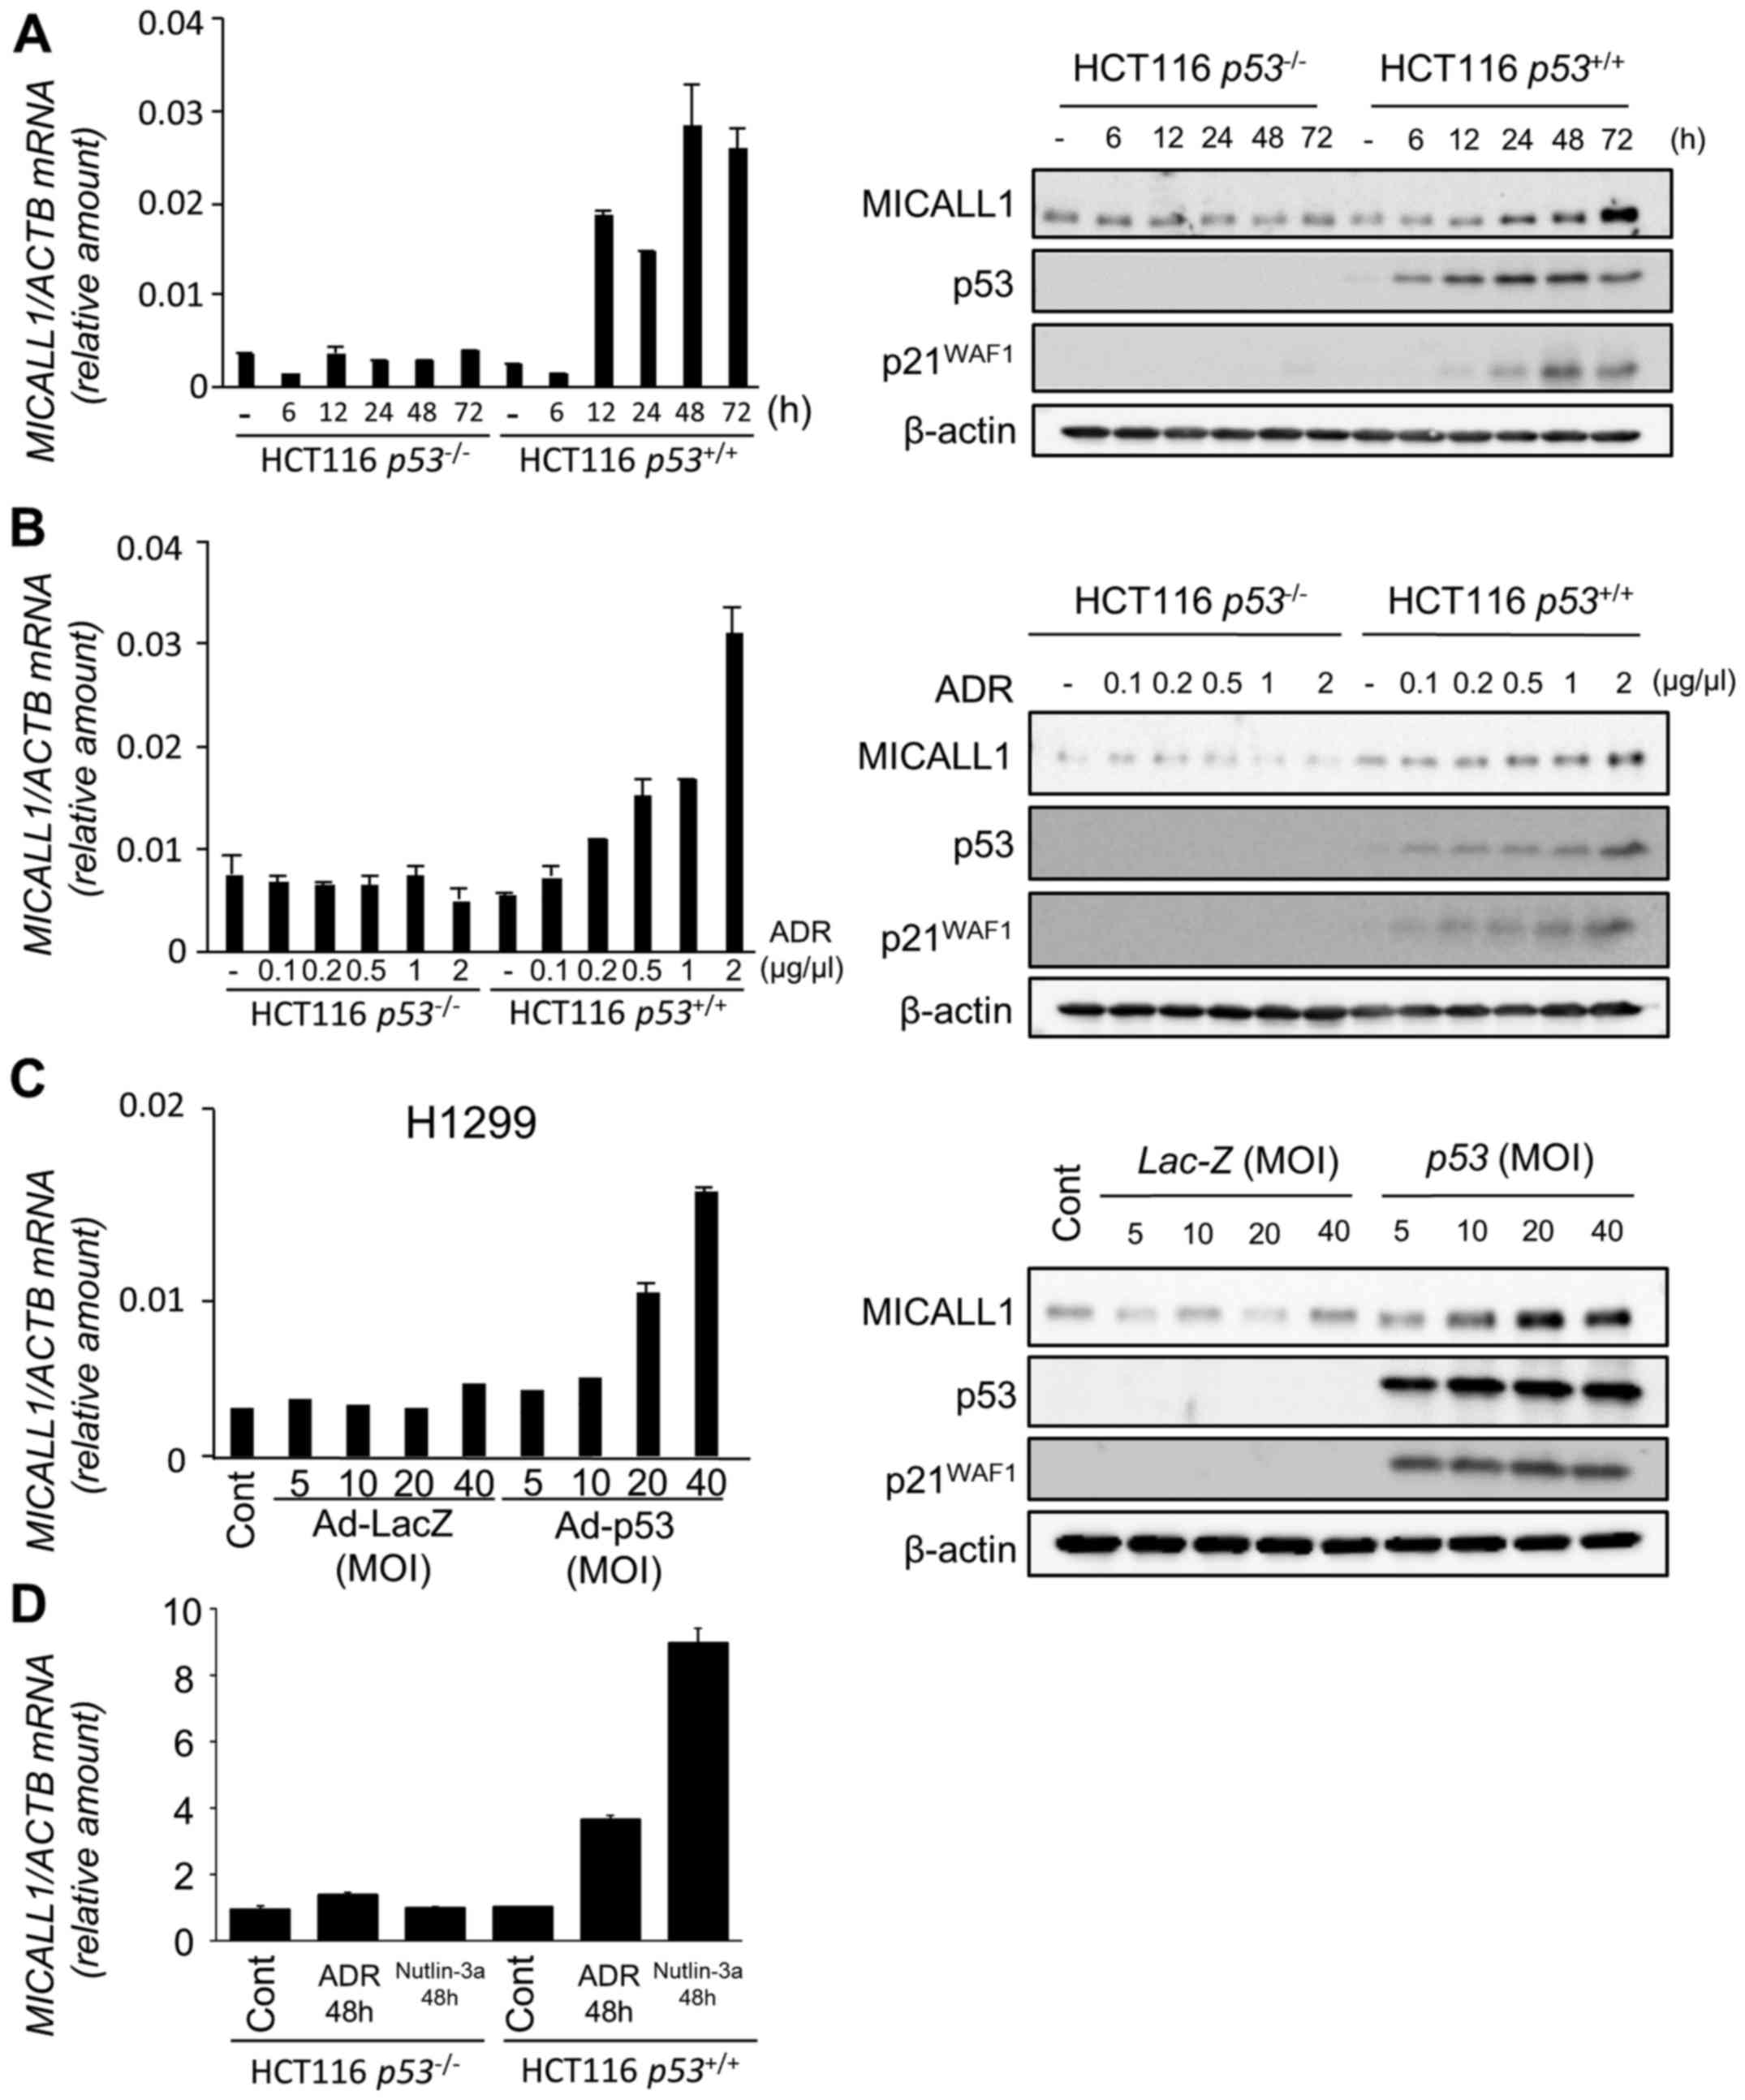 | Figure 2Induction of MICALL1 by DNA damage
and p53. (A) (Left panel) Quantitative real-time PCR (qPCR)
analysis of MICALL1 in HCT116 p53−/− or
p53+/+ cells harvested at the indicated times
after 2 µg/ml adriamycin (ADR) treatment for 2 h. β-actin
was used for normalization of expression levels. Error bars
represent the SD (n=2). (Right panel) HCT116
p53−/− or HCT116 p53+/+ cells
were treated with 2 µg/ml ADR for 2 h. At the indicated
times after treatment, whole cell extracts were subjected to
western blot analysis using an anti-MICALL1, anti-p53, anti-p21, or
anti-β-actin antibody. (B) (Left panel) qPCR analysis of MICALL1 in
HCT116 p53−/− or p53+/+ cells
harvested at 48 h after the indicated concentration of ADR
treatment for 2 h. β-actin was used for normalization of expression
levels. Error bars represent the SD (n=2). (Right panel) HCT116
p53−/− or HCT116 p53+/+ cells
were treated with the indicated concentration of ADR for 2 h. After
48 h of treatment, whole cell extracts were subjected to western
blot analysis using an anti-MICALL1, anti-p53, anti-p21, or
anti-β-actin antibody. (C) (Left panel) qPCR analysis of MICALL1 in
H1299 (p53 null) cells infected with adenovirus expressing p53
(Ad-p53) or LacZ (Ad-LacZ) at MOIs from 5 to 40. (Right panel)
H1299 cells infected with Ad-p53 or Ad-LacZ at MOIs from 5 to 40.
At 36 h after treatment, whole cell extracts were subjected to
western blot analysis with an anti-MICALL1, anti-p53, anti-p21, or
anti-β-actin antibody. (D) qPCR analysis of MICALL1 in HCT116
p53−/− or p53+/+ cells
harvested at 48 h after 0.5 µM ADR or 10 µM nutlin-3a
treatment for 2 h. β-actin was used for normalization of expression
levels. Error bars represent the SD (n=2). |
To evaluate the effect of p53 activation on MICALL1
expression, we analyzed the expression of MICALL1 using HCT116
cells treated with Nutlin-3a (inhibitor of MDM2) that activates
p53. As shown in Fig. 2D, MICALL1
expression was induced by Nutrin-3a only in HCT116
p53+/+ cells. These results clearly indicate that
MICALL1 is induced by p53 activation.
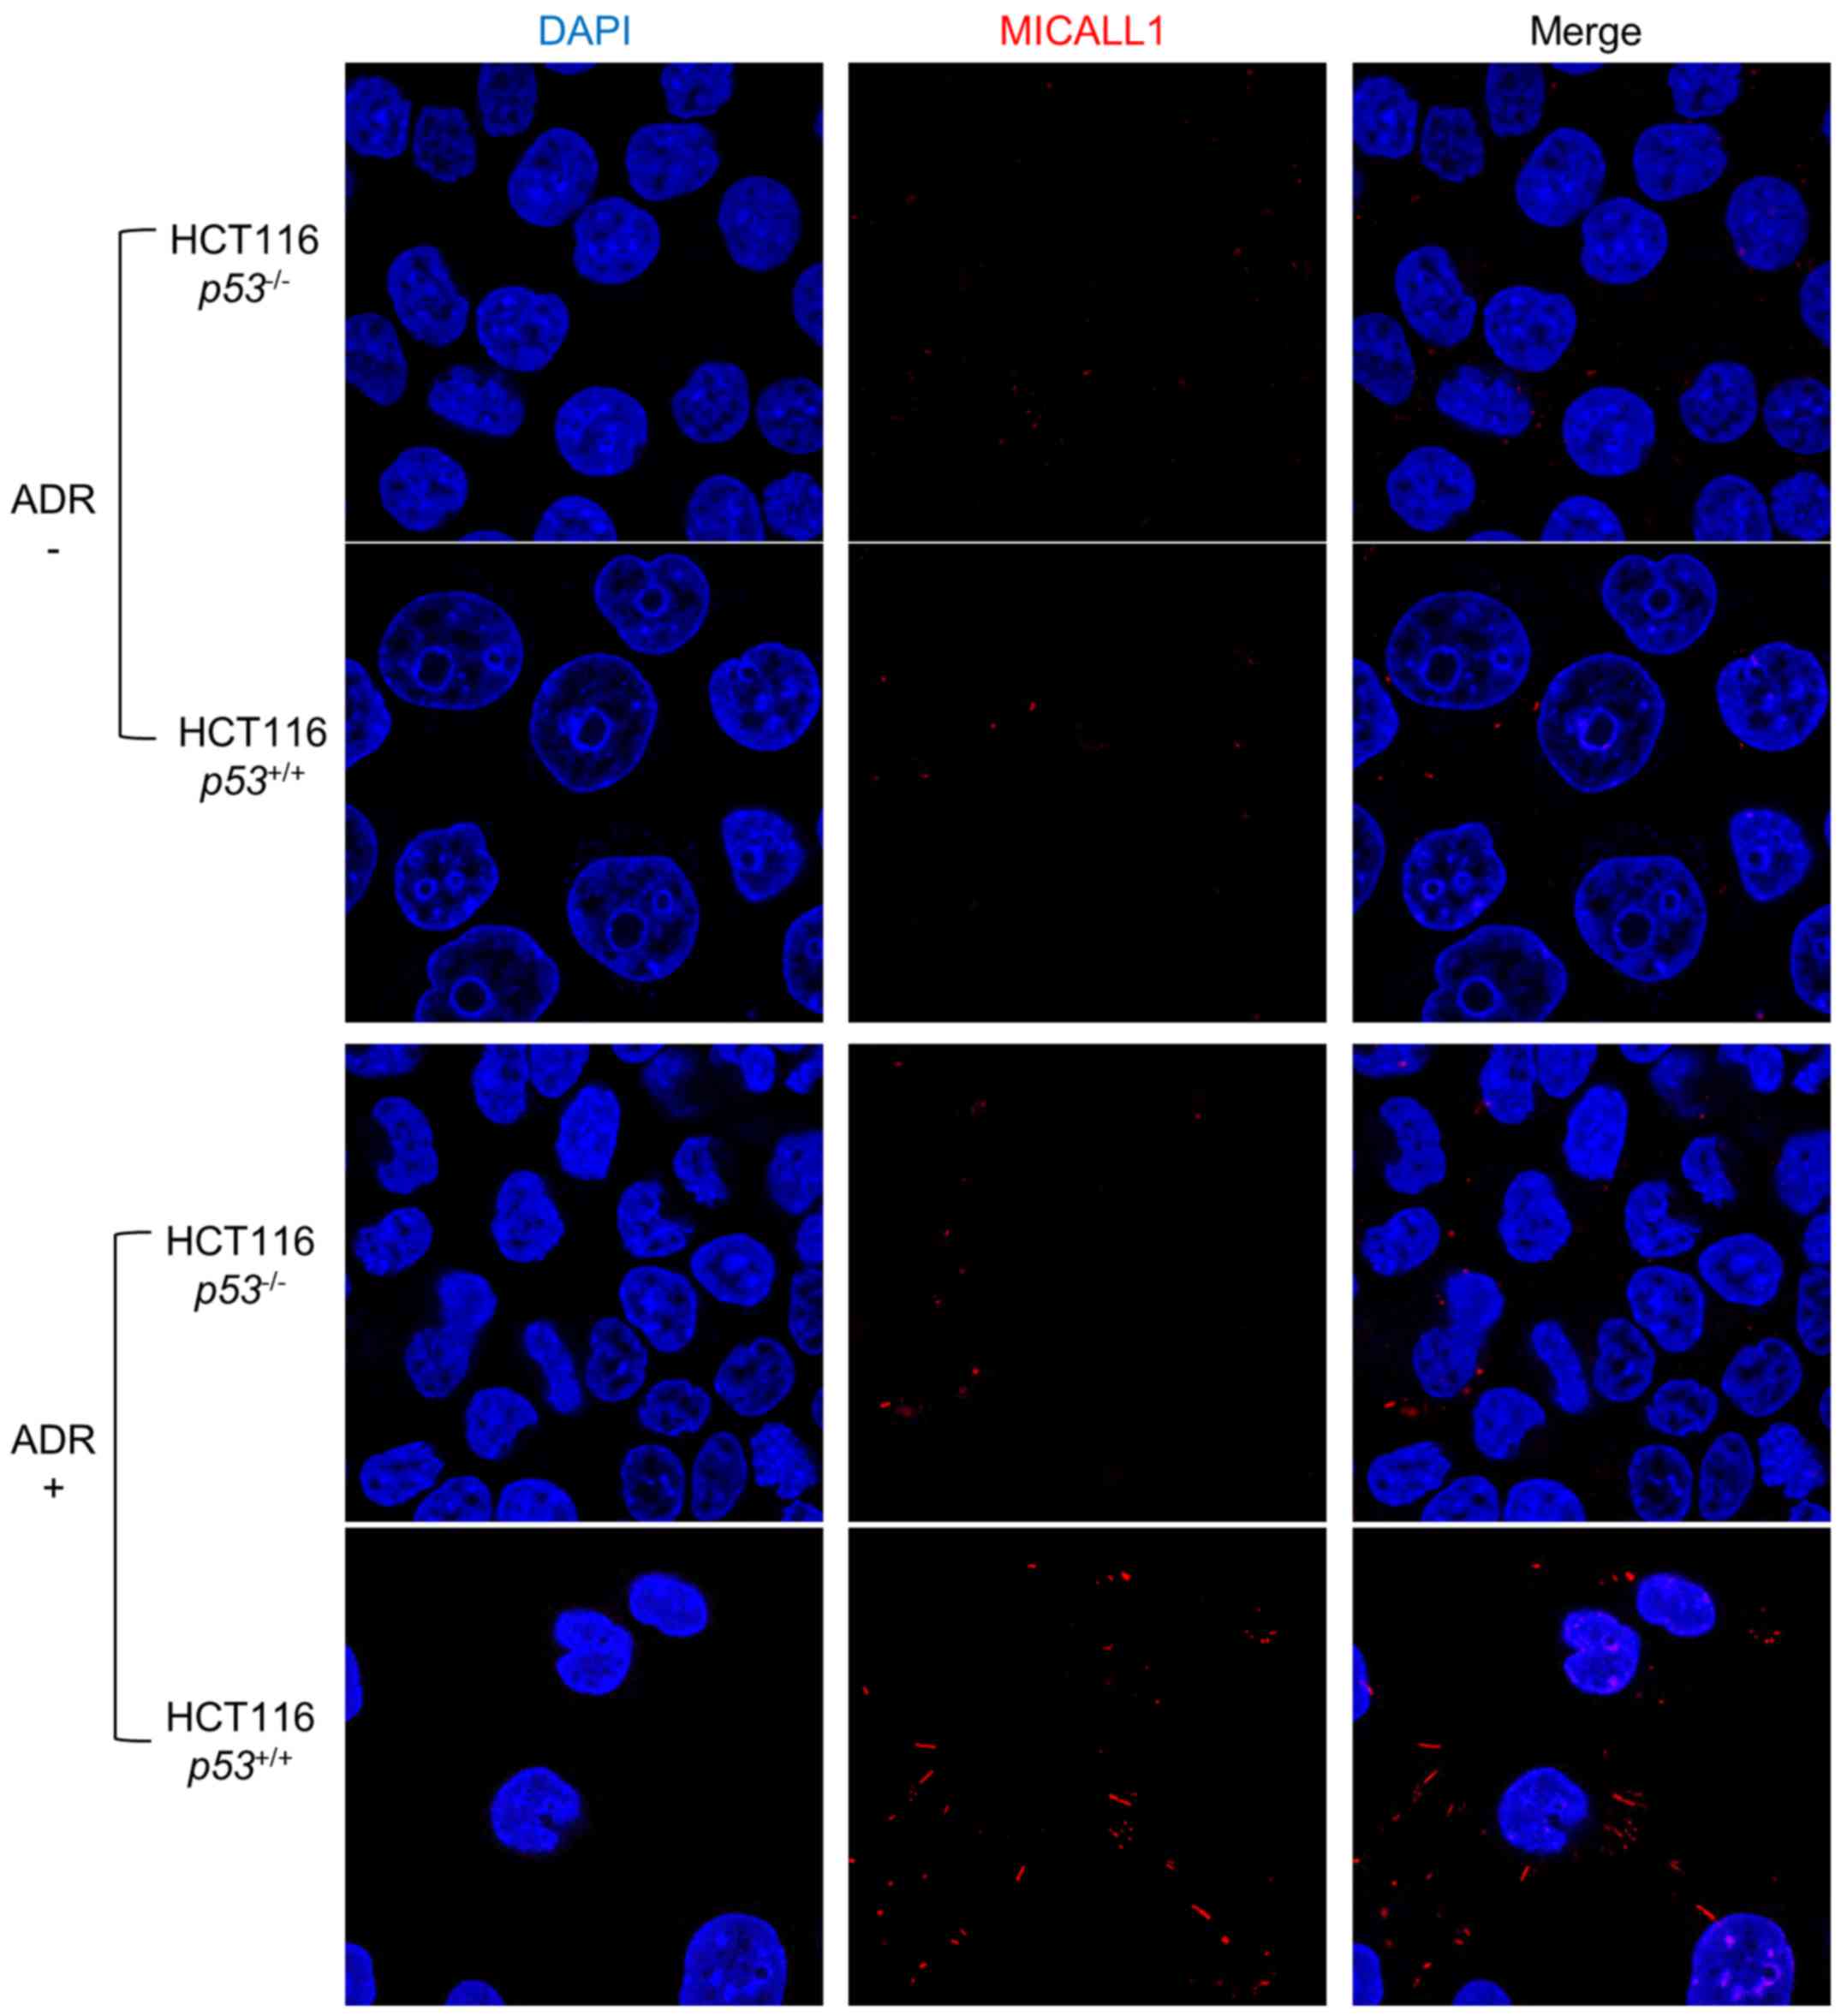
We then performed immunocytochemical analysis using
HCT116 p53+/+ and p53−/− cells
under ADR treatment (Fig. 3).
Without ADR treatment, expression of MICALL1 was very low in both
types of cells. However, in response to ADR treatment, MICALL1 was
induced at the cytoplasmic tubular structure only in HCT116
p53+/+ cells.
MICALL1 is a direct target of p53
To investigate whether MICALL1 is a direct target of
p53, we searched for the p53 binding motif (16) within the MICALL1 locus and
found two potential binding sequences (p53BS1, p53BS2) in the
approximately 3000 base pair of 5′ flanking sequence (Fig. 4A). A 151-base pair DNA fragment
(p53BS1+2) including two p53 binding sequences was amplified and
cloned upstream of the minimal promoter in the pGL4.24 vector
(pGL4.24/p53BS1+2). The reporter assays showed increased luciferase
activity in H1299 cells transfected with pGL4.24/p53Bs1+2 in the
presence of a plasmid expressing wild-type p53 (Fig. 4B). However, base substitutions in
p53BS (pGL4.24/p53BSmut1, pGL4.24/p53BSmut2) decreased the observed
enhanced luciferase activity.
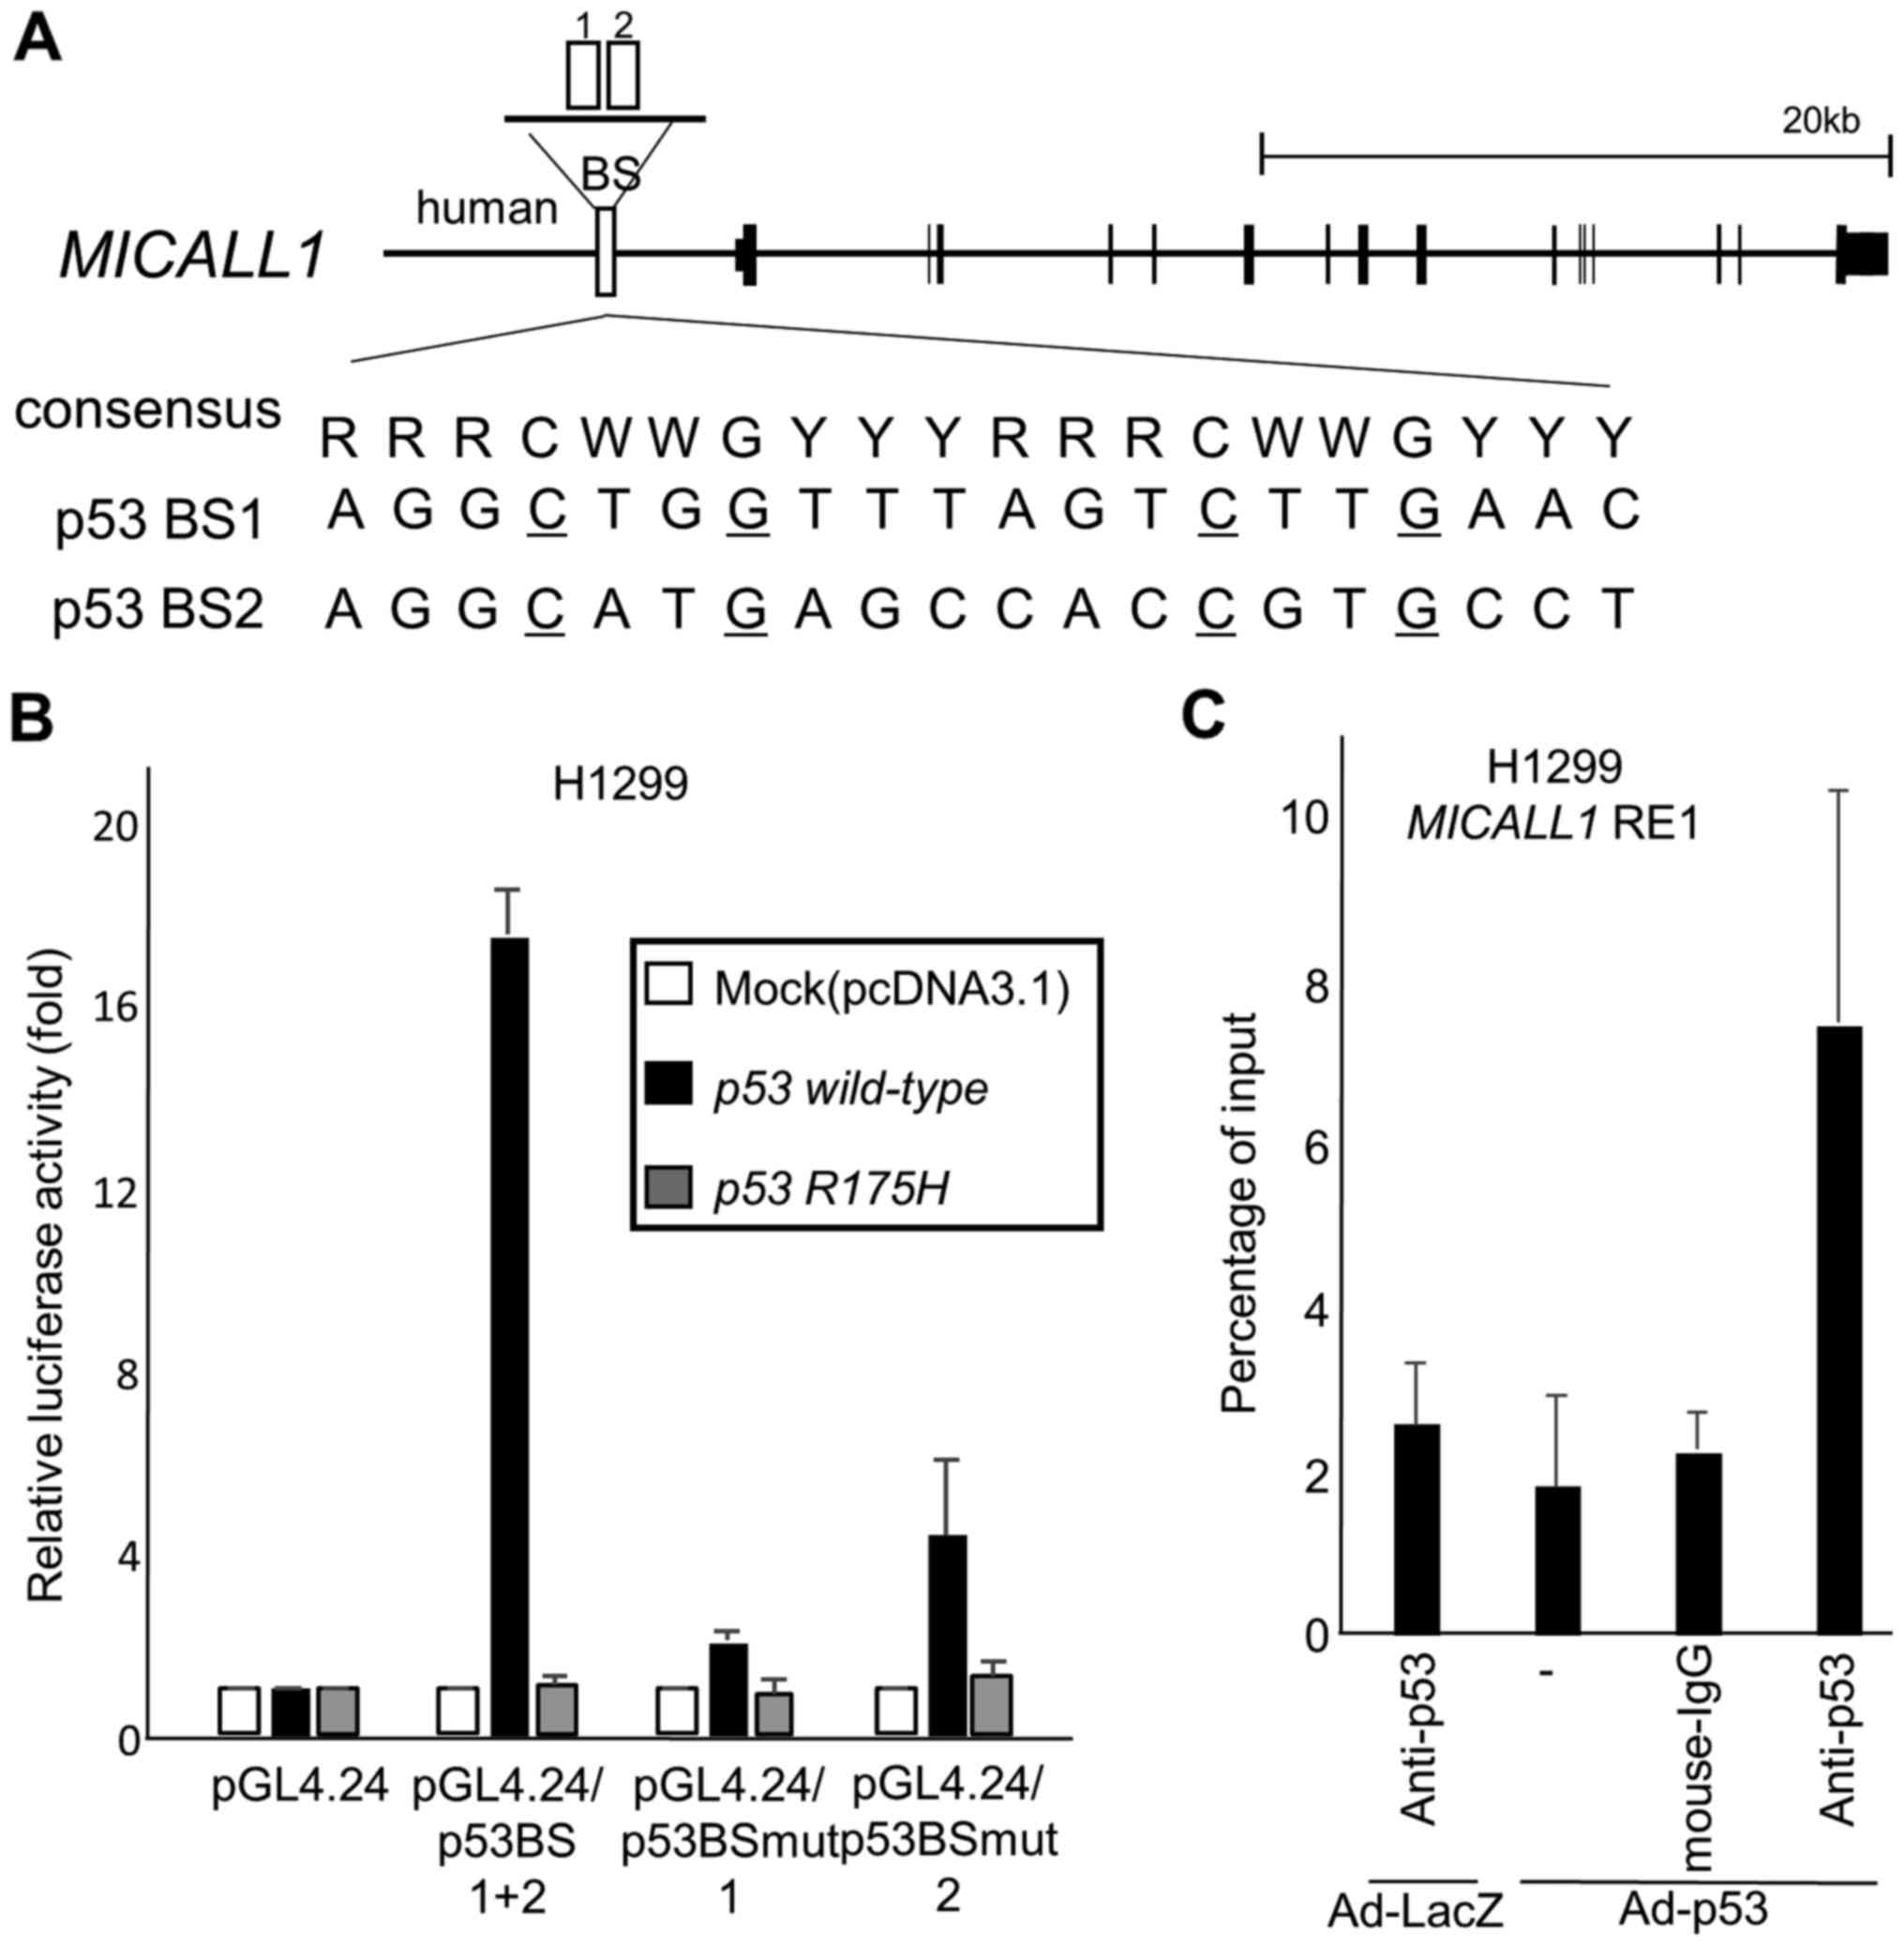 | Figure 4MICALL1 is a direct p53 target. (A)
Genomic structure of the MICALL1 gene. The white boxes
indicate the location of the potential p53 binding sequence
(p53BS1, 2). Comparison of p53BS1 and 2 with the consensus p53
binding sequence. R, purine; W, A or T; Y, pyrimidine. Nucleotides
identical to the consensus sequence are shown in capital letters.
The underlined cytosines and guanines were substituted for thymines
to examine the specificity of the p53 binding sequence. (B) Results
of luciferase assays for the genomic fragment containing p53BS with
or without substitutions in the motif. Luciferase activity is
indicated relative to the activity of the vector alone, with the SD
(n=3). In this study, H1299 cells are transfected with reporter
plasmid designated as (1) pGL4.24,
(2) pGL4.24/p53BS1+2, (3) pGL4.24/p53BSmut1, or (4) pGL4.24/p53BSmut2 together with
pcDNA3.1, plasmid expression wild-type p53 or R175H mutant p53.
pGL4.74 is also cotransfected for normalization of transfection
efficiency. H1299 cells were not treated with Adriamycin. (C) A
ChIP assay was performed using H1299 cells infected at an MOI of 10
with Ad-p53 (lanes 2–4) or Ad-LacZ (lane 1). H1299 cells were not
treated with Adriamycin. DNA-protein complexes were
immunoprecipitated with an anti-p53 antibody (lanes 1 and 4) and
then subjected to qPCR analysis to evaluate the amount of genomic
fragments containing the p53 binding sequence in MICALL1.
Immunoprecipitates pulled down with an anti-IgG antibody (lane 3)
or in the absence of antibody (−) (lane 4) were used as negative
controls. Columns, mean; error bars, SD (n=3). |
To verify whether p53 directly bound to p53BS, we
performed a ChIP assay using H1299 cells infected with either
Ad-p53 or Ad-LacZ. After precipitation with an anti-p53 antibody,
the DNA fragment containing p53BS1 was quantified by qPCR, which
showed that p53 specifically bound to p53BS1 in cells infected with
Ad-p53 (Fig. 4C). Thus, we
concluded that p53 regulates MICALL1 expression through
p53BS in the 5′ flanking region of the MICALL1 gene.
Role of MICALL1 in the p53 pathway
To further investigate the role of MICALL1 as a p53
downstream target, we screened MICALL1-interacting proteins by
LC-MS analysis. MICALL1 was immunoprecipitated from cell lysates of
HEK293T cells transfected with the MICALL1 expression plasmid. The
protein complex including immunopurified MICALL1 was analyzed by
SDS-PAGE and subsequent silver staining. A protein band at
approximately 75 kDa, which was abundant in the protein complex
including MICALL1, was subjected to LC-MS analysis. The results
indicated that CD2AP is likely to bind MICALL1 (Fig. 5A and B). Interaction between CD2AP
and MICALL1 was confirmed by western blotting (Fig. 5C). We also confirmed the
interaction by using lysates from HEK293T cells overexpressing
FLAG-MICALL1 and HA-CD2AP. Moreover, this interaction between
endogenous MICALL1 protein and CD2AP was observed in ADR-treated
HCT116 cells (Fig. 5D).
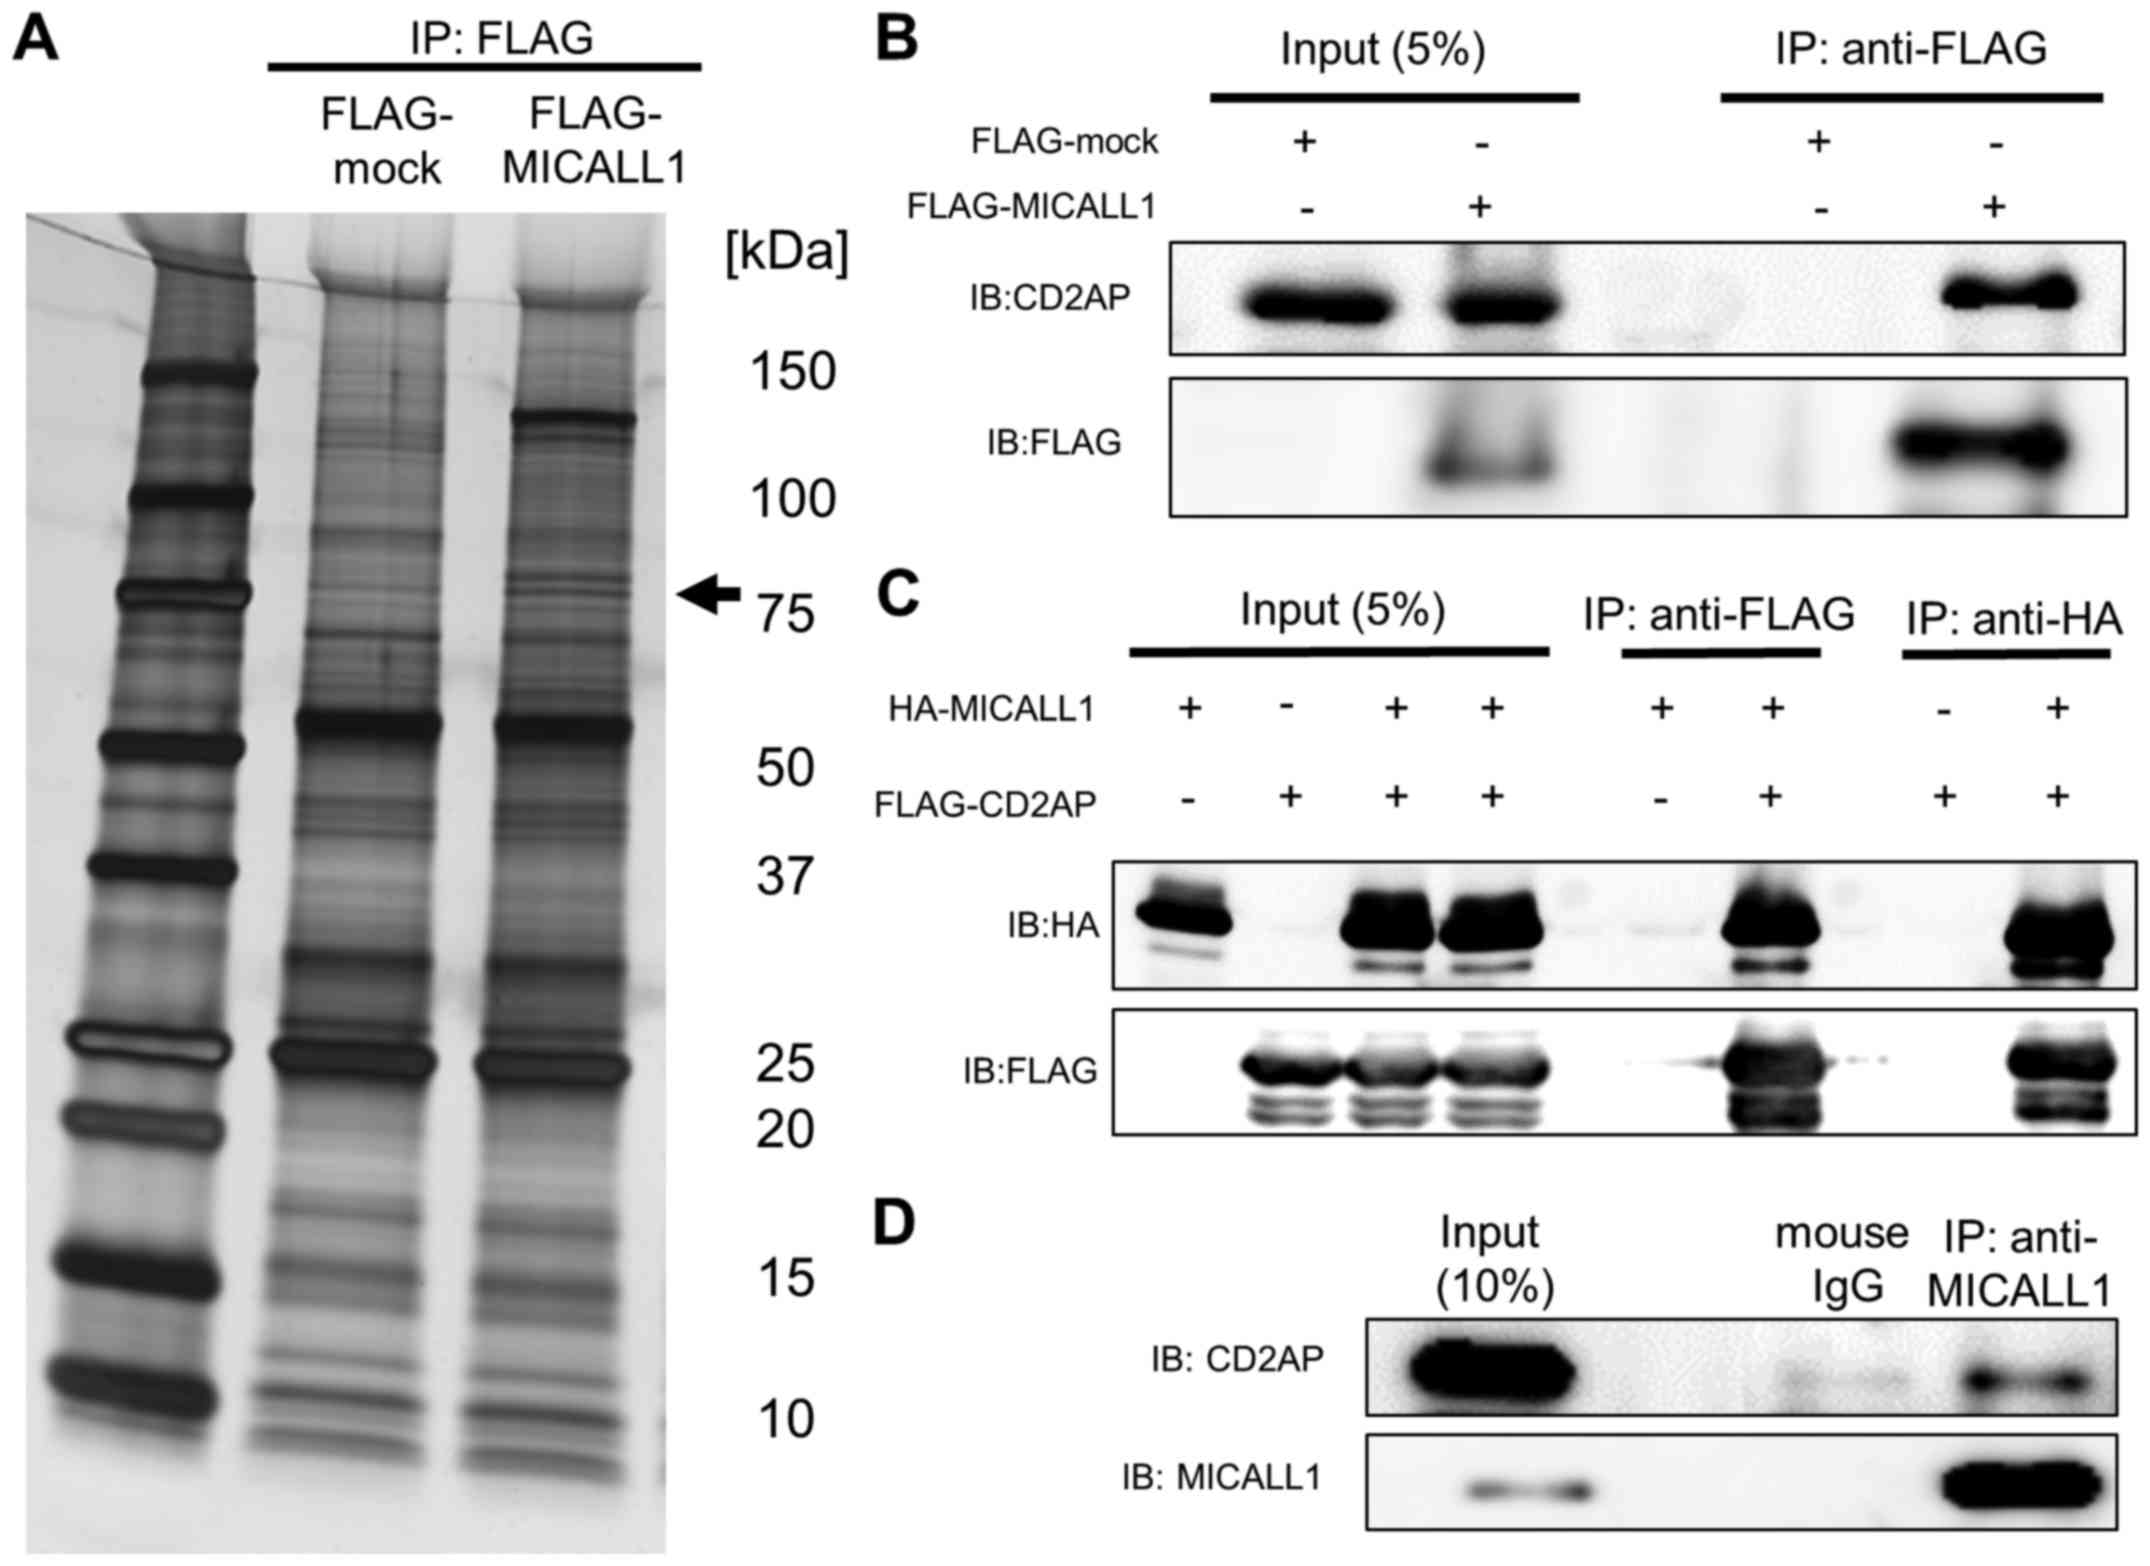 | Figure 5MICALL1 binds to CD2AP. (A) silver
staining. HEK293T cells were transfected with FLAG-mock and
FLAG-MICALL1, and the samples were immunoprecipitated with
anti-FLAG followed by G-Sepharose beads. Silver staining was then
performed. Briefly, gels were fixed with 40% ethanol/10% acetic
acid for 20 min. After several changes of 30% ethanol and water,
the gels were sensitized by incubation in silver nitrate for 10 min
and thorough rinsing with water. The gels were developed with
developing solution, and the reaction was terminated with stop
solution. All gel bands were stored at −20°C prior to mass
spectrometry. HEK293T cells were not treated with Adriamycin (A–C).
(B) western blotting for confirmation. Using the samples as in (A),
the blots were probed with anti-CD2AP and anti-FLAG antibodies, as
indicated. (C) Immunoprecipitation of ectopically expressed
MICALL1-CD2AP complex. HEK293T cells were transfected with
HA-MICALL1 and FLAG-CD2AP. MICALL1 and CD2AP were
immunoprecipitated with anti-HA or anti-FLAG, respectively,
followed by G-Sepharose beads; blots were probed with anti-HA or
anti-FLAG, as indicated. The data shown are representative of two
independent experiments. (D) Immunoprecipitation of endogenous
MICALL-CD2AP complex. HCT116 p53+/+ cells were
treated with 2 µg/ml Adriamycin. MICALL1 and CD2AP were
immunoprecipitated with anti-MICALL1, followed by G-sepharose
beads; blots were probed with anti-MICALL1 or anti-CD2AP, as
indicated. The data shown are representative of two independent
experiments. |
Regulation of tubular recycling endosomes
(TREs) by the p53-MICALL1 pathway
MICALL1 has been reported to be a marker of TREs,
which are essential for the recycling of receptors and lipids to
the plasma membrane (20). MICALL1
has also been reported to recruit RAB8A, a protein related to
vesicle-mediated transport, to TREs (21). Since MICALL1 was found at tubular
structure in the cytoplasm after DNA damage, we investigated the
subcellular localization of CD2AP and RAB8A in HCT116
p53+/+ cells (Fig.
6A and B).
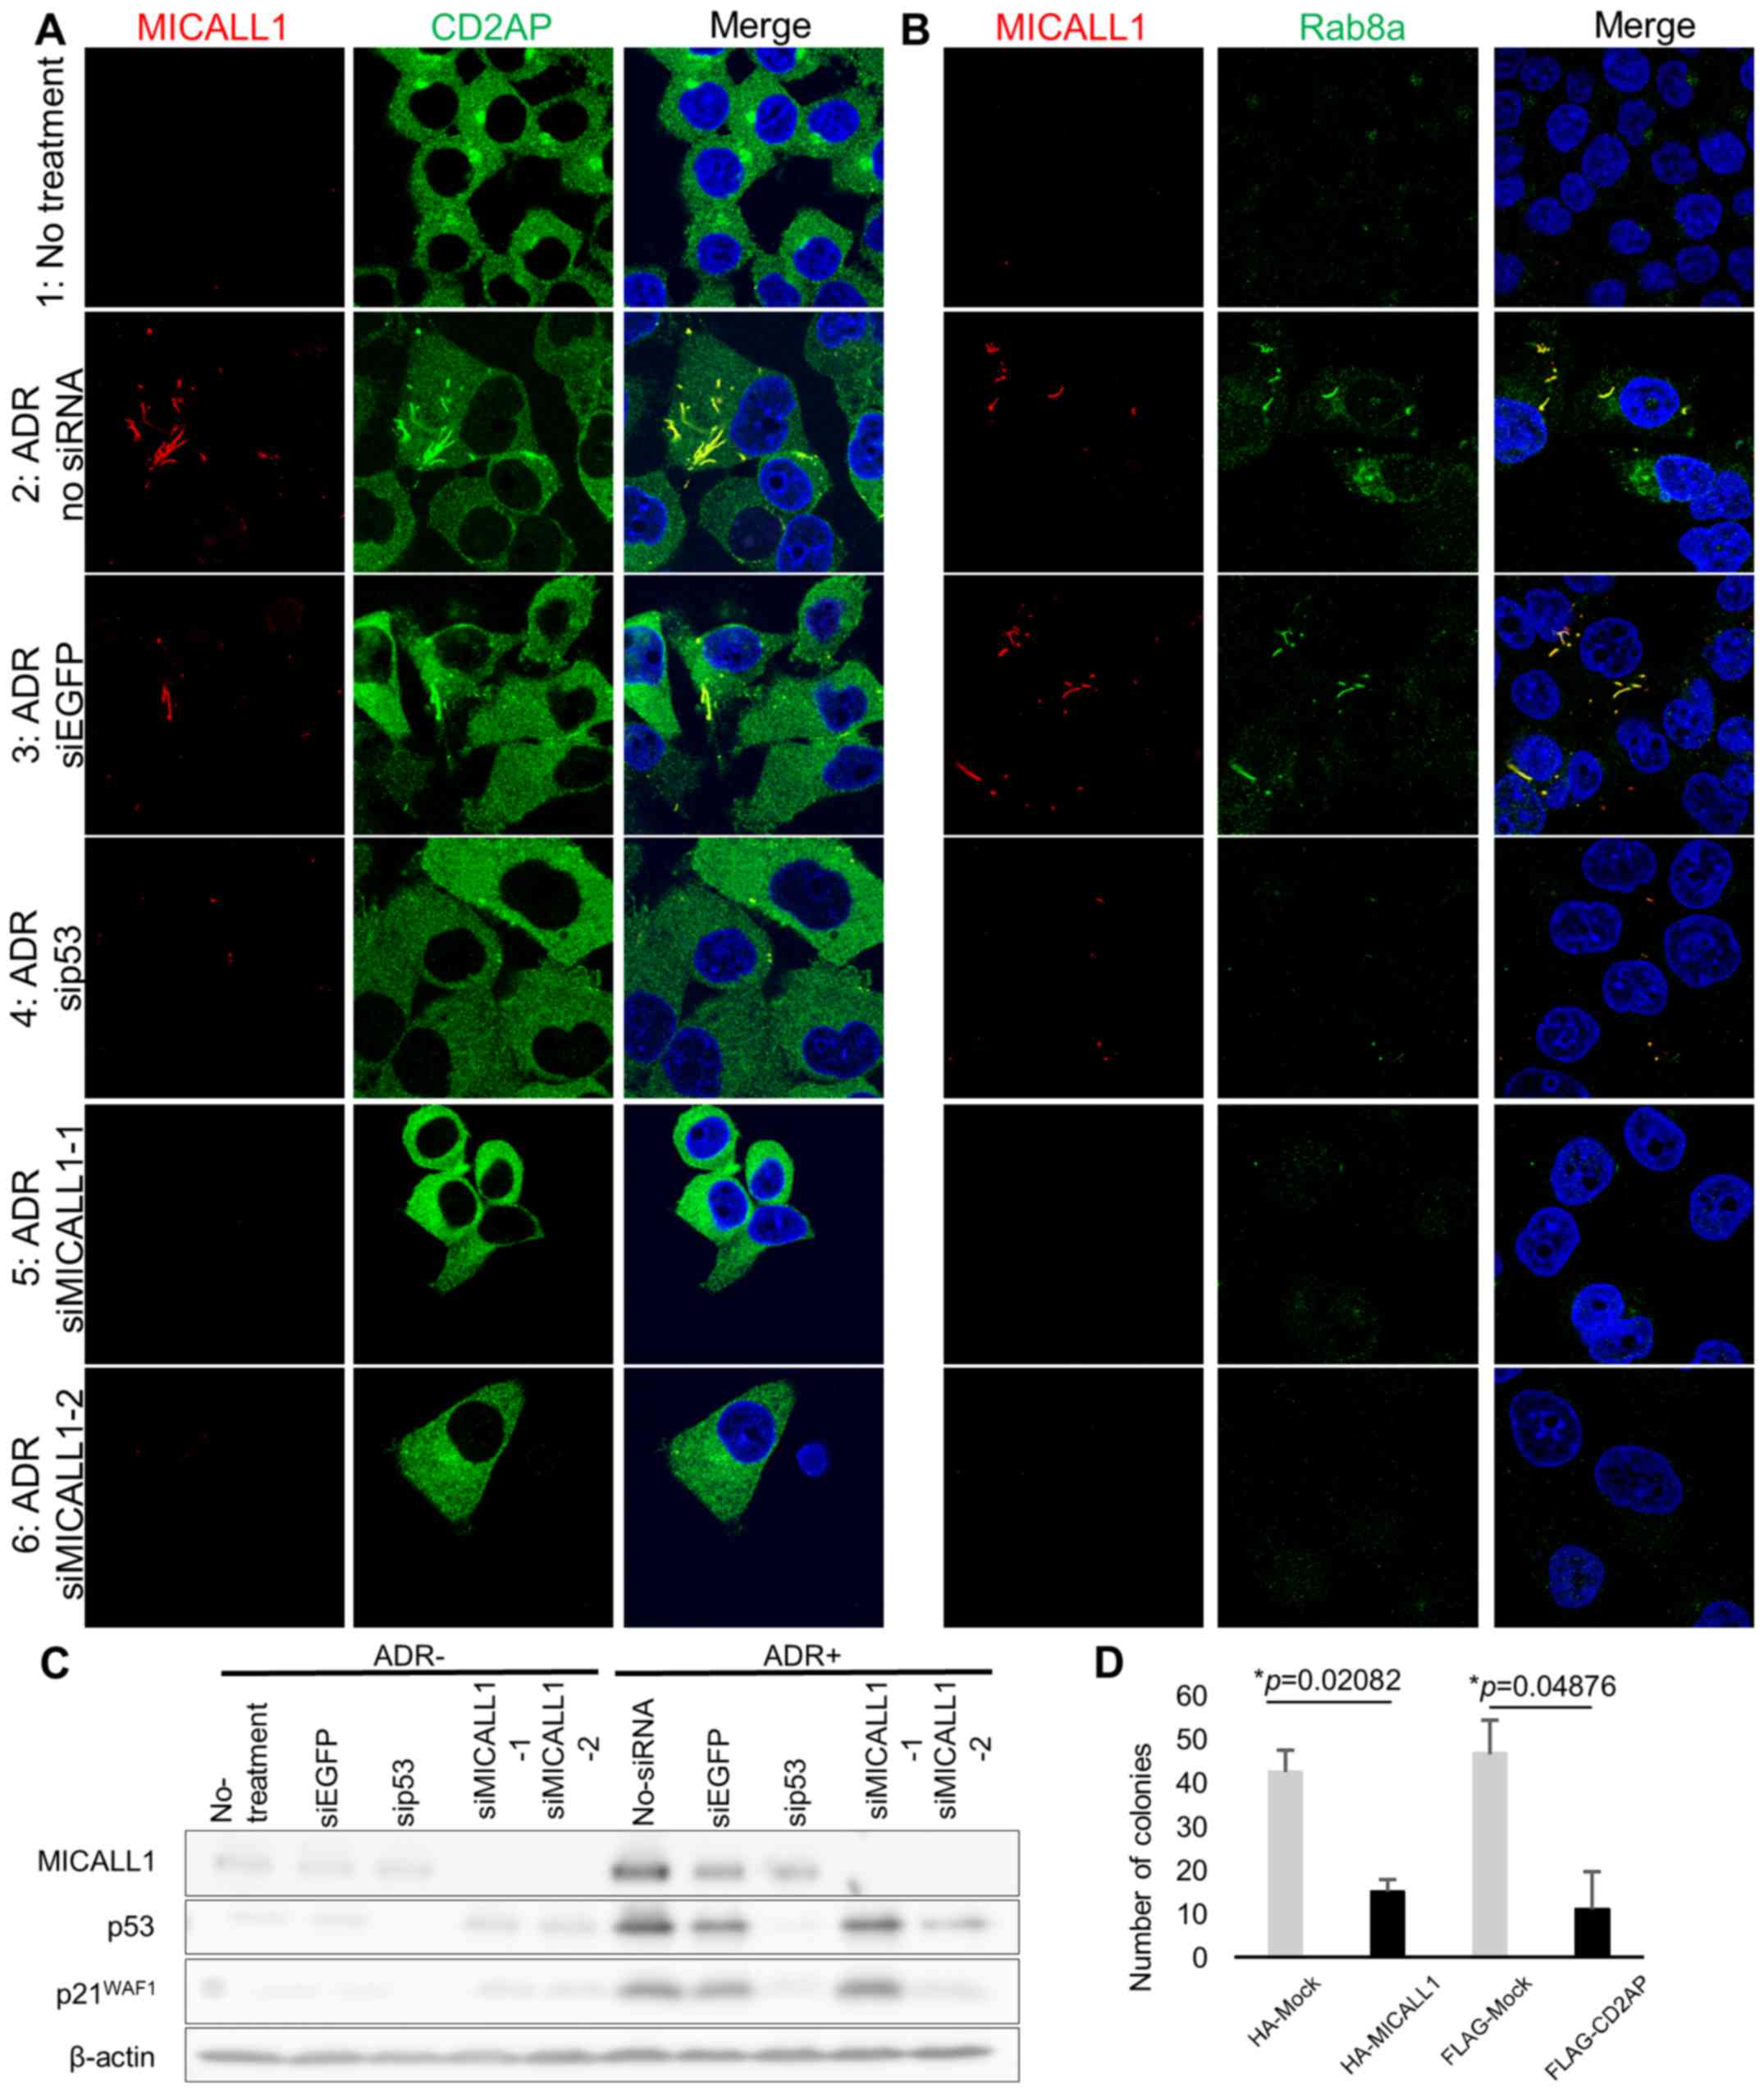 | Figure 6MICALL1 colocalizes with RAB8A and
CD2AP. (A) HCT116 p53+/+ cells were grown on
cover slips and transiently transfected with siMICALL1, si-EGFP or
si-p53. Cells were treated with 2 µg/ml of ADR for 2 h and
then incubated in normal medium for 48 h. The cells were then
fixed, and MICALL1 and CD2AP were identified with a monoclonal
anti-MICALL1 antibody followed by an anti-mouse IgG antibody;
endogenous CD2AP was identified with an anti-CD2AP antibody
followed by an anti-rabbit IgG antibody. (B) HCT116
p53+/+ cells were grown on cover slips and
transiently transfected with siMICALL1, si-EGFP or si-p53. The
cells were treated with 2 µg/ml of ADR for 2 h and then
incubated in normal medium for 48 h. The cells were then fixed, and
MICALL1 and RAB8A were detected by a monoclonal anti-MICALL1
antibody followed by an anti-mouse antibody; endogenous RAB8A was
identified with an anti-RAB8A antibody followed by an anti-rabbit
antibody. (C) HCT116 p53+/+ cells grown in 100-mm
dishes were either mock treated or treated with siRNA against EGFP,
p53, and MICALL1. The cells were treated with 2 µg/ml of ADR
for 2 h and then incubated in normal medium for 48 h. After lysis,
proteins were separated by SDS-PAGE, transferred to nitrocellulose
membranes and immunoblotted with anti-MICALL1, anti-p53, anti-p21
and anti-β-actin antibodies. (D) Colony formation by HCT116 cells.
Expression of MICALL1 blocked the growth and colony counts of
HCT116 cells; colony formation was measured using a colony
formation assay. The number of colonies was counted at 11–20 days
after transfection. Values are the averages ± SDS of duplicate
experiments. |
Initially, we determined the localization of CD2AP
and RAB8A after DNA damage. HCT116 p53+/+ cells
were grown on coverslips and treated with 2 µg/ml ADR; 48 h
later, CD2AP and RAB8A exhibited a tubular-like distribution with
MICALL1 (Fig. 6A-1, 2, and B-1,
2). Thus, CD2AP and RAB8A exhibited altered cytoplasmic
localization to TREs after DNA damage.
Next, we tested whether p53 or MICALL1 knockdown
changed the localization of CD2AP and RAB8A after DNA damage
(Fig. 6C). At 48 h after ADR
treatment, cells were fixed, and MICALL1 and CD2AP or RAB8A was
identified with antibodies. According to the results, their
localization change did not occur in p53 or MICALL1-knockdown cells
(Fig. 6A-4, 5, 6, and B-4, 5, 6).
According to the above results, MICALL1 is involved in TRE
regulation in the response to DNA damage.
MICALL1 and CD2AP regulate cell
proliferation
To investigate the role of MICALL1 in cell
proliferation, we performed a colony formation assay using HCT116
cells and found a significant decrease in colony counts for cells
transfected with MICALL1 compared with cells mock transfected with
the vector (Fig. 6D). Furthermore,
ectopic expression of CD2AP also repressed cell growth like MICALL1
expressing cells (Fig. 6D). These
results indicated that MICALL1 would suppress tumor cell growth
through the regulation of CD2AP.
Discussion
In this study, we identified MICALL1 as a novel p53
downstream target by using multi-omics analysis. Moreover, we
identified CD2AP as a protein that interacts with MICALL1. In
response to DNA damage, MICALL1, CD2AP, and RAB8A co-localize at
tubular-like structures in the cytoplasm in a p53-dependent
manner.
Endocytosis, a process that transports materials
such as membrane proteins to membrane vesicles, regulates cell
signaling to adjust receptor trafficking (22) and has many functions in cell
migration, polarity, adhesion, differentiation, apoptosis, and
autophagy (23–25). Endocytosis is also dysregulated in
cancer. For example, HER2 inhibits endocytic degradation of CXCR4
and induce lung metastasis in breast cancer (26). Moreover, Rab25 changes the
localization of integrin and consequently enhances invasion of
cancer cells (27).
TREs are related to 'slow-recycling' (28). MICALL1 was identified as a member
of a family of proteins that interact with the focal adhesion
plaque protein CasL (29). MICALL1
and Syndapin2 promote tubulation of recycling endosomes with
phosphatidic acid (PA) and elongate tubules to the plasma membrane
(20). MICALL1 also guides EHD1 to
TREs (12) and regulates mitosis
with EHD1 (30). Thus, MICALL1 is
considered to be a regulator of TREs (12). However, the role of MICALL1 in
colorectal cancer has not been reported to date.
We found that ectopic expression of MICALL1
significantly inhibited the proliferation of HCT116 colorectal
cancer cells. MICALL1 expression is suppressed in colorectal
cancer with p53 mutations (Fig.
1B). Moreover, the p53-MICALL1 pathway is essential for
translocation of CD2AP to TREs in response to DNA damage. CD2AP was
identified as a scaffold protein expressed on the surface of
T-lymphocytes and antigen-presenting cells, and it regulates
receptor trafficking among endosomes as an effector of the small
GTPase Rab4 (31). Furthermore,
CD2AP promotes EGFR degradation with Cbl (32), and MICALL1 has also been shown to
retain EGFR in late endosome (33). Although the relationship between
TREs and cancer is not yet clear, the p53-MICALL1 pathway appears
to exert an antitumor effect via regulation of receptor
trafficking.
Several endosomal proteins, such as CAV1, TSAP6,
CHMP4C and DRAM1, have previously been shown to be p53 targets
(24,25,34,35).
However, the role of p53 in recycling endosomes has not been
reported. Although the molecular mechanism by which MICALL1
regulates colorectal tumor cell growth should be elucidated in the
future, our findings indicate the regulation of TREs occurs through
the p53-MICALL1 pathway.
Acknowledgments
We thank S. Takahashi, M. Oshima, S. Oda and A. Sei
for assistance with various techniques. We also thank the Cancer
Genome Atlas (TCGA) project and members of Cancer Genomics Hub
(CGHub) for making all TCGA data publicly accessible. This work was
supported in part by a grant from the Japan society for the
Promotion of science and the Ministry of Education, Culture,
Sports, Science and Technology of Japan to K.M. and C.T., a grant
from the Japan Agency for Medical Research and Development to K.M.
and C.T., a grant from the Ministry of Health, Labor and Welfare of
Japan to K.M., and a grant from the Takeda Science Foundation to
K.M. and C.T.
References
|
1
|
Bieging KT, Mello SS and Attardi LD:
Unravelling mechanisms of p53-mediated tumour suppression. Nat Rev
Cancer. 14:359–370. 2014. View
Article : Google Scholar : PubMed/NCBI
|
|
2
|
Li T, Kon N, Jiang L, Tan M, Ludwig T,
Zhao Y, Baer R and Gu W: Tumor suppression in the absence of
p53-mediated cell-cycle arrest, apoptosis, and senescence. Cell.
149:1269–1283. 2012. View Article : Google Scholar : PubMed/NCBI
|
|
3
|
Fitzmaurice C, Dicker D, Pain A, Hamavid
H, Moradi-Lakeh M, MacIntyre MF, Allen C, Hansen G, Woodbrook R,
Wolfe C, et al Global Burden of Disease Cancer Collaboration: The
Global Burden of Cancer 2013. JAMA Oncol. 1:505–527. 2015.
View Article : Google Scholar : PubMed/NCBI
|
|
4
|
Bailey CE, Hu CY, You YN, Bednarski BK,
Rodriguez-Bigas MA, Skibber JM, Cantor SB and Chang GJ: Increasing
disparities in the age-related incidences of colon and rectal
cancers in the United States, 1975–2010. JAMA Surg. 150:17–22.
2015. View Article : Google Scholar :
|
|
5
|
Fearon ER and Vogelstein B: A genetic
model for colorectal tumorigenesis. Cell. 61:759–767. 1990.
View Article : Google Scholar : PubMed/NCBI
|
|
6
|
Leslie A, Carey FA, Pratt NR and Steele
RJ: The colorectal adenoma-carcinoma sequence. Br J Surg.
89:845–860. 2002. View Article : Google Scholar : PubMed/NCBI
|
|
7
|
Munro AJ, Lain S and Lane DP: P53
abnormalities and outcomes in colorectal cancer: A systematic
review. Br J Cancer. 92:434–444. 2005.PubMed/NCBI
|
|
8
|
Russo A, Bazan V, Iacopetta B, Kerr D,
Soussi T and Gebbia N; TP53-CRC Collaborative study Group: The TP53
colorectal cancer international collaborative study on the
prognostic and predictive significance of p53 mutation: Influence
of tumor site, type of mutation, and adjuvant treatment. J Clin
Oncol. 23:7518–7528. 2005. View Article : Google Scholar : PubMed/NCBI
|
|
9
|
Krieg AJ, Hammond EM and Giaccia AJ:
Functional analysis of p53 binding under differential stresses. Mol
Cell Biol. 26:7030–7045. 2006. View Article : Google Scholar : PubMed/NCBI
|
|
10
|
Hammond EM, Mandell DJ, Salim A, Krieg AJ,
Johnson TM, Shirazi HA, Attardi LD and Giaccia AJ: Genome-wide
analysis of p53 under hypoxic conditions. Mol Cell Biol.
26:3492–3504. 2006. View Article : Google Scholar : PubMed/NCBI
|
|
11
|
Tanikawa C, Zhang YZ, Yamamoto R, Tsuda Y,
Tanaka M, Funauchi Y, Mori J, Imoto S, Yamaguchi R, Nakamura Y, et
al: The transcriptional landscape of p53 signalling pathway.
EBioMedicine. 20:109–119. 2017. View Article : Google Scholar : PubMed/NCBI
|
|
12
|
Sharma M, Giridharan SS, Rahajeng J,
Naslavsky N and Caplan S: MICAL-L1 links EHD1 to tubular recycling
endosomes and regulates receptor recycling. Mol Biol Cell.
20:5181–5194. 2009. View Article : Google Scholar : PubMed/NCBI
|
|
13
|
Funauchi Y, Tanikawa C, Yi Lo PH, Mori J,
Daigo Y, Takano A, Miyagi Y, Okawa A, Nakamura Y and Matsuda K:
Regulation of iron homeostasis by the p53-ISCU pathway. Sci Rep.
5:164972015. View Article : Google Scholar : PubMed/NCBI
|
|
14
|
Ueda K, Ishikawa N, Tatsuguchi A, Saichi
N, Fujii R and Nakagawa H: Antibody-coupled monolithic silica
microtips for highthroughput molecular profiling of circulating
exosomes. Sci Rep. 4:62322014. View Article : Google Scholar : PubMed/NCBI
|
|
15
|
Kanda Y: Investigation of the freely
available easy-to-use software 'EZR' for medical statistics. Bone
Marrow Transplant. 48:452–458. 2013. View Article : Google Scholar
|
|
16
|
el-Deiry WS, Kern SE, Pietenpol JA,
Kinzler KW and Vogelstein B: Definition of a consensus binding site
for p53. Nat Genet. 1:45–49. 1992. View Article : Google Scholar : PubMed/NCBI
|
|
17
|
Tanikawa C, Matsuda K, Fukuda S, Nakamura
Y and Arakawa H: p53RDL1 regulates p53-dependent apoptosis. Nat
Cell Biol. 5:216–223. 2003. View
Article : Google Scholar : PubMed/NCBI
|
|
18
|
Mori J, Tanikawa C, Funauchi Y, Lo PH,
Nakamura Y and Matsuda K: Cystatin C as a p53-inducible apoptotic
mediator that regulates cathepsin L activity. Cancer Sci.
107:298–306. 2016. View Article : Google Scholar : PubMed/NCBI
|
|
19
|
Miyamoto T, Lo PHY, Saichi N, Ueda K,
Hirata M, Tanikawa C and Matsuda K: Argininosuccinate synthase 1 is
an intrinsic Akt repressor transactivated by p53. Sci Adv.
3:e16032042017. View Article : Google Scholar : PubMed/NCBI
|
|
20
|
Giridharan SS, Cai B, Vitale N, Naslavsky
N and Caplan S: Cooperation of MICAL-L1, syndapin2, and
phosphatidic acid in tubular recycling endosome biogenesis. Mol
Biol Cell. 24:1776–1790. S1–15. 2013. View Article : Google Scholar : PubMed/NCBI
|
|
21
|
Rahajeng J, Giridharan SS, Cai B,
Naslavsky N and Caplan S: MICAL-L1 is a tubular endosomal membrane
hub that connects Rab35 and Arf6 with Rab8a. Traffic. 13:82–93.
2012. View Article : Google Scholar :
|
|
22
|
Conn PM: Methods in Enzymology G protein
coupled receptors trafficking and oligomerization. Preface Methods
Enzymol. 521. pp. xix2013, View Article : Google Scholar
|
|
23
|
Sigismund S, Confalonieri S, Ciliberto A,
Polo S, Scita G and Di Fiore PP: Endocytosis and signaling: Cell
logistics shape the eukaryotic cell plan. Physiol Rev. 92:273–366.
2012. View Article : Google Scholar : PubMed/NCBI
|
|
24
|
Yu X, Riley T and Levine AJ: The
regulation of the endosomal compartment by p53 the tumor suppressor
gene. FEBS J. 276:2201–2212. 2009. View Article : Google Scholar : PubMed/NCBI
|
|
25
|
Crighton D, Wilkinson S, O'Prey J, Syed N,
Smith P, Harrison PR, Gasco M, Garrone O, Crook T and Ryan KM:
DRAM, a p53-induced modulator of autophagy, is critical for
apoptosis. Cell. 126:121–134. 2006. View Article : Google Scholar : PubMed/NCBI
|
|
26
|
Li YM, Pan Y, Wei Y, Cheng X, Zhou BP, Tan
M, Zhou X, Xia W, Hortobagyi GN, Yu D, et al: Upregulation of CXCR4
is essential for HER2-mediated tumor metastasis. Cancer Cell.
6:459–469. 2004. View Article : Google Scholar : PubMed/NCBI
|
|
27
|
Caswell PT, Spence HJ, Parsons M, White
DP, Clark K, Cheng KW, Mills GB, Humphries MJ, Messent AJ, Anderson
KI, et al: Rab25 associates with alpha5beta1 integrin to promote
invasive migration in 3D microenvironments. Dev Cell. 13:496–510.
2007. View Article : Google Scholar : PubMed/NCBI
|
|
28
|
Jović M, Kieken F, Naslavsky N, Sorgen PL
and Caplan S: Eps15 homology domain 1-associated tubules contain
phosphatidylinositol-4-phosphate and
phosphatidylinositol-(4,5)-bisphosphate and are required for
efficient recycling. Mol Biol Cell. 20:2731–2743. 2009. View Article : Google Scholar
|
|
29
|
Suzuki T, Nakamoto T, Ogawa S, Seo S,
Matsumura T, Tachibana K, Morimoto C and Hirai H: MICAL, a novel
CasL interacting molecule, associates with vimentin. J Biol Chem.
277:14933–14941. 2002. View Article : Google Scholar : PubMed/NCBI
|
|
30
|
Reinecke JB, Katafiasz D, Naslavsky N and
Caplan S: Novel functions for the endocytic regulatory proteins
MICAL-L1 and EHD1 in mitosis. Traffic. 16:48–67. 2015. View Article : Google Scholar
|
|
31
|
Cormont M, Metón I, Mari M, Monzo P,
Keslair F, Gaskin C, McGraw TE and Le Marchand-Brustel Y: CD2AP/CMS
regulates endosome morphology and traffic to the degradative
pathway through its interaction with Rab4 and c-Cbl. Traffic.
4:97–112. 2003. View Article : Google Scholar : PubMed/NCBI
|
|
32
|
Dikic I: CIN85/CMS family of adaptor
molecules. FEBs Lett. 529:110–115. 2002. View Article : Google Scholar : PubMed/NCBI
|
|
33
|
Abou-Zeid N, Pandjaitan R, Sengmanivong L,
David V, Le Pavec G, Salamero J and Zahraoui A: MICAL-like1
mediates epidermal growth factor receptor endocytosis. Mol Biol
Cell. 22:3431–3441. 2011. View Article : Google Scholar : PubMed/NCBI
|
|
34
|
Bist A, Fielding CJ and Fielding PE: p53
regulates caveolin gene transcription, cell cholesterol, and growth
by a novel mechanism. Biochemistry. 39:1966–1972. 2000. View Article : Google Scholar : PubMed/NCBI
|
|
35
|
Amson RB, Nemani M, Roperch JP, Israeli D,
Bougueleret L, Le Gall I, Medhioub M, Linares-Cruz G, Lethrosne F,
Pasturaud P, et al: Isolation of 10 differentially expressed cDNAs
in p53-induced apoptosis: Activation of the vertebrate homologue of
the drosophila seven in absentia gene. Proc Natl Acad Sci USA.
93:3953–3957. 1996. View Article : Google Scholar : PubMed/NCBI
|