Introduction
Hepatocellular carcinoma (HCC) is one of the most
common malignancies; it is the third leading cause of
cancer-related deaths worldwide (1). HCC arises when the liver is damaged
by various liver diseases, such as chronic viral hepatitis or
alcoholic liver cirrhosis (2–4). The
prognosis of patients with HCC is generally poor, because most
patients are diagnosed in the advanced stages, with intra- or
extra-hepatic metastasis (5,6), and
without an indication of surgery. Consequently, postoperative
recurrence rates are high, even when radical resections are
performed (7). The postoperative
recurrence rates at 3 and 5 years were 61.2 and 85.7%, respectively
(8). Therefore, it is crucial to
establish new molecular targeting therapies for HCC by searching
for molecular markers that correlate with tumor progression and
poor prognosis.
Members of the carbonic anhydrase (CA) family are
zinc metalloenzymes that catalyze the hydration of carbon dioxide
and produce bicarbonate and protons. In various living organisms,
CAs function as a modulator of pH and ion transports in many
biological processes. Carbonic anhydrase IX (CA9) is an integral
plasma membrane isoenzyme with an extracellular catalytic domain
(9,10). CA9 expression is elevated in
various types of tumors compared to its expression in non-tumor
tissues, and it is strongly induced under hypoxic conditions. In
response to hypoxia, CA9 gene transcription is sensitively
regulated by hypoxia-inducible factor 1 (HIF1). HIF1 plays a
pivotal role in the hypoxic response and it mediates many phenomena
(11).
Several studies have shown that CA9 expression in
tumor cells was related to poor prognoses. The finding suggested
that CA9 might be a useful marker of aggressive malignant potential
and progression in various cancers, including lung (12,13),
breast (14,15), renal (16), bladder (17) and cervical (18) cancers. Although the detailed
function of CA9 remains to be clarified, a few studies have
suggested that upregulation of CA9 worsened prognoses by enhancing
the malignant potential of tumors.
The epithelial-mesenchymal transition (EMT) is a
process where epithelial cells lose cell polarity and cell adhesion
capabilities and they gain migratory and invasive capacities.
Therefore, EMT plays important roles in progression, because it
allows tumor cells to invade to other tissues and migrate to
distant organs (19). Recent
reports have also shown that hypoxic conditions correlated with the
induction of EMT in various tumor cells (20–22).
Moreover, Svastová et al (23) reported that upregulation of CA9
expression promoted a loss of cell-to-cell adhesion via the
downregulation of E-cadherin expression.
This study aimed to clarify the role of CA9 in HCC
progression. To that end, we evaluated the correlation between CA9
and EMT in two hepatoma cell lines, and we also examined the
clinical significance of CA9 expression in 117 consecutive patients
that underwent curative resections for HCC.
Materials and methods
Cell culture
The human hepatoma cell lines, HuH7 and HepG2, were
purchased from the Japan Cancer Research Resources Bank (Tokyo,
Japan). Cells were cultured and maintained in Dulbecco's modified
Eagle's medium supplemented with 10% fetal bovine serum (FBS) and
500 μg/ml penicillin-streptomycin, at 37°C in a humidified
incubator with 5% CO2 in air.
Drugs and reagents
Cobalt chloride hexahydrate
(CoCl2•6H2O), which produces pseudo-hypoxia
by inducing HIF1α expression, was purchased from Sigma-Aldrich (St.
Louis, MO, USA). We used the following antibodies for
immunohistochemistry, western blot analyses and immunofluorescence
detection: monoclonal mouse anti-human CA9 antibody (Abcam,
Cambridge, UK); monoclonal rabbit anti-human CA9 antibody (Cell
Signaling Technology, Beverly, MA, USA); polyclonal rabbit
anti-human E-cadherin antibody (Santa Cruz Biotechnology, Inc.,
Dallas, TX, USA); monoclonal mouse anti-human N-cadherin antibody
(Santa Cruz Biotechnology); polyclonal rabbit anti-human Twist
antibody (Santa Cruz Biotechnology); and monoclonal rabbit
anti-human ZEB1 antibody (Cell Signaling Technology).
Hypoxic conditions
For treatments with hypoxia, cells were maintained
in a humidified incubator with 1% O2, 5% CO2
and 94% N2. For chemically-induced hypoxia,
CoCl2 was added to the medium at 200 μM. Cells
cultured under normoxic conditions were used as the control.
Transfection of small interfering RNA
(siRNA)
Small interfering RNAs that targeted CA9 (siRNA-CA9)
was purchased from Invitrogen (Waltham, MA, USA). The siRNA-CA9
sequences were: 5′-GGAAGAAAACAGUGCCUAUtt-3′ and
5′-AUAGGCACUGUUUUCUUCCgg-3′. Cells were trans-fected with 40
μmol/l siRNA and RNAiMAX (Invitrogen). After an overnight
incubation, cells were incubated in normoxia or hypoxia.
Mock-transfected cells were used as a negative control.
Patients and tumor samples
From 2000 to 2010, 117 patients (92 men, 25 women,
aged 36–84 years) with primary HCC underwent hepatectomies at the
Osaka University Hospital. These patients had no history of
transcatheter arterial chemo-embolization (TACE), and they
underwent radical surgery without macroscopic residual tumors.
Surgical specimens were fixed in 10% buffered formalin, embedded in
paraffin, and stained with hematoxylineosin for histological
evaluation.
Cell viability assay
Cell viability was analyzed with the methyl
tetrazolium (MTT) assay. Briefly, cells treated with siRNA-CA9 or
mock control were seeded at 5×10³ cells/well in 96-well
plates. The MTT assay was performed at 24 and 48 h. For the assay,
10 μl of 5 mg/ml MTT (Invitrogen) was added to each well,
and cells were incubated for 4 h; then, 100 μl dimethyl
sulfoxide (DMSO) was added. After the MTT crystals were completely
dissolved, the absorbance of each well was measured at 490 nm with
a microplate reader (Bio-Rad Laboratories, Inc., Hercules, CA,
USA).
Reverse transcription polymerase chain
reaction analysis
Complementary DNA (cDNA) was generated from 1
μg RNA with avian myeloblastosis virus reverse transcriptase
(Promega, Madison, WI, USA). Quantitative reverse transcription
polymerase chain reaction (qRT-PCR) analyses were performed with
the LightCycler and detection system (Roche Diagnostics GmbH,
Mannheim, Germany) as previously described (24). Gene expression was measured in
duplicate. The PCR conditions for CA9, E-cadherin, N-cadherin and
vimentin amplifications were: one denaturing cycle at 95°C for 10
min, followed by 45 cycles of: 95°C for 15 sec, a suitable
annealing temperature for 10 sec, 72°C for 30 sec and a final
extension at 72°C for 10 min. The annealing temperatures for CA9,
E-cadherin, N-cadherin and vimentin were 67, 64, 62 and 62°C,
respectively. The housekeeping gene, beta actin (β-actin), was
quantitatively amplified concurrently to verify the integrity of
the RNA. The primer sequences were as follows: CA9 forward primer,
5′-GATGAGAAGGCAGCAC AGAAGG-3′ and CA9 reverse primer, 5′-CTCTGGCTGG
CTTCTCACATTC-3′; E-cadherin forward primer, 5′-GAGA
AACAGGATGGCTGAAGG-3′ and E-cadherin reverse primer,
5′-TGAGGATGGTGTAAGCGATGG-3′; N-cadherin forward primer,
5′-TGTTGACTATGAAGGCAGTGG-3′ and N-cadherin reverse primer,
5′-TCAGTCATCACCTCCAC CAT-3′; vimentin forward primer,
5′-AGCTAACCAACGAC AAAGCC-3′ and vimentin reverse primer,
5′-TCCACTTTGC GTTCAAGGTC-3′; β-actin forward primer, 5′-GGCGGCAC
CCCATGTACCCT-3′ and β-actin reverse primer, 5′-AGGGG
CCGGACTCGTCATACT-3′.
Western blot analysis
Western blotting was performed as previously
described (25). Briefly, cell
cultures were lysed with RIPA Buffer (Thermo Fisher Scientific,
Inc., Rockford, IL, USA), according to the manufacturer's protocol.
Aliquots (15 μg) of proteins were electrophoresed on sodium
dodecyl sulfate-polyacrylamide gels containing 10% Tris-HCl
(Bio-Rad Laboratories). The separated proteins were transferred to
polyvinylidene difluoride membranes and incubated with primary
antibodies overnight at 4°C.
Immunofluorescence staining
For immunofluorescence staining, cells were seeded
on 12-well plates and stained according to procedures previously
described (25). Briefly, cells
were fixed in 4% paraformaldehyde for 15 min and permeabilized with
0.1% Triton X-100 in phosphate-buffered saline (PBS) for 10 min.
Then, the cells were incubated with anti-human CA9, anti-human
E-cadherin, or anti-human N-cadherin antibodies overnight at 4°C.
After washing, the cells were further incubated with Alexa Fluor
488 goat anti-rabbit IgG (Invitrogen) or Alexa Fluor 546 goat
anti-mouse IgG (Invitrogen) for 30 min at room temperature.
Finally, the cells were washed and incubated with Hoechst staining
solution for 3 min. Preparations were analyzed with fluorescence
microscopy (Keyence Corp., Osaka, Japan).
Immunohistochemistry
Immunohistochemical staining was performed to
determine CA9 expression in samples resected from patients with
HCC. Briefly, formalin-fixed, paraffin-embedded, 4-μm thick
sections were deparaffinized, then treated with an antigen
retrieval procedure. Sections were incubated in methanol containing
0.3% hydrogen peroxide to block endogenous peroxidase. Sections
were then incubated with a normal protein-blocking serum solution
and a biotin-blocking solution (Vector Laboratories, Burlingame,
CA, USA), as recommended by the manufacturer. Next, the sections
were incubated overnight at 4°C with a mouse monoclonal anti-human
CA9 antibody (Abcam; 1:200). After washing in PBS, the sections
were incubated with biotin-conjugated secondary antibody (horse
anti-mouse IgG) and with peroxidase-conjugated streptavidin. The
peroxidase reaction was then developed with 0.02% of
3,30-diaminobenzidine tetrachloride (Wako Pure Chemical Industries,
Ltd., Osaka, Japan) solution with 0.03% hydrogen peroxidase.
Finally, the sections were counter-stained with Meyer's
hematoxylin. Negative control sections were treated the same,
except that the primary antibody was replaced with Tris-buffered
saline.
Evaluation of immunohistochemistry
Immunohistochemically stained sections were
evaluated independently by two investigators; both were unaware of
the clinical data. The sections were first scanned with light
microscopy at low magnification (×40); then, all fields were
examined at a final magnification of ×400. Results were expressed
as the percentage of positively stained cells (a) and the staining
intensity (b). The percentage of positively stained cells was
graded as follows: 0 (no staining), 1 (≤10% of cells stained), 2
(11–50% of cells stained), 3 (51–75% of cells stained), or 4
(>75% of cells stained). The staining intensity was scored as
follows: 0 (no staining), 1 (weaker than the positive control), or
2 (equal to the positive control; Fig.
7Aa-c). The immunoreactivity score (IRS) was calculated as
follows: IRS = a × b, range 0–8. Tumors with IRS values of 0–1 were
considered CA9-negative and tumors with IRS scores of 2–8 were
considered CA9-positive.
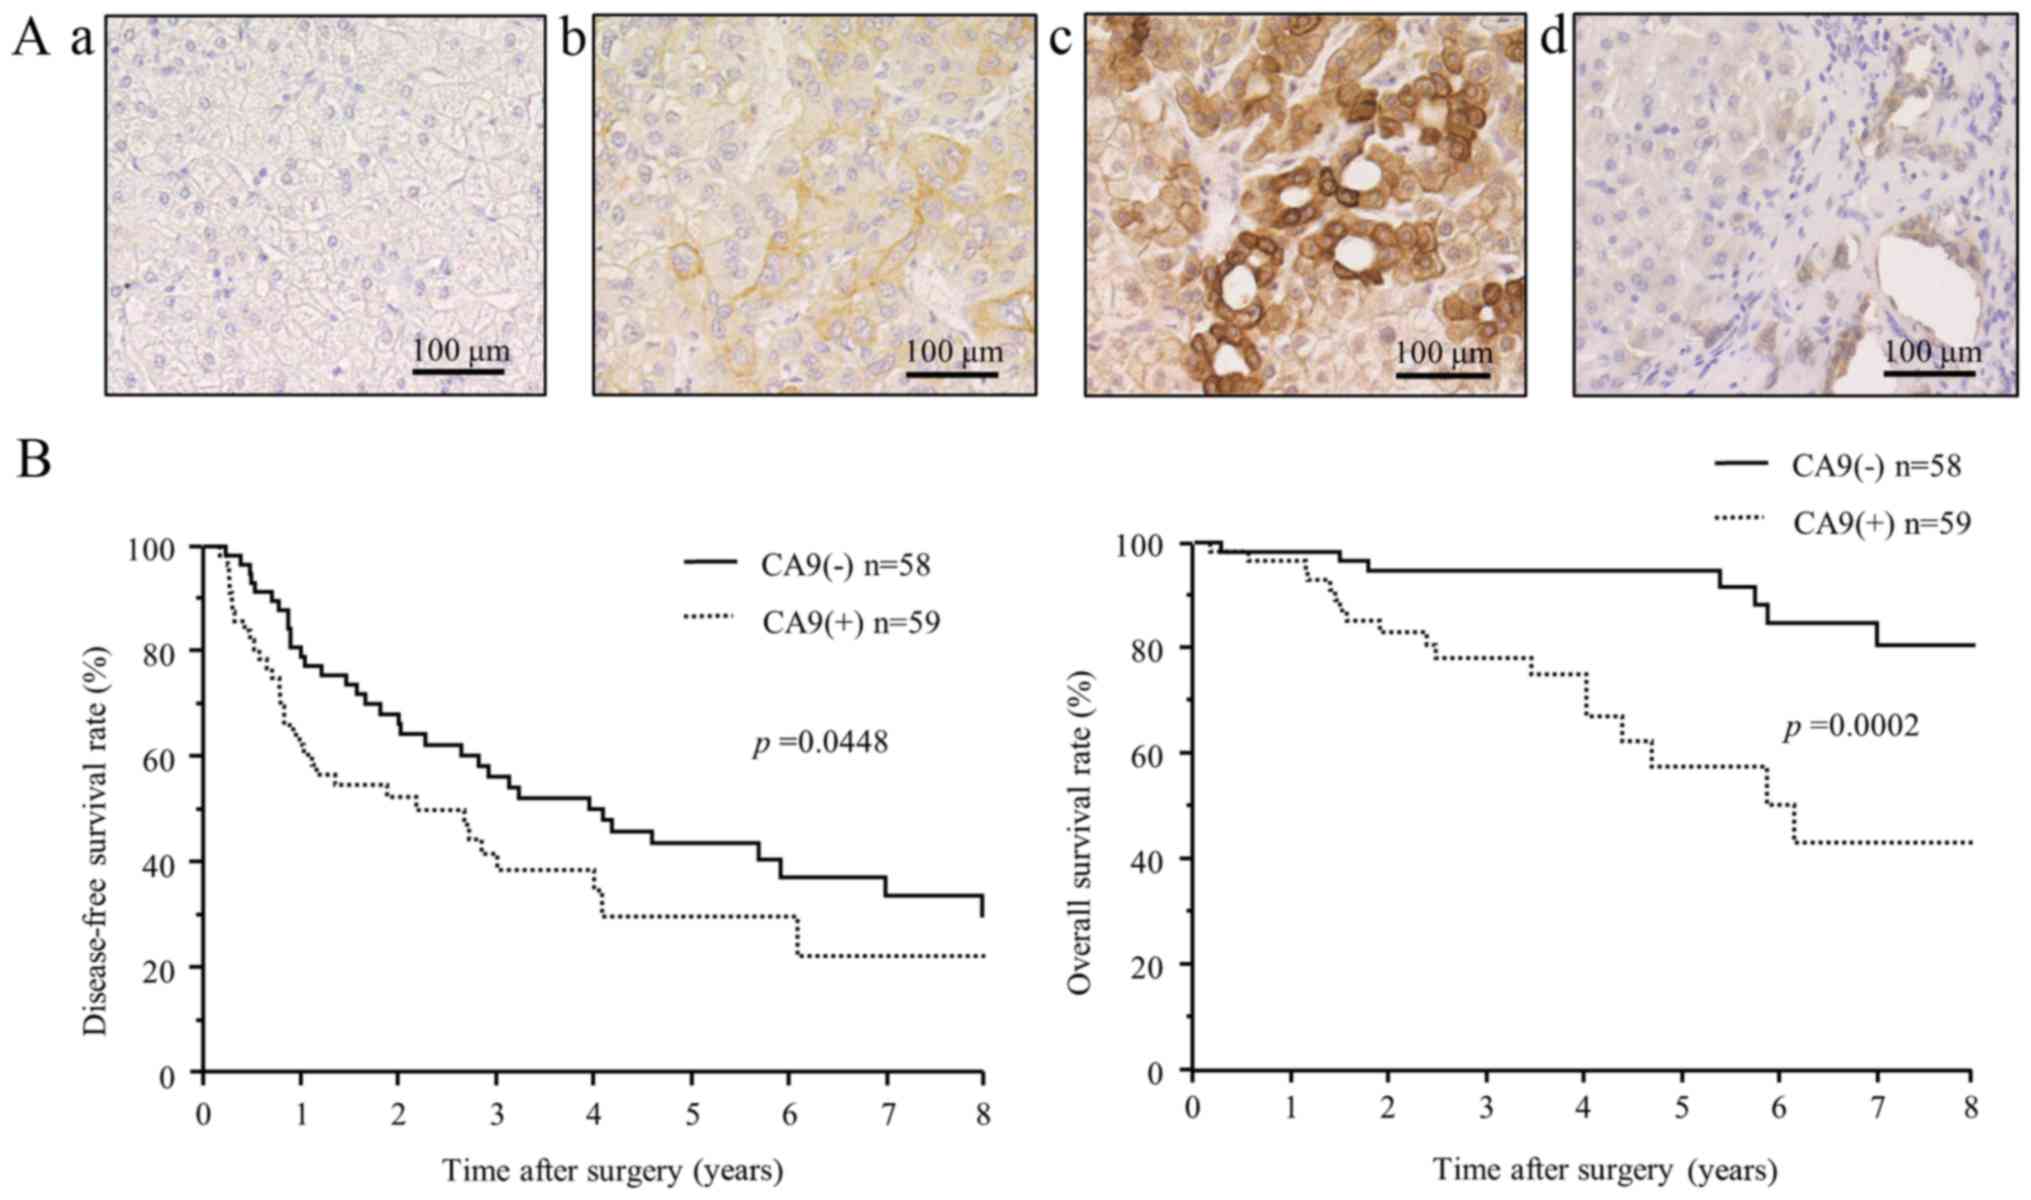 | Figure 7Immunohistochemical expression and
clinical significance of CA9 in hepatocellular carcinoma. (A)
Immunohistochemical staining of CA9 in cancer cells and adjacent
non-cancerous liver tissue. Representative images show different
CA9 tissue expression levels, with intensity scores of: (top left,
a) 0, no staining, (top right, b) 1, weak staining, and (bottom
left, c) 2, strong staining. (Bottom right, d) CA9 was rarely
expressed in normal liver parenchyma, but strong expression was
detected in intrahepatic bile ducts. Scale bars, 100 μm. (B)
Kaplan-Meier disease-free survival curve (top) and overall survival
curve (bottom) of patients with CA9-positive tumors (dotted lines)
or CA9-negative tumors (solid lines). The CA9-positive group showed
significantly shorter disease-free survival (P=0.0448) and overall
survival (P=0.0002) than the CA9-negative group. |
Statistical analysis
Data from in vitro experiments and all
clinicopathological indicators were compared with the Fisher's
exact test. Continuous variables were compared with the Student's
t-test. Survival curves were calculated with the Kaplan-Meier
method, and differences between the survival curves were compared
with the log-rank test. To evaluate the risk associated with
prognostic variables, we applied the Cox model to determine the
hazard ratio and the 95% confidence interval (95% CI). All
statistical analyses were performed with the statistical software
JMP, version 11 (SAS Institute, Inc., Cary, NC, USA). Two-sided
P<0.05 were considered statistically significant.
Results
Expression of CA9 under hypoxic
conditions in HCC cells
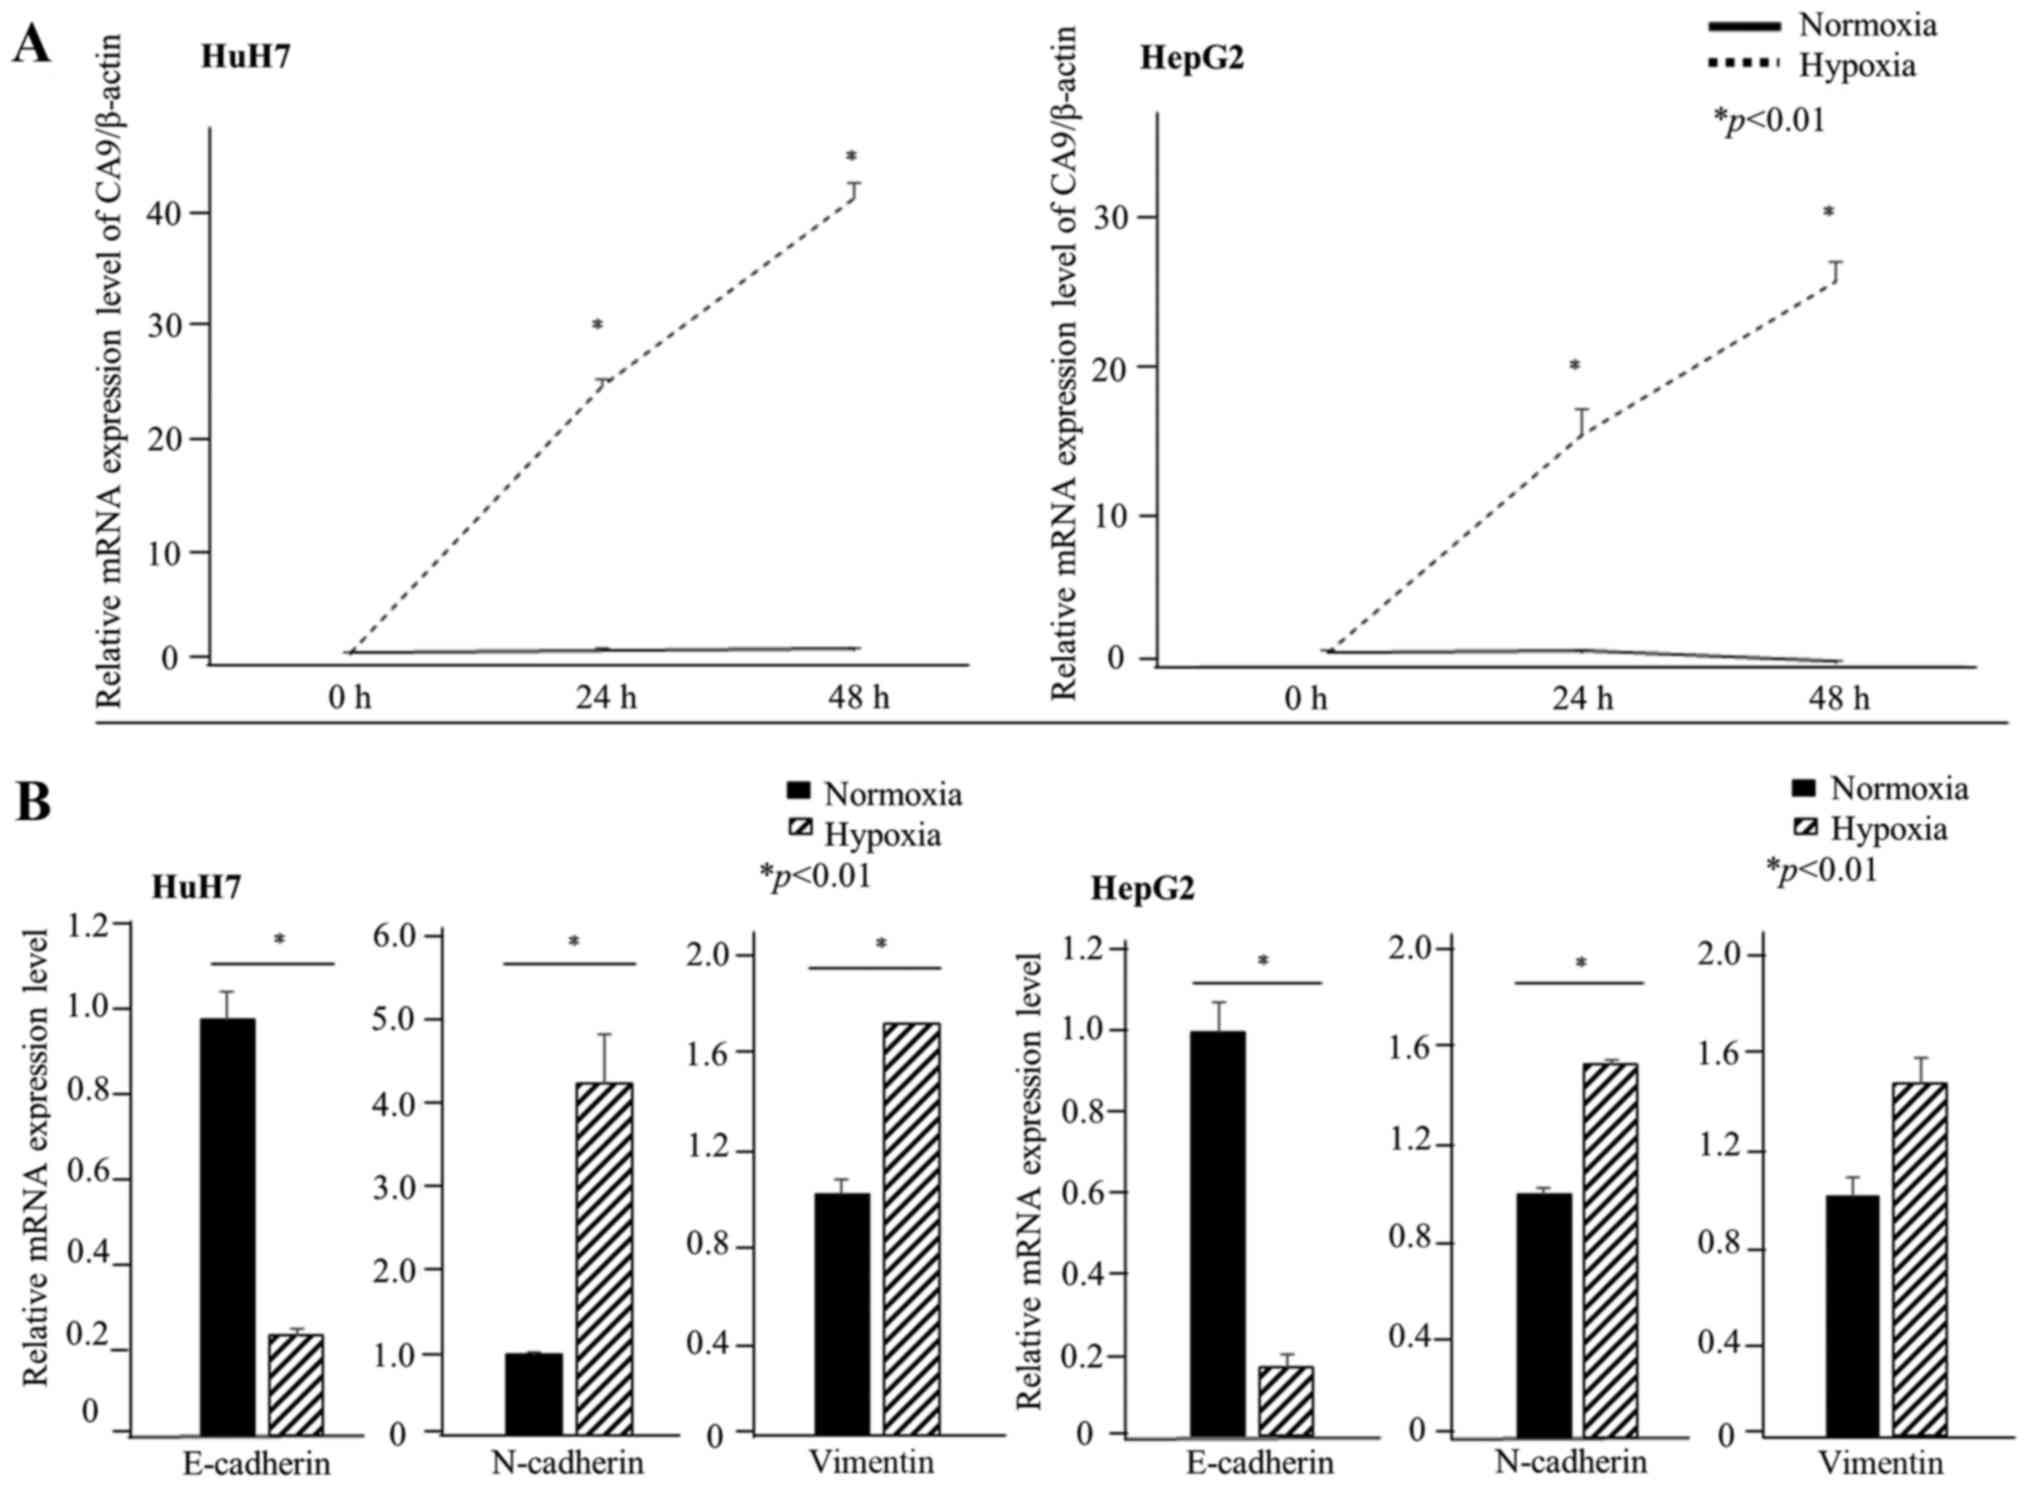
First, we evaluated whether CA9 was induced under
hypoxic conditions in HCC cell lines. CA9 gene expression in
HuH7 cells was approximately four times higher than that in HepG2
cells under normoxia. CA9 gene expression increased after 24
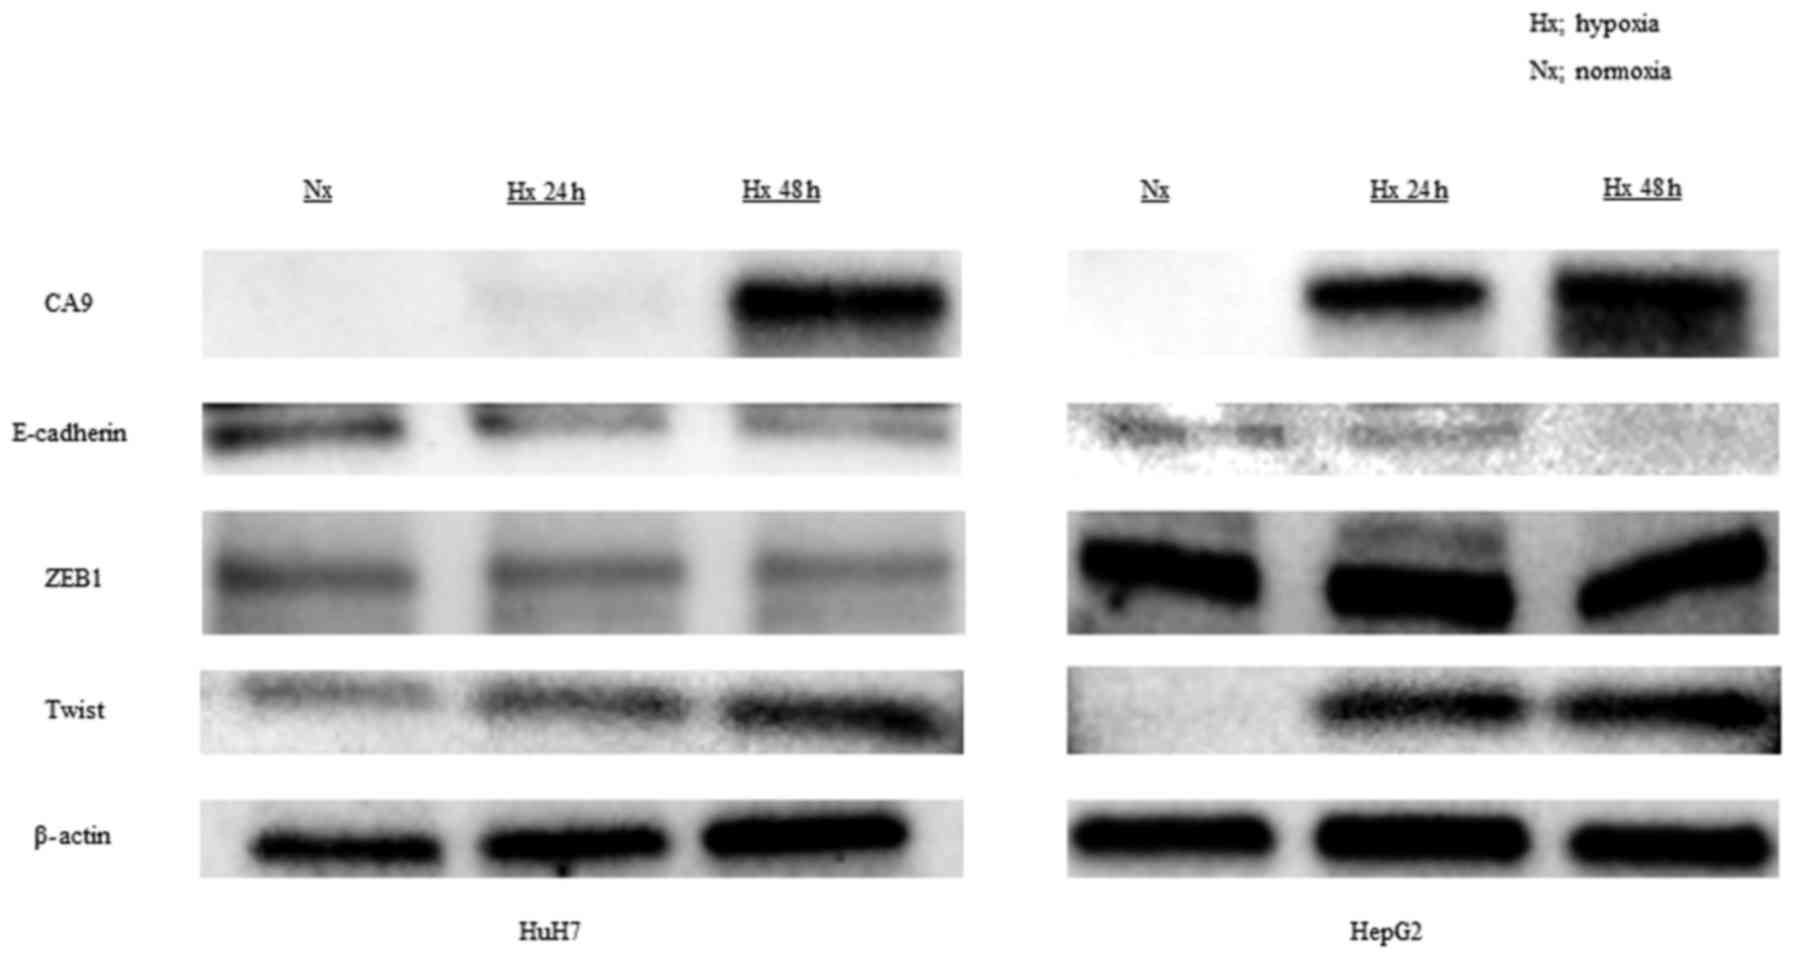
h of exposure to 1% oxygen in both HuH7 and HepG2 cells (Fig. 1A). CA9 protein levels also
increased under hypoxic conditions after 24 h in both cell lines
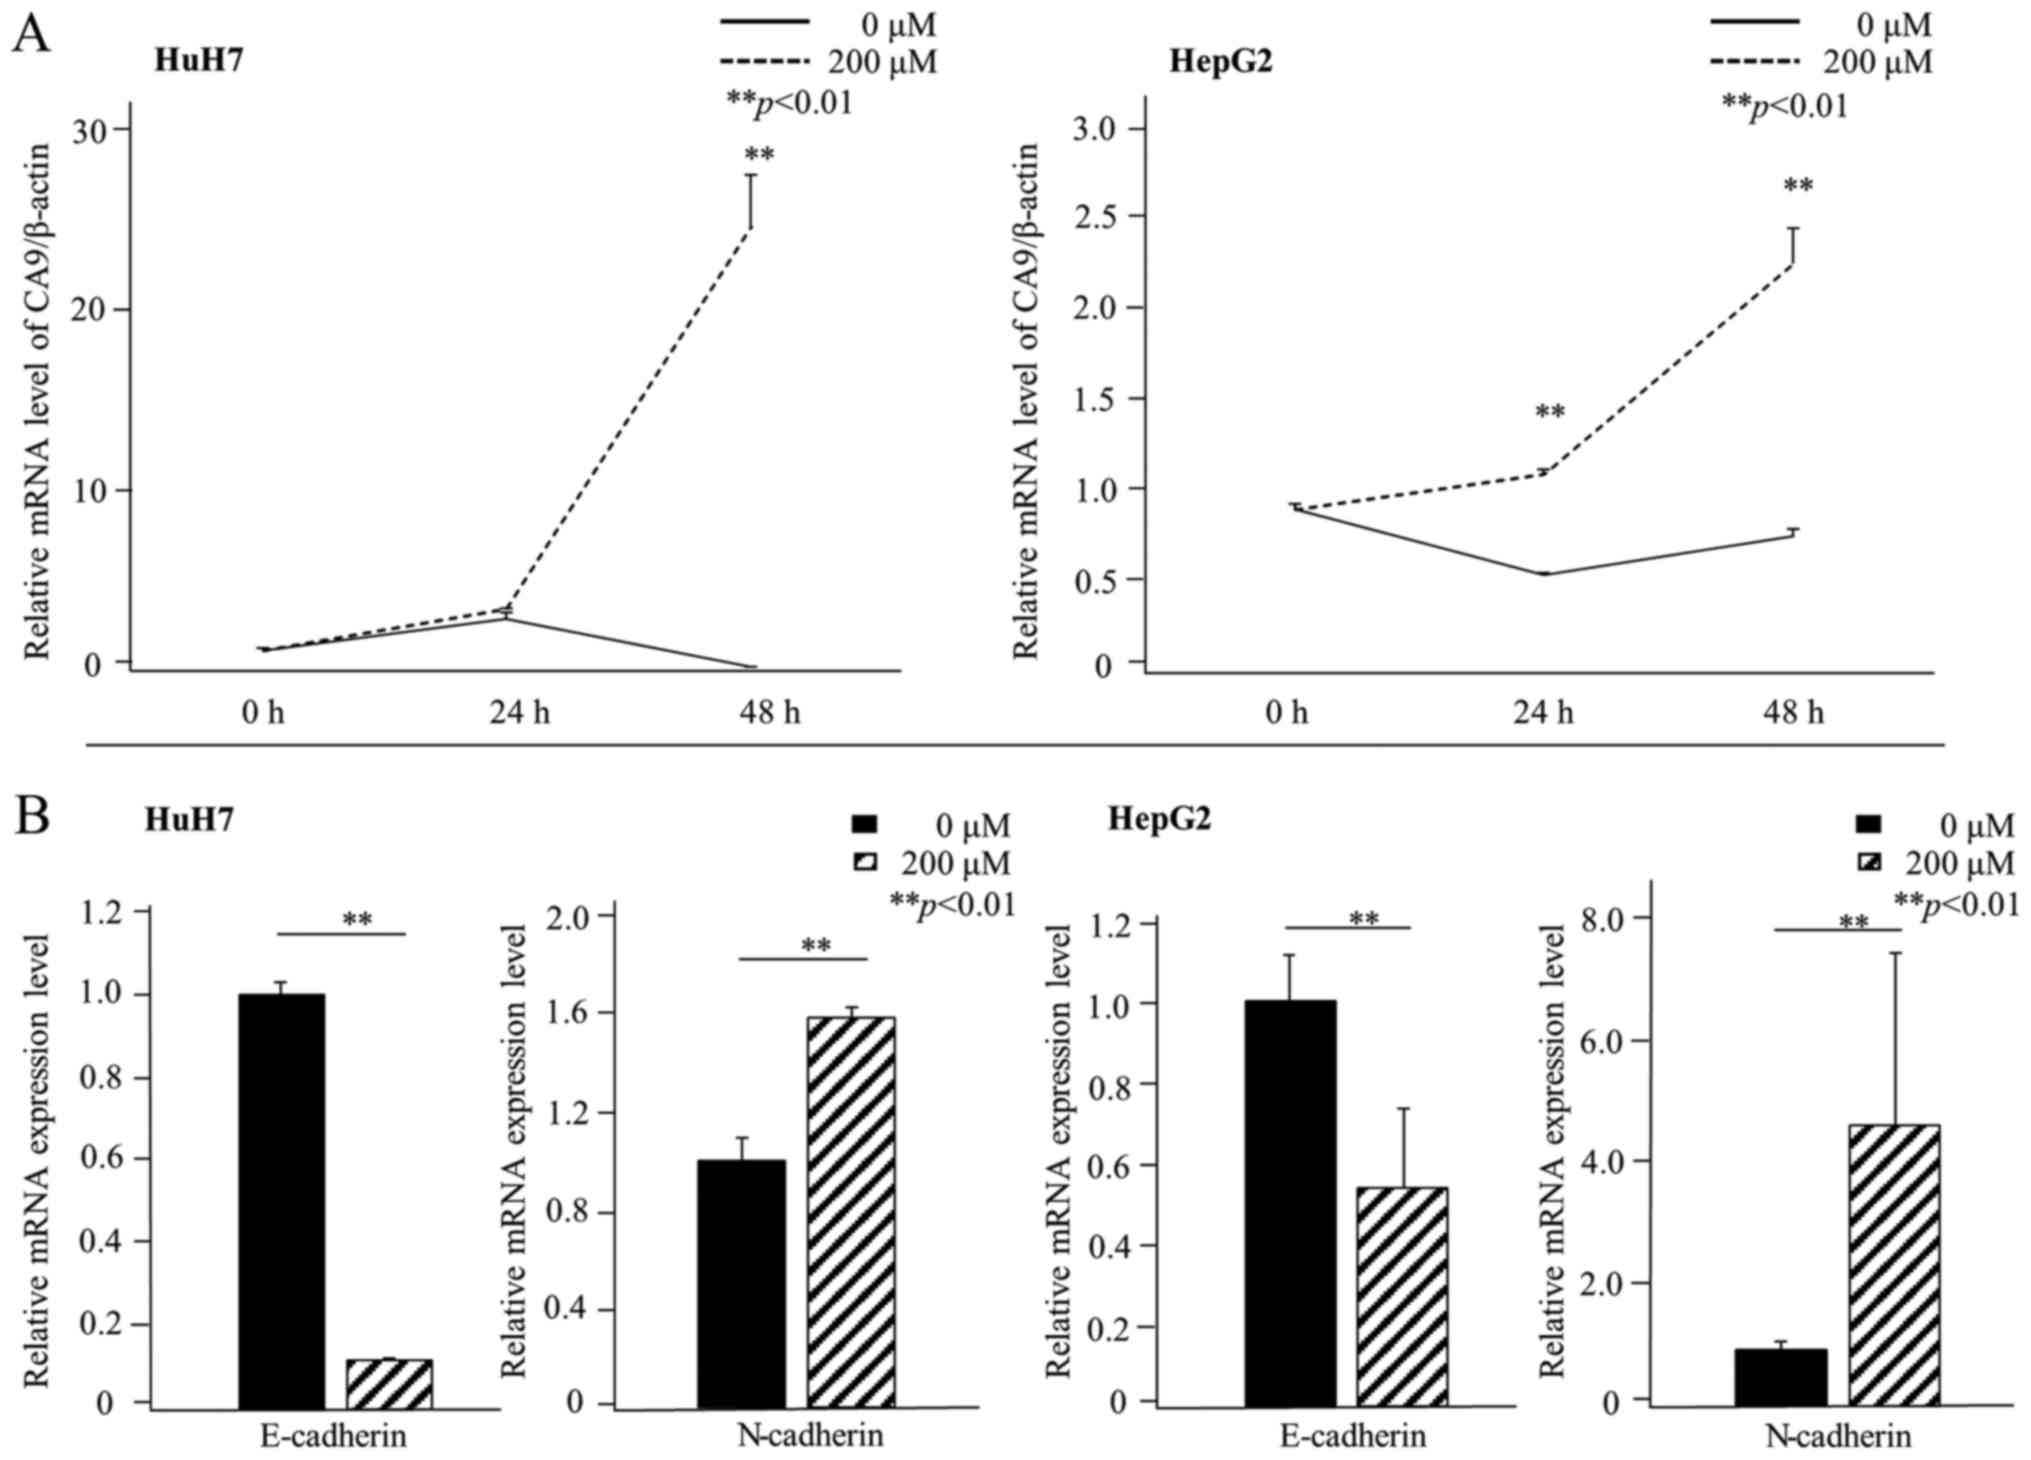
(Fig. 2). We used
CoCl2, a chemical inducer of HIF-1α, to mimic hypoxic
conditions in vitro. In HuH7 cells, CA9 gene
expression increased within 48 h of exposure to CoCl2.
In HepG2 cells, CA9 gene expression significantly increased
within 24 h of exposure to CoCl2 (Fig. 3A).
Morphological changes and E-cadherin and
N-cadherin expression in hypoxia
Next, we examined cells for morphological changes
and determined whether EMT marker expression was altered in hypoxic
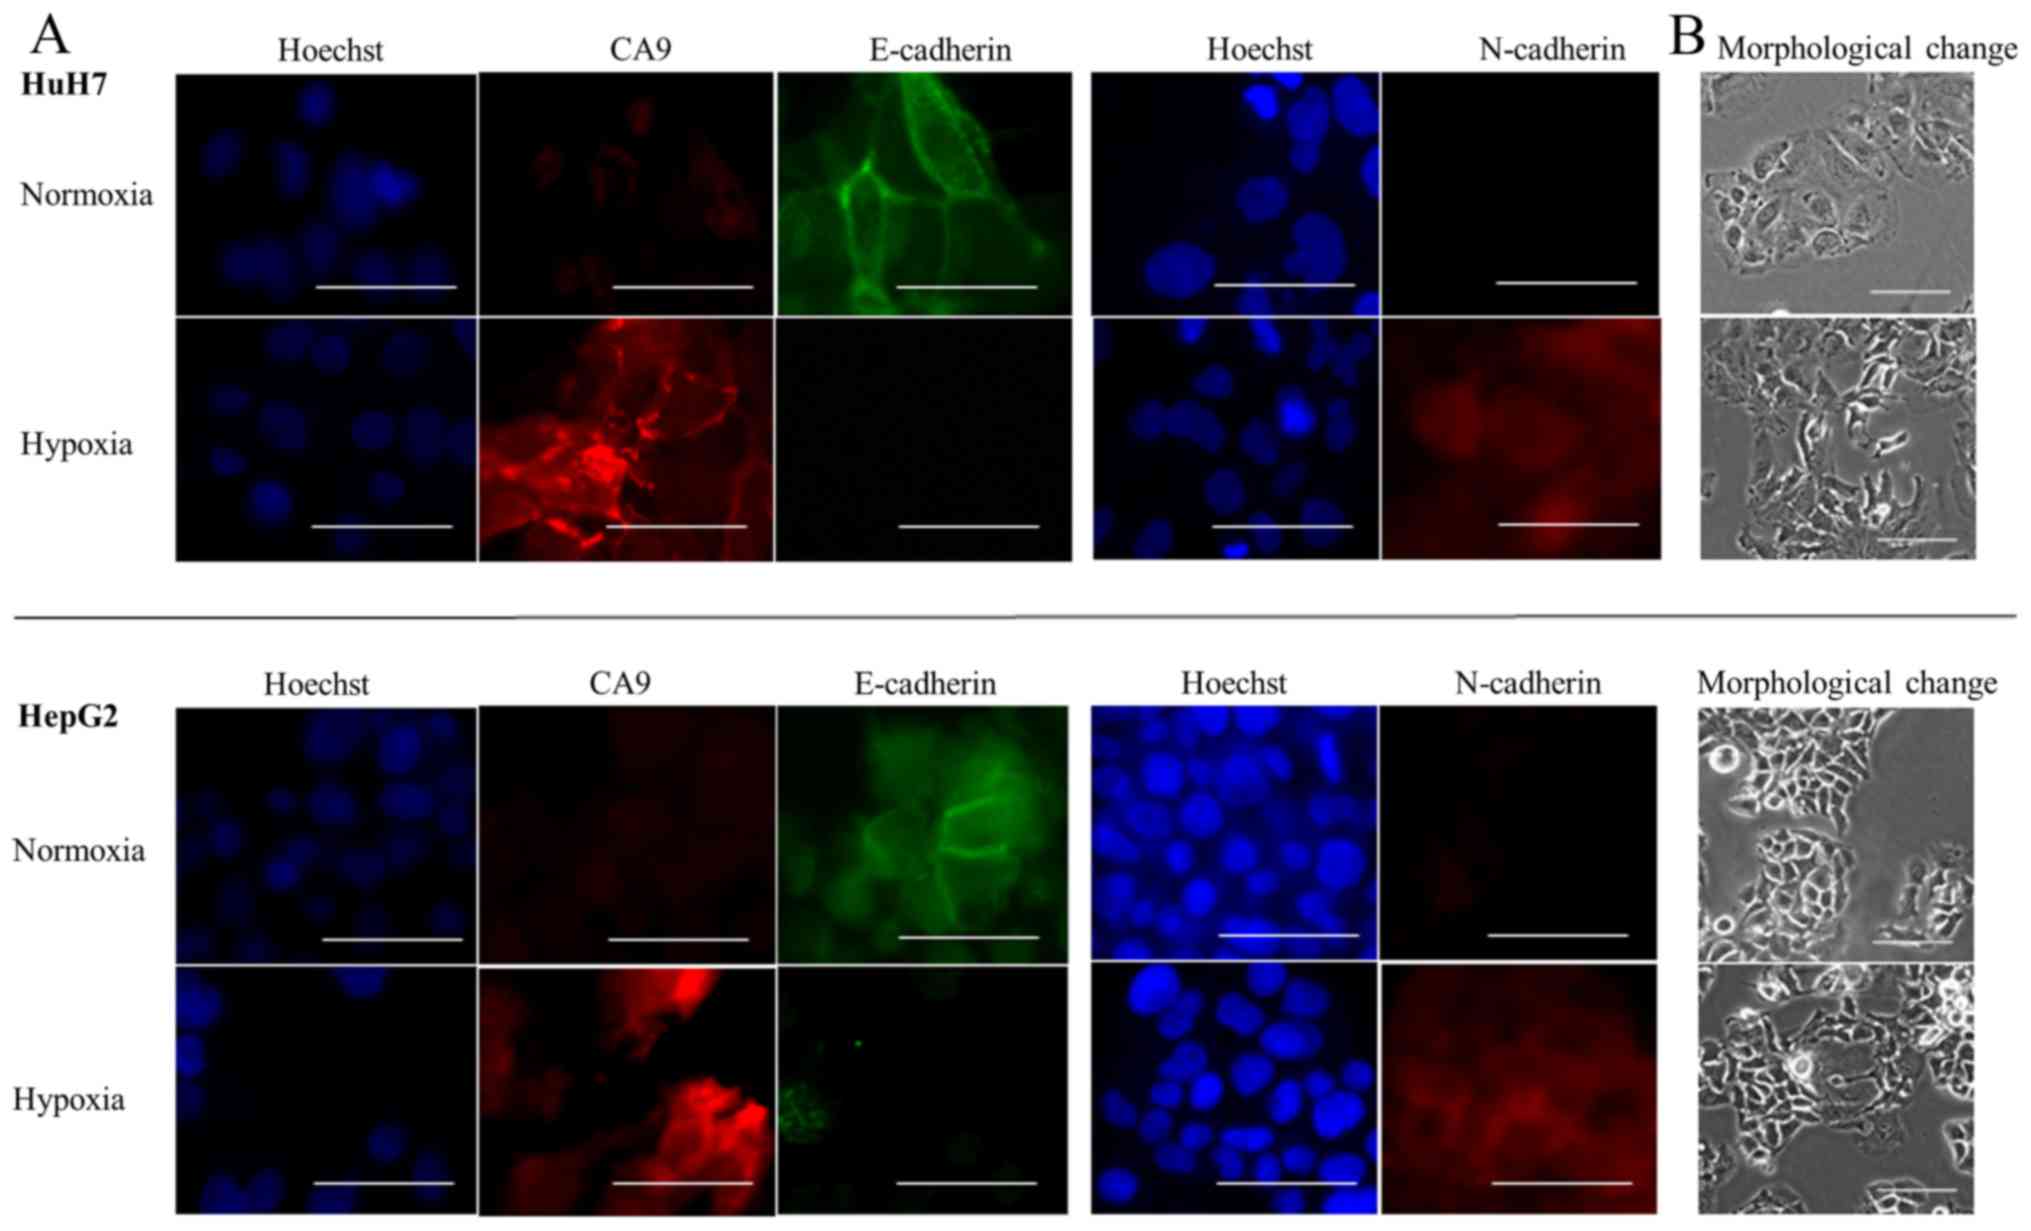
conditions. We found that both HuH7 and HepG2 cells became
spindle-shaped after 72 h of hypoxia (Fig. 4B). Moreover, under hypoxic
conditions, the relative mRNA levels indicated a decrease in the
expression of E-cadherin, which plays a pivotal role in the
behavior of cells on epithelium, and an increase in N-cadherin
expression. We also evaluated the expression of vimentin under
hypoxia. Vimentin gene expression increased under hypoxia in both
HuH7 and HepG2 cells although the difference was not significant in
HepG2 cells (Fig. 1B). Western
blot analyses also revealed that hypoxia downregulated the
expression of E-cadherin and upregulated the expression of Twist, a
transcriptional regulator of the EMT (Fig. 2).
We then investigated whether CoCl2
treatment altered the expression of E-cadherin and N-cadherin.
After 48 h of exposure to conditions that mimicked hypoxia, both
HuH7 and HepG2 cells showed relative reductions in E-cadherin mRNA
levels and relative increases in N-cadherin mRNA levels (Fig. 3B). Immunofluorescence staining
showed that E-cadherin was expressed on the membranes of cells, and
that CA9 was not expressed in normoxic conditions. After exposing
the cells to conditions that mimicked hypoxia, CA9 expression
increased on cell membranes and in the cytoplasm, E-cadherin
expression was lost and N-cadherin expression was gained (Fig. 4A). Thus, we confirmed that both
hypoxia and exposure to CoCl2 caused CA9 induction and
E-cadherin repression.
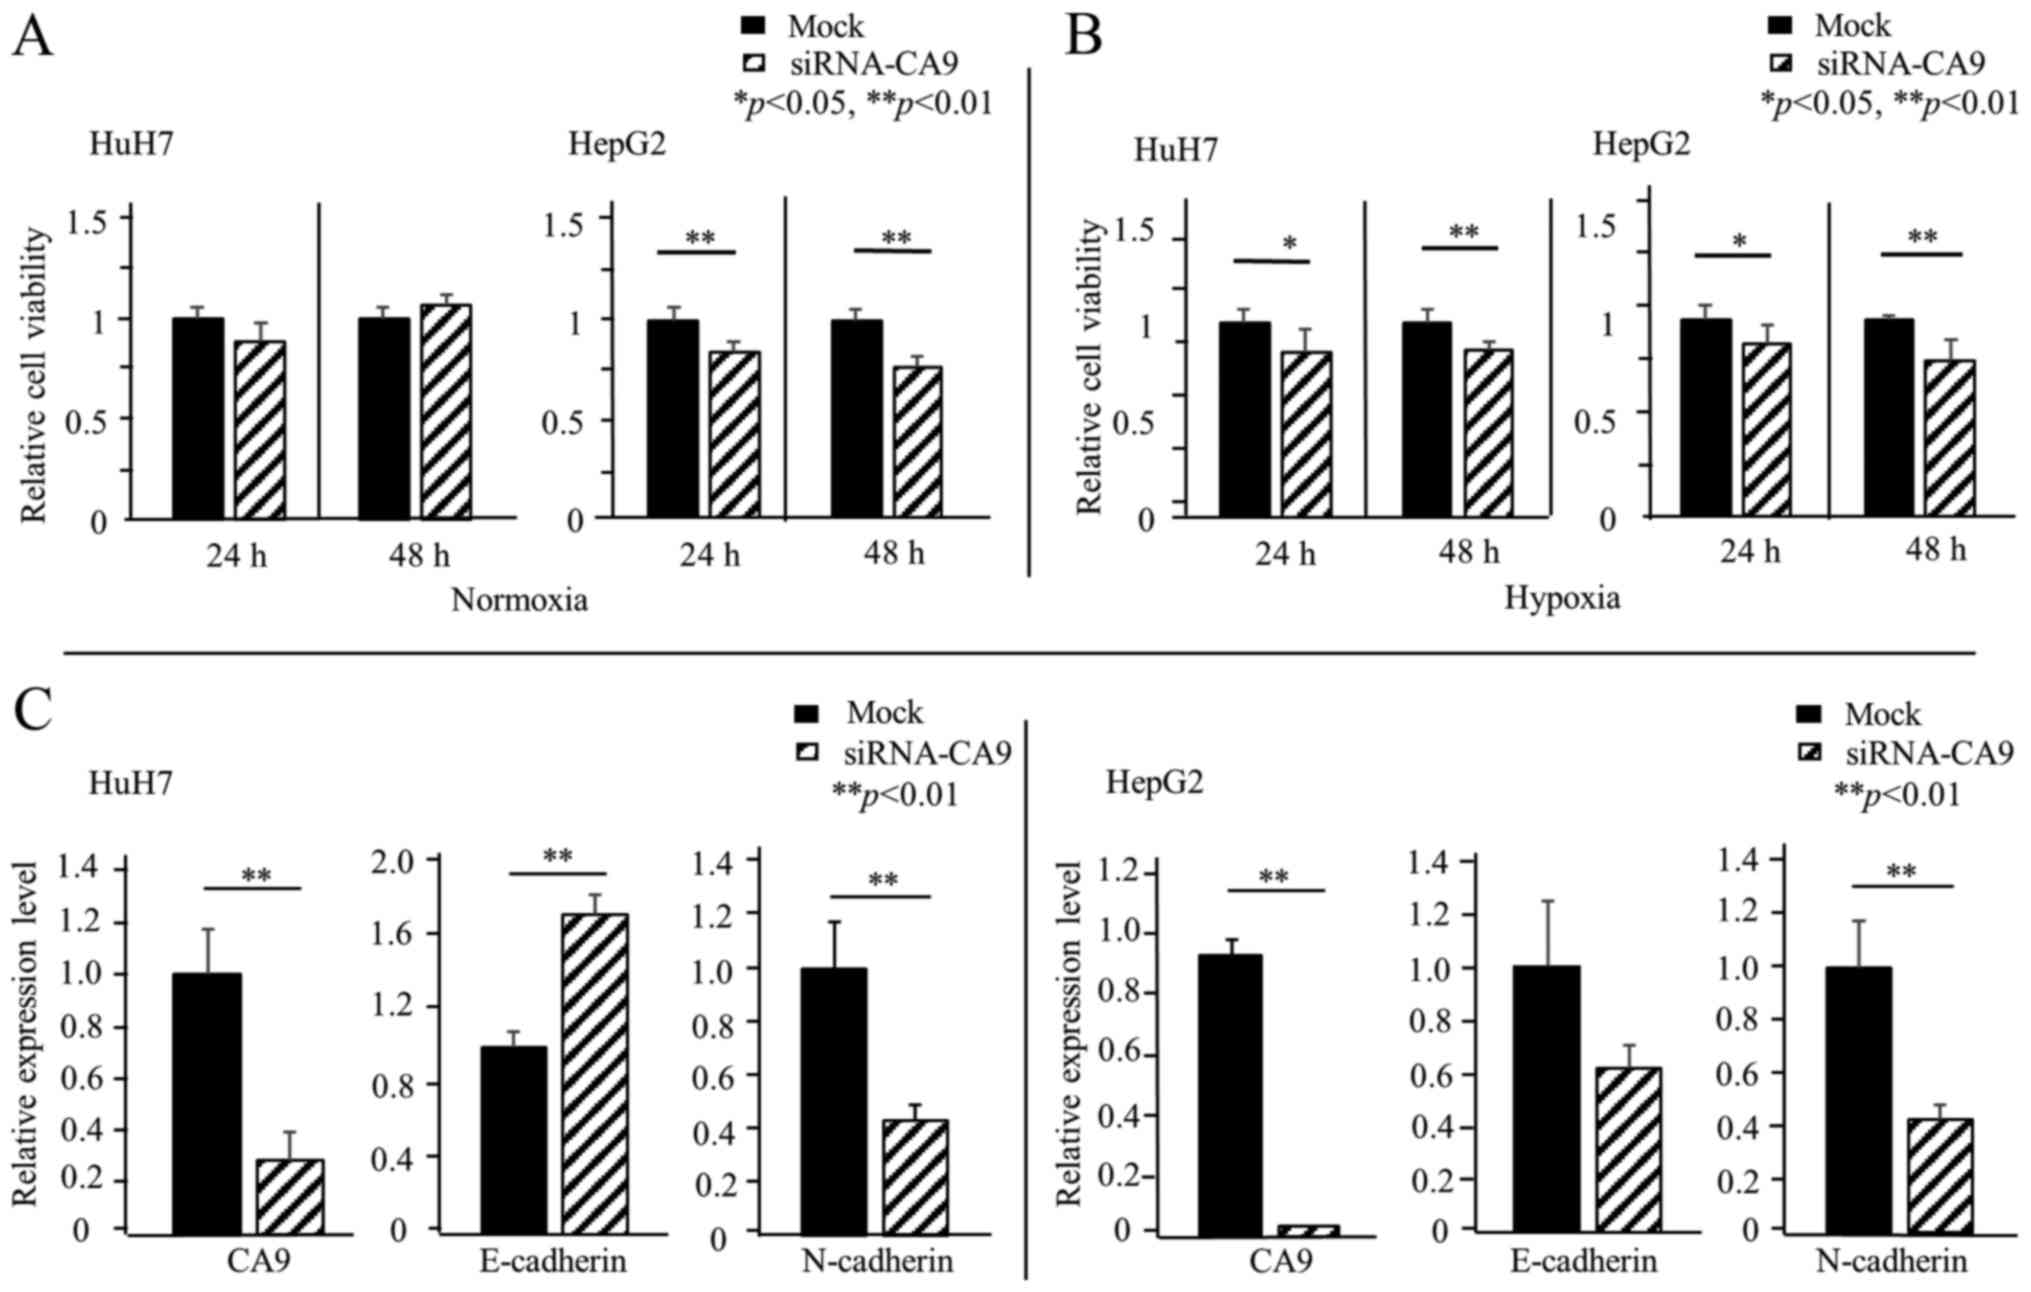
siRNA-mediated knockdown of CA9:
influence on cell growth
To clarify the effects of CA9 on cell growth, we
performed a knockdown of CA9 with a CA9-specific siRNA.
Transfection of CA9 siRNA into HuH7 and HepG2 cells repressed the
CA9 mRNA level to <20% of the control (mock-transfected). Under
normoxic conditions, HuH7 cells with the CA9 knockdown showed no
significant difference in relative cell viability compared to
controls. However, in HepG2 cells, the CA9 knockdown significantly
decreased the relative cell viability in normoxic conditions
(Fig. 5A). Under hypoxic
conditions, the CA9 knockdown decreased relative cell viabilities
in both HuH7 and HepG2 cells (Fig.
5B).
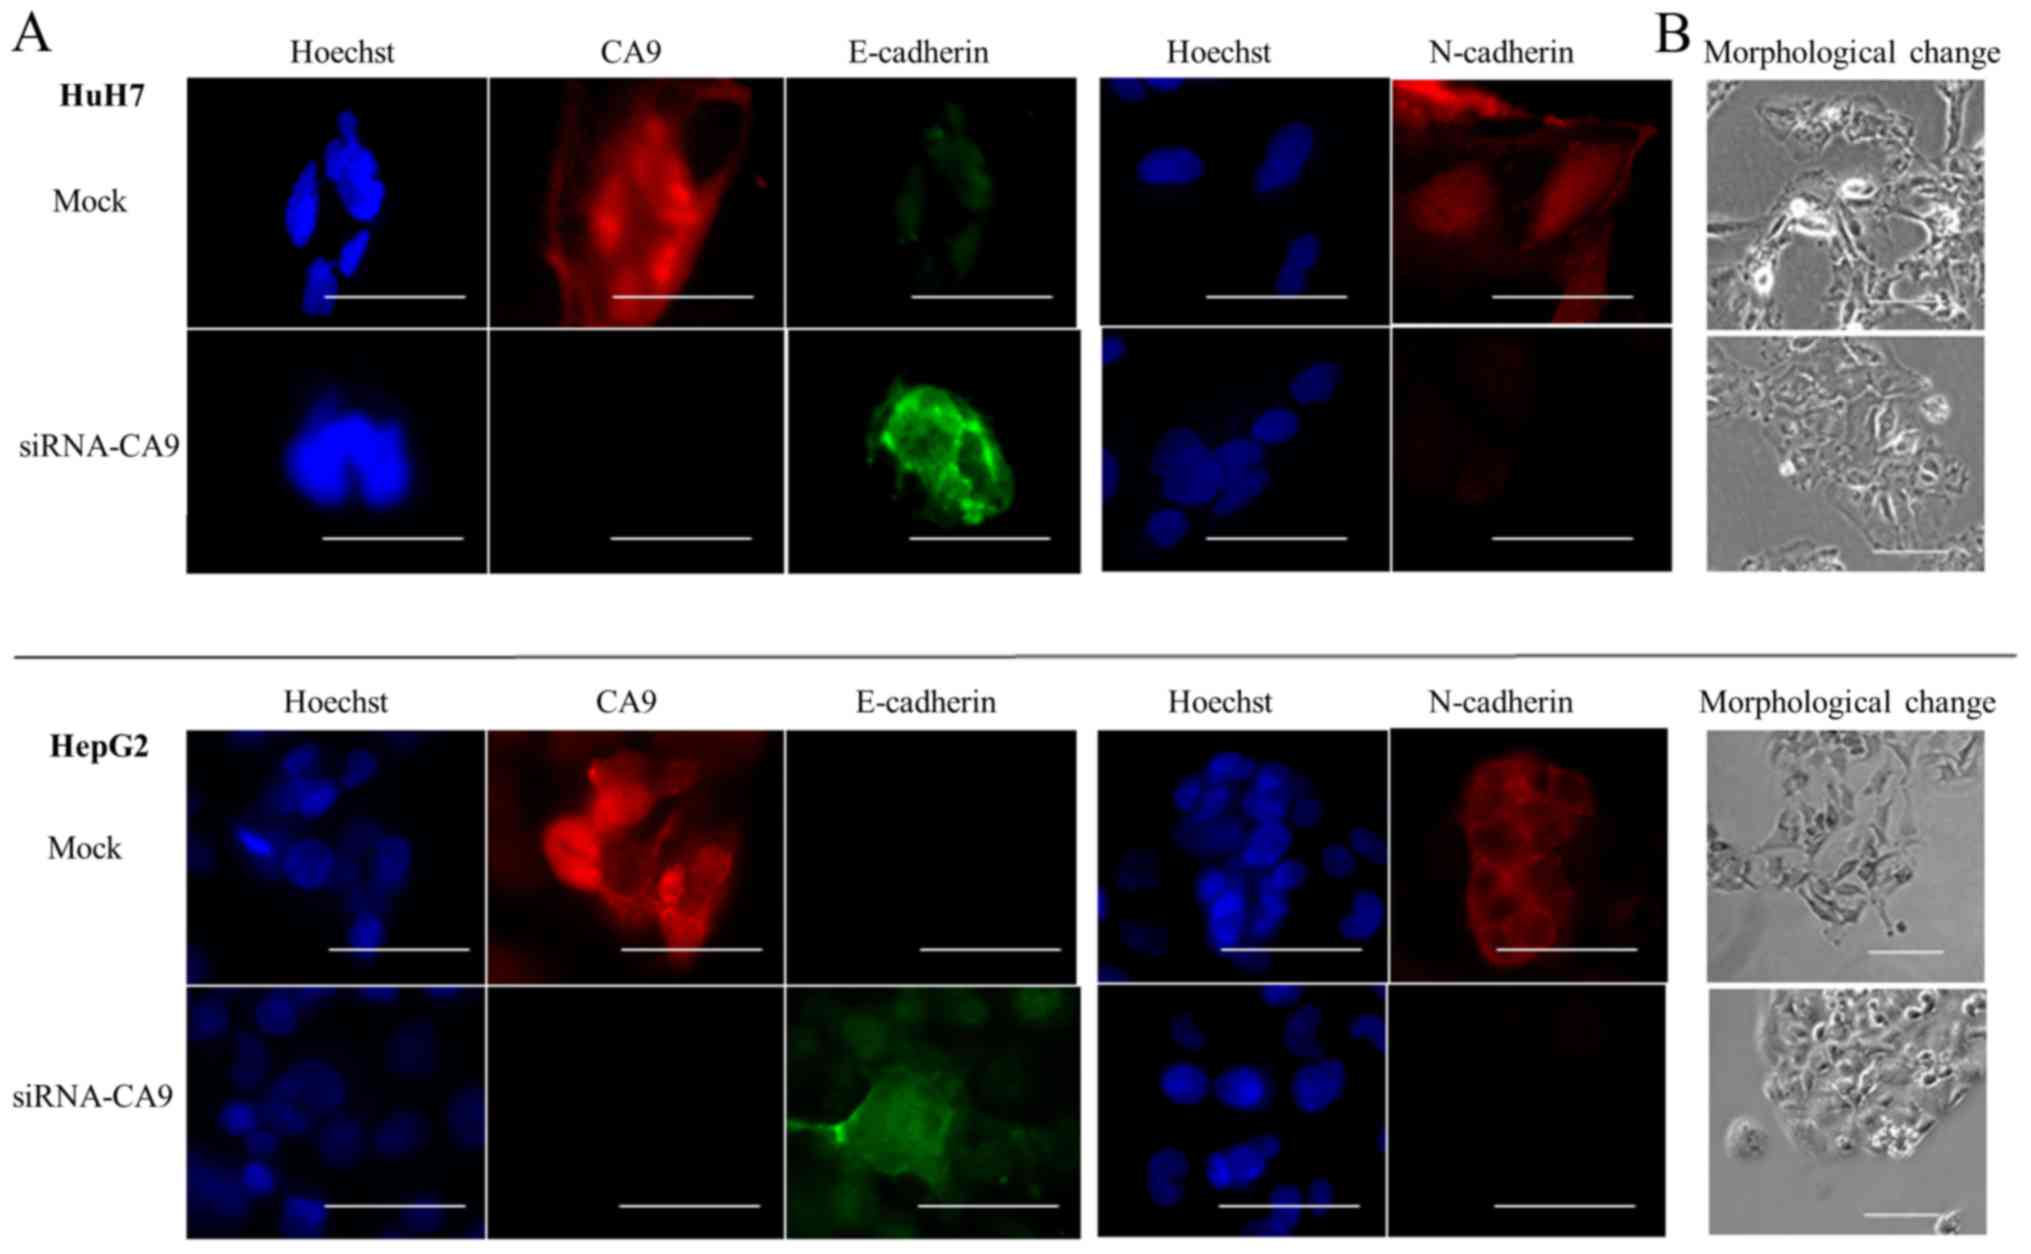
Effect of the CA9 knockdown on
hypoxia-induced EMT
In HuH7 and HepG2 cells transfected with siRNA-CA9,
we evaluated the expression of E-cadherin and N-cadherin in hypoxic
conditions. Both qRT-PCR and immunofluorescence staining results
showed that the CA9-knockdown abrogated hypoxia-mediated E-cadherin
repression in HuH7, but not HepG2, cells. The CA9 knockdown also
attenuated hypoxia-induced N-cadherin expression in both HuH7 and
HepG2 cells (Figs. 5B and 6A). Moreover, cells with the
CA9-knockdown exhibited less spindle-shaped morphology than cells
with unaltered CA9 expression (Fig.
6B). These results suggested that knocking down CA9
counteracted hypoxia-induced EMT. Thus, CA9 might regulate
hypoxia-promoted EMT.
Correlations between tumor CA9 expression
and clinicopathological findings
To elucidate the clinical significance of CA9
expression in HCC, we performed immunohistochemical evaluations of
HCC tissue samples acquired from 117 patients that underwent
radical surgery. We detected little or no CA9 reactivity in
hepatocytes from liver tissue adjacent to the tumor, but we
detected moderate to strong CA9 reactivity in the interlobular bile
ducts. The expression of CA9 in HCC was heterogeneous and there
were no specific areas in which CA9 was overexpressed, such as
central lesions or marginal lesions. The IRS evaluations indicated
that, of the 117 tumors, 59 (50.4%) showed positive CA9 staining
and 58 (49.6%) showed negative CA9 staining.
Next, we evaluated correlations between CA9
expression and clinicopathological factors. Table I shows the relationship between
immunohistochemical detection of CA9 expression and
clinicopathological characteristics of 117 patients with HCC. We
found no significant difference in clinicopathological factors
between the CA9-positive and CA9-negative groups.
 | Table IClinicopathological factors of 117
patients with resected hepatocellular carcinoma. |
Table I
Clinicopathological factors of 117
patients with resected hepatocellular carcinoma.
| Variables | CA9(+) (N=59) | CA9(-) (N=58) | P-value |
|---|
| Baseline
characteristics | | | |
| Age
(years)a | 68.7±1.3 | 66.7±1.3 | 0.15 |
| Sex
(male/female) | 50/9 | 42/16 | 0.12 |
| HBs-Ag (+/−) | 13/49 | 14/44 | 0.83 |
| Anti-HCV Ab
(+/−) | 30/29 | 32/26 | 0.71 |
| Child-Pugh
classification (A/B) | 50/9 | 51/6 | 0.58 |
| AFP
(ng/ml)a | 7553±12913 | 18952±13024 | 0.73 |
| PIVKA-II
(mAU/ml)a | 4912±6047 | 9267±6099 | 0.69 |
| Pathologic
characteristics | | | |
| Tumor size
(cm)a | 3.5±0.3 | 3.8±0.3 | 0.73 |
| Number of tumors
(St/Mt) | 43/16 | 44/14 | 0.83 |
| Macroscopic Vp
(+/−) | 8/51 | 5/53 | 0.56 |
| Histological type
(well, mod/por) | 30/29 | 26/32 | 0.58 |
| Liver cirrhosis
(NL, CH/LC) | 37/22 | 32/26 | 0.84 |
| Microscopic vp
(+/−) | 17/42 | 15/43 | 0.83 |
Univariate and multivariate analyses of
associations between patient survival and CA9 expression
Fig. 7 shows the
disease-free survival (DFS) and overall survival (OS) after surgery
for patients with and without CA9 expression. The CA9-positive
group showed significantly shorter DFS and OS, compared to the
CA9-negative group. The 1-, 3- and 5-year DFS rates were 62.5, 41.7
and 29.9%, respectively, for patients with positive CA9 expression,
and 79.1, 56.3, 43.7%, respectively, for those with negative CA9
expression (P=0.045). The 1-, 3- and 5-year OS rates were 96.6,
78.2 and 57.6% for patients with positive CA9 expression, and 98.3,
94.7 and 94.7%, respectively, for those with negative CA9
expression (P=0.0002).
We also evaluated the prognostic factors for DFS and
OS in univariate and multivariate analyses. The univariate analysis
of DFS data revealed several factors that were significantly
associated with postoperative recurrence, including serum AFP
(P=0.0048), number of tumors (P=0.0088), macroscopic vascular
invasion (P=0.026), liver cirrhosis (P=0.026), microscopic vascular
invasion (P=0.0011) and CA9 expression (P=0.046). The multivariate
analysis of DFS data revealed four significant independent
prognostic factors, including serum AFP (P=0.029), liver cirrhosis
(P=0.009), microscopic vascular invasion (P=0.018), and CA9
expression (P=0.02; Table
II).
| Table IIFactors related to disease-free
survival (DFS), based on univariate and multivariate analyses. |
Table II
Factors related to disease-free
survival (DFS), based on univariate and multivariate analyses.
| Variables | Univariate
| Multivariate
|
|---|
| HR | 95% CI | P-value | HR | 95% CI | P-value |
|---|
| Age (≥70 vs. <70
years) | 2.00 | 6.30–0.50 | 0.21 | | | |
| Sex (male vs.
female) | 1.75 | 0.97–3.43 | 0.06 | | | |
| HBs-Ag (yes vs.
no) | 0.60 | 0.31–1.08 | 0.09 | | | |
| HCV-Ab (yes vs.
no) | 1.54 | 0.96–2.54 | 0.07 | | | |
| Child-Pugh
classification (A vs. B) | 0.86 | 0.45–1.85 | 0.67 | | | |
| AFP (≥20 vs. <20
ng/ml) | 1.97 | 1.23–3.17 |
<0.01 | 1.99 | 1.19–3.39 |
<0.01 |
| PIVKA-II (≥100 vs.
<100 U/ml) | 1.59 | 0.99–2.60 | 0.06 | | | |
| Tumor size (≥20 vs.
<20 mm) | 1.10 | 0.95–12.7 | 0.06 | | | |
| Number of tumors
(St vs. Mt) | 0.49 | 0.30–0.83 |
<0.01 | 0.92 | 0.52–1.65 | 0.76 |
| Macroscopic Vp (yes
vs. no) | 2.44 | 1.12–4.73 | 0.03 | | | |
| Histological type
(well, mod/por) | 0.68 | 0.42–1.09 | 0.11 | | | |
| Liver cirrhosis
(NL+CH vs. LC) | 0.58 | 0.36–0.94 | 0.03 | 0.51 | 0.30–0.85 |
<0.01 |
| Microscopic vp (yes
vs. no) | 2.53 | 1.47–4.23 |
<0.01 | 2.19 | 1.25–3.77 |
<0.01 |
| CA9 (positive vs.
negative) | 1.63 | 1.01–2.64 | 0.05 | 1.18 | 1.07–2.96 | 0.03 |
Univariate analyses of OS data showed several
factors that were significantly associated with postoperative
survival, including HCV infection (P=0.037), serum AFP (P=0.019),
serum PIVKA-II (P=0.044), macroscopic vascular invasion (P=0.007),
microscopic vascular invasion (P=0.005) and CA9 expression
(P=0.0003). The multivariate analysis of OS data revealed three
significant independent prognostic factors, including HCV infection
(P=0.05), microscopic vascular invasion (P=0.011) and CA9
expression (P<0.001; Table
III).
| Table IIIFactors related to overall survival
(OS), based on univariate and multivariate analyses. |
Table III
Factors related to overall survival
(OS), based on univariate and multivariate analyses.
| Variables | Univariate
| Multivariate
|
|---|
| HR | 95% CI | P-value | HR | 95% CI | P-value |
|---|
| Age (≥70 vs. <70
years) | 0.97 | 0.39–2.19 | 0.94 | | | |
| Sex (male vs.
female) | 1.83 | 0.69–6.28 | 0.24 | | | |
| HBs-Ag (yes vs.
no) | 0.44 | 0.10–1.28 | 0.14 | | | |
| HCV-Ab (yes vs.
no) | 2.57 | 1.08–7.05 | 0.03 | 2.48 | 1.02–6.92 | 0.05 |
| Child-Pugh
classification (A vs. B) | 0.61 | 0.48–4.35 | 0.39 | | | |
| AFP (≥20 vs. <20
ng/ml) | 2.63 | 1.17–6.44 | 0.02 | 1.59 | 0.62–4.35 | 0.34 |
| PIVKA-II (≥100 vs.
<100 U/ml) | 2.35 | 1.02–6.05 | 0.04 | 1.42 | 0.53–4.10 | 0.50 |
| Tumor size (≥20 vs.
<20 mm) | 1.61 | 0.56–6.81 | 0.41 | | | |
| Number of tumor (St
vs. Mt) | 0.58 | 0.26–1.41 | 0.22 | | | |
| Macroscopic Vp (yes
vs. no) | 4.28 | 1.55–10.2 |
<0.01 | | | |
| Histological type
(well, mod/por) | 0.49 | 0.21–1.08 | 0.08 | | | |
| Liver cirrhosis
(NL+CH vs. LC) | 0.54 | 0.24–1.19 | 0.13 | | | |
| Microscopic vp (yes
vs. no) | 3.29 | 1.44–7.31 |
<0.01 | 3.29 | 1.30–8.44 | 0.01 |
| CA9 (positive vs.
negative) | 4.79 | 2.34–12.6 |
<0.01 | 5.84 | 2.36–16.2 |
<0.01 |
Discussion
Under hypoxic conditions, a number of chemical
substances are induced intracellularly in cancer cells, which
facilitate survival in harsh environments. These substances play
crucial roles in the invasiveness, metastasis, and growth of cells.
Generally, hypoxic stimuli induce the expression of HIF1α, a key
molecule in O2 homeostasis (26). HIF1α stimulates the production of
hypoxia-related molecules, such as GLUT1, VEGF and CA9 (27–29).
Among these molecules, CA9 is a hypoxia-associated endogenous
enzyme that mainly regulates intracellular and extracellular pH
levels.
In the present study, we first evaluated the
expression of CA9 under hypoxic conditions in two HCC cell lines,
HuH7 and HepG2. We showed that CA9 mRNA and protein levels
gradually increased after exposure to hypoxia, in both HuH7 and
HepG2 cells. We also confirmed upregulation of CA9 under
pseudo-hypoxic conditions, with CoCl2, which induces
conditions that mimic hypoxia by stabilizing HIF1α (30). These results were consistent with
the results previously reported (31).
Next, we examined whether hypoxic conditions induced
the EMT phenotype in HCC cell lines. We found that hypoxia and
CoCl2-mediated pseudo-hypoxia promoted EMT and regulated
EMT, by promoting the transcription factor, Twist, in HCC cell
lines. Several previous reports have shown that hypoxia could
induce the EMT phenotype via upregulation of HIF1 expression
(32,33). In HCC, Zhang et al (34) showed that hypoxia upregulated HIF1,
which activated Snail; subsequently, this pathway resulted in
E-cadherin depletion and N-cadherin augmentation. Several reports
have also revealed that hypoxia upregulated transcription factors
that promoted EMT, such as Twist, ZEB1 and Slug, in various tumor
cells (34–36).
Many studies have shown that upregulation of CA9
under hypoxic conditions was correlated with cell survival and
growth. However, the mechanism underlying the upregulation of CA9
and its contribution to survival and growth of tumor cells had not
been fully clarified. CA9 catalyzes the reversible hydration of
carbon dioxide into bicarbonate and protons; this conversion allows
cells to thrive under hypoxic conditions (10,37).
On the other hand, Yu et al (38) reported that CA9 expression
inhibited hexokinase II inhibitor-induced apoptosis, and Lock et
al (39) showed that CA9 was
critical for hypoxia-mediated cancer stem cell expansion in breast
cancer cells.
In this study, we conducted MTT assays to evaluate
cell survival after the CA9 knockdown. In HuH7 cells, the CA9
knockdown did not affect the relative rate of cell survival in
normoxia; however, the CA9 knockdown significantly reduced the
relative cell survival rate under hypoxic conditions. In HepG2
cells, the CA9 knockdown significantly reduced the relative cell
survival rate compared to controls, under both normoxic and hypoxic
conditions. Based on these results, we speculated that HuH7 cell
survival might not depend on CA9 expression under normoxic
conditions, because HuH7 expressed little or no CA9 in normoxia. On
the other hand, HepG2 cell survival may depend on CA9 expression
under both hypoxic and normoxic conditions.
Our results showed that a CA9 knockdown with siRNA
attenuated the hypoxia-induced loss of E-cadherin and augmentation
of N-cadherin. This counter-effect was confirmed with both genetic
and protein analyses in HuH7 cells, and with the protein analysis
in HepG2 cells. Furthermore, morphological evaluations showed that
the CA9 knockdown also attenuated the tendency of both HuH7 and
HepG2 cells to become spindle-shaped in hypoxia. Recent studies
have proposed that CA9 participated in tumor microenvironment
acidification and the loss of tumor cell-to-cell adhesion.
Generally, E-cadherin instability drives the EMT, because
E-cadherin plays a central role in cell-to-cell adhesion junctions
(40). Previous studies have
proposed a few mechanisms that might contribute to the loss of
cell-to-cell adhesion with CA9 upregulation. One hypothesis held
that CA9 expression inhibited or competed against adapter
molecules, such as β-catenin and α-catenin, at adherent junctions.
This interaction could disturb connections between adapter
molecules and the intracellular domain of E-cadherin, which could
lead to E-cadherin instability (23).
Lock et al (39) showed that hypoxia-induced CA9 could
regulate Snail, a transcription factor that promotes EMT, in the
stem cell compartment of breast cancer cells. They also
hypothesized that CA9 expression might regulate EMT through a
potential mechanism involving mTORC1 signaling. Other transcription
factors that promote EMT include ZEB1, ZEB2, Slug and Twist
(41–44). In this study, we found that Twist
displayed upregulated expression under hypoxic conditions. Further
investigation is necessary to reveal the correlation between CA9
and mTORC1 signaling in HCC. We thought these two pathways were
main mechanisms in the regulation of EMT by CA9.
In HuH7 cells, CA9 regulated E-cadherin
transcription. On the other hand, in HepG2 cells, a CA9 knockdown
did not affect E-cadherin transcription. These results suggested
that the two cell lines might employ different mechanisms for
regulating EMT via CA9. For example, CA9 may drive E-cadherin
instability at the post-transcriptional level in HepG2 cells.
We also investigated the clinical and pathological
significance of CA9 expression in 117 patients with HCC. The rate
of CA9-positive staining was 50.4% (59/117) but there was no
significant difference between the CA9(+) and CA9(−) groups in
clinicopathological factors. A previous study showed a 15% rate of
CA9-positive staining in HCC samples. However, that study included
only 17 immunohistochemically-stained HCC samples. Another study
showed a 21.5% rate of CA9-positive staining. That study included
patients that were preoperatively treated with TACE and
radiofrequency ablation (RFA). Therefore, those studies and this
study had different study designs (45,46).
Huang et al reported a 48.5% rate of CA9 positive
expression. They selected patients with HCC that had not received
any anticancer therapies (e.g., TACE) before a curative liver
resection. Their study design and cohort were similar to those of
the present study, and accordingly, the rate of CA9 positive
samples was also similar (47).
Expression of CA9 generally predicts a poor
prognosis in various cancers (12–17,46,47).
The present study showed that CA9 expression was associated with a
poor prognosis and early recurrence in HCC. Two previous reports
evaluated correlations between CA9 expression and prognosis with
immunohistochemical analyses of HCC samples. Kang et al
(46) performed
immunohistochemical anti-CA9 staining on microarrays of HCC tissues
and non-neoplastic liver tissues. They employed a training cohort
of 838 patients and a validation cohort of 225 patients. They
showed that the CA9(+) group had a worse prognosis than the CA9(−)
group, for both the DFS and OS. They also showed that CA9
expression was an independent prognostic factor for DFS and OS in a
multivariate analysis. However, the rate of CA9-positive samples
was quite low, and some patients in the training cohort had
undergone liver transplantation or had received previous treatment
for HCC. Furthermore, they could not show a correlation between CA9
expression and DFS in the validation cohort. In another study,
Huang et al (47) showed
that CA9 expression predicted poor DFS and OS in univariate
analyses, but in a multivariate analysis, CA9 expression was only
an independent prognostic factor for DFS. That study included 227
patients that had received a hepatectomy for HCC from 1988 to 1996.
One limitation of that study was the older age of the cohort. In
this study, CA9 expression was an independent prognostic factor for
both DFS and OS in multivariate analyses among patients with HCC
that spanned a large age range (36–84 years) and had no previous
history of treatment.
In the present study, total recurrence rates of CA9
between the positive group and negative group for 10 years after
primary curative surgery was similar 62.1% (36 cases) and 61.0% (36
cases), respectively. However, overall survival rate of
CA9-positive group was higher than that of CA9-negative group. To
address this difference, we evaluated the recurrence pattern of our
cohort. In the CA9-positive group, 36 cases experienced recurrence
and 16 cases (44.4%) among them have recurrence exceeding the Milan
criteria. In the CA9-negative group, 36 cases experienced
recurrence and only 6 cases (16.7%) among them have recurrence
exceeding the Milan criteria. This aggresive recurrent pattern
could contribute to poor prognosis in the CA9-positive group.
In conclusion, the present study showed that CA9
expression was a pivotal predictive factor for HCC recurrence and
prognosis after radical surgery. Our results suggested that one
mechanism for enhancing malignant potential was CA9 regulation of
the expression of EMT-related molecules. Therefore, CA9 represents
a potential therapeutic target for future HCC treatments. Future
studies are necessary to confirm the finding that CA9 expression
can enhance malignant potential in HCC.
Glossary
Abbreviations
Abbreviations:
|
CA9
|
carbonic anhydrase 9
|
|
EMT
|
epithelial-mesenchymal transition
|
|
HIF1
|
hypoxia-inducible factor 1
|
|
RT-PCR
|
reverse transcription PCR
|
References
|
1
|
Jemal A, Bray F, Center MM, Ferlay J, Ward
E and Forman D: Global cancer statistics. CA Cancer J Clin.
61:69–90. 2011. View Article : Google Scholar : PubMed/NCBI
|
|
2
|
Lok AS, Seeff LB, Morgan TR, di Bisceglie
AM, Sterling RK, Curto TM, Everson GT, Lindsay KL, Lee WM,
Bonkovsky HL, et al HALT-C Trial Group: Incidence of hepatocellular
carcinoma and associated risk factors in hepatitis C-related
advanced liver disease. Gastroenterology. 136:138–148. 2009.
View Article : Google Scholar
|
|
3
|
Yuen MF, Tanaka Y, Fong DY, Fung J, Wong
DK, Yuen JC, But DY, Chan AO, Wong BC, Mizokami M, et al:
Independent risk factors and predictive score for the development
of hepato-cellular carcinoma in chronic hepatitis B. J Hepatol.
50:80–88. 2009. View Article : Google Scholar
|
|
4
|
Diehl AM: Alcoholic liver disease: Natural
history. Liver Transpl Surg. 3:206–211. 1997.PubMed/NCBI
|
|
5
|
Tomimaru Y, Wada H, Eguchi H, Tomokuni A,
Hama N, Kawamoto K, Marubashi S, Umeshita K, Doki Y, Mori M, et al:
Clinical significance of surgical resection of metastatic lymph
nodes from hepatocellular carcinoma. Surg Today. 45:1112–1120.
2015. View Article : Google Scholar
|
|
6
|
Okamura Y, Ashida R, Ito T, Sugiura T,
Mori K and Uesaka K: The tumor marker score is an independent
predictor of survival in patients with recurrent hepatocellular
carcinoma. Surg Today. 45:1513–1520. 2015. View Article : Google Scholar
|
|
7
|
Wu TH, Hatano E, Yamanaka K, Seo S, Taura
K, Yasuchika K, Fujimoto Y, Nitta T, Mizumoto M, Mori A, et al: A
non-smooth tumor margin on preoperative imaging predicts
microvascular invasion of hepatocellular carcinoma. Surg Today.
46:1275–1281. 2016. View Article : Google Scholar : PubMed/NCBI
|
|
8
|
Hao S, Fan P, Chen S, Tu C and Wan C:
Distinct recurrence risk factors for intrahepatic metastasis and
multicenter occurrence after surgery in patients with
hepatocellular carcinoma. J Gastrointest Surg. 21:312–320. 2016.
View Article : Google Scholar : PubMed/NCBI
|
|
9
|
Pastorekova S, Ratcliffe PJ and Pastorek
J: Molecular mechanisms of carbonic anhydrase IX-mediated pH
regulation under hypoxia. BJU Int. 101(Suppl 4): 8–15. 2008.
View Article : Google Scholar : PubMed/NCBI
|
|
10
|
Swietach P, Wigfield S, Cobden P, Supuran
CT, Harris AL and Vaughan-Jones RD: Tumor-associated carbonic
anhydrase 9 spatially coordinates intracellular pH in
three-dimensional multicellular growths. J Biol Chem.
283:20473–20483. 2008. View Article : Google Scholar : PubMed/NCBI
|
|
11
|
Wykoff CC, Beasley NJ, Watson PH, Turner
KJ, Pastorek J, Sibtain A, Wilson GD, Turley H, Talks KL, Maxwell
PH, et al: Hypoxia-inducible expression of tumor-associated
carbonic anhydrases. Cancer Res. 60:7075–7083. 2000.
|
|
12
|
Swinson DE, Jones JL, Richardson D, Wykoff
C, Turley H, Pastorek J, Taub N, Harris AL and O'Byrne KJ: Carbonic
anhydrase IX expression, a novel surrogate marker of tumor hypoxia,
is associated with a poor prognosis in non-small-cell lung cancer.
J Clin Oncol. 21:473–482. 2003. View Article : Google Scholar : PubMed/NCBI
|
|
13
|
Giatromanolaki A, Koukourakis MI, Sivridis
E, Pastorek J, Wykoff CC, Gatter KC and Harris AL: Expression of
hypoxia-inducible carbonic anhydrase-9 relates to angiogenic
pathways and independently to poor outcome in non-small cell lung
cancer. Cancer Res. 61:7992–7998. 2001.PubMed/NCBI
|
|
14
|
Chia SK, Wykoff CC, Watson PH, Han C, Leek
RD, Pastorek J, Gatter KC, Ratcliffe P and Harris AL: Prognostic
significance of a novel hypoxia-regulated marker, carbonic
anhydrase IX, in invasive breast carcinoma. J Clin Oncol.
19:3660–3668. 2001. View Article : Google Scholar : PubMed/NCBI
|
|
15
|
Tan EY, Yan M, Campo L, Han C, Takano E,
Turley H, Candiloro I, Pezzella F, Gatter KC, Millar EK, et al: The
key hypoxia regulated gene CAIX is upregulated in basal-like breast
tumours and is associated with resistance to chemotherapy. Br J
Cancer. 100:405–411. 2009. View Article : Google Scholar : PubMed/NCBI
|
|
16
|
Kim HL, Seligson D, Liu X, Janzen N, Bui
MH, Yu H, Shi T, Figlin RA, Horvath S and Belldegrun AS: Using
protein expressions to predict survival in clear cell renal
carcinoma. Clin Cancer Res. 10:5464–5471. 2004. View Article : Google Scholar : PubMed/NCBI
|
|
17
|
Hoskin PJ, Sibtain A, Daley FM and Wilson
GD: GLUT1 and CAIX as intrinsic markers of hypoxia in bladder
cancer: Relationship with vascularity and proliferation as
predictors of outcome of ARCON. Br J Cancer. 89:1290–1297. 2003.
View Article : Google Scholar : PubMed/NCBI
|
|
18
|
Loncaster JA, Harris AL, Davidson SE,
Logue JP, Hunter RD, Wycoff CC, Pastorek J, Ratcliffe PJ, Stratford
IJ and West CM: Carbonic anhydrase (CA IX) expression, a potential
new intrinsic marker of hypoxia: Correlations with tumor oxygen
measurements and prognosis in locally advanced carcinoma of the
cervix. Cancer Res. 61:6394–6399. 2001.PubMed/NCBI
|
|
19
|
Thiery JP, Acloque H, Huang RY and Nieto
MA: Epithelial-mesenchymal transitions in development and disease.
Cell. 139:871–890. 2009. View Article : Google Scholar : PubMed/NCBI
|
|
20
|
Tsai YP and Wu KJ: Hypoxia-regulated
target genes implicated in tumor metastasis. J Biomed Sci.
19:1022012. View Article : Google Scholar : PubMed/NCBI
|
|
21
|
Wu X, Qiao B, Liu Q and Zhang W:
Upregulation of extracellular matrix metalloproteinase inducer
promotes hypoxia-induced epithelial-mesenchymal transition in
esophageal cancer. Mol Med Rep. 12:7419–7424. 2015. View Article : Google Scholar : PubMed/NCBI
|
|
22
|
Tang J, Xiao L, Cui R, Li D, Zheng X, Zhu
L, Sun H, Pan Y, Du Y and Yu X: CX3CL1 increases invasiveness and
metastasis by promoting epithelial-to-mesenchymal transition
through the TACE/TGF-α/EGFR pathway in hypoxic androgen-independent
prostate cancer cells. Oncol Rep. 35:1153–1162. 2016. View Article : Google Scholar : PubMed/NCBI
|
|
23
|
Svastová E, Zilka N, Zat'ovicová M,
Gibadulinová A, Ciampor F, Pastorek J and Pastoreková S: Carbonic
anhydrase IX reduces E-cadherin-mediated adhesion of MDCK cells via
interaction with beta-catenin. Exp Cell Res. 290:332–345. 2003.
View Article : Google Scholar : PubMed/NCBI
|
|
24
|
Noda T, Yamamoto H, Takemasa I, Yamada D,
Uemura M, Wada H, Kobayashi S, Marubashi S, Eguchi H, Tanemura M,
et al: PLOD2 induced under hypoxia is a novel prognostic factor for
hepatocellular carcinoma after curative resection. Liver Int.
32:110–118. 2012. View Article : Google Scholar
|
|
25
|
Sakamoto T, Kobayashi S, Yamada D, Nagano
H, Tomokuni A, Tomimaru Y, Noda T, Gotoh K, Asaoka T, Wada H, et
al: A histone deacetylase inhibitor suppresses
epithelial-mesenchymal transition and attenuates chemoresistance in
biliary tract cancer. PLoS One. 11:e01459852016. View Article : Google Scholar : PubMed/NCBI
|
|
26
|
Wang GL, Jiang BH, Rue EA and Semenza GL:
Hypoxia-inducible factor 1 is a basic-helix-loop-helix-PAS
heterodimer regulated by cellular O2 tension. Proc Natl
Acad Sci USA. 92:5510–5514. 1995. View Article : Google Scholar
|
|
27
|
Amann T and Hellerbrand C: GLUT1 as a
therapeutic target in hepatocellular carcinoma. Expert Opin Ther
Targets. 13:1411–1427. 2009. View Article : Google Scholar : PubMed/NCBI
|
|
28
|
Kim KR, Moon HE and Kim KW:
Hypoxia-induced angiogenesis in human hepatocellular carcinoma. J
Mol Med (Berl). 80:703–714. 2002. View Article : Google Scholar
|
|
29
|
Pastorek J and Pastorekova S:
Hypoxia-induced carbonic anhydrase IX as a target for cancer
therapy: From biology to clinical use. Semin Cancer Biol. 31:52–64.
2015. View Article : Google Scholar
|
|
30
|
Griguer CE, Oliva CR, Kelley EE, Giles GI,
Lancaster JR Jr and Gillespie GY: Xanthine oxidase-dependent
regulation of hypoxia-inducible factor in cancer cells. Cancer Res.
66:2257–2263. 2006. View Article : Google Scholar : PubMed/NCBI
|
|
31
|
Choi JH, Cho HK, Choi YH and Cheong J:
Activating transcription factor 2 increases transactivation and
protein stability of hypoxia-inducible factor 1alpha in
hepatocytes. Biochem J. 424:285–296. 2009. View Article : Google Scholar : PubMed/NCBI
|
|
32
|
Rankin EB and Giaccia AJ: Hypoxic control
of metastasis. Science. 352:175–180. 2016. View Article : Google Scholar : PubMed/NCBI
|
|
33
|
Balamurugan K: HIF-1 at the crossroads of
hypoxia, inflammation, and cancer. Int J Cancer. 138:1058–1066.
2016. View Article : Google Scholar
|
|
34
|
Zhang L, Huang G, Li X, Zhang Y, Jiang Y,
Shen J, Liu J, Wang Q, Zhu J, Feng X, et al: Hypoxia induces
epithelial-mesenchymal transition via activation of SNAI1 by
hypoxia-inducible factor -1α in hepatocellular carcinoma. BMC
Cancer. 13:1082013. View Article : Google Scholar
|
|
35
|
Yang YJ, Na HJ, Suh MJ, Ban MJ, Byeon HK,
Kim WS, Kim JW, Choi EC, Kwon HJ, Chang JW, et al: Hypoxia induces
epithelial-mesenchymal transition in follicular thyroid cancer:
Involvement of regulation of twist by hypoxia inducible factor-1α.
Yonsei Med J. 56:1503–1514. 2015. View Article : Google Scholar : PubMed/NCBI
|
|
36
|
Matsuoka J, Yashiro M, Doi Y, Fuyuhiro Y,
Kato Y, Shinto O, Noda S, Kashiwagi S, Aomatsu N, Hirakawa T, et
al: Hypoxia stimulates the EMT of gastric cancer cells through
autocrine TGFβ signaling. PLoS One. 8:e623102013. View Article : Google Scholar
|
|
37
|
Chiche J, Ilc K, Laferrière J, Trottier E,
Dayan F, Mazure NM, Brahimi-Horn MC and Pouysségur J:
Hypoxia-inducible carbonic anhydrase IX and XII promote tumor cell
growth by counteracting acidosis through the regulation of the
intracellular pH. Cancer Res. 69:358–368. 2009. View Article : Google Scholar : PubMed/NCBI
|
|
38
|
Yu SJ, Yoon JH, Lee JH, Myung SJ, Jang ES,
Kwak MS, Cho EJ, Jang JJ, Kim YJ and Lee HS: Inhibition of
hypoxia-inducible carbonic anhydrase-IX enhances hexokinase II
inhibitor-induced hepatocellular carcinoma cell apoptosis. Acta
Pharmacol Sin. 32:912–920. 2011. View Article : Google Scholar : PubMed/NCBI
|
|
39
|
Lock FE, McDonald PC, Lou Y, Serrano I,
Chafe SC, Ostlund C, Aparicio S, Winum JY, Supuran CT and Dedhar S:
Targeting carbonic anhydrase IX depletes breast cancer stem cells
within the hypoxic niche. Oncogene. 32:5210–5219. 2013. View Article : Google Scholar
|
|
40
|
Cavey M, Rauzi M, Lenne PF and Lecuit T: A
two-tiered mechanism for stabilization and immobilization of
E-cadherin. Nature. 453:751–756. 2008. View Article : Google Scholar : PubMed/NCBI
|
|
41
|
Nieto MA: The snail superfamily of
zinc-finger transcription factors. Nat Rev Mol Cell Biol.
3:155–166. 2002. View
Article : Google Scholar : PubMed/NCBI
|
|
42
|
Kalluri R and Weinberg RA: The basics of
epithelial-mesen-chymal transition. J Clin Invest. 119:1420–1428.
2009. View Article : Google Scholar : PubMed/NCBI
|
|
43
|
Chou YS and Yang MH:
Epithelial-mesenchymal transition-related factors in solid tumor
and hematological malignancy. J Chin Med Assoc. 78:438–445. 2015.
View Article : Google Scholar : PubMed/NCBI
|
|
44
|
Baulida J and García de Herreros A:
Snail1-driven plasticity of epithelial and mesenchymal cells
sustains cancer malignancy. Biochim Biophys Acta. 1856:55–61.
2015.PubMed/NCBI
|
|
45
|
Luong-Player A, Liu H, Wang HL and Lin F:
Immunohistochemical reevaluation of carbonic anhydrase IX (CA IX)
expression in tumors and normal tissues. Am J Clin Pathol.
141:219–225. 2014. View Article : Google Scholar : PubMed/NCBI
|
|
46
|
Kang HJ, Kim IH, Sung CO, Shim JH and Yu
E: Expression of carbonic anhydrase 9 is a novel prognostic marker
in resectable hepatocellular carcinoma. Virchows Arch. 466:403–413.
2015. View Article : Google Scholar : PubMed/NCBI
|
|
47
|
Huang WJ, Jeng YM, Lai HS, Fong IU, Sheu
FY, Lai PL and Yuan RH: Expression of hypoxic marker carbonic
anhydrase IX predicts poor prognosis in resectable hepatocellular
carcinoma. PLoS One. 10:e01191812015. View Article : Google Scholar : PubMed/NCBI
|