Introduction
Ewing's sarcoma (ES) bearing a pathognomonic Ewing
sarcoma protein-friend leukemia integration factor 1 translocation
is the second most common bone tumor in children and adolescents
(1). The current standard of care
combines a 5-drug chemotherapy regimen (vincristine, doxorubicin,
cyclophosphamide, ifosfamide and etoposide) and local control
comprising tumor resection and/or radiation therapy (2). However, the high percentage of
relapse and metastasis and the poor prognosis of patients with ES
have led to renewed interest in novel treatment.
miRNAs are known to be involved in cancer
progression. Functionally, aberrant miRNA expression can affect
cell biology (3,4). Recent studies have shown that miR-20b
is significantly upregulated in various types of cancer (5–7);
however, the role of miR-20b in the proliferation of ES cells
remains unknown.
Transforming growth factor-β receptor II (TGFBR2),
as a tumor suppressor (8), is
downregulated in various types of cancer and is generally involved
in cancer development (9,10). Most cancer cells lack sensitivity
to TGF-β-mediated growth inhibitory responses upon TGFBR2
downregulation (11). Recently,
several reports have demonstrated that TGFBR2 is involved in cell
proliferation, migration and invasion in gastric cancer via several
transcriptional factors including MYC (12).
In the present study, we explored the genome-wide
expression of both miRNAs and mRNAs in human mesenchymal stem cells
(hMSCs) and five human ES cell lines. The results showed that
miR-20b expression was increased, while that of TGFBR2 was
repressed and MYC was upregulated in five ES cell lines compared to
in hMSCs. We hypothesized that the influence of TGFBR2 in ES cells
is mediated, at least in part, either directly or indirectly by
miR-20b and that MYC expression increases in response to the
downstream effector of Smad. The aim of this study was to evaluate
whether MYC expression is induced by miR-20b via TGFBR2 inhibition
and if this pathway plays a role in the malignancy of ES cells.
Materials and methods
Cell lines and reagents
Human MSC (hMSCs) was obtained from Takara Bio, Inc.
(Shiga, Japan). Human ES cells (SK-N-MC, RD-ES, SK-ES-1 and SCCH)
were purchased from the Japanese Collection of Research
Bioresources (Tokyo, Japan). WE-68, a human ES cell line, was
generously provided by Professor Frans van Valen
(Westfalische-Wilhelms University, Munster, Germany). High
glucose-Dulbecco's modified Eagle's medium (DMEM), RPMI-1640
medium, minimal essential medium (MEM), and fetal bovine serum
(FBS) were purchased from Invitrogen (Carlsbad, CA, USA).
Mesenchymal Stem Cell (MSC) Basal Medium, Chemically defined
(MSCBM-CD) and MSCGM-CD SingleQuats were obtained from Takara
Bio.
The RNeasy kit and miRNeasy Mini kit were obtained
from Qiagen (Hilden, Germany) and TRIzol reagent was from
Invitrogen. The miR-20b-5p mimic (5′-CAAAGUGCUCAUAGUGCAGGUAG-3′),
miR-20b-5p mutant (5′-CUUUCACGUCAUAGUGCAGGUAG-3′), hsa-miR-20b
inhibitor and negative control (NC) miRNAs were purchased from
Invitrogen. The transfection reagent Lipofectamine 2000 and
antibiotics-free Opti-MEM were also obtained from Invitrogen.
Actinomycin D was from Sigma-Aldrich (St. Louis, MO, USA). The
TGFBR2 expression plasmid (SC119965) was obtained from Origene
Technologies Inc. (Rockville, MD, USA).
Antibodies produced in rabbits for TGFBR2 (#9552),
MYC (#9402), β-actin (#4970), Akt (#4691), phosphorylated-Akt
(p-Akt) (#4060), p21 (#2947), Smad2/3 (#8685),
phosphorylated-Smad2/3 (p-Smad2/3) (#8828), PAR/poly(ADP-ribose)
polymerase (PARP) (#9542), and cleaved PARP (#9541) were purchased
from Cell Signaling Technology (Danvers, MA, USA) and
phosphorylated-p21 (p-p21) (ab47300) was from Abcam (Cambridge,
UK). Horseradish peroxidase-conjugated anti-rabbit immunoglobulin G
antibodies and the ECL Prime system were obtained from GE
Healthcare (Little Chalfont, UK). The Cycletest Plus DNA reagent
kit and Annexin V-FITC apoptosis detection kit were obtained from
BD Biosciences (Franklin Lakes, NJ, USA).
BALB/c nu/nu nude mice were purchased from Kudo
(Tosu, Japan). All protocols for animal experiments in the present
study were approved by the Ethics Review Committee for Animal
Experimentation of Oita University.
Cell culture
SK-N-MC and RD-ES cells were cultured in DMEM
high-glucose medium and SK-ES1 and WE-68 cells were cultured in
RPMI-1640 medium. The media were supplemented with 10% FBS and 1%
penicillin/streptomycin. SCCH cells were cultivated in MEM
supplemented with 10% FBS and 0.1 mM non-essential amino acids.
hMSCs were maintained in MSCBM-CD supplemented with
SingleQuats.
The cells were incubated at 37°C in an incubator
chamber supplemented with 5% CO2 and passaged when the
cells were ~70% confluent.
miRNA and mRNA expression analysis using
microarray
miRNA and total RNA were extracted using miRNeasy
and RNeasy kits, respectively, from the cells according to the
manufacturer's recommendations. The quality of RNA was confirmed
using a Bioanalyzer 2100 (Agilent Technologies, Santa Clara, CA,
USA).
An aliquot (1 μg) of the RNA fraction
including miRNAs from each of the five ES cells and hMSCs was
biotin-labeled with the FlashTag Biotin HSR kit (Genisphere LLC,
Hatfield, PA, USA) and subjected to miRNA expression array analyses
with a GeneChip miRNA 3.0 array (Affymetrix, Santa Clara, CA, USA).
The array data were quantile normalized, log2- transformed using
miRNA QC software (Affymetrix) and analyzed using GeneSpring GX
11.0 (Agilent Technologies).
For mRNA expression analysis, 1 ng total RNA from
each of five ES cells and hMSCs was used to generate
double-stranded cDNA by reverse transcription, and then used to
generate biotinylated cRNA by in vitro transcription using
the 3′ IVT Express kit (Affymetrix). The cRNA probes were
hybridized to the GeneChip Genome HG U133 Plus 2.0 array
(Affymetrix). GeneSpring GX 11.0 software was used for array
analyses including normalization and filtering (20.0–100.0th
percentile). All experiments were repeated twice. Variant analyses
were carried out to determine the significance of differences
between two groups. Genes showing a 2-fold or more significant
increase or reduction in expression were determined and evaluated
using the KEGG pathway database (http://www.genome.jp/kegg/pathway.html) for pathway
analyses.
Target prediction of miRNAs
To predict miRNA target genes, microRNA.org (http://www.microrna.org/), TargetScan 6.0 (http://www.targetscan.org/), Basic Local Alignment
Search Tool (BLAST), DIANA tools (http://diana.imis.athena-innovation.gr/DianaTools/)
and PicTar (http://pictar.mdc-berlin.de/) were used. The results
of database analyses suggested that TGFBR2 was the strongest target
of miR-20b.
Transfection and cell proliferation
analysis
Cells (1×10⁵) were cultured in 2 ml
medium without antibiotics in 6-well plates. miR-20b-5p mimic,
miR-20b-5p mutant, anti-miR-20b inhibitor, negative control (NC)
miRNAs, TGFBR2 expression vector, and Mock vector were transfected
using Lipofectamine 2000. Additionally, 10 μg/ml of
actinomycin D was used to inhibit de novo RNA transcription.
The transfected cells were incubated for 48 h and subjected to
further analyses.
The number of viable cells was counted with a TC10
Automated Cell Counter (Bio-Rad Laboratories, Hercules, CA, USA).
The cell cycle distribution was monitored by propidium iodide (PI)
staining using a fluorescence activated cell sorting (FACS)
analyzer FACSVerse (BD Biosciences). The number of cells in the
cell cycle phases of G0⁄G1, S and G2⁄M was determined. All
experiments were performed in triplicate.
Quantitative RT-PCR
The transfected cells were harvested and lysed using
TRIzol reagent to extract total RNA. cDNA was generated and
quantitative real-time PCR (qRT-PCR) was carried out using a
LightCycler 480 (Roche, Basel, Switzerland). The relative
expression of TGFBR2 and GAPDH was calculated using the
2−∆∆Ct method. The following primers were used:
TGFBR2-forward, 5′-AGACAAAGCCAACCGAT AC-3′ and TGFBR2-reverse,
5′-GAAGTTGAACTGCTAGCCTC-3′; GAPDH-forward,
5′-CCTCTATGCCAACACAGTGC-3′ and GAPDH-reverse,
5′-GTACTCCTGCTTGCTGATCC-3′.
Western blotting
Cellular proteins were extracted and an aliquot (15
μg) was applied to a 10% Tris-HCl Criterion precast gel
(Bio-Rad Laboratories). Proteins in the gel were transferred onto
polyvinylidene fluoride membranes and reacted with the anti-TGFBR2,
Smad2/3, p-Smad2/3, Akt, p-Akt, p21, p-p21, MYC and β-actin
antibodies. The blots were treated with anti-rabbit IgG antibodies
and signals were detected using the ECL Prime system (GE
Healthcare). Protein expression was quantified using ImageQuant TL
software (GE Healthcare). All experiments were conducted in
triplicate.
Detection of apoptosis
Apoptotic cells were detected by FACS analysis and
western blotting. SK-ES-1 cells (1×10⁶ cells) were
cultured and transfected with the anti-miR-20b miRNA or TGFBR2
expression vector. Forty-eight hours after the transfection, the
cells were analyzed using FACSVerse to detect cell death. As a
positive control for apoptosis, the cells were treated with a low
dose (5 μg/ml) of doxorubicin. The expression of
apoptosis-related proteins, including PARP and cleaved PARP, were
analyzed by western blotting.
In vivo experiments using nude mice
SK-ES-1 cells (2×10⁶) transfected with
anti-miR-20b were suspended in 100 μl normal saline and
injected into the gluteal region of BALB/c nu/nu mice. A total of
28 mice were divided into four groups (7 mice each): i) untreated
control; ii) transfected with NC-miRNA; iii) transfected with
anti-miR-20b; and iv) transfected with TGFBR2 expression vector.
Changes in the weight of treated mice and tumor volume were
monitored for 6 weeks. Tumor volume was calculated using the
formula: V = (length × width2)/2. The mice were
sacrificed, and xenografted tumors were removed and subjected to
immunohistochemistry. Resected tumors were fixed with 4%
formaldehyde, paraffin-embedded, sectioned using a microtome, and
reacted with anti-TGFBR2 and MYC antibodies. The expression of
proteins in the section was visualized using the DAB and EnVision
System (Dako, Glostrup, Denmark).
Statistical analysis
Two-tailed Student's t-test was carried out for
continuous variables. Differences among >3 groups were analyzed
using analysis of variance and Scheffe test. The results were
expressed as the mean ± standard deviation (SD), and differences
were considered significant when P-values were <0.05. All
statistical analyses were conducted using the SPSS 18.0 software
(SPSS, Inc., Chicago, IL, USA).
Results
Expression of miR-20b in ES cells
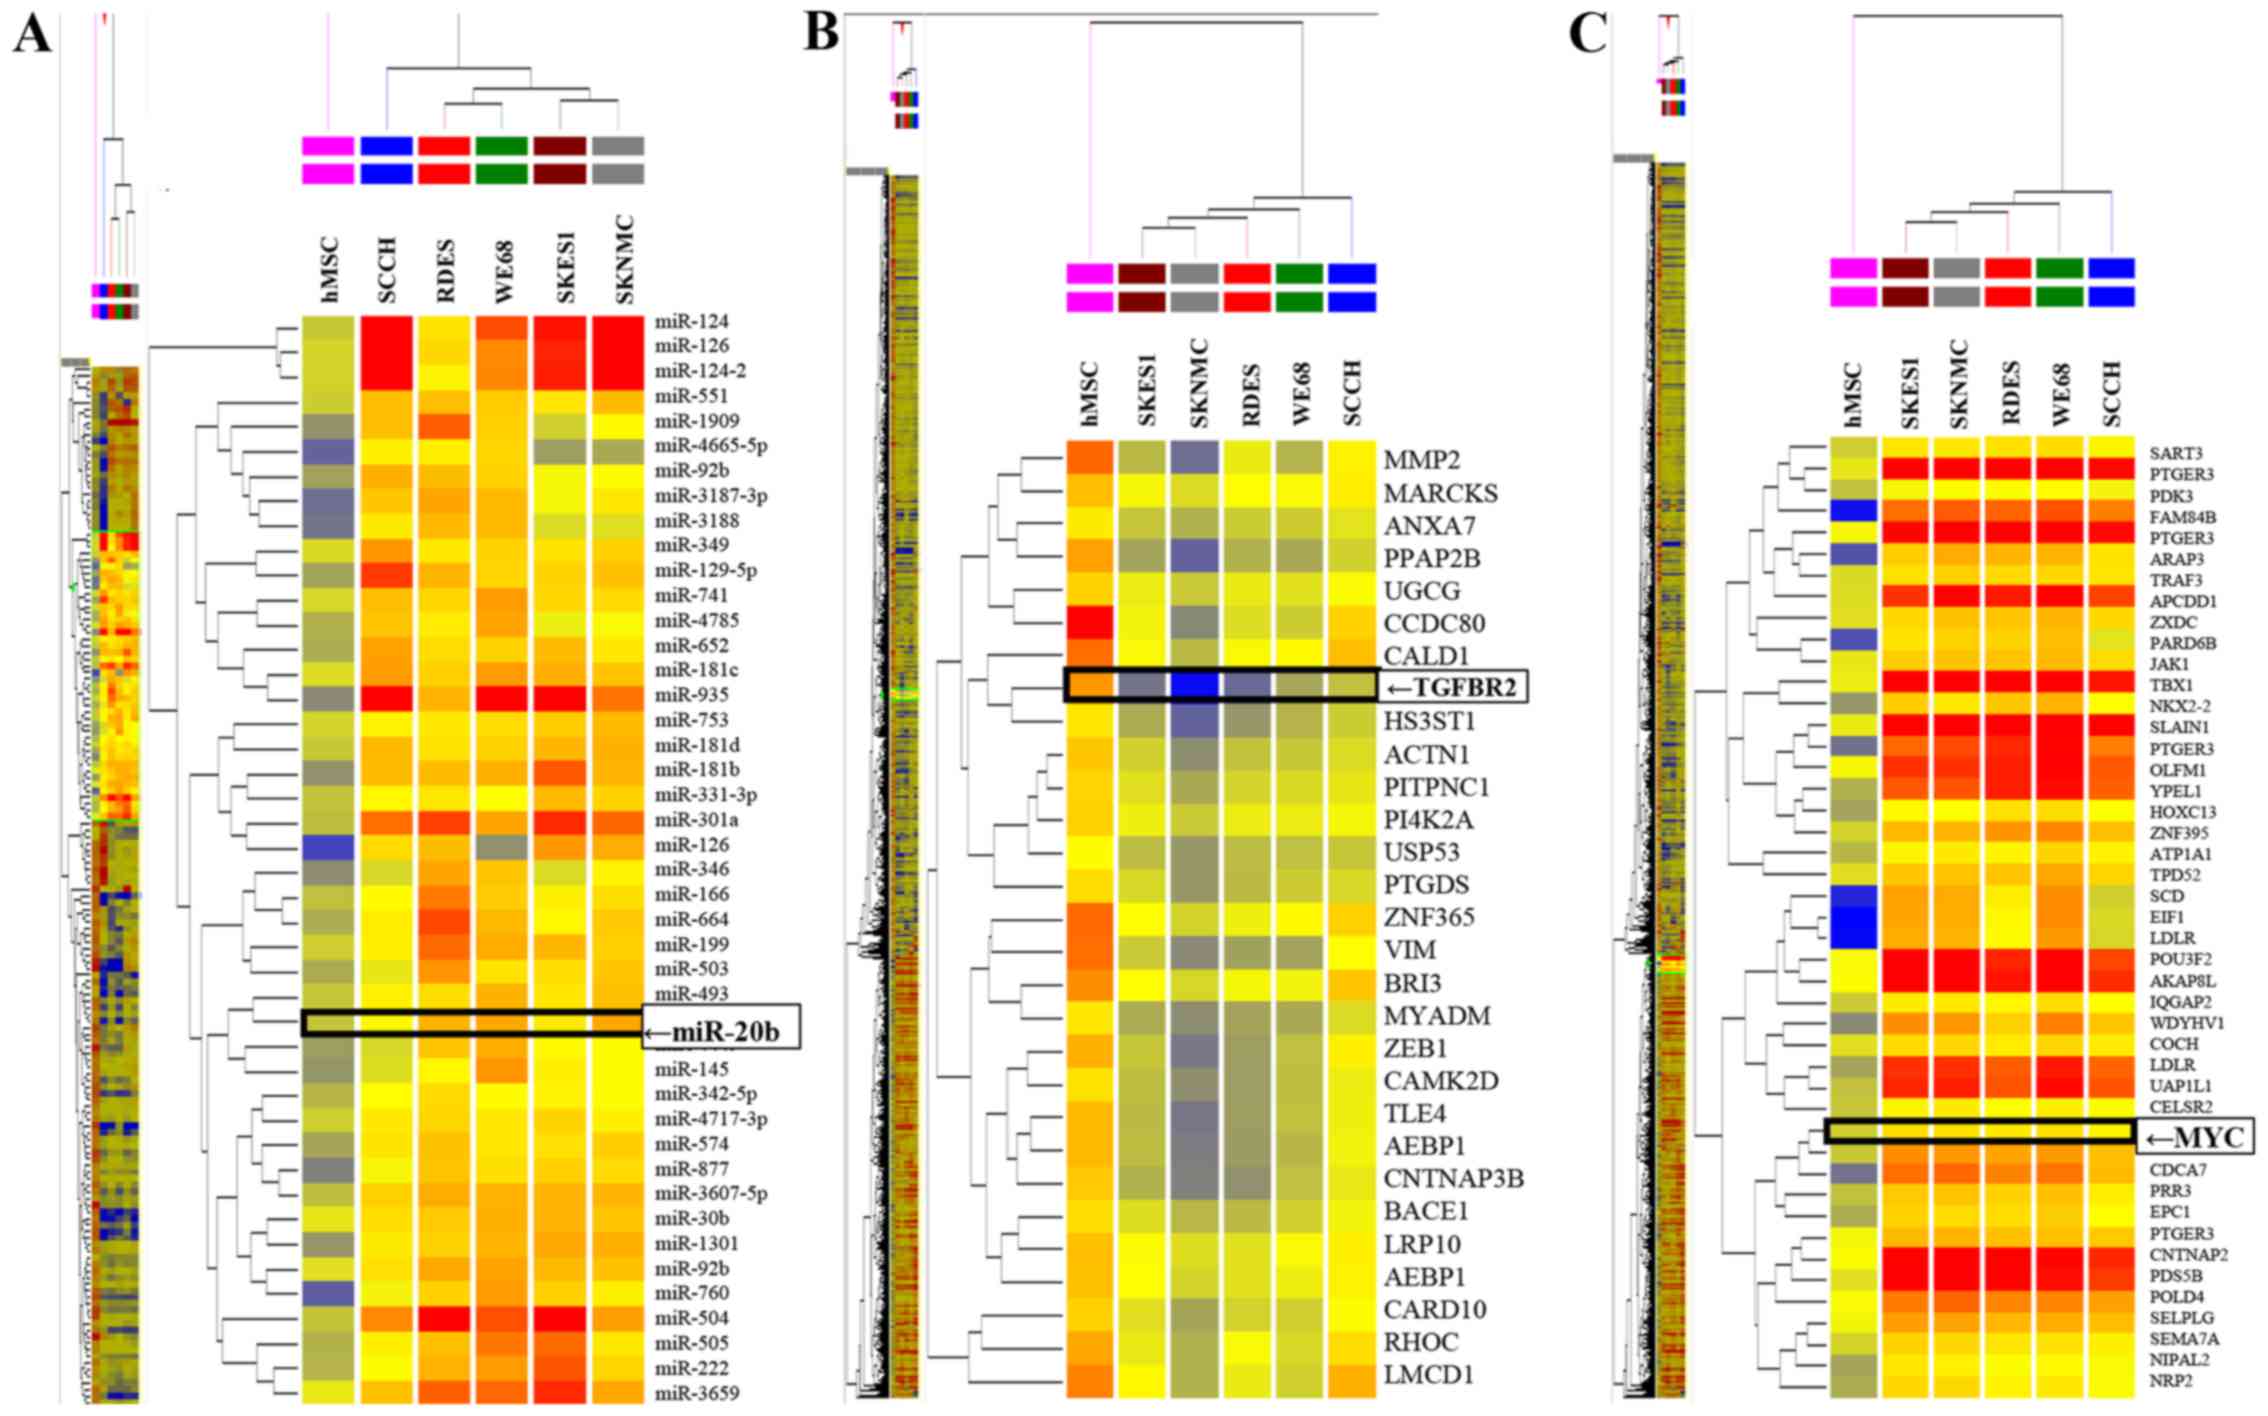
To determine the expression profiles of miRNAs in ES
cell lines, array analysis was carried out. The results
demonstrated that 1054 miRNAs in ES cells showed significantly
altered expression (>2-fold change) compared to in hMSCs
(Fig. 1A). The expression of 228
miRNAs was significantly increased, while that of 705 was
significantly decreased in all ES cell lines tested. The remaining
121 miRNAs exhibited different expression patterns among the five
types of ES cells. Among the 228 upregulated miRNAs in five ES
cells, the expression of miR-20b was increased by 2.36- to 5.7-fold
compared to in hMSCs.
Decrease in TGFBR2 and MYC expression in
ES cells
The expression profiles of mRNAs in ES cell lines
were then analyzed using a cDNA array. The data demonstrated that
3043 mRNAs in ES cells exhibited significantly different expression
from those in hMSCs. The expression of 1062 mRNAs was significantly
increased, while that of 1884 was significantly decreased in all ES
cell lines tested. The remaining 97 mRNAs showed different
expression patterns among the five types of ES cells. Among the
1884 downregulated mRNAs in five ES cells, the expression of TGFBR2
(Fig. 1B) was decreased by 2.38-
to 3.29-fold compared to in hMSCs.
TGFBR2 as a direct target of miR-20b in
ES cells
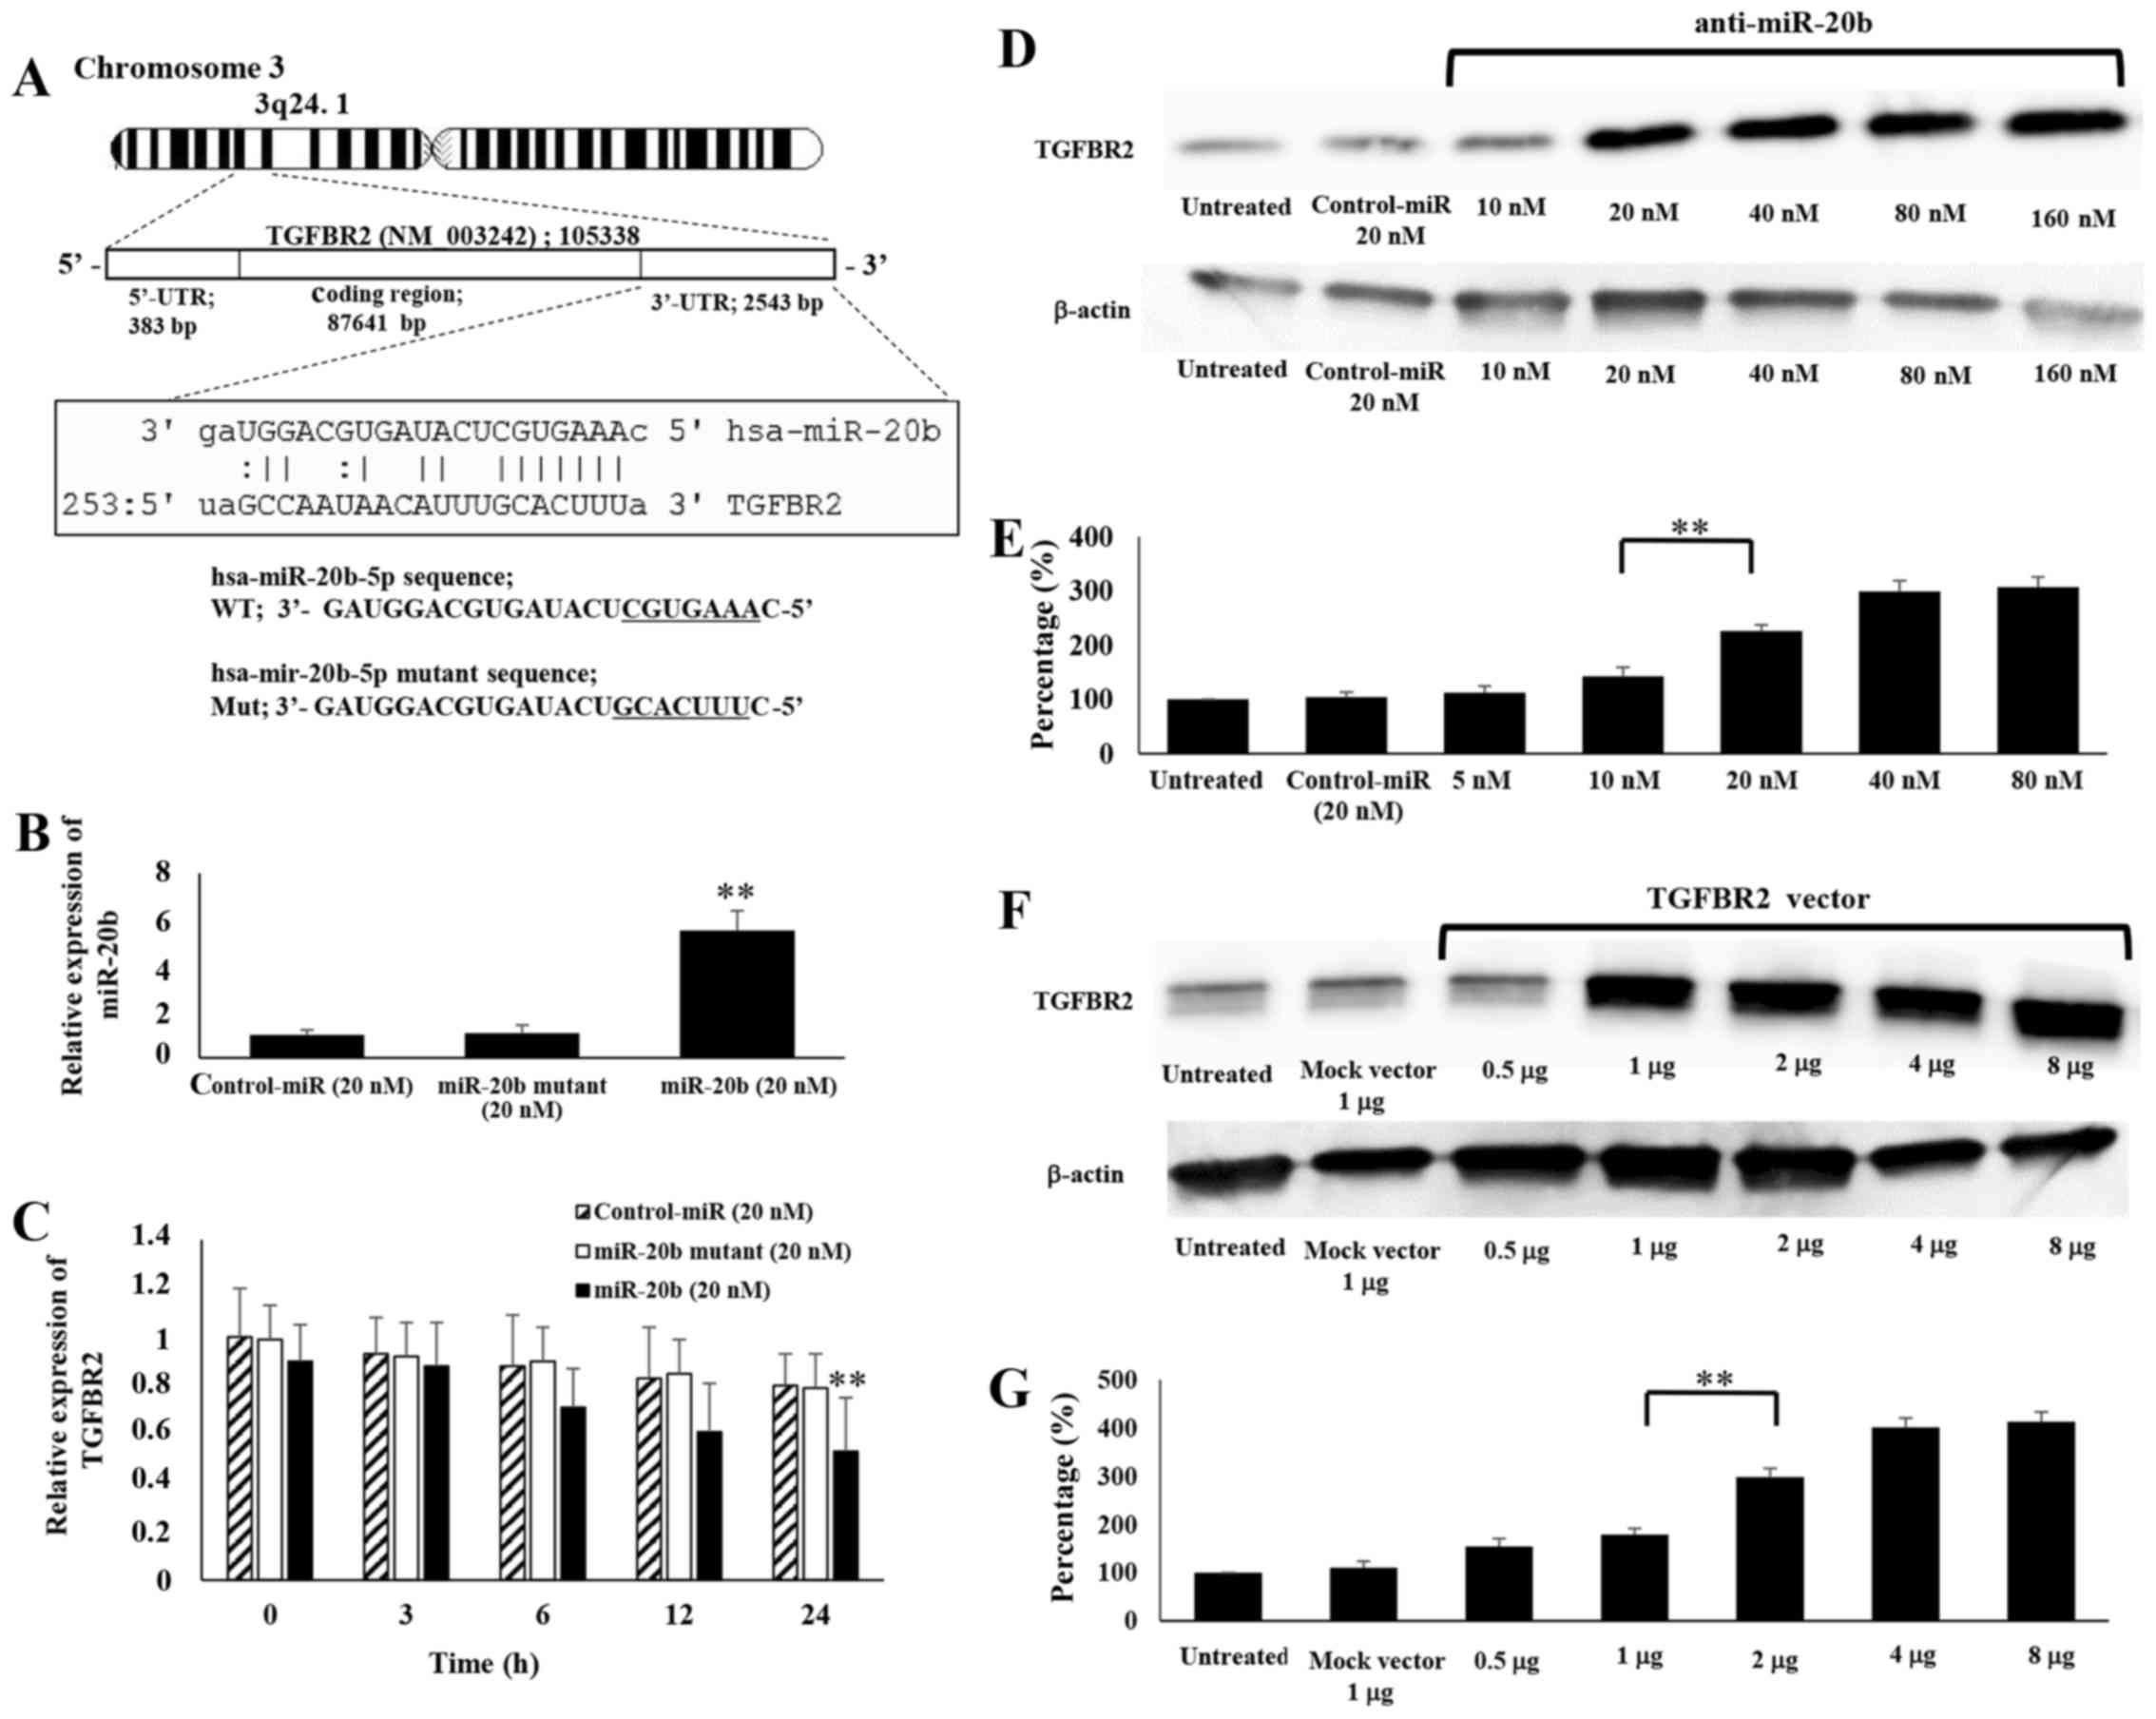
BLAST and TargetScan analyses revealed considerable
complementarity in the sequence of the miR-20b seed region with the
human TGFBR2 mRNA 3′ untranslated region (3′-UTR) (Fig. 2A), suggesting that miR-20b
influences TGFBR2 mRNA levels by associating with the 3′-UTR of the
mRNA. Therefore, we examined the effects of miR-20b on the
expression of TGFBR2 in ES cells by transfecting miR-20b and a
mutated miR-20b into SK-ES-1 cells. In this experiment, de
novo mRNA transcription was blocked by actinomycin D (10
μg/ml), an inhibitor of mRNA transcription, as we attempted
to determine whether TGFBR2 mRNA stability was affected by miR-20b.
Using a microRNA mutant oligonucleotide method rather than the
luciferase method, we found that the microRNA disrupted and/or
interfered with target mRNA expression (13–15).
We observed an increase in the intracellular miR-20b level by
5.51-fold compared to control-miR (Fig. 2B) and significantly decreased
TGFBR2 expression by 0.53-fold at the mRNA level after transfection
with the miR-20b oligonucleotide (Fig.
2C). The results suggest that the stability of TGFBR2 mRNA was
inhibited by miR-20b in ES cell lines.
Effects of anti-miR-20b on expression of
TGFBR2
We next examined the effects of anti-miR-20b
oligonucleotide, an inhibitor of miR-20b, on the expression of
TGFBR2 in SK-ES-1 cells. In anti-miR-20b-transfected cells, the
levels of TGFBR2 protein were remarkably elevated compared to in
untreated or control oligonucleotide-treated cells (Fig. 2D). The level of TGFBR2 protein
expression in cells transfected with anti-miR-20b (20 nM) was
upregulated by 2.26-fold compared to in control cells (P<0.01;
Fig. 2E). Western blot analyses
further demonstrated that the levels of TGFBR2 protein in TGFBR2
expression vector-transfected cells were significantly increased
compared to those in mock vector-transfected cells (Fig. 2F). Compared with the control, cells
transfected TGFBR2 vector (1 μg) showed significantly
increased expression of TGFBR2 protein by 2.98-fold (P<0.01;
Fig. 2G).
Inhibition of ES cell proliferation by
anti-20b-miR and TGFBR2
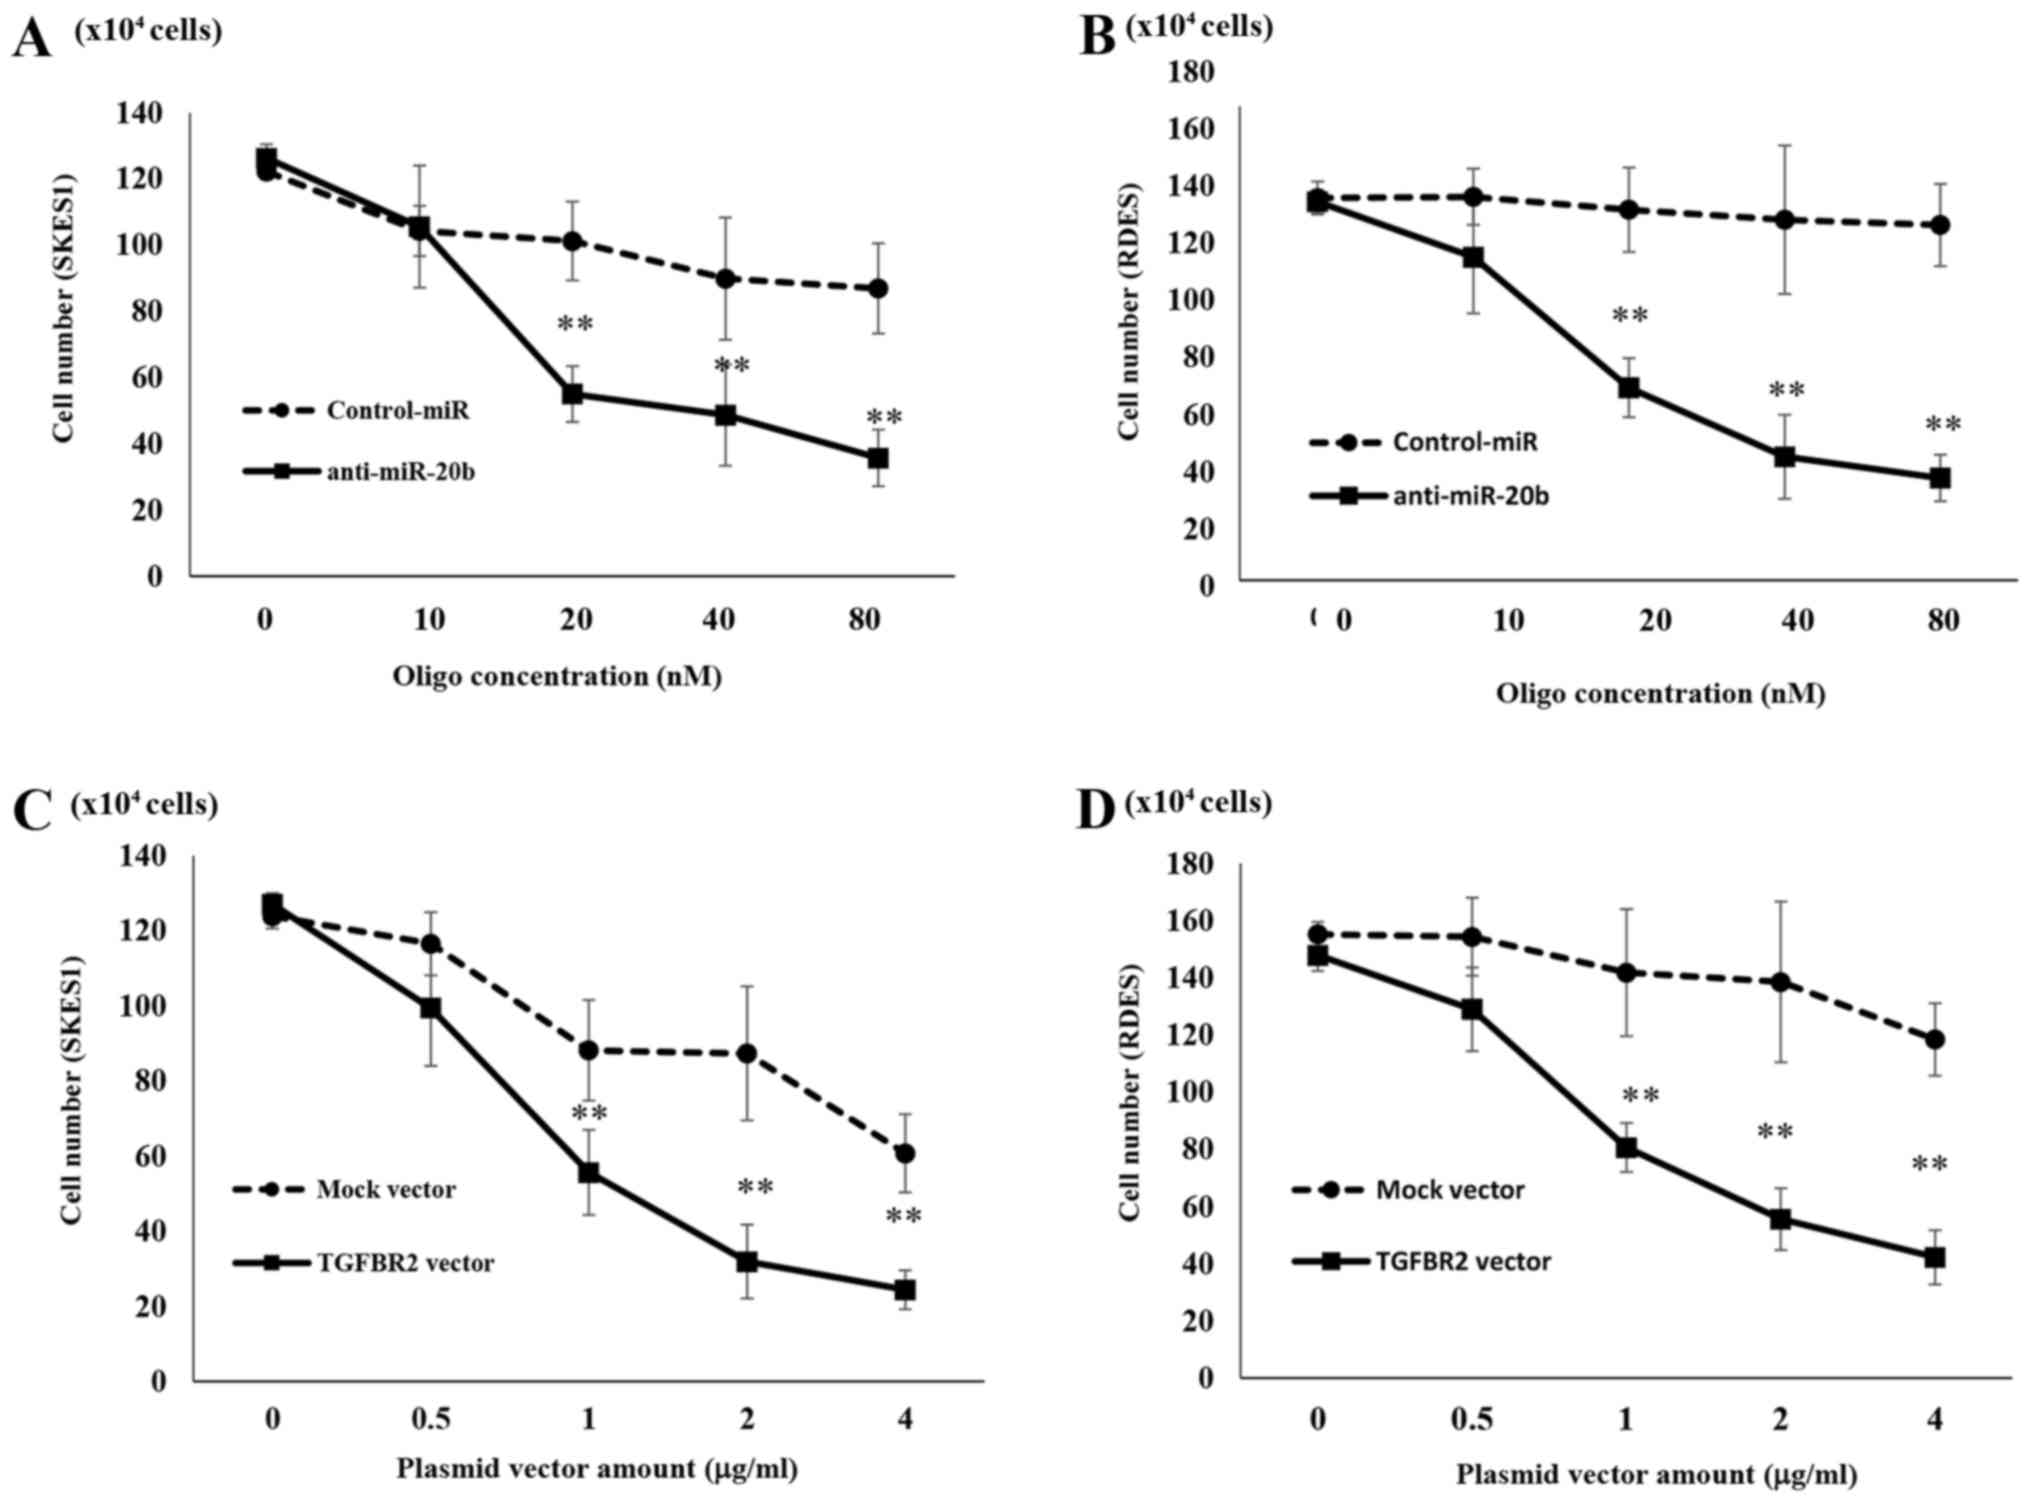
It is well-known that TGFBR2 plays a pivotal role in
controlling cell cycle progression. To examine the effects of
TGFBR2 on proliferation of ES cells, a TGFBR2 expression vector was
transfected into SK-ES-1 cells. Because introduction of
anti-miR-20b led to decreased expression of TGFBR2, we also
investigated the effects of anti-miR-20b on ES cell growth.
Compared to Control-miRNA-transfected cells
(10.1±1.18×10⁵ cells), anti-miR-20b-transfected SK-ES-1
cells showed a significant decrease in the cell number
(5.5±0.84×10⁵ cells) at 48 h after transfection
(Fig. 3A). Treatment with
anti-miR-20b also inhibited the proliferation of RD-ES cells
(7.3±1.12×10⁵ cells) compared to in
Control-miRNA-transfected cells (11.4±1.6×10⁵ cells)
(Fig. 3B). TGFBR2 expression
vector-transfected SK-ES-1 cells also showed decreased cell growth
(5.57±1.23×10⁵ cells) compared to untreated cells or
those transfected with the mock vector (9.81±1.34×10⁵
cells) (Fig. 3C). Furthermore,
compared to RD-ES cells transfected with mock vector
(12.12±2.22×10⁵ cells), cell growth was significantly
decreased in RD-ES cells transfected with the TGFBR2 expression
vector (8.06±0.8×10⁵ cells) (Fig. 3D).
Association of TGFBR2 restoration and MYC
expression
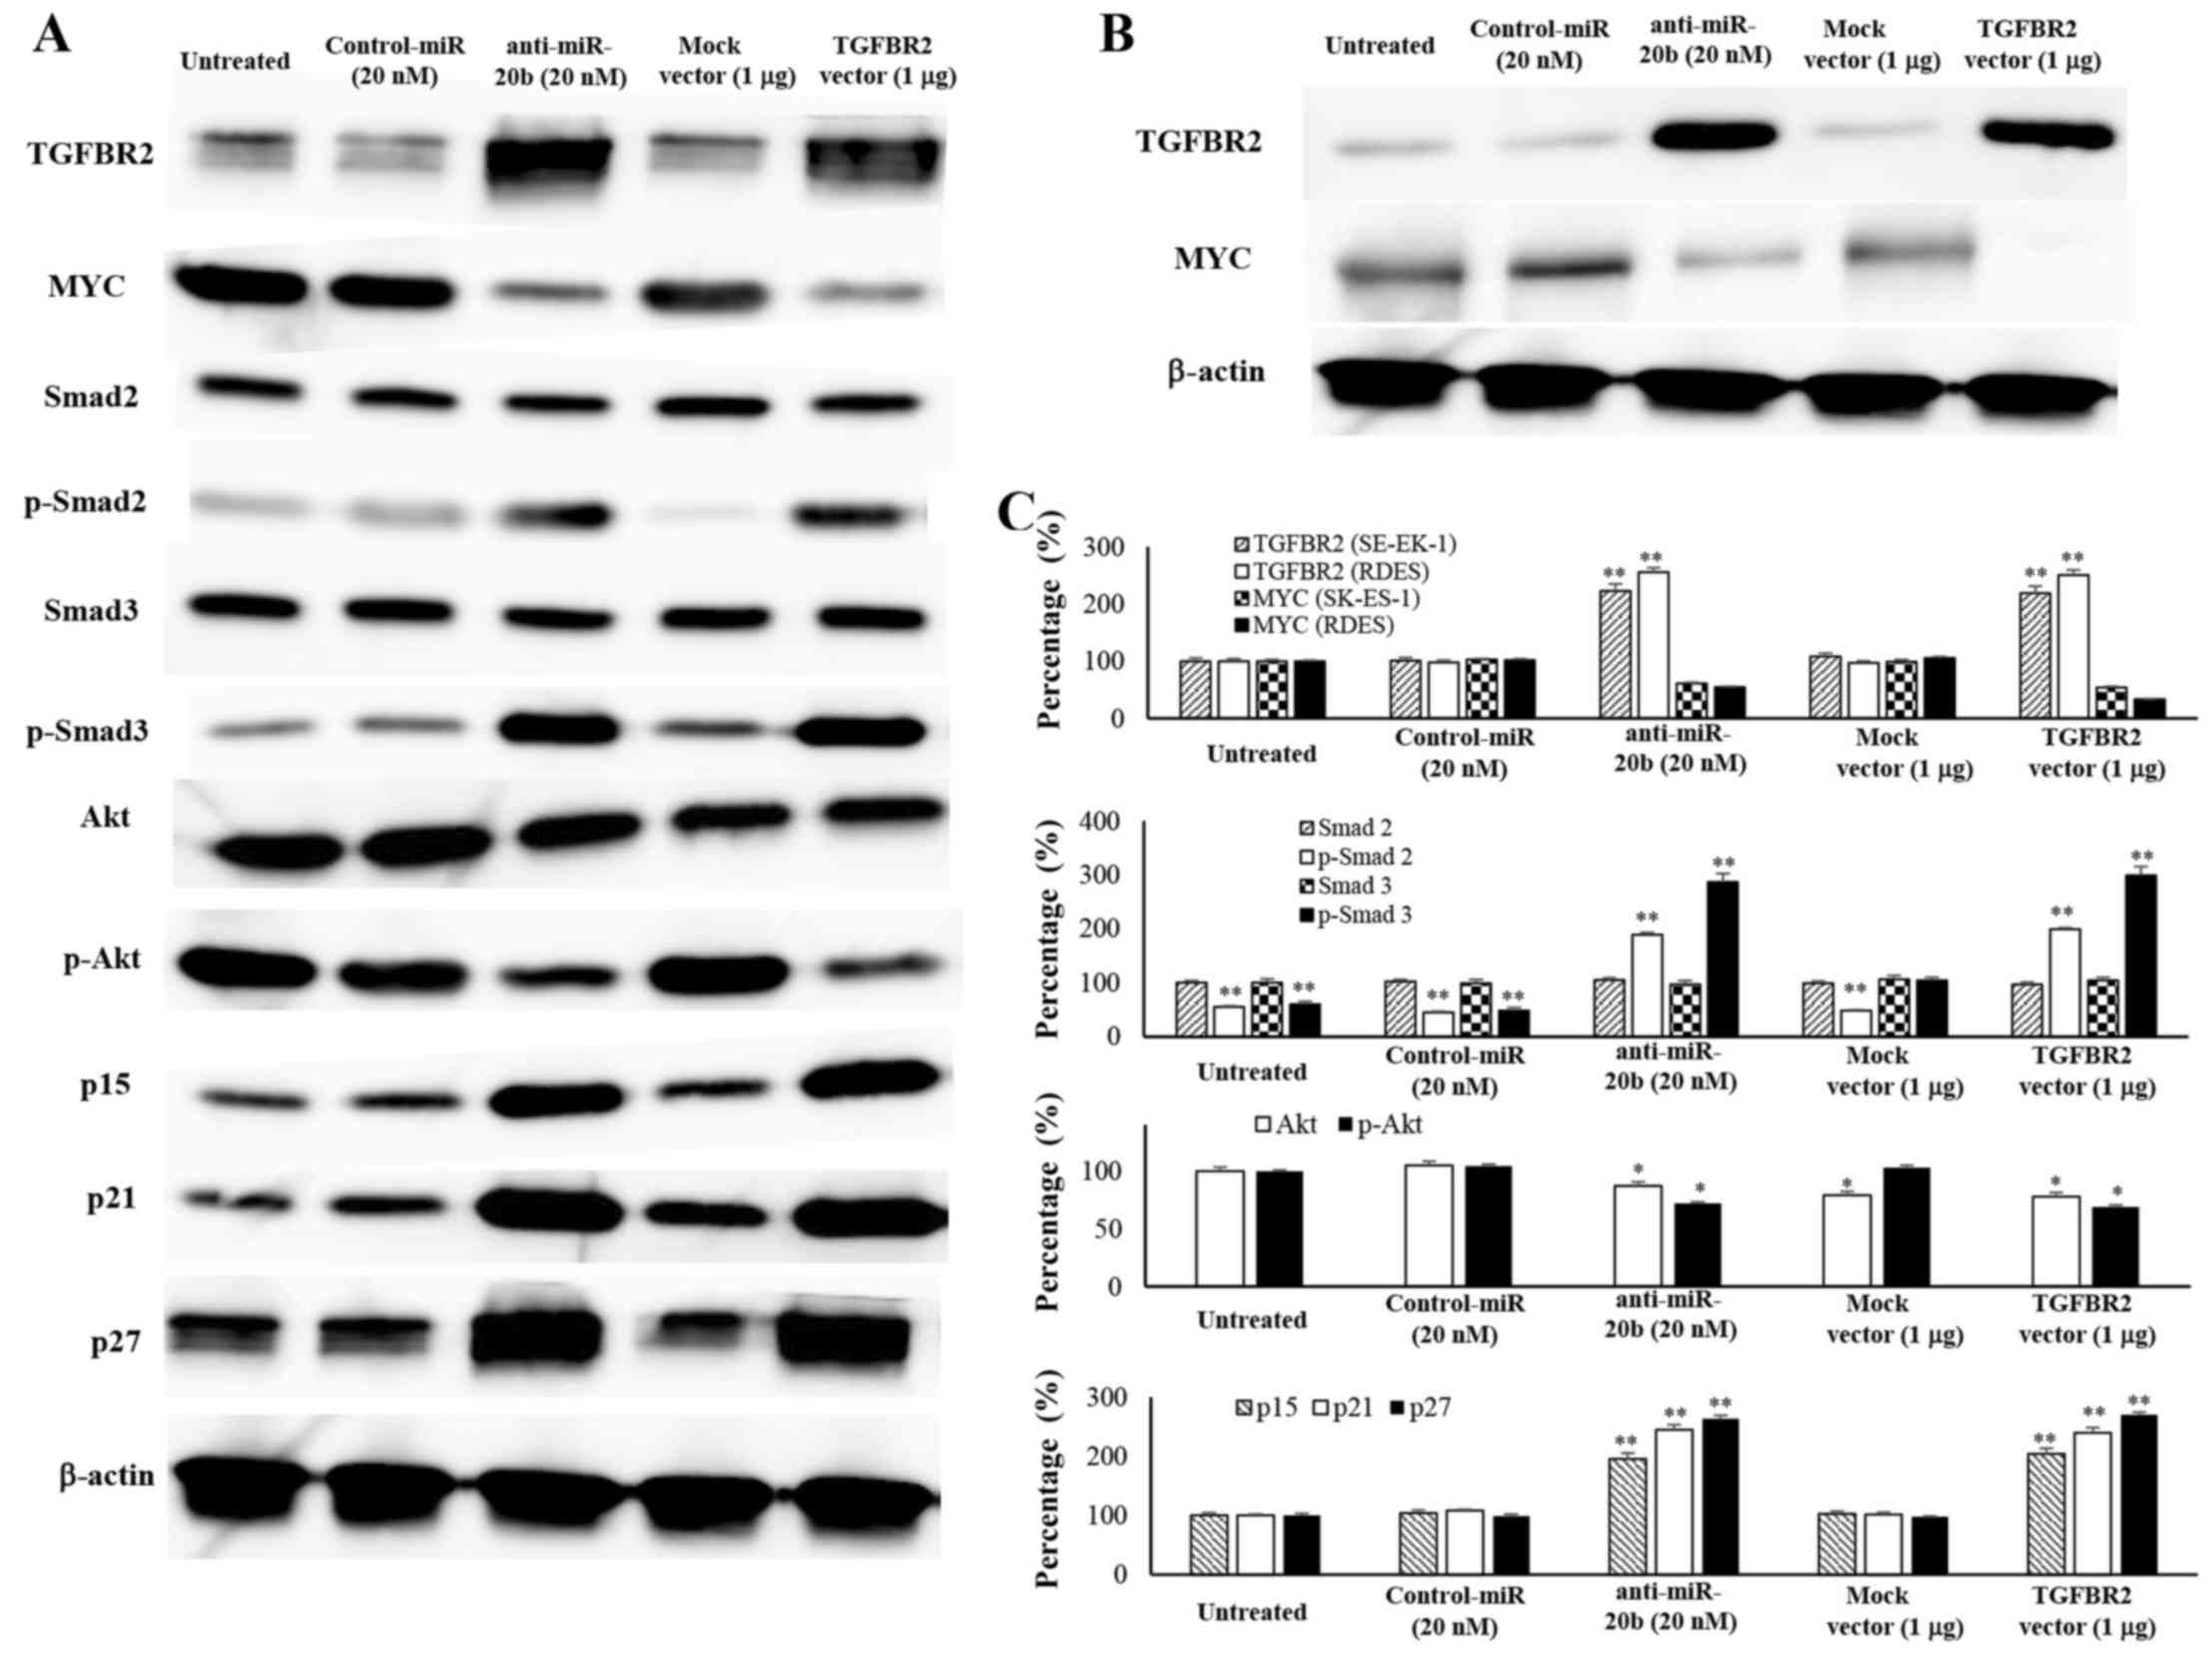
Since MYC was reported to be involved in the
signaling pathway of TGFBR2 (12),
we next examined the expression of TGFBR2, MYC and their downstream
factors in SK-ES-1 cells (Fig. 4A)
and RDES cells (Fig. 4B). When
SK-ES-1 cells were transfected with the anti-miR-20b, the
expression of TGFBR2 (223±12.2%), phosphorylated-Smad2 (189±3.9%),
and phosphorylated-Smad3 (287±15.6%) was dramatically increased
compared to in control cells (100%). When SK-ES-1 cells were
transfected with the TGFBR2 expression vector, the expression of
TGFBR2 (219±9.1%), phosphorylated-Smad2 (199±3.1%) and
phosphorylated-Smad3 (299±16.5%) was dramatically increased
compared to in control cells (100%). TGFBR2 expression in RDES
cells was increased transfected with the anti-miR-20b (255±7.7%)
and TGFBR2 vector (250.1±8.8%) compared to in control cells (100%).
In contrast, MYC expression in SK-ES-1 cells was inhibited when
transfected with the anti-miR-20b (61.2±8.1%) and TGFBR2 vector
(54.2±1.9%) compared to in control cells (100%). When RDES cells
were transfected with the anti-miR-20b (55±10.6%) or TGFBR2
expression vector (33.2±6.8%), the expression of MYC was
dramatically decreased compared to in control cells (100%). Western
blot analysis further demonstrated that the introduction of the
anti-miR-20b into SK-ES-1 cells resulted in a reduction of p-Akt
(72±4.8%) and induction of p15 (195±9.9%), p21 (244±8.8%) and p27
(263±5.5%) protein expression compared to untreated cells (100%).
The introduction of the TGFBR2 expression vectors into SK-ES-1
cells resulted in a reduction of p-Akt (77±1.5%) and induction of
p15 (204±9.2%), p21 (239±8.4%) and p27 (270±4.2%) protein
expression compared to untreated cells (100%) (Fig. 4C).
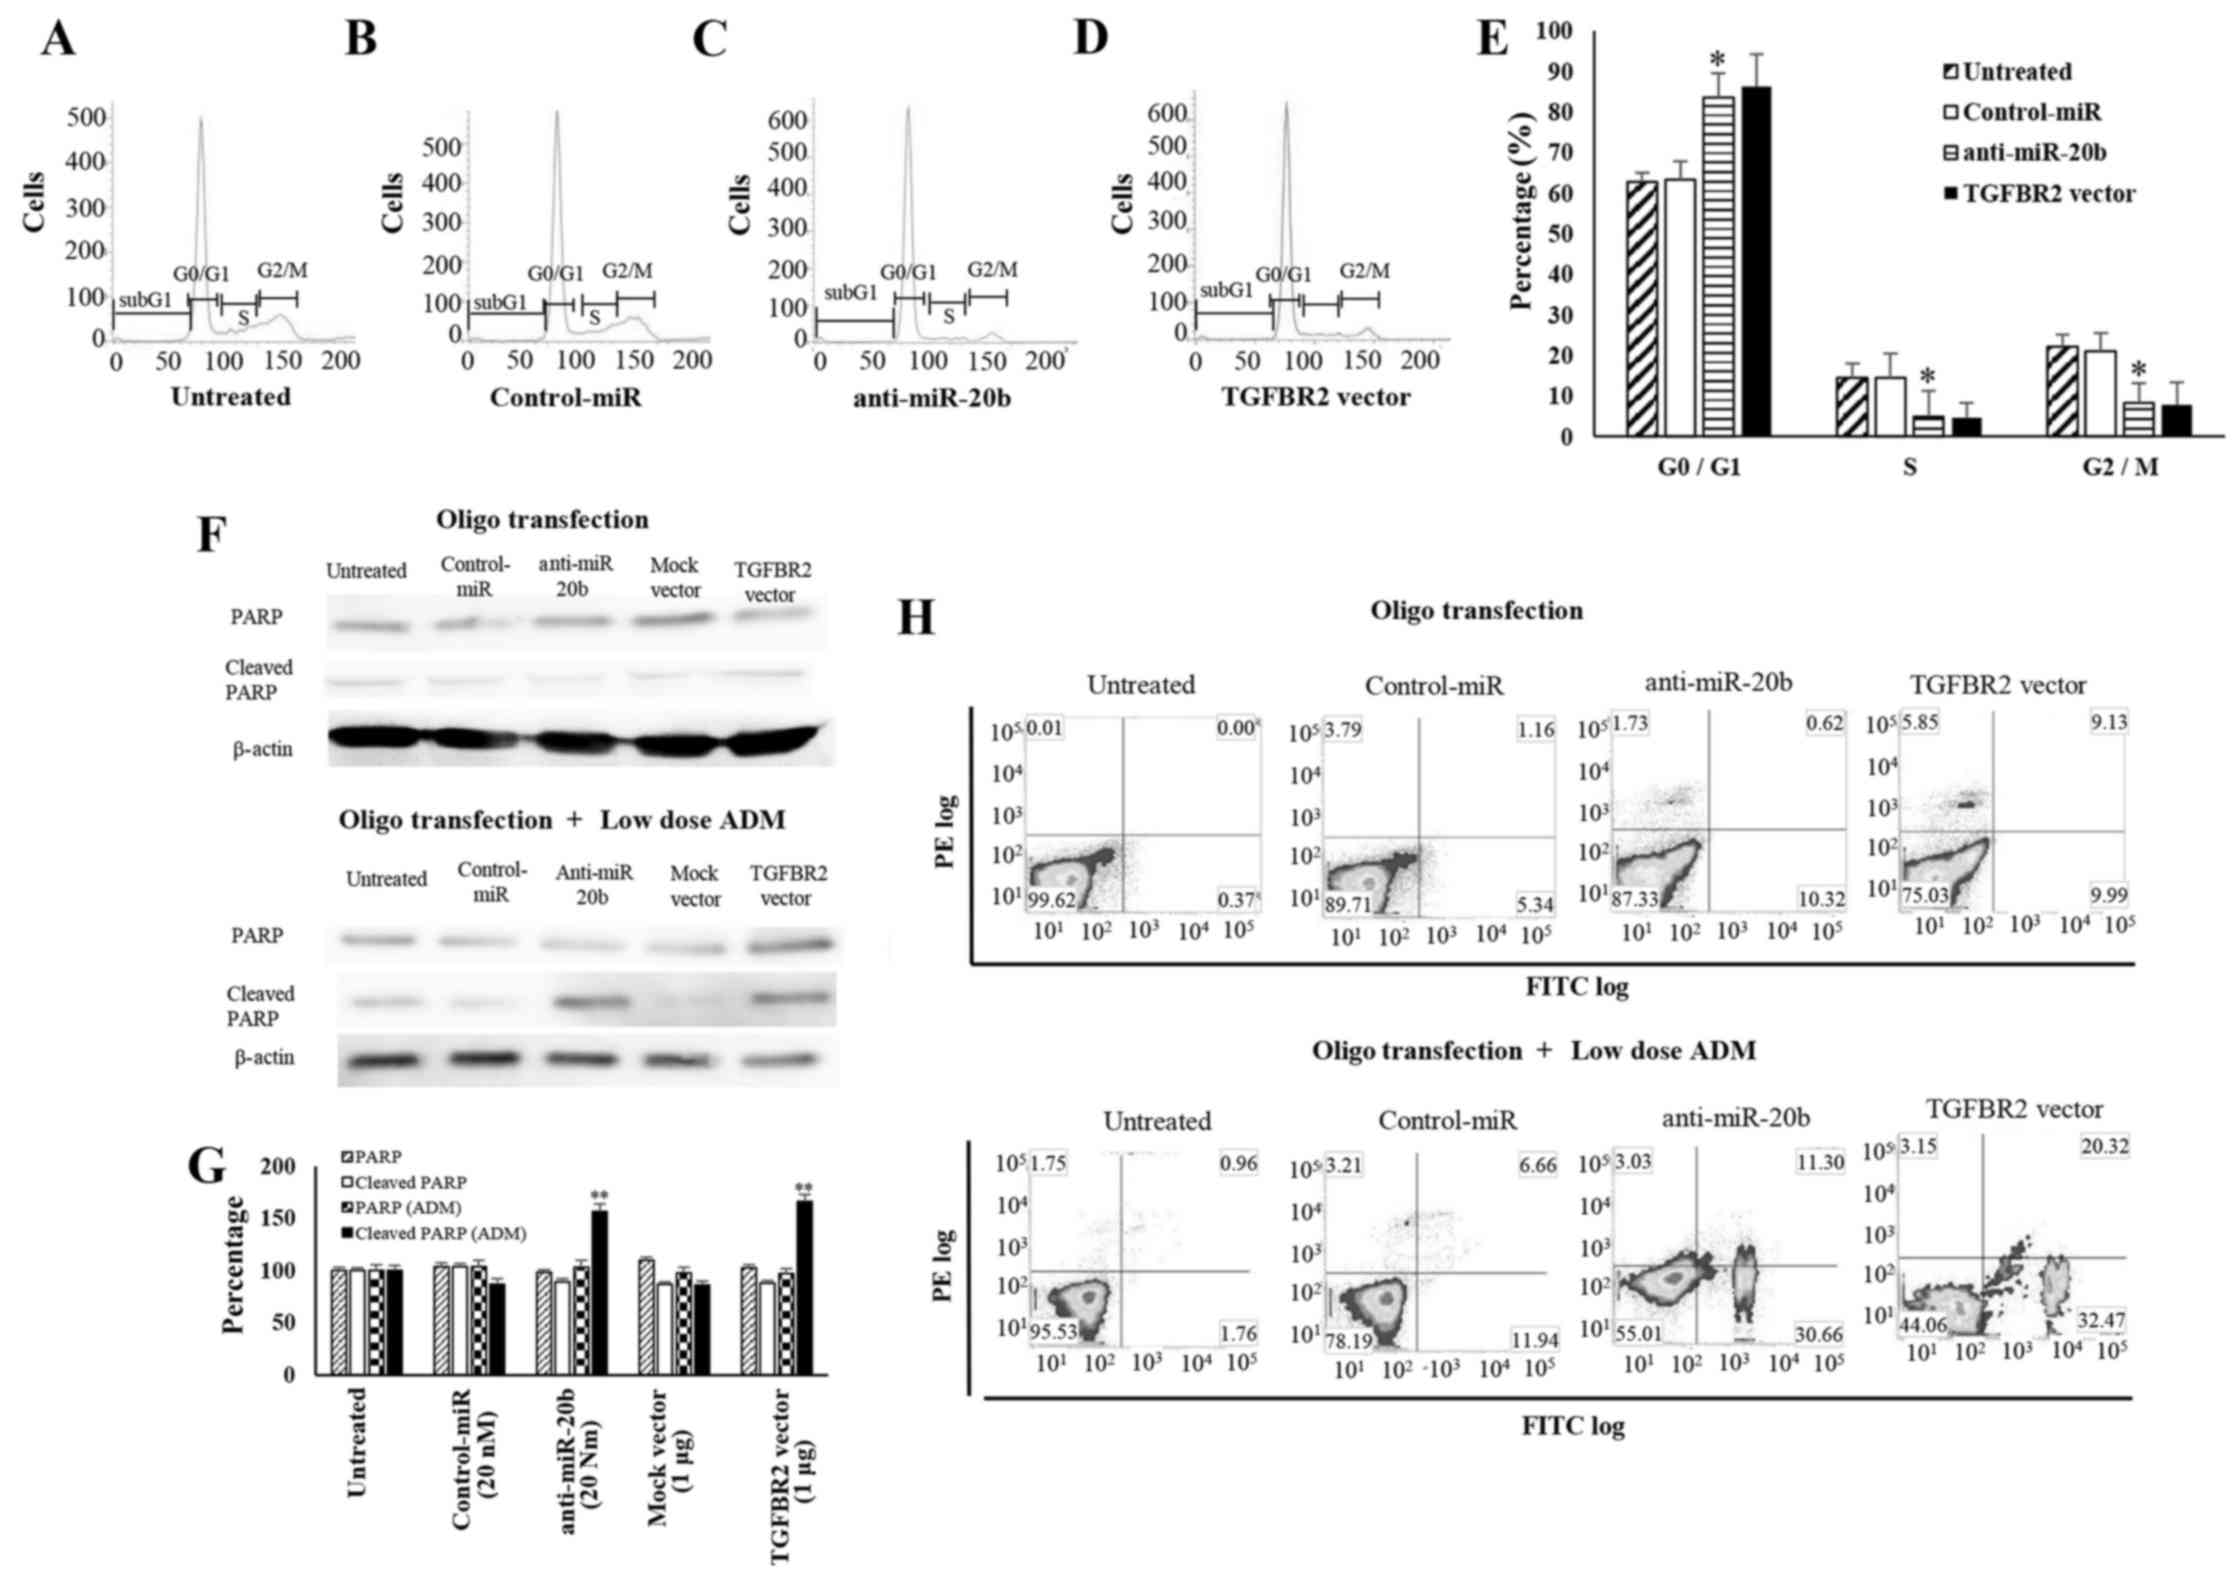
Cell cycle inhibition by anti-miR-20b and
TGFBR2
To elucidate whether growth inhibition of ES cells
is mediated by cell cycle retardation or apoptosis induction, we
analyzed the cell cycle distribution of anti-miR-20b or TGFBR2
expression vector-treated cells (Fig.
5A–D). FACS analyses revealed that the number of SK-ES-1 cells
transfected with anti-20b-miR or TGFBR2 vector in G0/G1 was
significantly higher than that in control cells, whereas that in
G2⁄M phase was significantly lower than in controls (Fig. 5E). These results indicate that
miR-20b and TGFBR2 have opposite effects on ES cell cycle
progression. We next surveyed the expression of PARP and
cleaved-PARP in SK-ES-1 cells. In anti-miR-20b- and
TGFBR2-transfected cells, the expression of cleaved-PARP, an
indicator of caspase-mediated apoptosis, was much lower than that
in control cells. When a low dose of ADM was added to the cells,
cleaved PARP expression was observed both in anti-20b-miR- and
TGFBR2-transfected cells (Fig.
5F). When SK-ES-1 cells were treated with the anti-miR-20b and
low dose AMD, the expression of cleaved PARP (156±7.1%) was
dramatically increased compared to in untreated cells (100%).
SK-ES-1 cells were treated with the TGFBR2 expression vector and
low dose AMD, the expression of cleaved PARP (166±6.6%) was
dramatically increased compared to in untreated cells (100%)
(Fig. 5G). FACS analyses by double
staining with Annexin V-FITC and PI also revealed no significant
differences between the distribution patterns of anti-miR-20b or
TGFBR2 vector-introduced cells and control cells. In contrast, the
induction of apoptosis was observed in SK-ES-1 cells transfected
with the anti-miR-20b or TGFBR2 vector following treatment with
low-dose ADM (Fig. 5H).
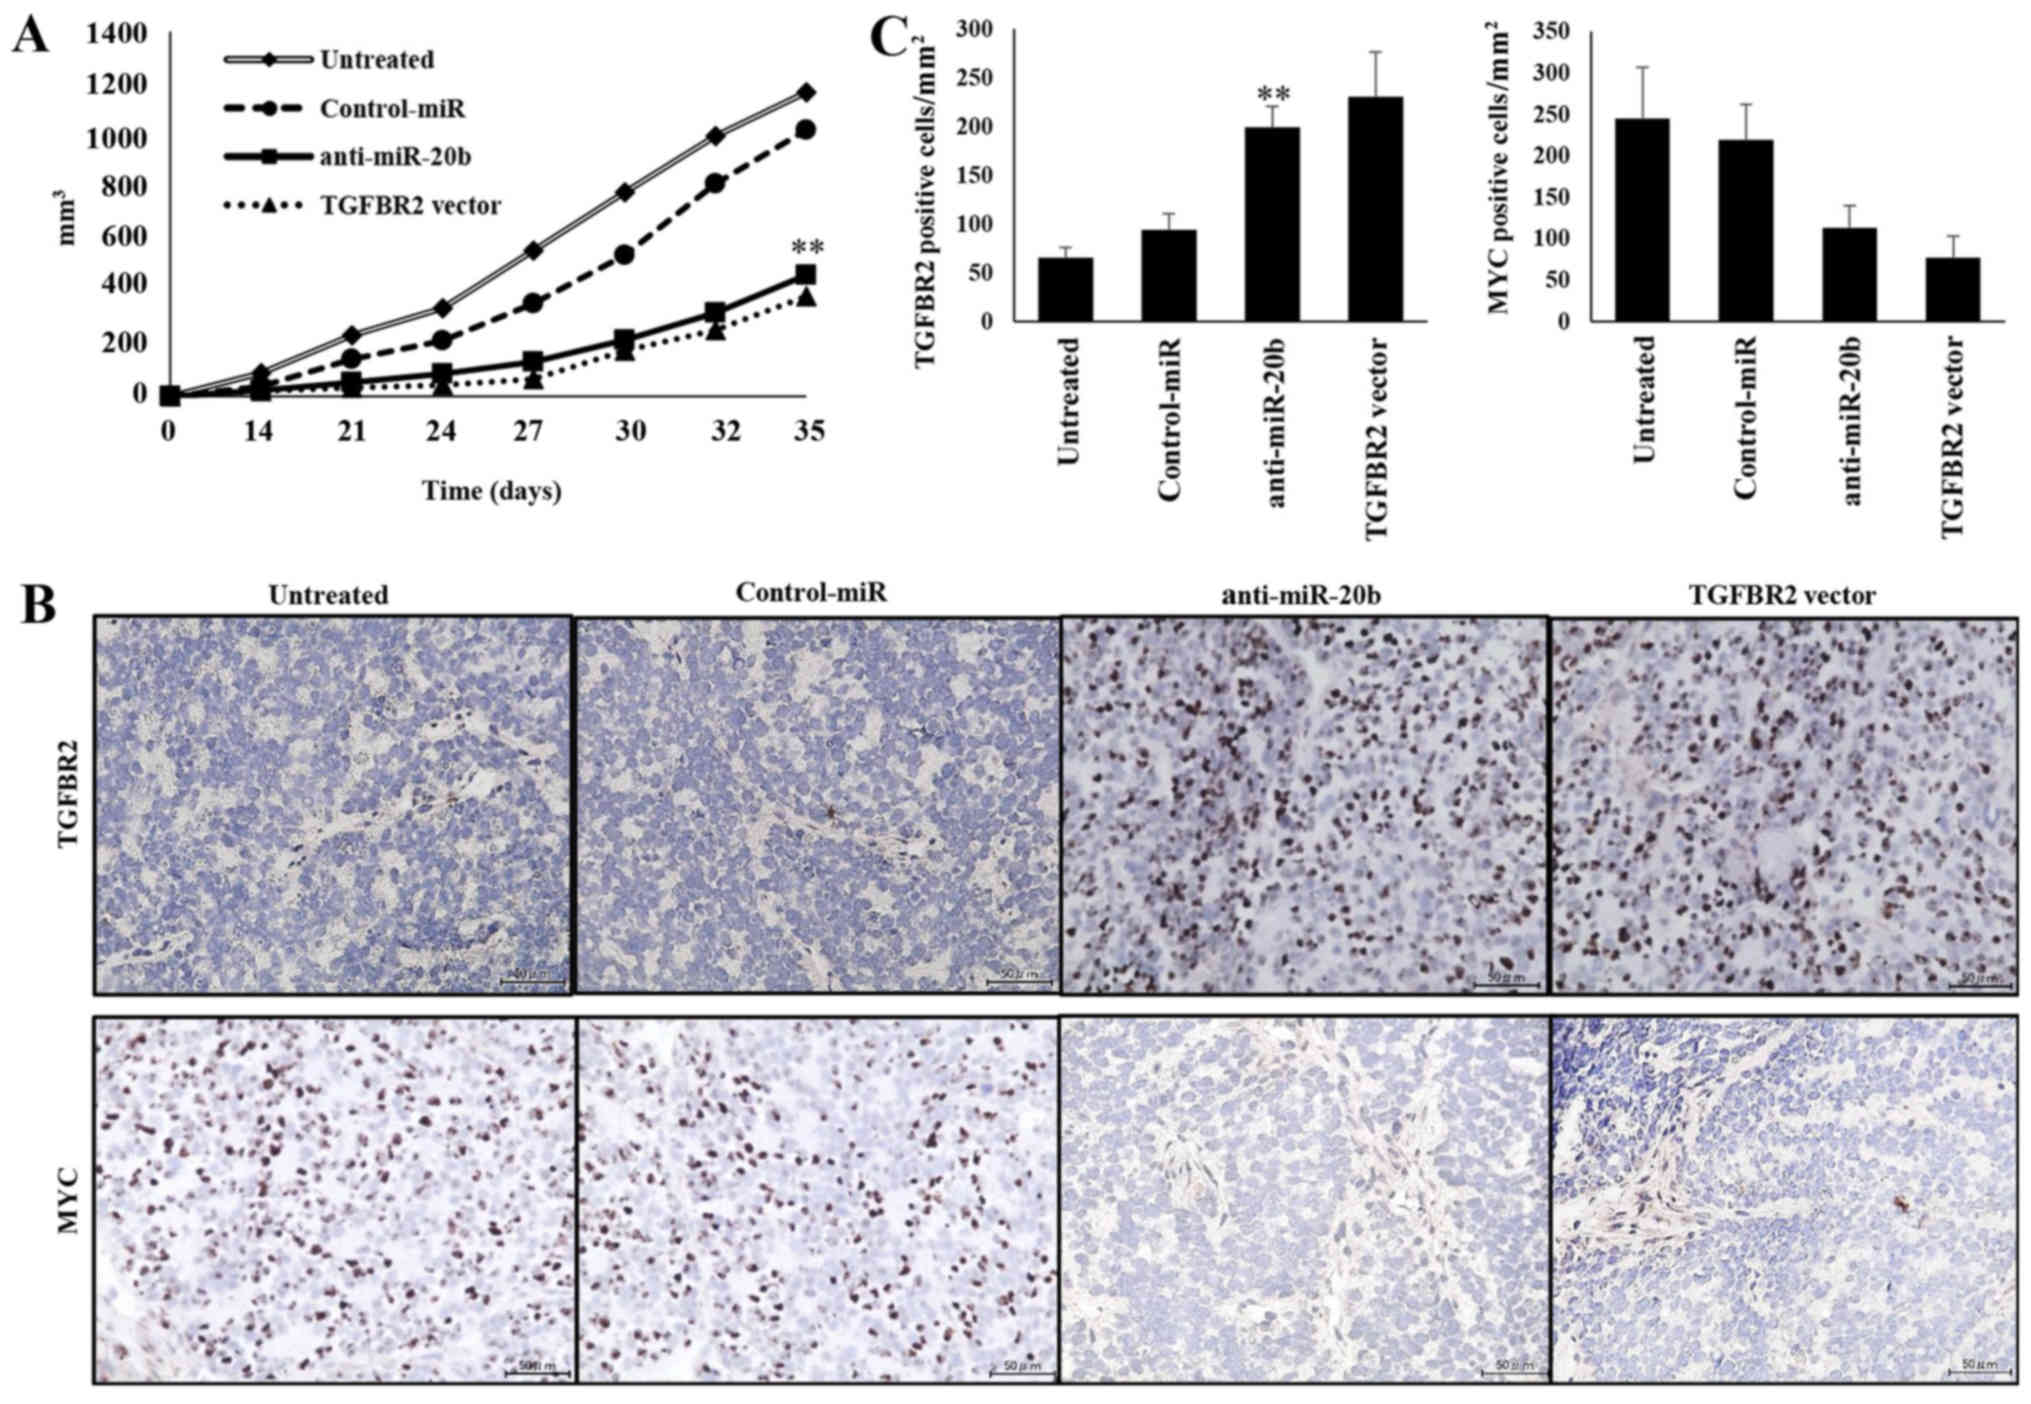
Growth inhibition of xenografted tumors
by anti-20b-miR and TGFBR2
We next examined the effects of miR-20b inhibitor on
the growth of xenografts in vivo. Introduction of
anti-miR-20b into SKES1 cells resulted in the decreased growth of
subcutaneous xenografted tumors in nude mice (Fig. 6A). The size of tumors in mice
inoculated with anti-miR-20b-transfected SK-ES-1 cells (466.5±28.1
cells/mm3) or TGFBR2 vector-transfected cells
(385.5±16.9 cells/mm3) was significantly smaller than
that following transfection with untreated (1165.8±74.1
cells/mm3) and NC-miRNA-transfected cells (1021.2±54.7
cells/mm3). These results suggest that the inhibition of
miR-20b expression also leads to a reduction in the in vivo
growth of ES cells. Immunohistochemical analysis revealed that the
expression of TGFBR2 and MYC in xenografted tumors was inhibited by
transfection with the anti-miR-20b and TGFBR2 expression vectors
(Fig. 6B). The number of cells
positive for TGFBR2 expression was significantly increased in mice
inoculated with the anti-miR-20b (199±21.8 cells/mm2) or
TGFBR2 expression vector-transfected cells (230.7±45.7
cells/mm2) compared to untreated (65.6±10.6
cells/mm2) or Control-miR transfected cells (93.8±16.8
cells/mm2) (P<0.01; Fig.
6C). The number of MYC-expressing cells was significantly
reduced in mice inoculated with anti-miR-20b (113.2±26.2
cells/mm2) or TGFBR2 vector (76.9±26
cells/mm2) transfected cells compared to untreated
(244.6±62.1 cells/mm2) or Control-miR-transfected cells
(219.6±42.5 cells/mm2) (P<0.01; Fig. 6C).
Discussion
miRNAs are a group of small, non-coding RNAs that
regulate protein-coding genes (16). To determine the miRNA-mRNA
relationship in ES, we carried out genome-wide miRNA array and cDNA
array analyses.
Our array data regarding miRNA deregulation revealed
increased aberrant miR-20b expression in ES cells compared to that
in hMSCs. Several studies have shown that miR-20b is upregulated
and involved in potential targets for cancer therapy, diagnosis and
prognosis (5–7). However, the biological
characteristics of miR-20b in ES cells remained unclear. Our data
demonstrated that miR-20b expression was upregulated in ES cell
lines, and we conducted genome-wide mRNA profiling by cDNA array to
reveal the possible targets of miR-20b in ES cells.
The cDNA array data showed that TGFBR2 mRNA
expression was decreased in all five ES cell lines. Furthermore,
alignment analysis indicated a possible match between miR-20b and
the 3′-UTR of TGFBR2. TGFBR2 is among the most frequently
transformed tumor-suppressor genes in human cancers, driving
actuation of the MYC pathway and increasing cell survival (12). Several studies have suggested that
TGFBR2 plays an important role in the complex network of oncogenes
by regulating cellular transformation. Downregulation of TGFBR2 has
been observed in colon cancer (17) and hepatocellular carcinoma
(18). Our data in ES cells agree
with the results of previous studies showing that decreased TGFBR2
may contribute to malignant potential.
Although miR-20b may affect gene expression, we
regarded TGFBR2 as the target of miR-20b in ES cells. Several
studies have detected several target genes of miR-20b, including
phosphatase and tensin homolog and matrix metalloproteinase 2
(19,20). Our cDNA array data indicated that
TGFBR2 was the only miR-20b-target gene and was uniformly decreased
in all five ES cell lines. BLAST and TargetScan analyses further
supported that TGFBR2 is the tentative target of miR-20b. miR-20b
may decrease TGFBR2 expression through an indirect pathway;
however, TGFBR2 mRNA degradation was increased even after
inhibiting de novo mRNA transcription. miR-20b did not
inhibit TGFBR2 mRNA expression in mutant miR-20b-transfected cells.
Therefore, miR-20b may regulate TGFBR2 mRNA stability.
We further examined the role of miR-20b in the
regulation of its possible target gene TGFBR2 and changes in the
malignancy potential of ES cell lines. Transfection with the
anti-miR-20b and TGFBR2 expression vectors into ES cells enhanced
p-Smad2/3 and repressed MYC protein, indicating that the
restoration of TGF-β signaling controls MYC expression. It has been
reported that MYC expression is significantly downregulated in
response to TGF-β signaling and that the Smad pathway is an
upstream regulator of MYC expression (21). Our data suggest that downregulatory
mechanisms of MYC expression downstream of TGF-β signaling and of
TGFBR2 expression via miR-20b may occur in ES cells.
Our results regarding the cell cycle revealed that
miR-20b promoted the proliferation of ES cells by inducing cell
cycle retardation. These results are consistent with the MYC and
p-Akt downregulation in anti-miR-20b and TGFBR2 expression
vector-transfected cells. Previous reports demonstrated that
Smad2/3 phosphorylation via TGFBR2 activation is necessary for
controlling the G1/S checkpoint (21). p15, p21 and p27 expression
increased as TGFBR2 was expressed. As a result, the progression of
the cell cycle was delayed. TGFBR2 regulates the G1/S transition
and cell growth, and restoration of TGFBR2 leads to retardation of
the cell cycle in the G1 phase (22). Thus, upregulation of miR-20b may
influence the cell cycle progression of ES cells through
miR-20b-mediated regulation of TGFBR2.
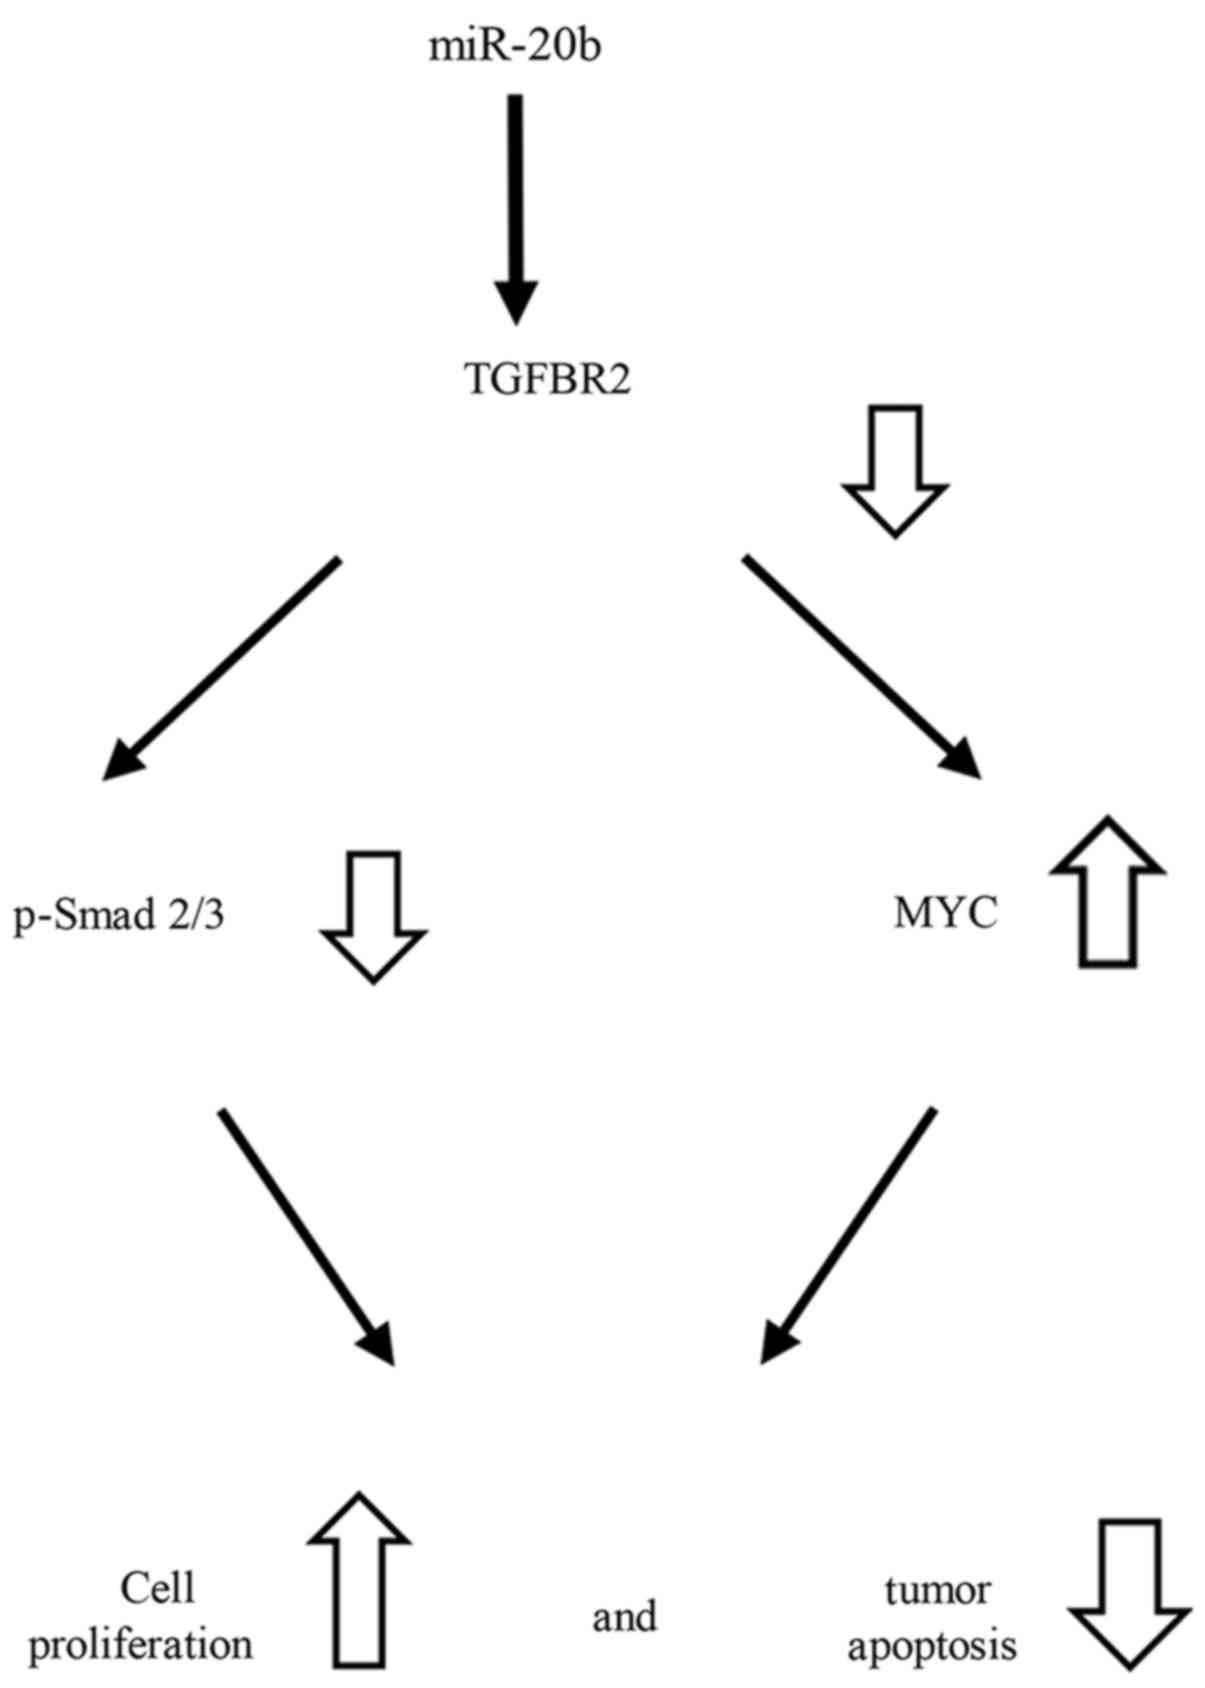
Since TGFBR2 is a major negative factor in MYC
expression in ES, the repression of TGFBR2 by miR-20b may play an
important role in cell growth (Fig.
7). Dysfunction of Smad2/3 phosphorylation through TGFBR2 may
upregulate MYC and lead to cell proliferation and an anti-apoptotic
status. Thus, phosphorylation of Smad2/3 by TGFBR2 in ES cells may
induce downregulation of MYC, resulting in the deceleration of ES
cell growth.
Moreover, the suppression of miR-20b led to
inhibition of ES tumor growth in vivo. In accordance with
the in vitro data, the xenograft model of ES also suggested
that the reduction in miR-20b expression could inhibit ES tumor
growth in vivo via TGFBR2 restoration.
In conclusion, the present study revealed an inverse
correlation in miR-20b and TGFBR2 in ES cells. We previously
investigated the aberrant expression of MYC in ES cell lines
(23). Based on our results, MYC
may be repressed by phosphorylation of Smad via suppressing the
expression of TGFBR2. As a result, appropriate expression of TGFBR2
can regulate MYC expression and control the cell cycle and tumor
survival of ES. The present data regarding the link between
miR-20b, TGFBR2 and MYC in ES cells may improve the understanding
of the oncogenesis of ES and provide a novel strategy for clinical
application.
Acknowledgments
The present study was supported in part by the fund
of the National Cancer Center Research and Development (26-A-4) and
the Grants-in-Aid for Scientific Research (nos. 15K10451, 16K10866
and 16K20063) from the Japan Society for the Promotion of
Science.
References
|
1
|
Esiashvili N, Goodman M and Marcus RB Jr:
Changes in incidence and survival of Ewing sarcoma patients over
the past 3 decades: Surveillance Epidemiology and End Results data.
J Pediatr Hematol Oncol. 30:425–430. 2008. View Article : Google Scholar : PubMed/NCBI
|
|
2
|
Womer RB, West DC, Krailo MD, Dickman PS,
Pawel BR, Grier HE, Marcus K, Sailer S, Healey JH, Dormans JP, et
al: Randomized controlled trial of interval-compressed chemotherapy
for the treatment of localized Ewing sarcoma: A report from the
Children's Oncology Group. J Clin Oncol. 30:4148–4154. 2012.
View Article : Google Scholar : PubMed/NCBI
|
|
3
|
Sayed D and Abdellatif M: MicroRNAs in
development and disease. Physiol Rev. 91:827–887. 2011. View Article : Google Scholar : PubMed/NCBI
|
|
4
|
Lima RT, Busacca S, Almeida GM, Gaudino G,
Fennell DA and Vasconcelos MH: MicroRNA regulation of core
apoptosis pathways in cancer. Eur J Cancer. 47:163–174. 2011.
View Article : Google Scholar
|
|
5
|
Li S, Qiang Q, Shan H, Shi M, Gan G, Ma F
and Chen B: MiR-20a and miR-20b negatively regulate autophagy by
targeting RB1CC1/FIP200 in breast cancer cells. Life Sci.
147:143–152. 2016. View Article : Google Scholar : PubMed/NCBI
|
|
6
|
Danza K, Silvestris N, Simone G, Signorile
M, Saragoni L, Brunetti O, Monti M, Mazzotta A, De Summa S, Mangia
A, et al: Role of miR-27a, miR-181a and miR-20b in gastric cancer
hypoxia-induced chemoresistance. Cancer Biol Ther. 17:400–406.
2016. View Article : Google Scholar : PubMed/NCBI
|
|
7
|
Yamaguchi T, Iijima T, Wakaume R,
Takahashi K, Matsumoto H, Nakano D, Nakayama Y, Mori T, Horiguchi S
and Miyaki M: Underexpression of miR-126 and miR-20b in hereditary
and nonhereditary colorectal tumors. Oncology. 87:58–66. 2014.
View Article : Google Scholar : PubMed/NCBI
|
|
8
|
Chowdhury S, Ammanamanchi S and Howell GM:
Epigenetic targeting of transforming growth factor β receptor II
and implications for cancer therapy. Mol Cell Pharmacol. 1:57–70.
2009. View Article : Google Scholar : PubMed/NCBI
|
|
9
|
Ikushima H and Miyazono K: TGFbeta
signalling: A complex web in cancer progression. Nat Rev Cancer.
10:415–424. 2010. View
Article : Google Scholar : PubMed/NCBI
|
|
10
|
Yu Y, Kanwar SS, Patel BB, Oh PS, Nautiyal
J, Sarkar FH and Majumdar AP: MicroRNA-21 induces stemness by
downregulating transforming growth factor beta receptor 2 (TGFβR2)
in colon cancer cells. Carcinogenesis. 33:68–76. 2012. View Article : Google Scholar
|
|
11
|
Mishra S, Deng JJ, Gowda PS, Rao MK, Lin
CL, Chen CL, Huang T and Sun LZ: Androgen receptor and microRNA-21
axis downregulates transforming growth factor beta receptor II
(TGFBR2) expression in prostate cancer. Oncogene. 33:4097–4106.
2014. View Article : Google Scholar
|
|
12
|
Zhu X, Ozturk F, Liu C, Oakley GG and
Nawshad A: Transforming growth factor-β activates c-Myc to promote
palatal growth. J Cell Biochem. 113:3069–3085. 2012. View Article : Google Scholar : PubMed/NCBI
|
|
13
|
Kawano M, Tanaka K, Itonaga I, Ikeda S,
Iwasaki T and Tsumura H: microRNA-93 promotes cell proliferation
via targeting of PTEN in Osteosarcoma cells. J Exp Clin Cancer Res.
34:762015. View Article : Google Scholar : PubMed/NCBI
|
|
14
|
Tanaka K, Kawano M, Itonaga I, Iwasaki T,
Miyazaki M, Ikeda S and Tsumura H: Tumor suppressive microRNA-138
inhibits metastatic potential via the targeting of focal adhesion
kinase in Ewing's sarcoma cells. Int J Oncol. 48:1135–1144.
2016.PubMed/NCBI
|
|
15
|
Kawano M, Tanaka K, Itonaga I, Iwasaki T
and Tsumura H: MicroRNA-301a promotes cell proliferation via PTEN
targeting in Ewing's sarcoma cells. Int J Oncol. 48:1531–1540.
2016. View Article : Google Scholar : PubMed/NCBI
|
|
16
|
Lu J, Getz G, Miska EA, Alvarez-Saavedra
E, Lamb J, Peck D, Sweet-Cordero A, Ebert BL, Mak RH, Ferrando AA,
Downing JR, et al: MicroRNA expression profiles classify human
cancers. Nature. 435:834–838. 2005. View Article : Google Scholar : PubMed/NCBI
|
|
17
|
Yu M, Trobridge P, Wang Y, Kanngurn S,
Morris SM, Knoblaugh S and Grady WM: Inactivation of TGF-β
signaling and loss of PTEN cooperate to induce colon cancer in
vivo. Oncogene. 33:1538–1547. 2014. View Article : Google Scholar
|
|
18
|
Mamiya T, Yamazaki K, Masugi Y, Mori T,
Effendi K, Du W, Hibi T, Tanabe M, Ueda M, Takayama T, et al:
Reduced transforming growth factor-beta receptor II expression in
hepatocellular carcinoma correlates with intrahepatic metastasis.
Lab Invest. 90:1339–1345. 2010. View Article : Google Scholar : PubMed/NCBI
|
|
19
|
Wang B, Yang J and Xiao B: MicroRNA-20b
(miR-20b) promotes the proliferation, migration, invasion, and
tumorigenicity in esophageal cancer cells via the regulation of
phosphatase and tensin homologue expression. PLoS One.
11:e01641052016. View Article : Google Scholar : PubMed/NCBI
|
|
20
|
Park SL, Cho TM, Won SY, Song JH, Noh DH,
Kim WJ and Moon SK: MicroRNA-20b inhibits the proliferation,
migration and invasion of bladder cancer EJ cells via the targeting
of cell cycle regulation and Sp-1-mediated MMP-2 expression. Oncol
Rep. 34:1605–1612. 2015. View Article : Google Scholar : PubMed/NCBI
|
|
21
|
Zhao HW, Li YW, Feng R, Yu JB, Li J, Zhang
Y, Li JC and Wang YX: TGF-β/Smad2/3 signal pathway involves in U251
cell proliferation and apoptosis. Gene. 562:76–82. 2015. View Article : Google Scholar : PubMed/NCBI
|
|
22
|
Choi J, Park SJ, Jo EJ, Lee HY, Hong S,
Kim SJ and Kim BC: Hydrogen peroxide inhibits transforming growth
factor-β1-induced cell cycle arrest by promoting Smad3 linker
phosphorylation through activation of Akt-ERK1/2-linked signaling
pathway. Biochem Biophys Res Commun. 435:634–639. 2013. View Article : Google Scholar : PubMed/NCBI
|
|
23
|
Kawano M, Tanaka K, Itonaga I, Iwasaki T
and Tsumura H: c-Myc represses tumor-suppressive microRNAs, let-7a,
miR-16 and miR-29b, and induces cyclin D2-mediated cell
proliferation in Ewing's sarcoma cell line. PLoS One.
10:e01385602015. View Article : Google Scholar : PubMed/NCBI
|