Introduction
Lung cancer is the most common cancer type and the
leading cause of cancer-associated mortality worldwide (1). Non-small cell lung cancer (NSCLC) is
the most prevalent and heterogeneous subtype of lung cancer
(2,3), including lung adenocarcinoma (LUAD)
and lung squamous cell carcinoma (LUSC). Despite numerous advances
in treatment methods, the 5-year overall survival for advanced lung
cancer remains poor (4).
Currently, platinum-based postoperative chemotherapy is a standard
treatment, and cisplatin is a basic chemotherapy drug for lung
carcinoma; however, cisplatin resistance mainly leads to the
failure of chemotherapy in these patients (5). Thus, it is urgent to identify
specific and effective biomarkers to predict the prognosis of
adjuvant chemotherapy for NSCLC.
DNA repair capacity is a major determinant of
cisplatin resistance (6). Since
the excision repair cross-complementation group 1 (ERCC1) protein
is essential for nucleotide excision repair (NER) and influences
genomic instability, ERCC1 may serve a critical role in DNA repair
(7). It has been reported that the
complex of ERCC1 combined with xeroderma pigmentosum
complementation group F cleaves on the 5′ side of the DNA lesion.
Besides NER, this complex is also involved in the repair of DNA
interstrand crosslinks and in the completion of homologous
recombination (8). A great part of
the complexity of human diseases can be attributed to the
regulation of gene expression via alterations in the
transcriptional and post-transcriptional levels (9,10).
Alternative splicing is a regulated process that occurs in nearly
all multi-exon human genes (10).
Different transcriptional regulation and splicing mechanisms lead
to the production of multiple products by individual genes. The
ERCC1 gene generates a variety of isoforms by alternative
splicing. Previous studies have demonstrated that the protein
products of 297aa encoded by the ERCC1-202 and
ERCC1-208 isoforms exhibit different DNA repair capacities
(11), although the only
difference between the two isoforms is that ERCC1-202 has a
longer 3′-untranslated region (3′UTR). It has also been reported
that the structural alterations of the 3′UTR were involved in
regulating the function and activation of genes (12).
At a genomic level, the transcription termination
site of ERCC1 3′UTR is adjacent to a conjunct transcription
start site of CD3e molecule associated protein (CD3EAP) and
protein phosphatase 1 regulatory subunit 13 like (PPP1R13L),
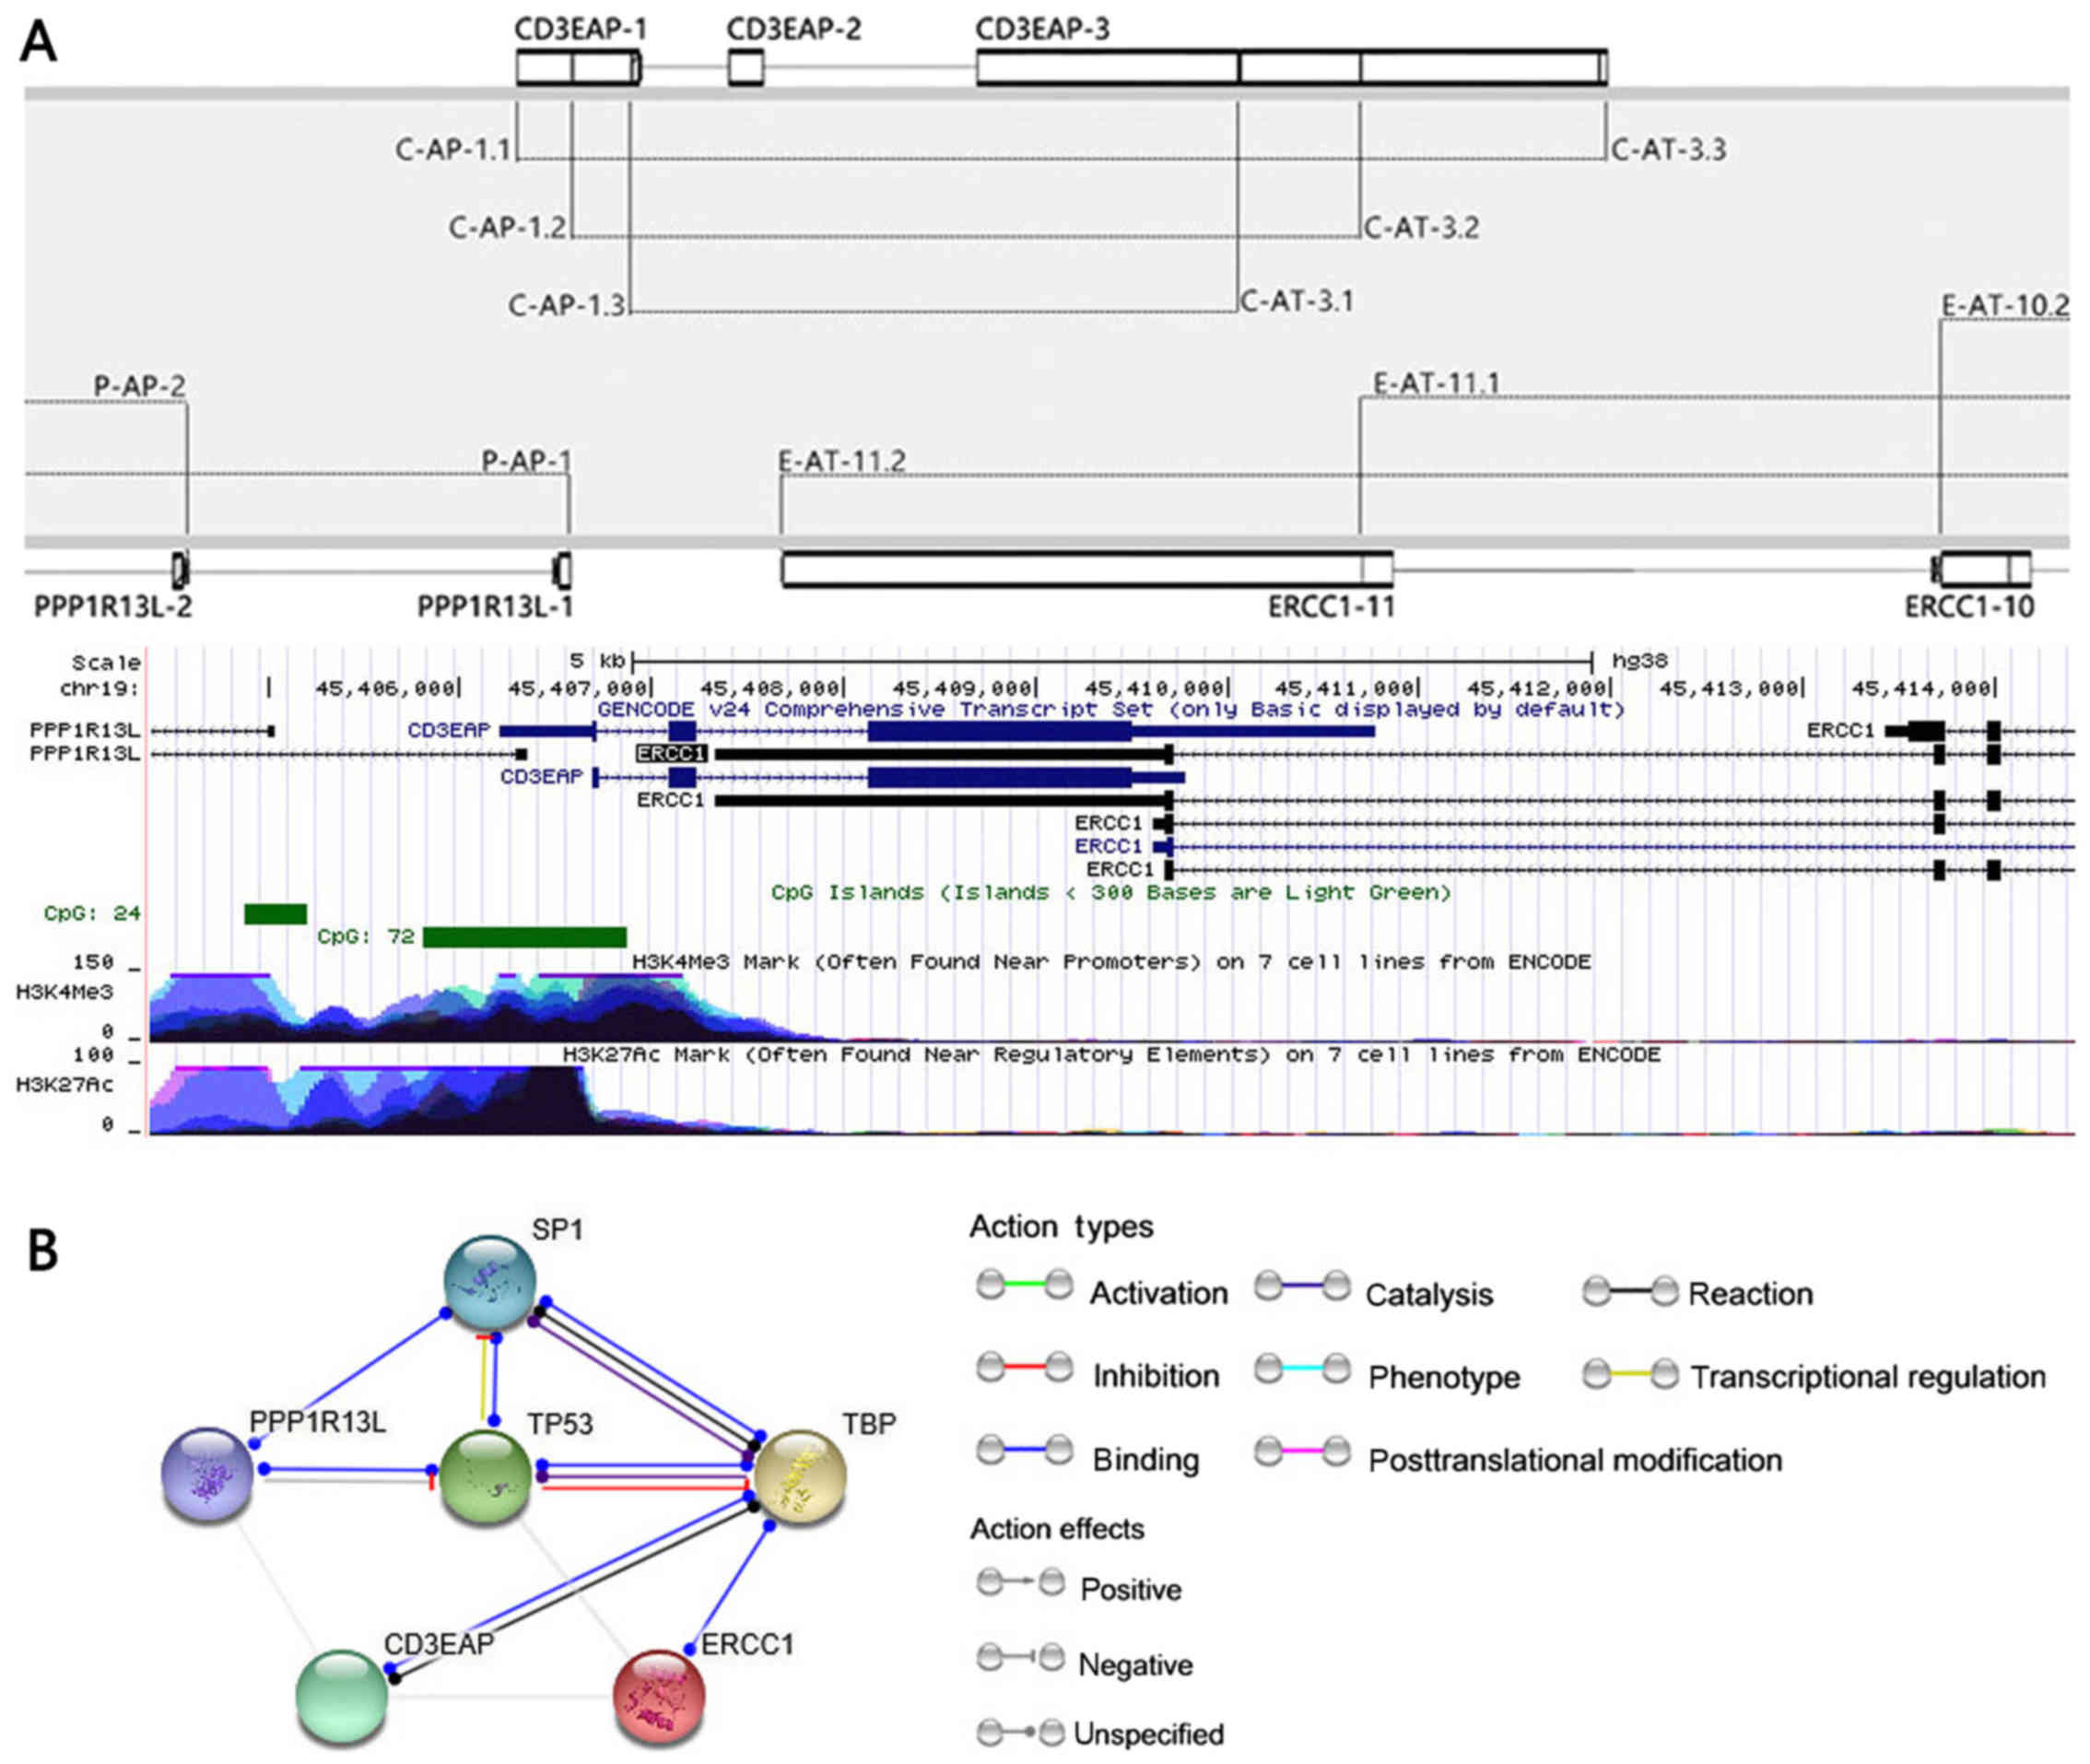
forming a complex sense-antisense gene arrangement (Fig. 1A). ERCC1, CD3EAP and
PPP1R13L function as not only adjacent genes, but also
participates in the pathway of DNA repair, proliferation and
apoptosis, respectively. CD3EAP, also known as antisense to
ERCC1, encodes a nucleolar protein localized to the
nucleolus fibrillar centers and the nucleolus organizer regions of
mitotic chromosomes (13). In
addition, CD3EAP is a subunit of the RNA polymerase I complex
involved in ribosomal RNA transcription, regulating the
biosynthesis of ribosome and participating in cell proliferation
(14). The gene PPP1R13L,
also known as iASSP, is an inhibitor of the tumor protein
p53 (TP53) apoptotic pathway (15)
and of the p65 subunit of the transcription factor nuclear factor
(NF)-κB. Since TP53 and NF-κB serve a pivotal role in the apoptosis
and inflammatory response, their inhibition by PPP1R13L would
affect the availability of relative factors and thus modify the
regulation of apoptosis (16).
Such overlapping sense and antisense gene pairs may act
predominantly as regulators of genes transcription (17,18),
and have been implicated in numerous different cellular processes
(19). Transcription and splicing
are tightly coupled (20,21); however, since the transcription
process is strand-specific, it is unclear how and whether the
overlapping genes interfere mutually (22). Several potential mechanisms may
contribute to this effect, such as the overlapping gene cross-talk
between their transcription start sites, transcription termination
sites, respective splice sites and epigenetic alterations in the
overlapping regions of the gene may affect the expression of sence
and antisense genes simultaneously (23). Nevertheless, the precise function
of overlapping association remains to be elucidated.
In the present study, it was hypothesized that the
overlap region among ERCC1, CD3EAP and
PPP1R13L may be involved in linking the upstream and
downstream genes, and have potential implications on cisplatin
resistance in NSCLC. The Cancer Genome Atlas (TCGA) project
provides a rich sequencing source for the investigation of exon and
gene expression in cancer (24).
Bioinformatics analysis using the TCGA data portal was conducted,
aiming to analyze the correlation between genes in two aspects of
transcriptional and alternative splicing. Furthermore, a cell model
of cisplatin-induced DNA damage in NSCLC and other in vitro
experiments were performed to verify the findings of bioinformatics
analysis, providing an insight into the identification of
complementary biomarkers associated with lung carcinoma.
Materials and methods
Gene arrangement of 19q13.3 and analysis
of protein network
The genome is a one-dimensional linear space, genes
are arranged to form a variety of overlapping conformations. The
genome structure of 19q13.2-3 was analyzed by bioinformatics
analysis. Comprehensive transcript set data were derived from the
GENCODE (www.gencodegenes.org). The UCSC Genome
Browser on Human Dec. 2013 (GRCh38/hg38) Assembly was used to
analyze the distribution of H3K27Ac, H3K4Me3 and CpG islands in
19q13.3 (25). STRING (http://string-db.org/) was used for protein
interaction network analysis.
Heatmap of gene exon expression
profiles
The exon expression levels of ERCC1,
CD3EAP and PPP1R13L in RNA sequencing (RNA-seq) data
of LUAD (TCGA Lung Adenocarcinoma) and LUSC (TCGA Lung Squamous
Cell Carcinoma) cohorts were downloaded from TCGA data portal
(https://cancerge-nome.nih.gov/).
Clinical parameters of the LUAD and LUSC cohorts were also
downloaded from TCGA database. A total of 60 cases of LUAD and 51
cases of LUSC with matched cancer and adjacent normal tissues were
screened. The adjacent normal tissues were defined as specimens
collected at a distance that was >2 cm from the tumor margin. A
heatmap of the expression levels of exons in the cancer tissue and
its adjacent normal control were generated by the heatmap package
in R (version 3.3.3; www.r-project.org).
Alternative splicing event analysis
The web-based resource TCGA SpliceSeq (http://bioinformatics.mdanderson.org/TCGASpliceSeq)
was used, which provides a quick and highly visual interface for
exploring the alternative splicing patterns of TCGA tumors. Percent
Spliced In (PSI) is a common intuitive ratio for quantifying
splicing events and has a value between 0 and 1 (26). The PSI value was calculated for
seven types of alternative splicing events, as follows: Exon
skipping, mutually exclusive exons, intron retention, alternative
promoter, alternative terminator, alternative donor site and
alternative acceptor site. The average PSI values of splice events
in ERCC1, CD3EAP and PPP1R13L on the samples
included in the LUAD and LUSC cohorts were loaded into TCGA
SpliceSeq and filtered by 10% minor splice expression.
Correlation analysis of exon
expression
The exon expression RNA-seq data in TCGA LUAD and
LUSC cohorts were obtained from the cBioPortal cancer genomic data
website (http://www.cbioportal.org/) (27,28).
To analyze the correlation patterns of exons in ERCC1,
CD3EAP and PPP1R13L expression, the Spearman’s
correlation coefficient of each exon pair was calculated using the
corrplot package in R (version 3.3.3).
Tumor tissue sample collection
In the present study, tumor tissues were collected
from 15 Chinese Han patients with pathologically proven primary
NSCLC without other active malignant diseases. The age range of the
patients was between 43–76 years of age, and there were 9 male
patients and 6 female patients; the clinical staging was based on
the latest TNM staging criteria in 2017 (29). These patients were treated between
October 2013 and November 2013 at the First Affiliated Hospital of
China Medical University (Shenyang, China). Informed consent was
obtained from all patients, and the protocol was approved by the
Institutional Review Board of China Medical University prior to the
study. All activities involving human subjects were conducted under
full compliance with the government policies and the Declaration of
Helsinki. The tumor tissue specimens were frozen in liquid nitrogen
and stored at −80°C.
Cell culture and treatment
A549 cells were purchased from the Cell Bank of the
Shanghai Institute of Biochemistry and Cell Biology, Chinese
Academy of Sciences (Shanghai, China), and cultured in Dulbecco’s
modified Eagle’s medium/F-12 (HyClone; GE Healthcare Life Sciences,
Logan, UT, USA). The normal immortalized 16HBE cell line, kindly
provided by Professor Wen Chen (Sun Yat-Sen University, Guangzhou,
China), was cultured in minimum essential medium (HyClone; GE
Healthcare Life Sciences). The two cell lines were supplemented
with 10% fetal bovine serum (HyClone; GE Healthcare Life Sciences)
and maintained at 37°C and 5% CO2 in a humidified
incubator. Logarithmic growth phase cells were treated with 4
μg/ml cis-diaminedichloroplatinum (CDDP; Tokyo Chemical
Industry Co., Ltd., Tokyo, Japan) according to the requirements of
each experiment.
RNA preparation
Total RNA was extracted from the treated cells and
tissues, using TRIzol reagent (Invitrogen; Thermo Fisher
Scientific, Inc., Waltham, MA, USA), and RNA integrity was assessed
using an Agilent 2100 bioanalyzer (Agilent Technologies, Inc.,
Santa Clara, CA, USA). The RNA concentrations were determined by
measuring the absorbance at 260 nm using a NanoDrop 2000 device
(Thermo Fisher Scientific, Inc.), and the quality control standard
was set to an A260/A280 ratio of 1.8–2.1. Extracted total RNA was
cryopreserved at under −80°C and prepared for subsequent
experiments.
Quantitative polymerase chain reaction
(qPCR) assay
A total of 1 μg RNA was reverse transcribed
with M-MLV Reverse Transcriptase (Takara 047A; Takara Bio, Inc.,
Otsu, Japan). The primers used in qPCR were designed at our
laboratory, and a BLAST search (https://blast.ncbi.nlm.nih.gov/Blast.cgi) was
performed against GenBank to ensure that all primers were unique to
the gene of interest. The sequences of the qPCR primers used in the
present study are listed in Table
I. Quantitative analysis was performed using the LightCycler
480 II instrument (Roche Diagnostics, Indianapolis, IN, USA), and
the PCR reactions were performed with SYBR Premix Ex Taq II (Takara
Bio, Inc.). The PCR cycling conditions were as follows:
Denaturation at 95°C for 30 sec, followed by 40 cycles of 95°C for
5 sec, 60°C for 20 sec. The results were quantified using the
2−ΔΔCq method (30). In
all qPCR experiments, the data were normalized to the expression of
the human GAPDH housekeeping gene. Three independent RNA
preparations were tested for each sample, and each reaction was
performed in triplicate.
 | Table IPrimer sequences of quantitative
3′RACE and PCR. |
Table I
Primer sequences of quantitative
3′RACE and PCR.
A, 3′RACE
|
|---|
| Amplification
position | Outer (5′-3′) | Inner (5′-3′) | Distance from the
terminating | Transcription name
site of the transcript (bp) |
|---|
| Exon 11.2 of
ERCC1 |
AACCACATCCCAGGCTGACCAC |
GGTCGTGGATAACACCAATAGC | ERCC1-202 | 189 |
| Exon 11.1 of
ERCC1 |
GAGCCCTTCTTGAAAGTACCCTG |
CCCAGTGTAATAATAAATCGTCCTCC | ERCC1-208 | 33 |
| Exon 10.2 of
ERCC1 |
GAGAGAGCCCCAAATAAACACAACC |
AAGGCGGGAGGACTGCTTGAGG | ERCC1-201 | 144 |
| Exon 3.3 of
CD3EAP |
ATCCACCTGCCTTGACCTCCCA |
CCAGGAACTATCCATCCACTCT | CD3EAP-201 | 107 |
| Exon 3.2 of
CD3EAP |
GGAAGAAGCAGAGTCAGGAAAGCCG |
GGAGGACGATTTATTATTACACTGGG | CD3EAP-202 | 211 |
| Exon 3.1 of
CD3EAP |
GGCGGCATGTGCCTCTCTCT |
CTGCTCACCTCAGGGAAGAAGAAAA |
CD3EAP-203/C202 | 104/1339 |
| Exon 14 of
PPP1R13L |
TTAGTAATCTGCCTTAGCCTTGGGA |
TCTGGGTGGGAAACATTGGTCTCTA | PPP1R13L-201 | 142 |
B, qPCR
|
|---|
| Primer name | Amplification
position | Sense (5′-3′) | Antisense
(5′-3′) |
|---|
| E8-10 | Exon 8-10 of
ERCC1 |
TGGAGAAGCTAGAGCAGGACTTC |
GCATAAGGCCAGATCTTCTCTTG |
| E11.2 | Exon 11.2 of
ERCC1 |
TGTCCAAATGTCCTAAGAATGCAG |
CTCACTAAAGGTAGGGGCTATTGGT |
| C2-3 | Exon 2-3 of
CD3EAP |
TTCTCCTTGGAGGCGCTGA |
CCTGCCAATTTGCCCTTGAC |
| C3.3 | Exon 3.3 of
CD3EAP |
CTGGGATTATAGGTGTGAGCCACT |
GAGGCAGGAGAATCGTTGGA |
| P1 | Exon 1 of
PPP1R13L |
GGACGGTCGATTGGTCTGAAATTCTT |
CTGCTTGGTCAGTTCATCCA |
| P2 | Exon 2 of
PPP1R13L |
GGAGGAAGCCCCCAGGTGCCAGGAT |
CTGCTTGGTCAGTTCATCCA |
| P5-6 | Exon 5-6 of
PPP1R13L |
CGCAGACAGCGAGCTATGAA |
CTCTCCCTCCAAGGCAACA |
| P14 | Exon 14 of
PPP1R13L |
TTAGTAATCTGCCTTAGCCTTGGGA |
GGTTTCCTGTCCCCAGTGATTTCCA |
| GAPDH | Glyceraldehyde
3-phosphate dehydrogenase |
TGTTGCCATCAATGACCCCTT |
CTCCACGACGTACTCAGCG |
Affymetrix GeneChip
Total RNA from A549 and 16HBE cells were hybridized
with Affymetrix Human Transcriptome Assay 2.0 (Affymetrix, Santa
Clara, CA, USA), accordance with the manufacturer’s protocol. All
detection sevice were performed by OE Biotech’s (Shanghai, China).
Briefly, the raw data were normalized at the exon level and
filtered using Expression Console (version 1.3.1; Affymetrix) by
applying the Robust Multi-array Average algorithm. Alternative
splice analysis was conducted by Transcriptome Analysis Console
(version 1.0; Affymetrix). Differential exon or junction identified
through splicing index as well as P-value calculated with One-Way
Between-Subject ANOVA (Unpaired). The threshold was splicing index
≥2.0 or ≤−2.0. The splice index was defined as the expression of
the exon normalized to the expression of the entire gene. Signal
intensity of the Probe Selection Region (PSR) equations use
log2 scale data. The score for the isoform was defined
as the sum of the PSR scores [see Transcriptome Analysis
Console(TAC)3.1 UserGuide].
3′ Rapid amplification of cDNA ends
(3′RACE) analysis
Based on the structures of the previously described
mRNAs (Fig. 1A), primers were
designed to clone the termination region sequence of different
isoforms (Table I). For 3′RACE
experiments, a first reverse transcription step was performed using
3′-Full RACE Core Set version 2.0 (Takara D314; Takara Bio, Inc.).
Amplification was then performed by two rounds of PCR. The first
round was performed with a gene-specific primer from outer and the
outer adaptor primer used in 3′RACE experiments, while a nested
primer and the inner adaptor primer for 3′RACE were used in the
second reaction. Gel analysis and sequencing of certain PCR
products confirmed the gene specific product amplification.
Statistical analysis
Data analysis to determine the statistical
significance and correlation coefficient were performed using R
software (version 2.13.2). Differences in the splicing index of the
lung cancer and adjacent normal tissues are depicted as the median
values, and PCR data are expressed as the mean ± standard
deviation. Statistical analysis was performed with IBM SPSS
(version 20.0; IBM Corp., Armonk, NY, USA) and GraphPad Prism
software (version 5.0; GraphPad Software, Inc., San Diego, CA,
USA). Comparative analysis was conducted by independent samples
t-test to determine the significance of differences between groups.
A statistically significant difference was considered to be
indicated by a P-value of <0.05.
Results
Structural characteristics of
19q13.2-3
Overlapping genes appeared to be closely arranged,
which may result in the property of signal transitivity. There was
direct evidence that CD3EAP and PPP1R13L share the
same first exon transcriptional domain, while the transcription
termination site of ERCC1 is adjacent to a conjunct
transcription start sites of CD3EAP and PPP1R13L.
Peaks of H3K27 acetylation, H3K4 trimethylation and CpG islands
were identified near the first exon of CD3EAP and
PPP1R13L, while these peaks were adjacent to the terminal
exon of ERCC1, histone modifications of H3K4me3 and H3K27ac
in the CpG island region are often found near active regulatory
elements and is conducive to DNA unwinds the double helix (Fig. 1A). Co-expression genes are often
functionally associated; in the present study, bioinformatics
analysis of protein networks revealed that both CD3EAP and ERCC1
bind to TATA box binding protein (TBP). In addition, PPP1R13L was
observed to be indirectly associated with TBP through p53 or SP1
(Fig. 1B).
Differentially expressed exons in normal
and tumor tissues
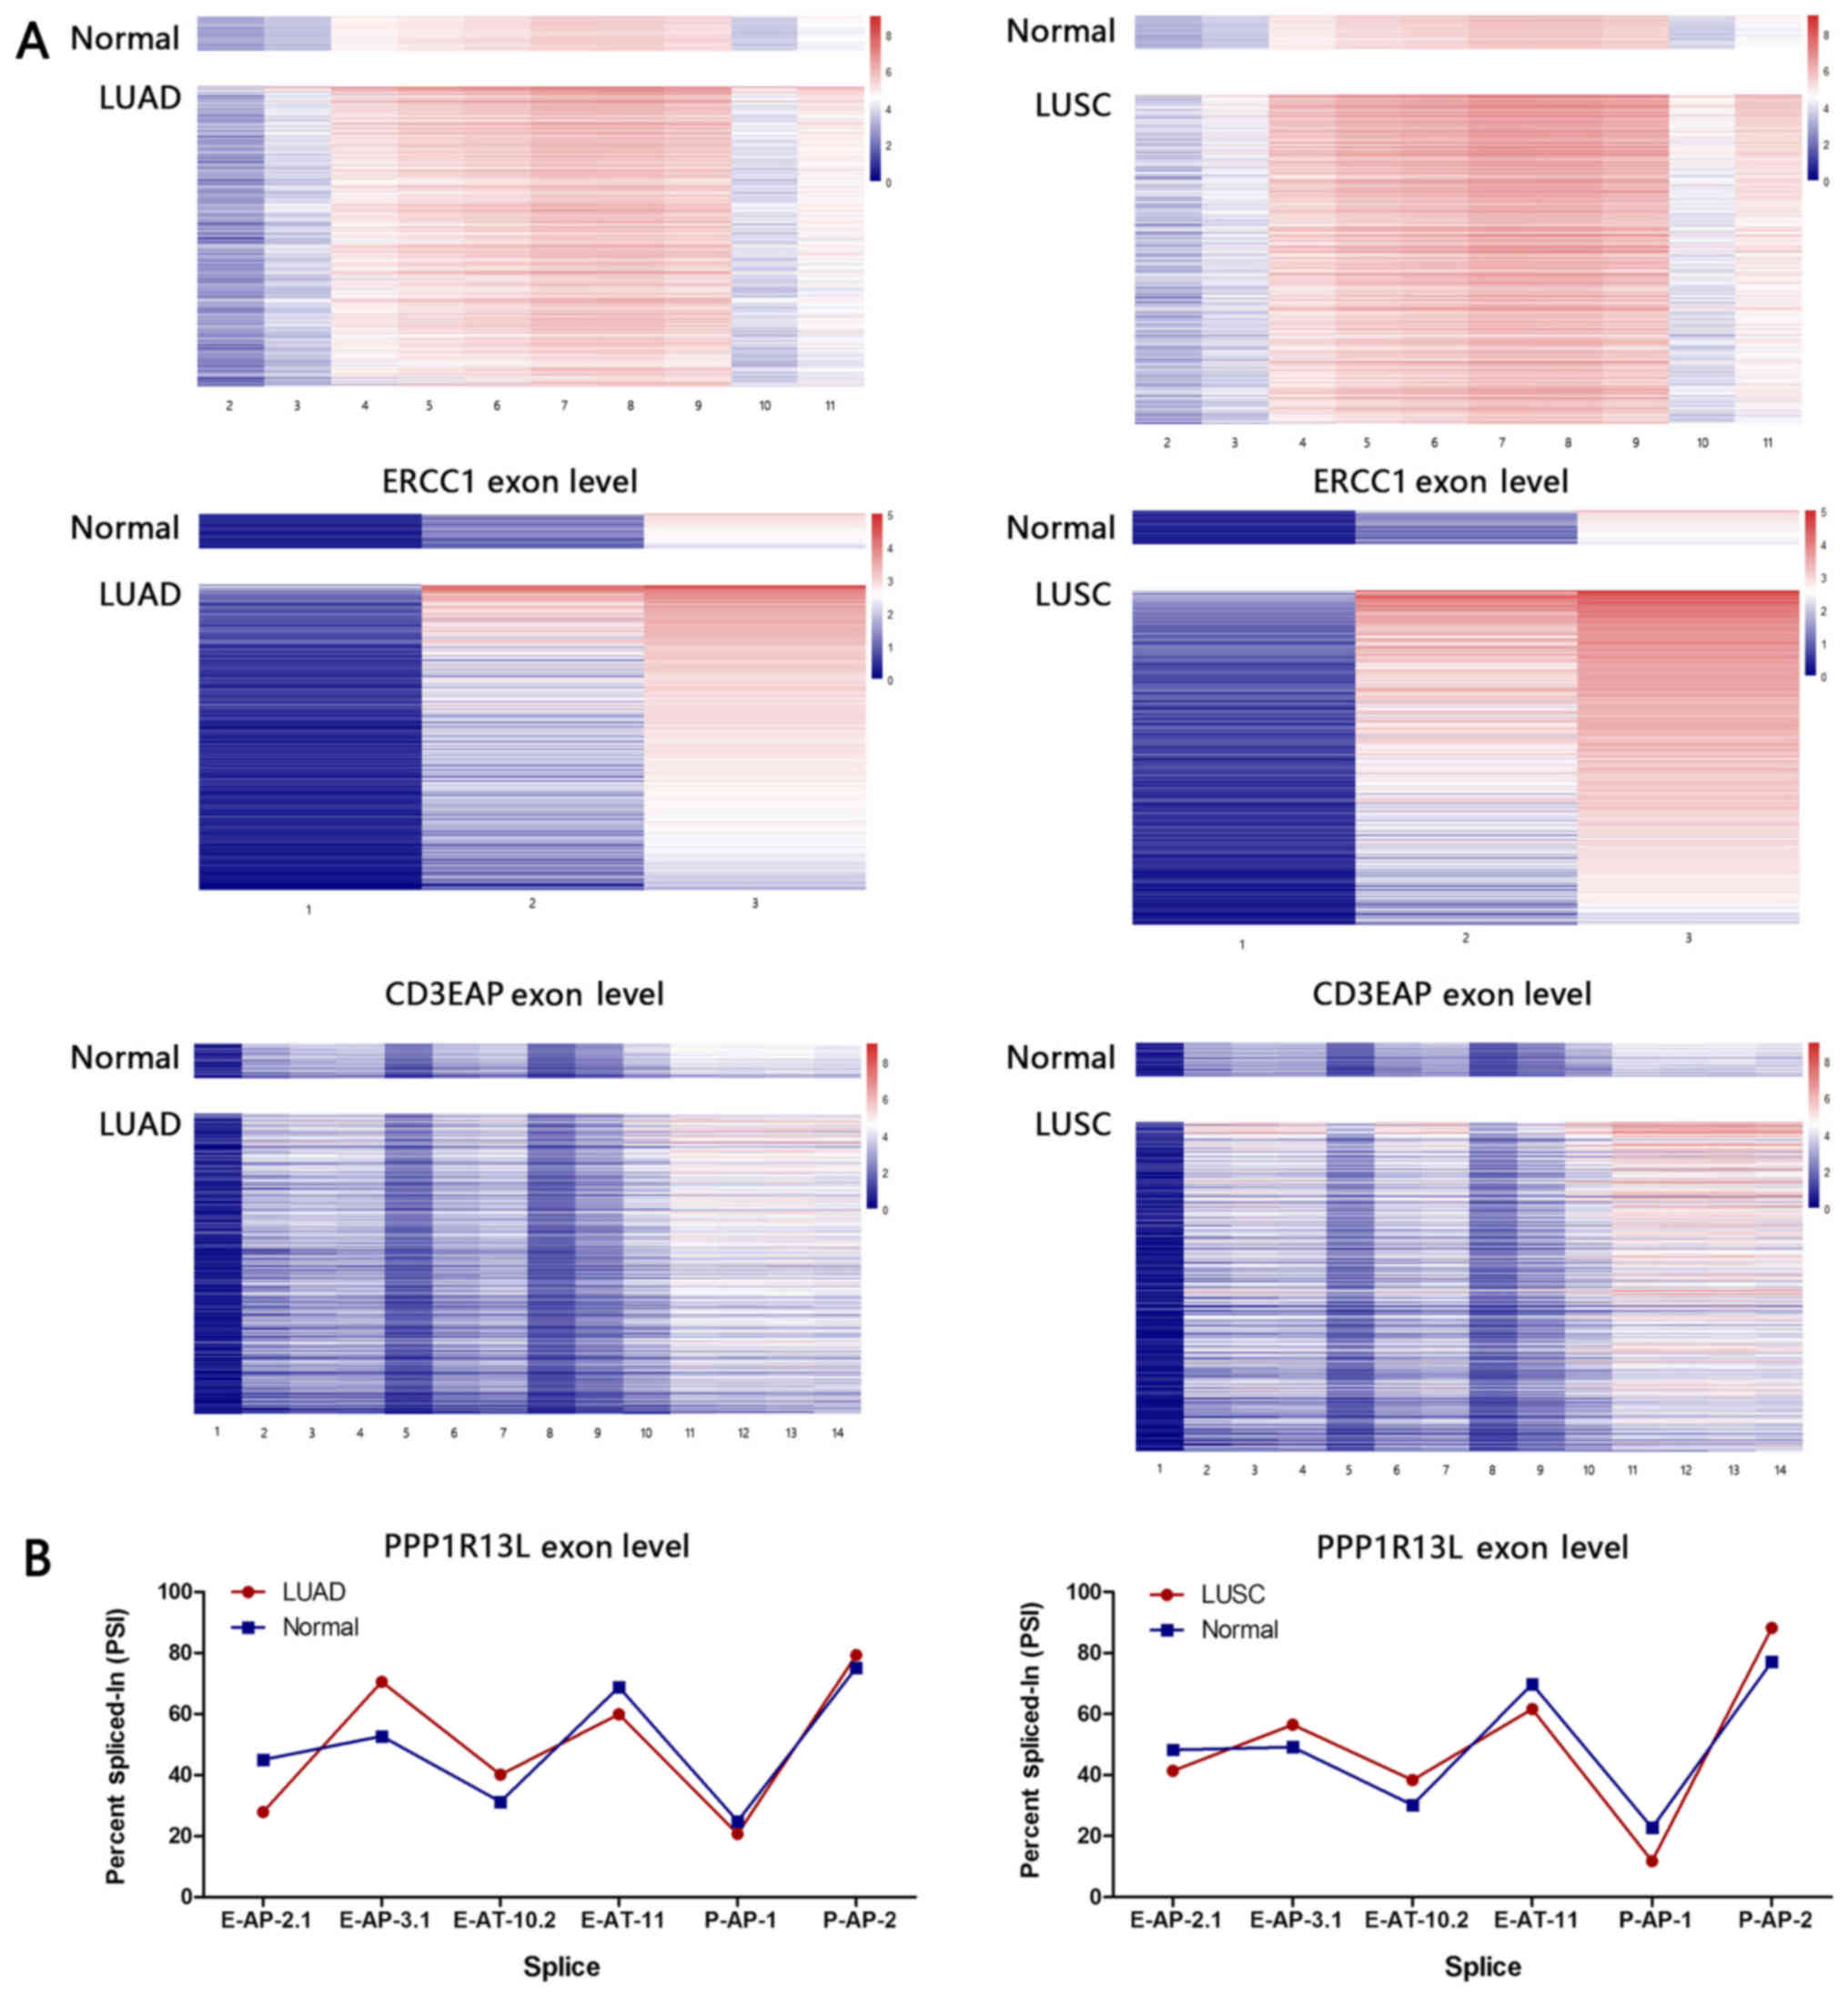
In order to precisely depict the expression
correlation between ERCC1, CD3EAP and
PPP1R13L, differential expression analysis of exon
resolution in tumor and adjacent normal tissues was performed. The
expression of the majority of exons varied between lung cancer
tissue and the adjacent normal tissue, and marked differences were
observed in 11 exons of the ERCC1 gene (E11) and the 2-3 exons of
CD3EAP gene (C2-3). In tumor tissues, the differential
expression of exons in a single gene were stronger compared with
that in adjacent normal tissues, which further suggests that the
tumor tissue preferentially expresses a single alternative splicing
isoform. According to the order of CD3EAP gene expression
levels from low levels to high levels, P1 exhibited a similar trend
to C1, E11 and C3 are similar (Fig.
2A).
Analysis of alternative splice
events
Compared with the normal tissue, the PSI value of
E-AT-11 decreased and that of E-AT-10.2 increased in LUAD and LUSC
tissues. The alternative promoter and alternative terminator of
ERCC1 converge to the gene center, indicating that
ERCC1 can express a shorter transcript in lung cancer
tissues (Fig. 2B). It should be
noted that we only focused on overlapping genetic regions.
Transcription-associated analysis of gene
and exon levels
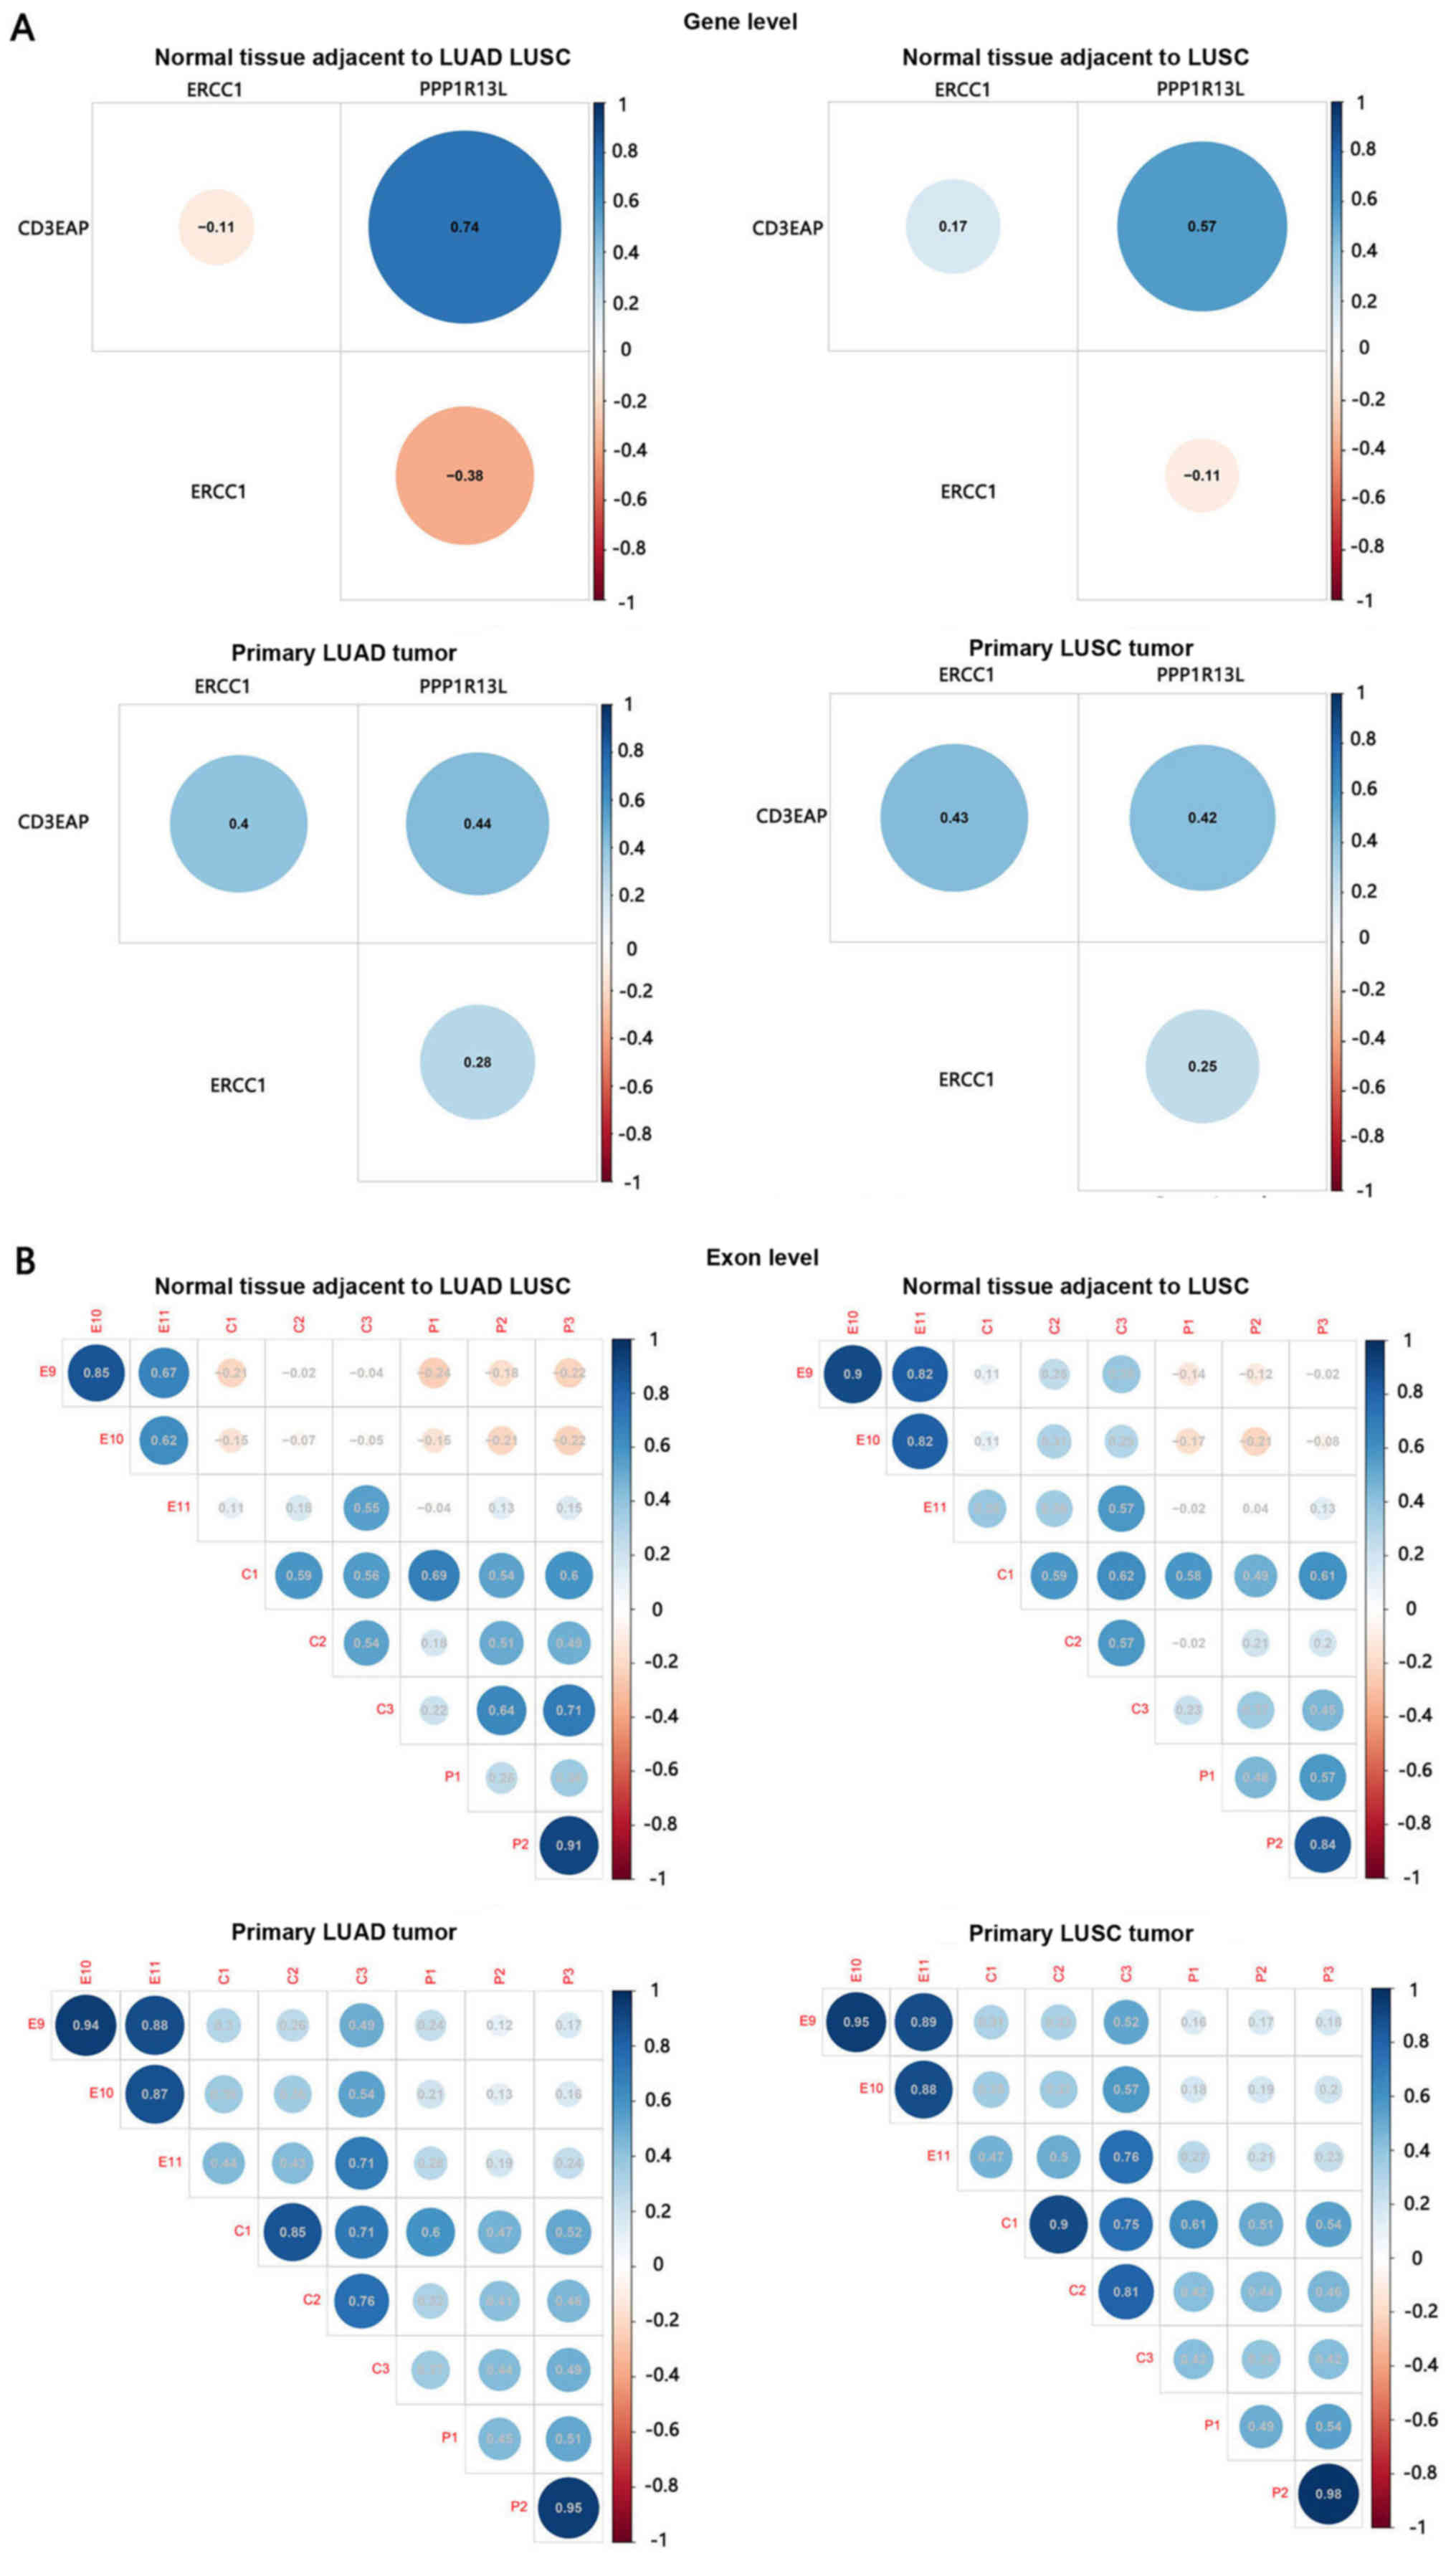
At the gene level, CD3EAP was significantly
positively correlated with PPP1R13L in normal (P<0.01)
and tumor tissues (P<0.01) (Fig.
3A). Negative and/or weak correlation was detected between
CD3EAP and ERCC1 in normal tissues. Whereas in tumor
tissues, CD3EAP was significantly positively correlated with
ERCC1 (P<0.01), meanwhile ERCC1 was significantly
positively correlated with PPP1R13L (P<0.01). In
addition, ERCC1 was negatively correlated with
PPP1R13L in normal tissues, whereas these genes exhibited
weakly positive correlations in tumor tissues, but the correlation
was not significant (P>0.05).
At the exon level, there was a significant positive
correlation between the exon pairs with overlapping positions. C1
was significantly associated with P1 (P<0.01), while C3 was
significantly associated with E11 in normal and tumor tissues
(P<0.01) (Fig. 3B). The pattern
was defined as a collection of exons with similar expression
behaviors and indicated that there are certain co-expression
patterns of those overlapping genes in the 19q13.3 region. We only
focused on exons in the overlapping region.
qPCR validation in NSCLC tissue
samples
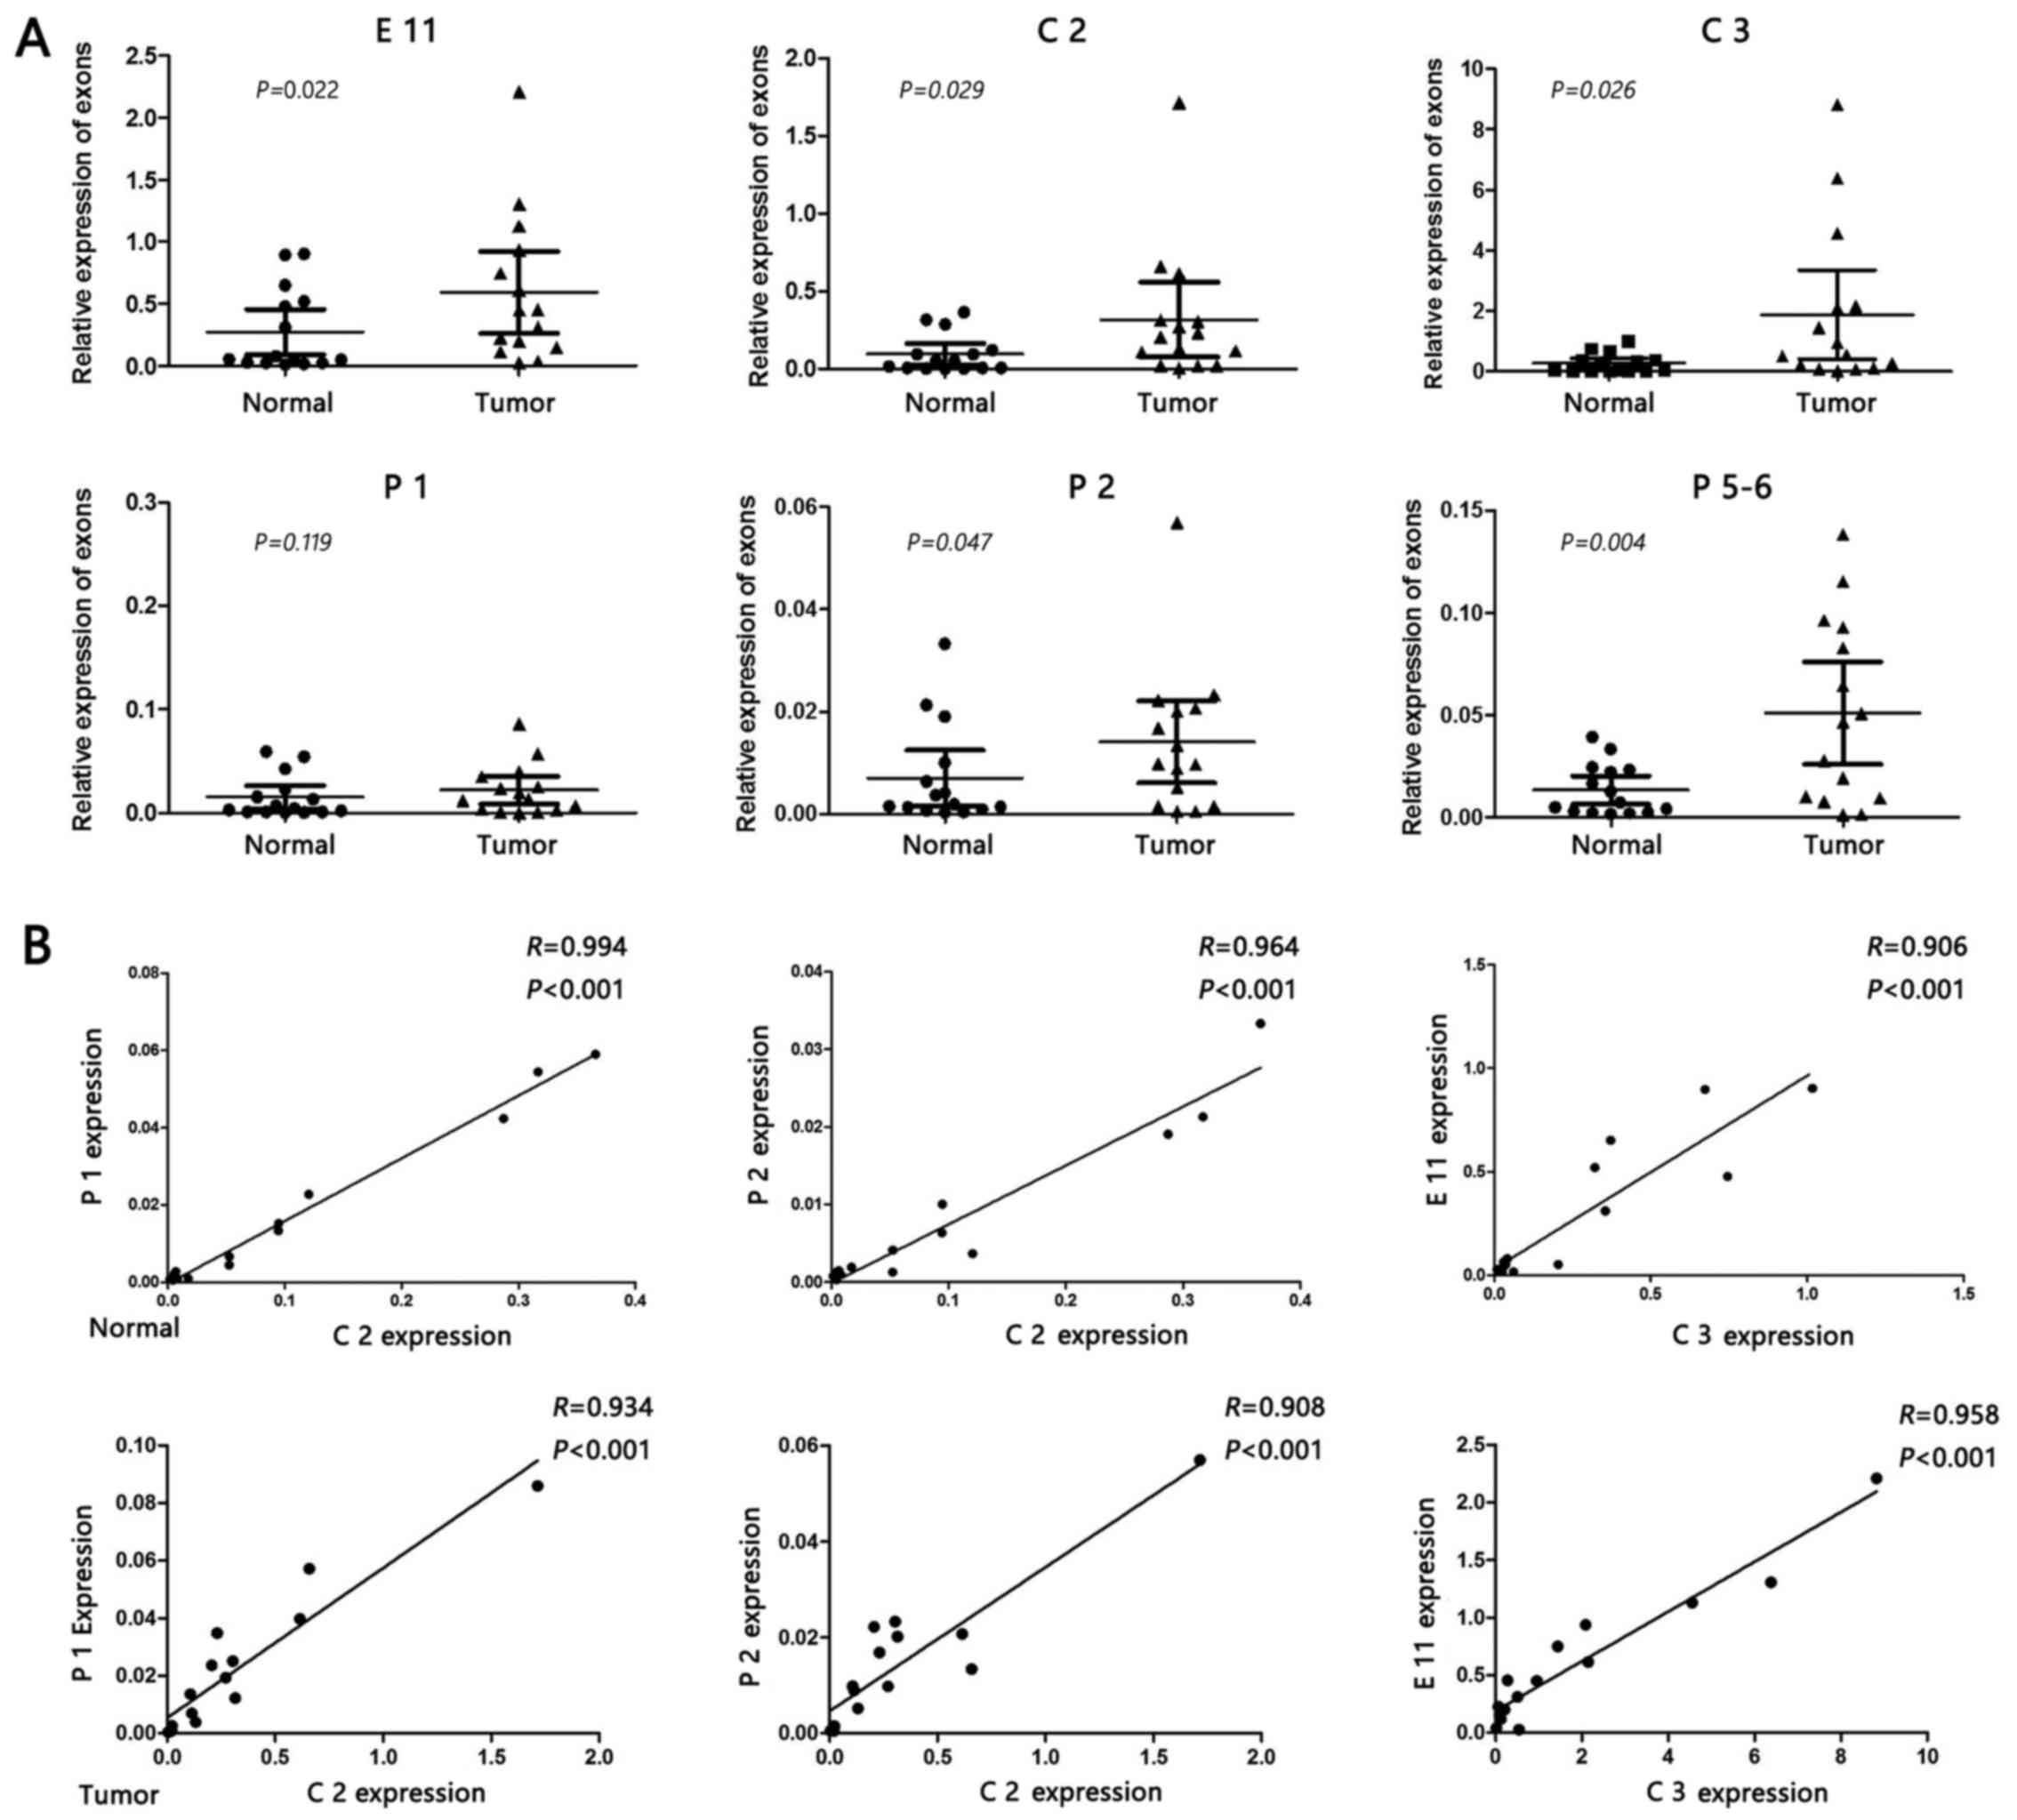
In order to validate the results of bioinformatics
analysis, the mRNA expression levels of ERCC1, CD3EAP
and PPP1R13L were compared in lung tumor tissues of 15
patients by Spearman rank correlation analysis. Compared with the
adjacent normal tissue, the expression levels of characteristic
exons in cancer tissues were increased. C2 was significantly
associated with P1 and P2, while C3 and E11 expression levels also
exhibited a close positive correlation (Fig. 4).
Quantitative change of alternative
splicing isoforms
The exon or construct abundances were described
using the Human Transcriptome Assay (Fig. 5A). To facilitate the experimental
validations, several Affymetrix transcript isoforms with different
architectural features were finally selected. Compared with the
control, the short transcript containing E2-10 was upregulated by
3.28-fold in A549 cells after cisplatin treatment, whereas it was
downregulated by 2.55-fold in 16HBE cells. The full-length
transcript containing E 1-11 was mainly expressed in 16HBE cells,
where it was upregulated by 5.24-fold. These transcripts containing
C1 were downregulated in A549 cells and upregulated in 16HBE cells.
The posterior segments of the PPP1R13L gene containing exons
9 to 14 was upregulated in A549 cells (isoform score=3.49). By
contrast, the full-length transcript containing P1-14 was
upregulated in 16HBE cells. These results indicated that the short
transcripts of ERCC1 (exons 2-10), CD3EAP (exons 2-3)
and PPP1R13L (exons 9-14) are co-expressed in A549 cells.
The full-length transcripts of ERCC1, CD3EAP and
PPP1R13L genes are co-expressed in 16HBE cells.
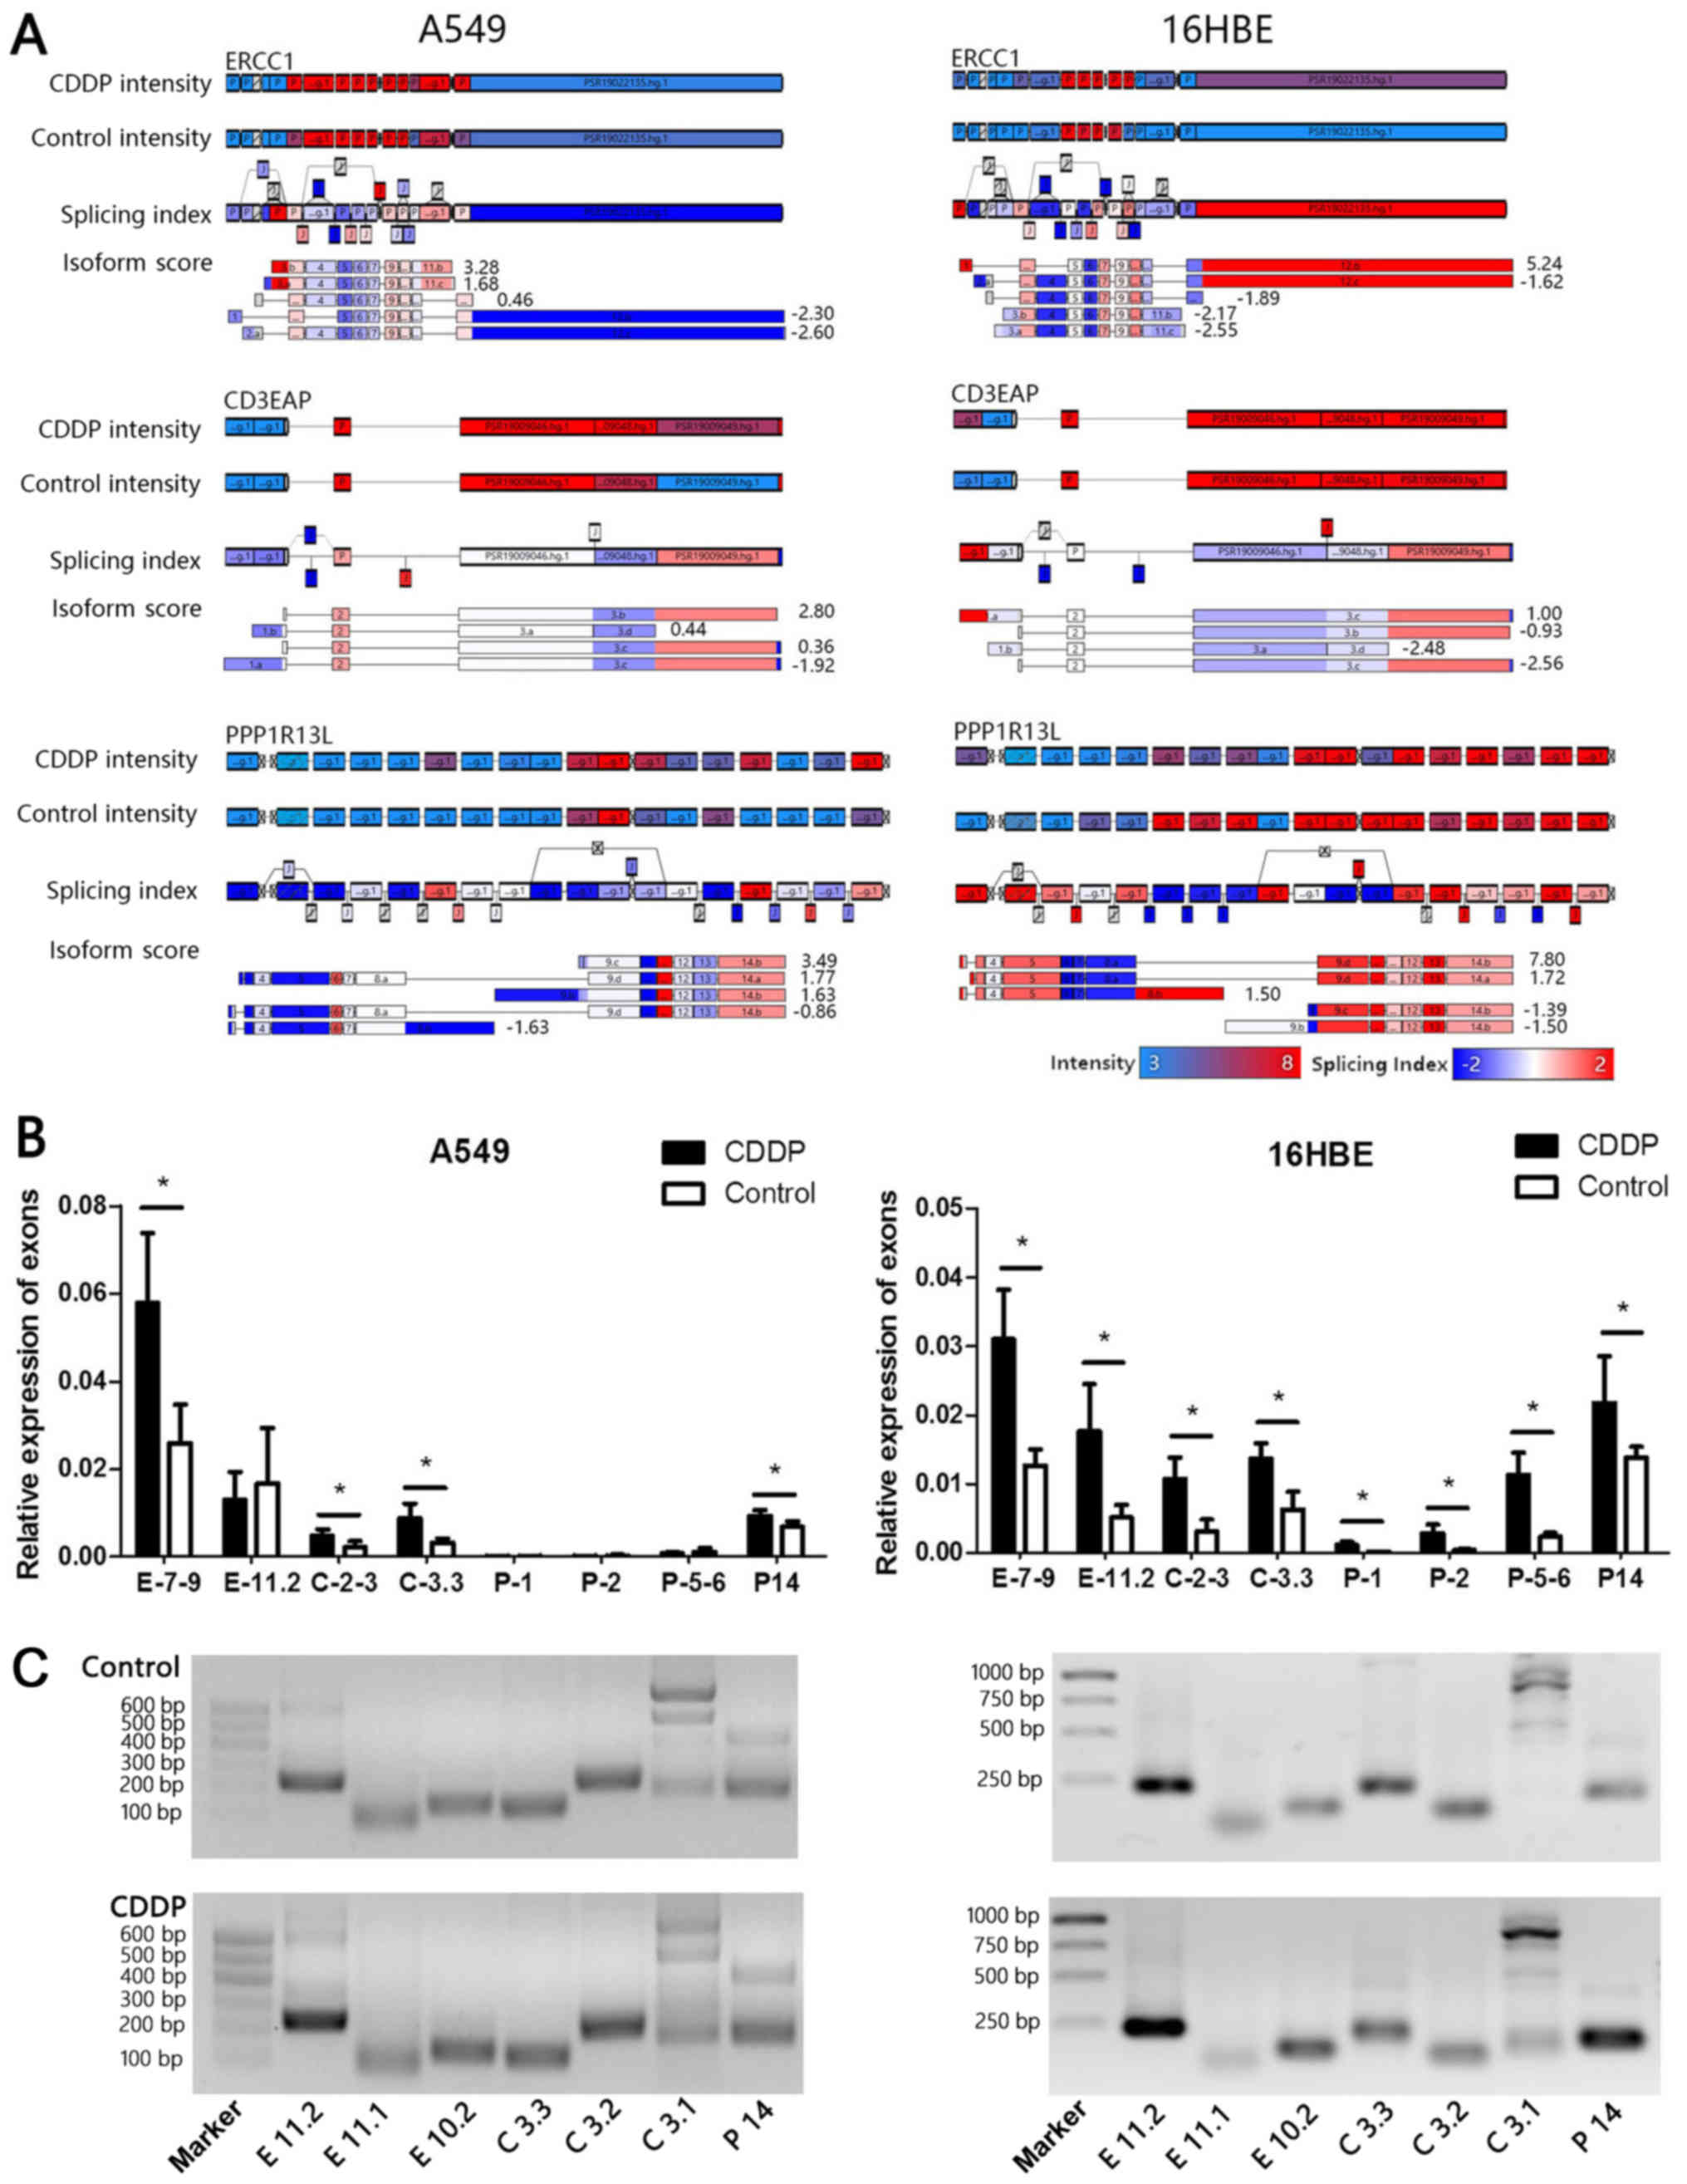 | Figure 5Affymetrix transcriptome microarray
analysis and polymerase chain reaction verification. (A) The
transcript levels of two cell lines in the CDDP group was compared
with the control group, and almost 90% of all exons in
ERCC1, CD3EAP and PPP1R13L were detected. The
exon or construct intensity signals were concentrated in the range
of 3-8 (log2-transformed Probe Selection Region
intensity value), while the range of the Splicing Index of the
exons compared with the control was between -2 and 2 (from blue to
red, respectively). (B) Quantification of specific exon expression
changes following treatment with 4 μg/ml CDDP. Data were
normalized for equal loading. The x-axis shows the name of the exon
specific primer. Values are expressed as the mean ± standard
deviation. *P<0.05. (C) Identification of
transcription termination sites. The products of the 3′RACE
reactions were separated on 2% agarose gels and visualized by
ethidium bromide staining. Lane 1 is the 100 bp DNA ladder, and the
marker fragment sizes were approximately 100, 200, 300, 400, 500
and 600 bp. Labels under the lanes represent different groups of
3′RACE primers. The expected bands were obtained in the 3′RACE
inner reaction, revealing the presence of transcription termination
sites of ERCC1, CD3EAP and PPP1R13L. CDDP, cis-diammineplatinum(II)
dichloride; ERCC1, excision repair cross-complementation group 1;
CD3EAP, CD3e molecule associated protein; PPP1E13L, protein
phosphatase 1 regulatory subunit 13 like; 3′RACE, 3′ rapid
amplification of cDNA ends. |
Relative quantification of the
co-expression transcript and 3′RACE identification
The co-expression characteristics of exons or
constructs were verified by qPCR, which demonstrated that these
clones were indeed differentially expressed. The expression of
ERCC1 3′UTR was invariant in A549 cells, and the
downregulation of the relative isoform score was mainly attributed
to the high expression of the short transcript, while the
expression levels of downstream genes CD3EAP and
PPP1R13L were slightly increased. The expression of
ERCC1 3′UTR was significantly increased in 16HBE cells, and
simultaneously, the expression levels of downstream genes
CD3EAP and PPP1R13L were enhanced, consistent with
the cDNA microarray results (Fig.
4B). 3′RACE-PCR was used for further investigation, to
determine the transcription termination sites of human
ERCC1, CD3EAP and PPP1R13L. Referring to the
transcript informations of the Ensembl database, the expected bands
listed in Table I were obtained in
the 3′RACE reaction, revealing the transcription termination sites
of ERCC1, CD3EAP and PPP1R13L (Fig. 5B).
Discussion
Epigenetic mechanisms that may be involved in the
development of cancer have attracted considerable research interest
(31). Abnormal DNA histone
modifications may be associated with aberrant gene expression
patterns. Peaks of H3K27 acetylation and H3K4 trimethylation, and a
CpG island were identified near the first exon of CD3EAP and
PPP1R13L, which are often identified near the active
regulatory elements, suggesting that CD3EAP and
PPP1R13L may initiate transcription from the same promoter.
In human cell lines, the pattern of histone H3K27 acetylation, H3K4
trimethylation and the CpG island suggests a single promoter, as a
universal chromatin modification at the transcription start site of
active genes and its levels reflect the amount of transcription and
exon splicing (32,33). Furthermore, shared epigenetic
modifications were observed to be a potential mechanism for gene
co-expression patterns (34),
which may additionally be used as cancer biomarkers for diagnostic
and prognostic purposes, as well as predictive markers of the
response to targeted therapies.
Alternative splicing, as an important process that
modifies mRNA isoforms, allows cells to generate a great number of
protein and mRNA isoforms with diverse functional and regulatory
properties. The plasticity of alternative splicing is often
exploited by cancer cells to produce isoform switches that promote
cancer cell survival, proliferation, metastasis and drug resistance
(35). Differential isoform
expression in human tumors correlates with the cancer progression
(36,37). Ensembl transcript databases
revealed multiple alternative spliceosomes of ERCC1,
CD3EAP and PPP1R13L gene. Unlike genomic data, such
as copy number variation, systematic analyses of alternative
splicing co-expression patterns and associated mechanisms are
currently lacking despite their important role in cancer. The
present study provided evidence that the different 3′UTR
termination sites enable ERCC1 gene not only to produce
different mRNAs, but also to release distinct sets of alternative
splicing interference signals to downstream genes CD3EAP and
PPP1R13L. Furthermore, the overlap region between
ERCC1, CD3EAP and PPP1R13L may be involved in
linking upstream and downstream genes, and may have potential
applications in cisplatin resistance in NSCLC, indicating a novel
transcription regulation pattern.
In multicellular organisms, cell death serves an
important role in the regulation and maintenance of homeostasis
(38,39). Cell death is a major mechanism for
the elimination of cells through DNA damage and organelle stress.
Apoptosis, the programmed cell death process that is most widely
studied and possibly best understood, is the antithesis of
proliferation; therefore, it has received attention as an
anticancer mechanism (40,41). The evasion of apoptosis is one of
the hallmarks of drug resistance. Clearly, in order for tumor cells
to ultimately produce an aggressive malignant tissue, they must
survive and may be required to evade apoptosis. The results of the
current study revealed that ERCC1 3′UTR was able to activate
the expression of downstream genes CD3EAP and
PPP1R13L. However, whether this co-expression pattern
affects the expression of PPP1R13L and further affects
apoptosis remains uncertain. The rationale here is that, if cell
death processes are activated by anticancer chemotherapies and
radiotherapies, it is possible to induce apoptosis through the
reversal of other cell death mechanisms (as some cells can escape
apoptosis and undergo necrosis, the cell death mechanisms needs to
be altered, in order for cells to undergo apoptosis, rather than
necrosis) and enhance the sensitivity of the tumor cells to the
chemotherapy. More targeted work in this area is required to verify
these mechanisms in lung cancer, and more effective cancer
therapies that are applicable to a broad range of tumor types will
ultimately emerge as a result.
In conclusion, the present study demonstrated that
the expression of ERCC1-202 influences the transcription
levels of downstream genes, and plays a role in mechanisms
connecting the transcription pattern of three genes, the formation
of overall expression patterns produced by the special spatial
associations, and in the realization of their respective functions
of the network cooperative genes. ERCC1-202 activates the
expression of the PPP1R13L gene, further affecting the
apoptosis function mediated by p53 and affecting the mode of cell
death.
Acknowledgments
The authors are particularly grateful to Professor
Chen Wen of Sun Yat-sen University, Guangzhou, China for providing
the 16HBE cell line.
Funding
This study was supported by the National Natural
Science Foundation of China (grant nos. 81773470 and 81273118).
Availability of data and materials
All data generated or analyzed during this study are
included in this published article.
Authors’ contributions
GZ and PX provided the study concept and design and
drafted the manuscript, performed all the analyses and interpreted
the data of these results. SC collected the clinical samples and
confirmed the pathological diagnosis and critically revised the
manuscript. TY, MX and QZ performed the cellular experiments and
critically revised the manuscript. YC, CJ, JY and SW coordinated
the data collection. XL was involved in drafting the manuscript and
revising it critically for important intellectual content, and
provided final approval for the submission. The final version of
the manuscript has been read and approved by all authors.
Ethics approval and consent to
participate
Informed consent was obtained from all patients, and
the protocol was approved by the Institutional Review Board of
China Medical University prior to the study. All activities
involving human subjects were conducted under full compliance with
the government policies and the Declaration of Helsinki.
Consent for publication
Not applicable.
Competing interests
The authors declare that they have no competing
interests.
References
|
1
|
Oberg M, Jaakkola MS, Woodward A, Peruga A
and Prüss-Ustün A: Worldwide burden of disease from exposure to
second-hand smoke: A retrospective analysis of data from 192
countries. Lancet. 377:139–146. 2011. View Article : Google Scholar
|
|
2
|
Chen W, Zheng R, Zeng H and Zhang S: The
incidence and mortality of major cancers in China, 2012. Chin J
Cancer. 35:732016. View Article : Google Scholar
|
|
3
|
Torre LA, Bray F, Siegel RL, Ferlay J,
Lortet-Tieulent J and Jemal A: Global cancer statistics, 2012. CA
Cancer J Clin. 65:87–108. 2015. View Article : Google Scholar
|
|
4
|
Pignon JP, Tribodet H, Scagliotti GV,
Douillard JY, Shepherd FA, Stephens RJ, Dunant A, Torri V, Rosell
R, Seymour L, et al LACE Collaborative Group: Lung adjuvant
cisplatin evaluation: A pooled analysis by the LACE Collaborative
Group. J Clin Oncol. 26:3552–3559. 2008. View Article : Google Scholar
|
|
5
|
Martin LP, Hamilton TC and Schilder RJ:
Platinum resistance: The role of DNA repair pathways. Clin Cancer
Res. 14:1291–1295. 2008. View Article : Google Scholar
|
|
6
|
de Boer J and Hoeijmakers JH: Nucleotide
excision repair and human syndromes. Carcinogenesis. 21:453–460.
2000. View Article : Google Scholar
|
|
7
|
van Duin M, de Wit J, Odijk H, Westerveld
A, Yasui A, Koken MH, Hoeijmakers JH and Bootsma D: Molecular
characterization of the human excision repair gene ERCC-1: cDNA
cloning and amino acid homology with the yeast DNA repair gene
RAD10. Cell. 44:913–923. 1986. View Article : Google Scholar
|
|
8
|
Bergstralh DT and Sekelsky J: Interstrand
crosslink repair: Can XPF-ERCC1 be let off the hook? Trends Genet.
24:70–76. 2008. View Article : Google Scholar
|
|
9
|
Wang Z and Burge CB: Splicing regulation:
From a parts list of regulatory elements to an integrated splicing
code. RNA. 14:802–813. 2008. View Article : Google Scholar
|
|
10
|
Wang ET, Sandberg R, Luo S, Khrebtukova I,
Zhang L, Mayr C, Kingsmore SF, Schroth GP and Burge CB: Alternative
isoform regulation in human tissue transcriptomes. Nature.
456:470–476. 2008. View Article : Google Scholar
|
|
11
|
Friboulet L, Olaussen KA, Pignon JP,
Shepherd FA, Tsao MS, Graziano S, Kratzke R, Douillard JY, Seymour
L, Pirker R, et al: ERCC1 isoform expression and DNA repair in
non-small-cell lung cancer. N Engl J Med. 368:1101–1110. 2013.
View Article : Google Scholar
|
|
12
|
Mayr C and Bartel DP: Widespread
shortening of 3′UTRs by alternative cleavage and polyadenylation
activates oncogenes in cancer cells. Cell. 138:673–684. 2009.
View Article : Google Scholar
|
|
13
|
Whitehead CM, Winkfein RJ, Fritzler MJ and
Rattner JB: ASE-1: A novel protein of the fibrillar centres of the
nucleolus and nucleolus organizer region of mitotic chromosomes.
Chromosoma. 106:493–502. 1997. View Article : Google Scholar
|
|
14
|
Yamamoto K, Yamamoto M, Hanada K, Nogi Y,
Matsuyama T and Muramatsu M: Multiple protein-protein interactions
by RNA polymerase I-associated factor PAF49 and role of PAF49 in
rRNA transcription. Mol Cell Biol. 24:6338–6349. 2004. View Article : Google Scholar
|
|
15
|
Bergamaschi D, Samuels Y, O’Neil NJ,
Trigiante G, Crook T, Hsieh JK, O’Connor DJ, Zhong S, Campargue I,
Tomlinson ML, et al: iASPP oncoprotein is a key inhibitor of p53
conserved from worm to human. Nat Genet. 33:162–167. 2003.
View Article : Google Scholar
|
|
16
|
Yang JP, Hori M, Sanda T and Okamoto T:
Identification of a novel inhibitor of nuclear factor-kappaB,
RelA-associated inhibitor. J Biol Chem. 274:15662–15670. 1999.
View Article : Google Scholar
|
|
17
|
Mattick JS: RNA regulation: A new
genetics? Nat Rev Genet. 5:316–323. 2004. View Article : Google Scholar
|
|
18
|
Krystal GW, Armstrong BC and Battey JF:
N-myc mRNA forms an RNA-RNA duplex with endogenous antisense
transcripts. Mol Cell Biol. 10:4180–4191. 1990. View Article : Google Scholar
|
|
19
|
Chen J, Sun M, Kent WJ, Huang X, Xie H,
Wang W, Zhou G, Shi RZ and Rowley JD: Over 20% of human transcripts
might form sense-antisense pairs. Nucleic Acids Res. 32:4812–4820.
2004. View Article : Google Scholar
|
|
20
|
Mihalich A, Reina M, Mangioni S, Ponti E,
Alberti L, Viganò P, Vignali M and Di Blasio AM: Different basic
fibroblast growth factor and fibroblast growth factor-antisense
expression in eutopic endometrial stromal cells derived from women
with and without endometriosis. J Clin Endocrinol Metab.
88:2853–2859. 2003. View Article : Google Scholar
|
|
21
|
Annilo T, Kepp K and Laan M: Natural
antisense transcript of natriuretic peptide precursor A (NPPA):
Structural organization and modulation of NPPA expression. BMC Mol
Biol. 10:812009. View Article : Google Scholar
|
|
22
|
Frith MC, Carninci P, Kai C, Kawai J,
Bailey TL, Hayashizaki Y and Mattick JS: Splicing bypasses 3′ end
formation signals to allow complex gene architectures. Gene.
403:188–193. 2007. View Article : Google Scholar
|
|
23
|
Tufarelli C, Stanley JA, Garrick D, Sharpe
JA, Ayyub H, Wood WG and Higgs DR: Transcription of antisense RNA
leading to gene silencing and methylation as a novel cause of human
genetic disease. Nat Genet. 34:157–165. 2003. View Article : Google Scholar
|
|
24
|
Proudfoot NJ, Furger A and Dye MJ:
Integrating mRNA processing with transcription. Cell. 108:501–512.
2002. View Article : Google Scholar
|
|
25
|
Karolchik D, Barber GP, Casper J, Clawson
H, Cline MS, Diekhans M, Dreszer TR, Fujita PA, Guruvadoo L,
Haeussler M, et al: The UCSC Genome Browser database: 2014 update.
Nucleic Acids Res. 42:D764–D770. 2014. View Article : Google Scholar
|
|
26
|
Ryan MC, Cleland J, Kim R, Wong WC and
Weinstein JN: SpliceSeq: A resource for analysis and visualization
of RNA-Seq data on alternative splicing and its functional impacts.
Bioinformatics. 28:2385–2387. 2012. View Article : Google Scholar
|
|
27
|
Cerami E, Gao J, Dogrusoz U, Gross BE,
Sumer SO, Aksoy BA, Jacobsen A, Byrne CJ, Heuer ML, Larsson E, et
al: The cBio cancer genomics portal: An open platform for exploring
multidimensional cancer genomics data. Cancer Discov. 2:401–404.
2012. View Article : Google Scholar
|
|
28
|
Gao J, Aksoy BA, Dogrusoz U, Dresdner G,
Gross B, Sumer SO, Sun Y, Jacobsen A, Sinha R, Larsson E, et al:
Integrative analysis of complex cancer genomics and clinical
profiles using the cBio-Portal. Sci Signal. 6:12013. View Article : Google Scholar
|
|
29
|
Chansky K, Detterbeck FC, Nicholson AG,
Rusch VW, Vallières E, Groome P, Kennedy C, Krasnik M, Peake M,
Shemanski L, et al IASLC Staging and Prognostic Factors Committee,
Advisory Boards, and Participating Institutions: The IASLC lung
cancer staging project: External validation of the revision of the
TNM stage groupings in the eighth edition of the TNM classification
of lung cancer. J Thorac Oncol. 12:1109–1121. 2017. View Article : Google Scholar
|
|
30
|
Livak KJ and Schmittgen TD: Analysis of
relative gene expression data using real-time quantitative PCR and
the 2(−Delta Delta C(T)) method. Methods. 25:402–408. 2001.
View Article : Google Scholar
|
|
31
|
Kaelin WG Jr and McKnight SL: Influence of
metabolism on epigenetics and disease. Cell. 153:56–69. 2013.
View Article : Google Scholar
|
|
32
|
Benayoun BA, Pollina EA, Ucar D, Mahmoudi
S, Karra K, Wong ED, Devarajan K, Daugherty AC, Kundaje AB, Mancini
E, et al: H3K4me3 breadth is linked to cell identity and
transcriptional consistency. Cell. 158:673–688. 2014. View Article : Google Scholar
|
|
33
|
Ramakrishnan S, Pokhrel S, Palani S,
Pflueger C, Parnell TJ, Cairns BR, Bhaskara S and Chandrasekharan
MB: Counteracting H3K4 methylation modulators Set1 and Jhd2
co-regulate chromatin dynamics and gene transcription. Nat Commun.
7:119492016. View Article : Google Scholar
|
|
34
|
Strahl BD and Allis CD: The language of
covalent histone modifications. Nature. 403:41–45. 2000. View Article : Google Scholar
|
|
35
|
Salton M and Misteli T: Small molecule
modulators of Pre-mRNA splicing in cancer therapy. Trends Mol Med.
22:28–37. 2016. View Article : Google Scholar
|
|
36
|
Kim K, Jutooru I, Chadalapaka G, Johnson
G, Frank J, Burghardt R, Kim S and Safe S: HOTAIR is a negative
prognostic factor and exhibits pro-oncogenic activity in pancreatic
cancer. Oncogene. 32:1616–1625. 2013. View Article : Google Scholar
|
|
37
|
Luo JH, Ren B, Keryanov S, Tseng GC, Rao
UN, Monga SP, Strom S, Demetris AJ, Nalesnik M, Yu YP, et al:
Transcriptomic and genomic analysis of human hepatocellular
carcinomas and hepatoblastomas. Hepatology. 44:1012–1024. 2006.
View Article : Google Scholar
|
|
38
|
Hanahan D and Weinberg RA: The hallmarks
of cancer. Cell. 100:57–70. 2000. View Article : Google Scholar
|
|
39
|
Levine B and Kroemer G: Autophagy in the
pathogenesis of disease. Cell. 132:27–42. 2008. View Article : Google Scholar
|
|
40
|
Hanahan D and Weinberg RA: Hallmarks of
cancer: The next generation. Cell. 144:646–674. 2011. View Article : Google Scholar
|
|
41
|
Ouyang L, Shi Z, Zhao S, Wang FT, Zhou TT,
Liu B and Bao JK: Programmed cell death pathways in cancer: A
review of apoptosis, autophagy and programmed necrosis. Cell
Prolif. 45:487–498. 2012. View Article : Google Scholar
|