Introduction
The aryl hydrocarbon receptor (AHR) is a
ligand-activated transcription factor belonging to the family of
basic helix-loop-helix Per-Arnt-Sini transcription factors
(1,2). AHR is transcriptionally active in the
form of a heterodimer with the AHR nuclear translocator (ARNT),
which binds to xenobiotic responsive elements (1,2). AHR
was originally discovered through its binding to the
polychlorinated aromatic hydrocarbons such as
2,3,7,8-tetrachlorodibenzo-p-dioxin (TCDD), polycyclic
aromatase hydrocarbons, such as benzo[a] pyrene (B[a]P) and
polychlorinated biphenyls (PCBs) (1,2). In
recent years, many dietary compounds have been identified as AHR
agonists (3-7). AHR signaling, which is regulated
through various factors, may play a crucial role in the regulation
of diverse cellular and biological processes. The canonical target
genes for AHR are cytochrome P450 isoforms (CYP1A1, CYP1A2 and
CYP1B1), which are implicated in the metabolism of xenobiotics and
endogenous compounds, including eicosanoids (8). The AHR-dependent pathway is also
involved in the process of chemically-induced toxicity and
carcinogenesis through the production of free radicals and the
conversion of pro-carcinogens to ultimate genotoxic carcinogens via
metabolism by these enzymes (8,9).
Moreover, the xenobiotic and ligands of AHR are linked to various
toxicities and pathologies in humans, including cancer (10-16).
However, the molecular mechanisms responsible for the biological
effects induced by non-genotoxic AHR ligands are poorly understood,
and the mechanistic link between CYP induction and TCDD-mediated
hepatotoxicity or immunotoxicity is complex (17,18).
Of note, a previous study on AHR-null mice have demonstrated that
the AHR, in the absence of exogenous ligands, is involved in
several physiological processes (19). These investigations demonstrate a
pivotal role for AHR beyond xenobiotic metabolism (20).
The AHR interacts with signaling pathways,
controlling not only the cellular response to toxic and
carcinogenic compounds, but also physiological functions (21). The disorder of the fine homeostatic
regulations of cell proliferation and apoptosis may lead to toxic
processes, such as tumor promotion, immunosuppression and
teratogenicity. AHR activation may lead to either the stimulation
or inhibition of proliferation or apoptosis. The physiological
function of the AHR in the absence of exogenous ligand may differ
from its toxicological role after binding exogenous ligand. Mice
expressing constitutively active AHR exhibited an enhanced
development of liver tumors in a model of hepatocarcinogenesis
(22). On the contrary, the AHR
may also possess tumor suppressor activities in the liver (23). Notably, AHR deficiency exerts a
profound effect on the hepatic system; thus, AHR-null mice have a
reduced liver size and portal fibrosis (24-26).
Other studies have indicated that TCDD can partially impair liver
regeneration in mice following two-thirds partial hepatectomy
(27). AHR signaling may serve to
adjust liver repair and to block tumorigenesis by modulating
stem-like cells and β-catenin signaling (28). Moreover, the AHR has been
demonstrated to adjust liver regeneration after acute toxic injury
and protect against liver carcinogenesis (29). From these findings, it has been
proposed that non-toxic AHR agonists may be useful for preventing
the growth of liver tumors.
We hypothesized that AHR signaling may inhibit the
proliferation and stimulate the death of cancer cells, leading to
the suppression of tumor growth. These effects of AHR signaling are
not yet fully understood. The current study was thus undertaken to
determine the effects of TCDD, an agonist of AHR, on the
proliferation and death of human liver cancer HepG2 cells in
vitro. We demonstrate a novel finding that cell culture with
TCDD at comparatively low levels suppresses the proliferation and
stimulates the death of human liver cancer HepG2 cells in
vitro, and that these effects are mediated through mechanistic
pathways involved in AHR signaling activity and other related
signaling factors.
Materials and methods
Materials and reagents
TCDD (>99.99% purity; Dow Chemicals Co., Midland,
MI, USA) was dissolved in dimethylsulfoxide (DMSO) and stored in
the dark at −20°C until use. α-minimum essential medium (α-MEM;
with glutamine) and antibiotics [penicillin (10,000 U/ml) and
streptomycin (10,000 µg/ml); P/S] were purchased from Gibco
Life Technologies Corp. (Grand Island, NY, USA). Fetal bovine serum
(FBS) was obtained from Omega Scientific Inc. (Tarzana, CA, USA).
2-Methyl-2H-pyrazole-3-carboxylic acid
(2-methyl-4-o-tolylazo-phenyl)-amide (CH223191) was obtained
from Selleckchem Co. (Houston, TX, USA) and was dissolved in DMSO.
Tumor necrosis factor-α (TNF-α) was obtained from R&D Systems
(Minneapolis, MN, USA) and gemcytabine from Hospira, Inc. (Lake
Forest, IL, USA) and were diluted in phosphate-buffered saline
(PBS). Caspase-3 inhibitor (CAS 169332-60-9-Calbiochem), crystal
violet and all other reagents were purchased from Sigma-Aldrich
(St. Louis, MO, USA) unless otherwise specified.
Human liver cancer cells
We used human liver cancer HepG2 cells, which were
obtained from the American Type Culture Collection (ATCC,
Rockville, MD, USA). The HepG2 cell line was originally derived
from a 15-year-old child with primary hepatoblastoma (30). Although the HepG2 cells were not
derived from hepatocellular carcinoma (30), this cell line was reported to be
genetically the best model for hepatocellular carcinoma tumor
studies (31).
Colony formation assay
The HepG2 cells were seeded into 6-well dishes at a
density of 1×10³/well, and cultured in medium containing
10% FBS, 1% P/S and 1% fungizone under 5% CO2 at 37°C in
the presence of either the vehicle (1% DMSO) or TCDD (1 or 10 nM)
for 14 days, when visible clones formed on the plates (32). The dishes were washed with PBS (2
ml, 3 times) and fixed with methanol (0.5 ml/well) for 20 min at
room temperature, and then washed 3 times with PBS. Finally,
colonies were stained with 0.5% crystal violet for 30 min at room
temperature. The stained cells were washed 5 times with PBS (2 ml).
The plates were air-dried for 2 h at room temperature. The colonies
containing >50 cells were counted under a microscope (Nikon TMS,
Tokyo, Japan). Data were represented as the numbers of colonies per
well.
Crystal violet assay
Crystal violet is a basic dye, which stains cell
nuclei, and spectrophotometric reading of color intensity is an
indicator of DNA content, and cell number (33). For determining cell viability in
relation to the colony formation, proliferation and death of HepG2
cells, an adaptation of the crystal violet staining procedure was
applied, as follows: In the experiment for cell proliferation, the
cells (1×10⁵/ml per well) were seeded into 24-well
plates and cultured in α-MEM (containing 10% FBS, 1% P/S and 1%
fungizone) in the presence of either the vehicle (1% DMSO) or TCDD
(1 or 10 nM) for 3 days. In the experiment for cell death, the
cells (1×10⁵/ml per well) were seeded into 24-well
plates and cultured in α-MEM (containing 10% FBS, 1% P/S and 1%
fungizone) for 3 days to reach subconfluency. They were then
cultured for 24 h in the presence of either the vehicle (1% DMSO)
or TCDD (1 or 10 nM). The cells were washed with PBS and fixed with
methanol for 20 min at room temperature, and then washed 3 times
with PBS. Crystal violet solution (0.5%, in 20% methanol) was added
to the fixed cells for 30 min. Thereafter, the plates were immersed
in running tap water for 15 min. After the plates had dried, 300
µl 0.2% Triton X-100 (in distilled water) was added to each
well followed by incubation at room temperature for 90 min, and 100
µl of the liquid content subsequently transferred to 96-well
microtiter plates. The absorbance (OD) was read on an ELX800
Universal Microplate Reader (Bio-Tek Instruments Inc.) at a
wavelength of 570 nm. Triton X-100 (0.2% in distilled water) was
used as a blank. The results are presented as absorbance.
Cell proliferation assay
The HepG2 cells (1×10⁵/ml per well) were
cultured using a 24-well plate in α-MEM (containing 10% FBS, 1% P/S
and 1% fungizone) in the presence of either the vehicle (1% DMSO)
or TCDD (0.1–1,000 nM) under 5% CO2 and 37°C for 1-7
days (34). In separate
experiments, the cells (1×10⁵/ml per well) were cultured
α-MEM containing 10% FBS, 1% P/S and 1% fungizone with or without
TCDD (1 or 10 nM) in the presence of either the vehicle (1% DMSO),
CH223191 (1 or 10 µM), TNF-α (0.1 or 1 ng/ml), or
gemcitabine (0.1, 1 or 10 nM) for 3 days. The cells were then
detached from each culture dish to determine the cell number as
described below in the section 'Cell counting'.
Cell death assay
The HepG2 cells (1×10⁵/ml per well) were
cultured using a 24-well plate in α-MEM (containing 10% FBS, 1%
P/S, and 1% fungizone) in the absence of TCDD for 3 days. On
reaching subconfluence, the cells were cultured in the presence of
either the vehicle (1% DMSO) or TCDD (0.1–1,000 nM), with or
without the caspase-3 inhibitor (10 µM), CH223191 (1 or 10
µM), TNF-α (0.1 or 1 ng/ml), or gemcitabine (0.1, 1 or 10
nM) for 24 or 48 h (35). The
cells were then detached from each culture dish to determine the
cell number as described below in the section 'Cell counting'.
Cell counting
To detach cells in each well, the culture dishes
were incubated for 2 min at 37°C after the addition of a solution
(0.1 ml per well) of 0.05% trypsin plus EDTA in
Ca2+/Mg2+-free PBS, and the cells were
detached through pipetting after the addition of DMEM (0.9 ml)
containing 10% FBS and 1% P/S as previously described (34,35).
Medium containing the suspended cells (0.1 ml) was mixed by the
addition of 0.1 ml of 0.5% trypan blue staining solution. The
number of viable cells was counted under a microscope (Olympus
MTV-3) with a Hemocytometer (Sigma-Aldrich) using a cell counter
(Line Seiki H-102P; Line Seiki Co., Ltd., Tokyo, Japan). For each
dish, we took the average of two counts. Cell numbers are shown as
number per well.
Western blot analysis
In the cell proliferation experiments, the HepG2
cells were plated in 100×21 mm dishes at a density of
1×10⁶ cells/dish in 10 ml of α-MEM containing 10% FBS,
1% P/S and 1% fungizone, and the cells were then cultured in the
presence of either the vehicle (1% DMSO) or TCDD (1 or 10 nM) for 3
days. In the cell death experiment, the cells
(1×10⁶/ml/dish) were seeded in 100×21 mm dishes and
cultured in 10 ml of α-MEM (containing 10% FBS, 1% P/S and 1%
fungizone) for 3 days to reach subconfluency. They were then
cultured for 24 h in the presence of either the vehicle (1% DMSO)
or TCDD (1 or 10 nM). The cells were washed 3 times with cold PBS
and removed from the dish by scraping in cell lysis buffer (Cell
Signaling Technology, Danvers, MA, USA) supplemented with
inhibitors of protease and protein phosphatase (Roche Diagnostics,
Indianapolis, IN, USA). The lysates were then centrifuged at 17,000
× g at 4°C for 10 min. The protein concentrations of the
supernatants were determined using the Bio-Rad Protein Assay Dye
(Bio-Rad Laboratories, Inc., Hercules, CA, USA) with bovine serum
albumin as a standard. The supernatant was stored at −80°C until
use. Samples of 40 µg of supernatant protein per lane were
separated by 12% SDS polyacrylamide gel electrophoresis (SDS-PAGE),
and transferred onto nylon membranes for immunoblotting with
specific antibodies. Polyclonal AHR antibody sheep IgG was obtained
from R&D Systems (cat. no. AF6697). Other antibodies to
signaling proteins, including caspase-3 (cat. no. 9662), signal
transducer and activator of transcription 3 (STAT3) (cat. no.
12640), Ras (cat. no. 14429), Akt (cat. no. 9272),
mitogen-activated protein kinase (MAPK) (cat. no. 4695), β-actin
(cat. no. 3700), Rb (cat. no. 9309) and p21 (cat. no. 2947) were
obtained from Cell Signaling Technology (Danvers, MA, USA), and
CYP1A1 (cat. no. sc-25304), nuclear factor (NF)-κB p65 (cat. no.
sc-109), β-catenin (cat. no. sc-39350) and p53 (cat. no. sc-126)
were obtained from Santa Cruz Biotechnology, Inc. (Santa Cruz, CA,
USA) (36). Rabbit anti-regucalcin
antibody was obtained from Abcam (Cambridge, MA, USA; diluted
1:1,000; cat. no. ab213459), and it was used as previously
described (36,37). The membranes were incubated with
one of the primary antibodies (diluted 1:1,000) overnight at 4°C,
followed by horseradish peroxidase-conjugated secondary antibodies
(cat. no. mouse sc-2005 or rabbit sc-2305; Santa Cruz
Biotechnology, Inc.; diluted 1:2,000). For the AHR antibody, we
used sheep IgG horseradish peroxidase-conjugated antibody (R&D
Systems; diluted 1:1,000; cat. no. HAF016). The immunoreactive
blots were visualized with a SuperSignal West Pico Chemiluminescent
Substrate detection system (Thermo Fisher Scientific, Rockford, IL,
USA) according to the manufacturer's instructions. β-actin (diluted
1:2,000; cat. no. 3700; Cell Signaling Technology) was used as a
loading control. A minimum of 3 blots from independent experiments
were scanned on an Epson Perfection 1660 Photo scanner, and bands
quantified using ImageJ software.
Statistical analysis
Statistical significance was determined using
GraphPad InStat version 3 for Windows XP (GraphPad Software Inc.,
La Jolla, CA, USA). Multiple comparisons were performed by one-way
analysis of variance (ANOVA) with the Tukey-Kramer multiple
comparisons post hoc test for parametric data as indicated. A value
of P<0.05 was considered to indicate a statistically significant
difference.
Results
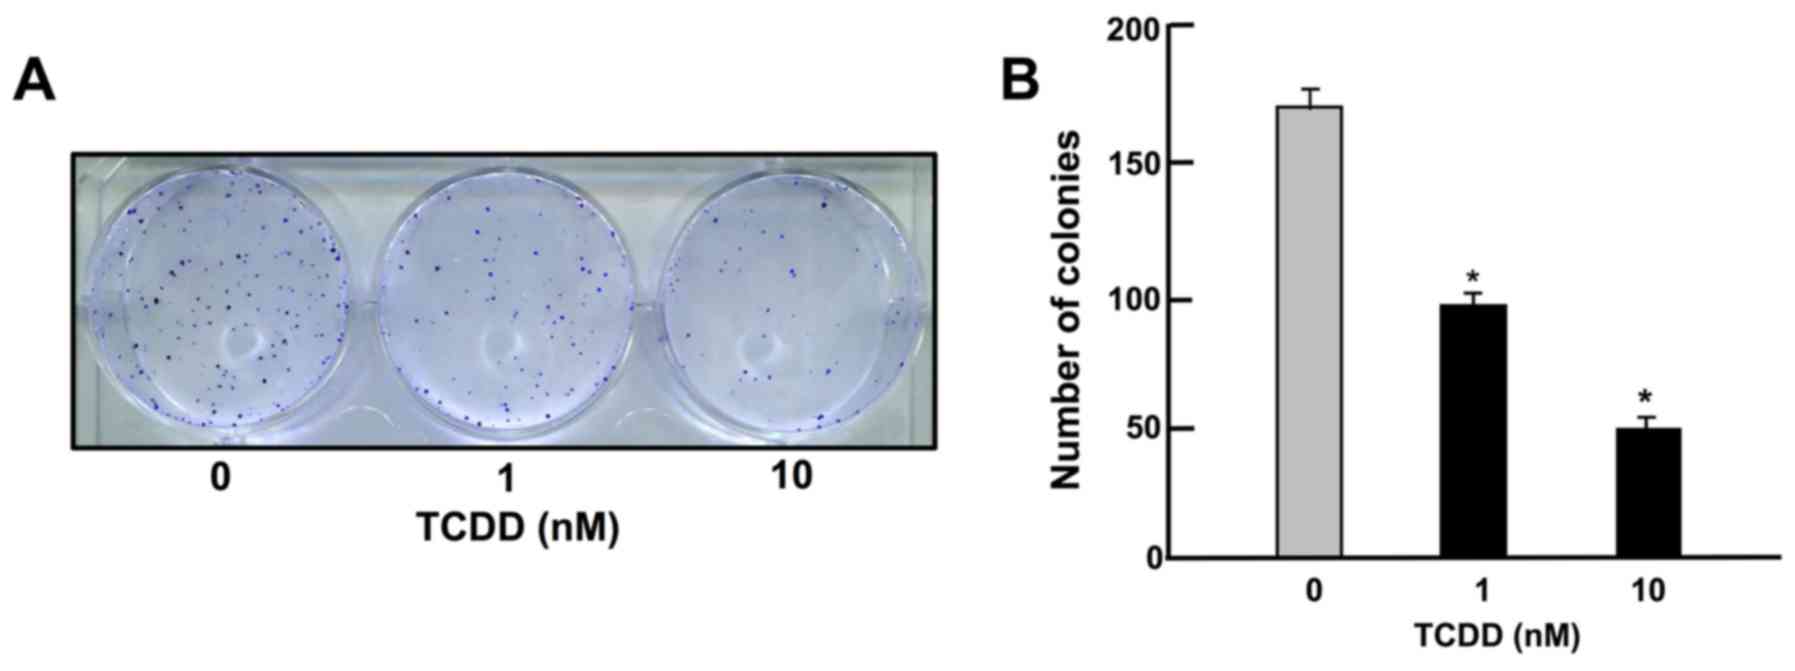
TCDD suppresses on colony formation of
HepG2 cells
To determine the effects of TCDD on the colony
formation of HepG2 cells in vitro, the HepG2 cells were
cultured in the presence of TCDD (1 or 10 nM) for 14 days, when
visible clones were formed on the plates (Fig. 1). Crystal violet is a basic dye
that stains cell nuclei (33).
Colony formation with >50 nuclei by estimation with crystal
violet staining was suppressed by culture with TCDD (1 or 10 nM),
as shown in Fig. 1.
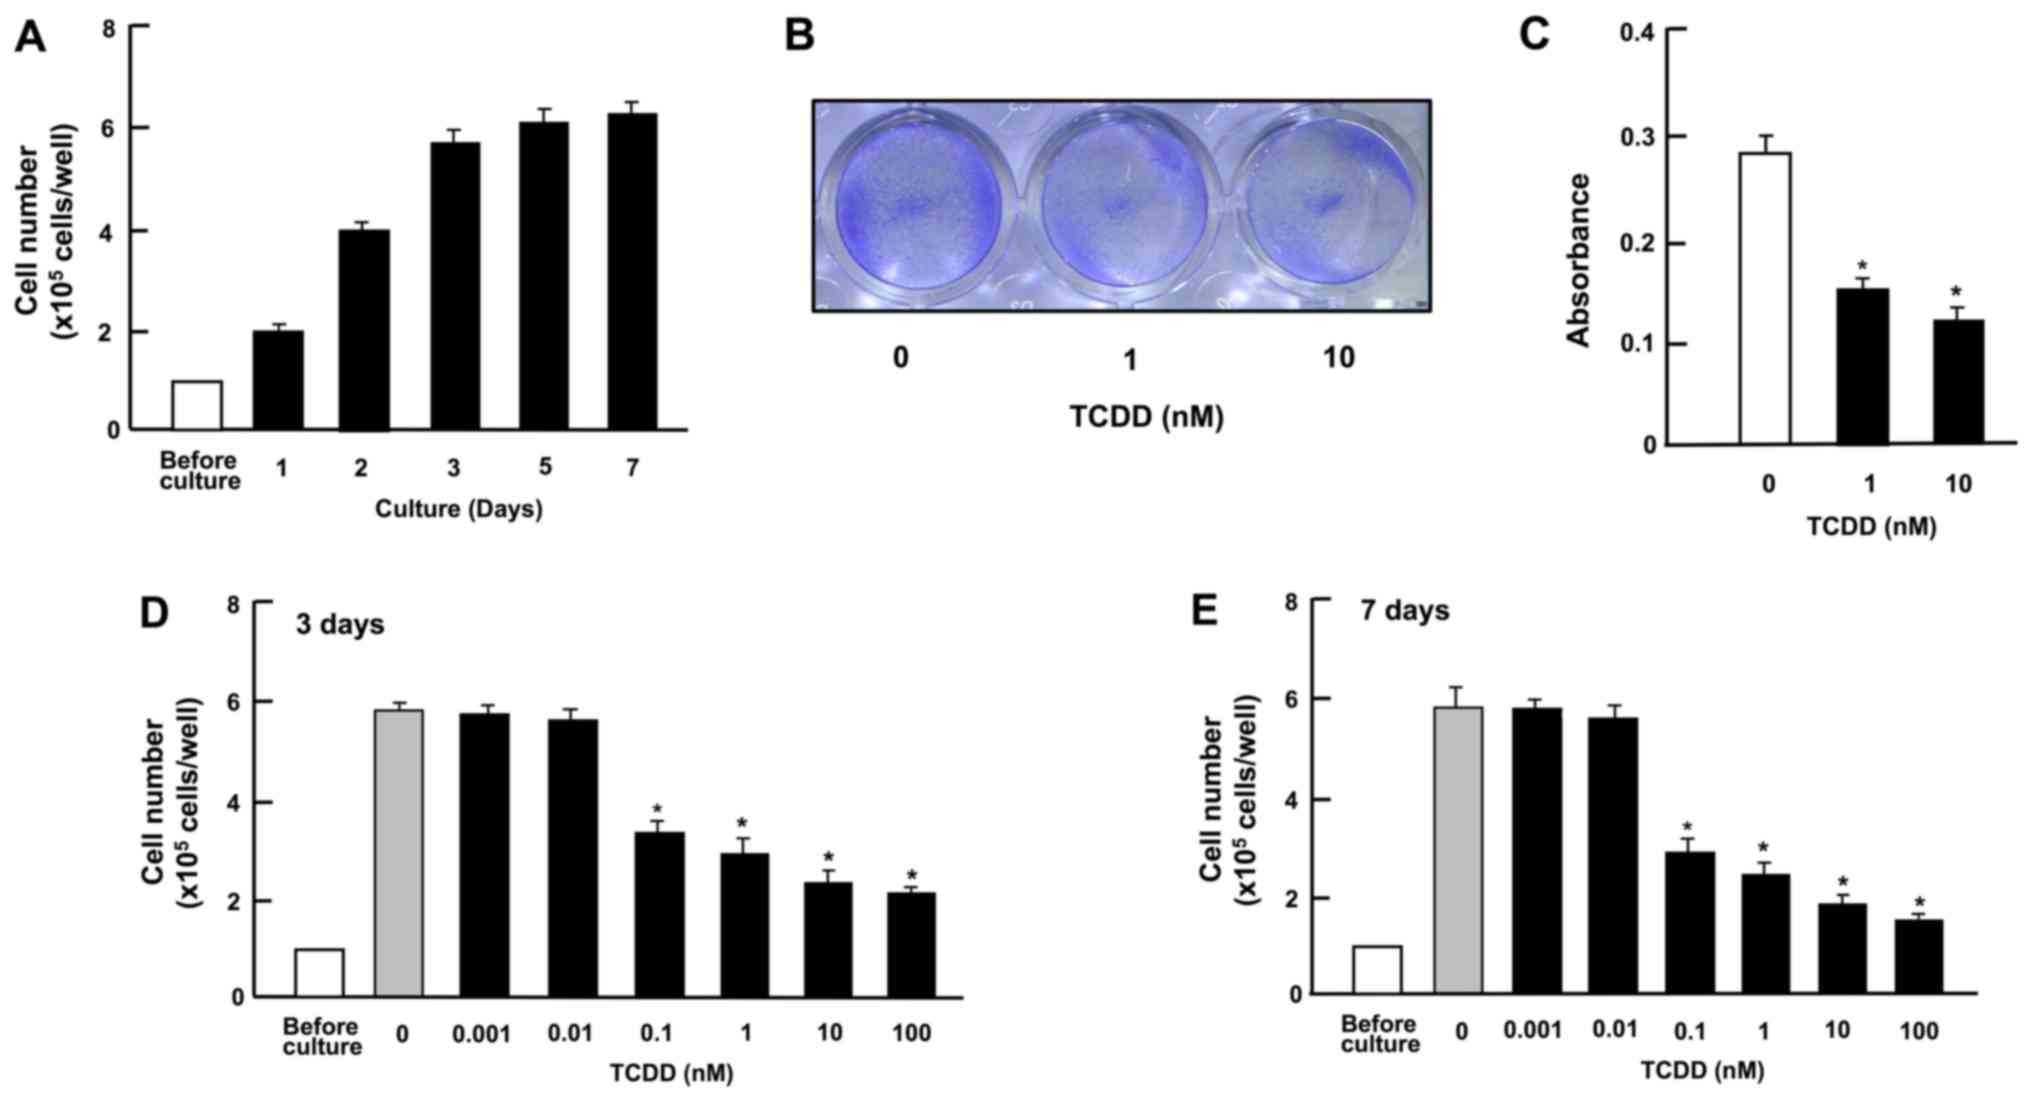
TCDD suppresses the growth and
proliferation of HepG2 cells
Cell growth with increasing periods of culture is
shown in Fig. 2A. Cells reached
subconfluency in culture for 3 days and to confluency after 4-7
days of culture in 24-well plates. At 3 days after culture in the
presence or absence of TCDD (1 or 10 nM), the cell density was also
determined by measuring the absorbance of crystal violet in the
fixed cells (Fig. 2B and C). The
spectrophotometer reading of color intensity by staining with
crystal violet is an indicator of the DNA content and cell number
(33). Cell growth was clearly
suppressed by culture with TCDD (Fig.
2B and C). As shown in Fig. 2D and
E, representing growth after 3 and 7 days in culture,
respectively, the suppression of cell proliferation occurred at a
concentration of TCDD as low as 0.1 nM
TCDD stimulates the death of HepG2
cells
To investigate whether TCDD stimulates the death of
HepG2 cells in vitro, the cells were cultured for 3 days to
reach subconfluency and then exposed to TCDD (1 or 10 nM) for a
further day. TCDD treatment led to cell death. As shown in the
images in Fig. 3A and by the
absorbance (Fig. 3B), TCDD clearly
had an effect on cell counts at a concentration as low as 0.1 nM
both at 24 and 48 h of treatment after the cells reached
subconfluency (Fig. 3C and E). In
separate experiments, on reaching subconfluency after culture for 3
days, the cells were cultured in the presence of a caspase-3
inhibitor (10 µM) (see Materials and methods) for 24
(Fig. 3D) or 48 h (Fig. 3F). The decrease in cell number
induced by TCDD (1 or 10 nM) was eliminated by treatment with the
inhibitor of caspase-3. Moreover, the results of western blot
analysis revealed that the caspase-3 levels were increased by
culture with TCDD (1 or 10 nM) (Fig.
3G). The activation of caspase-3 induces DNA fragmentation
related to apoptotic cell death (34). Thus, TCDD-induced cell death was
likely due, at least in part, to an increase in the caspase-3
levels.
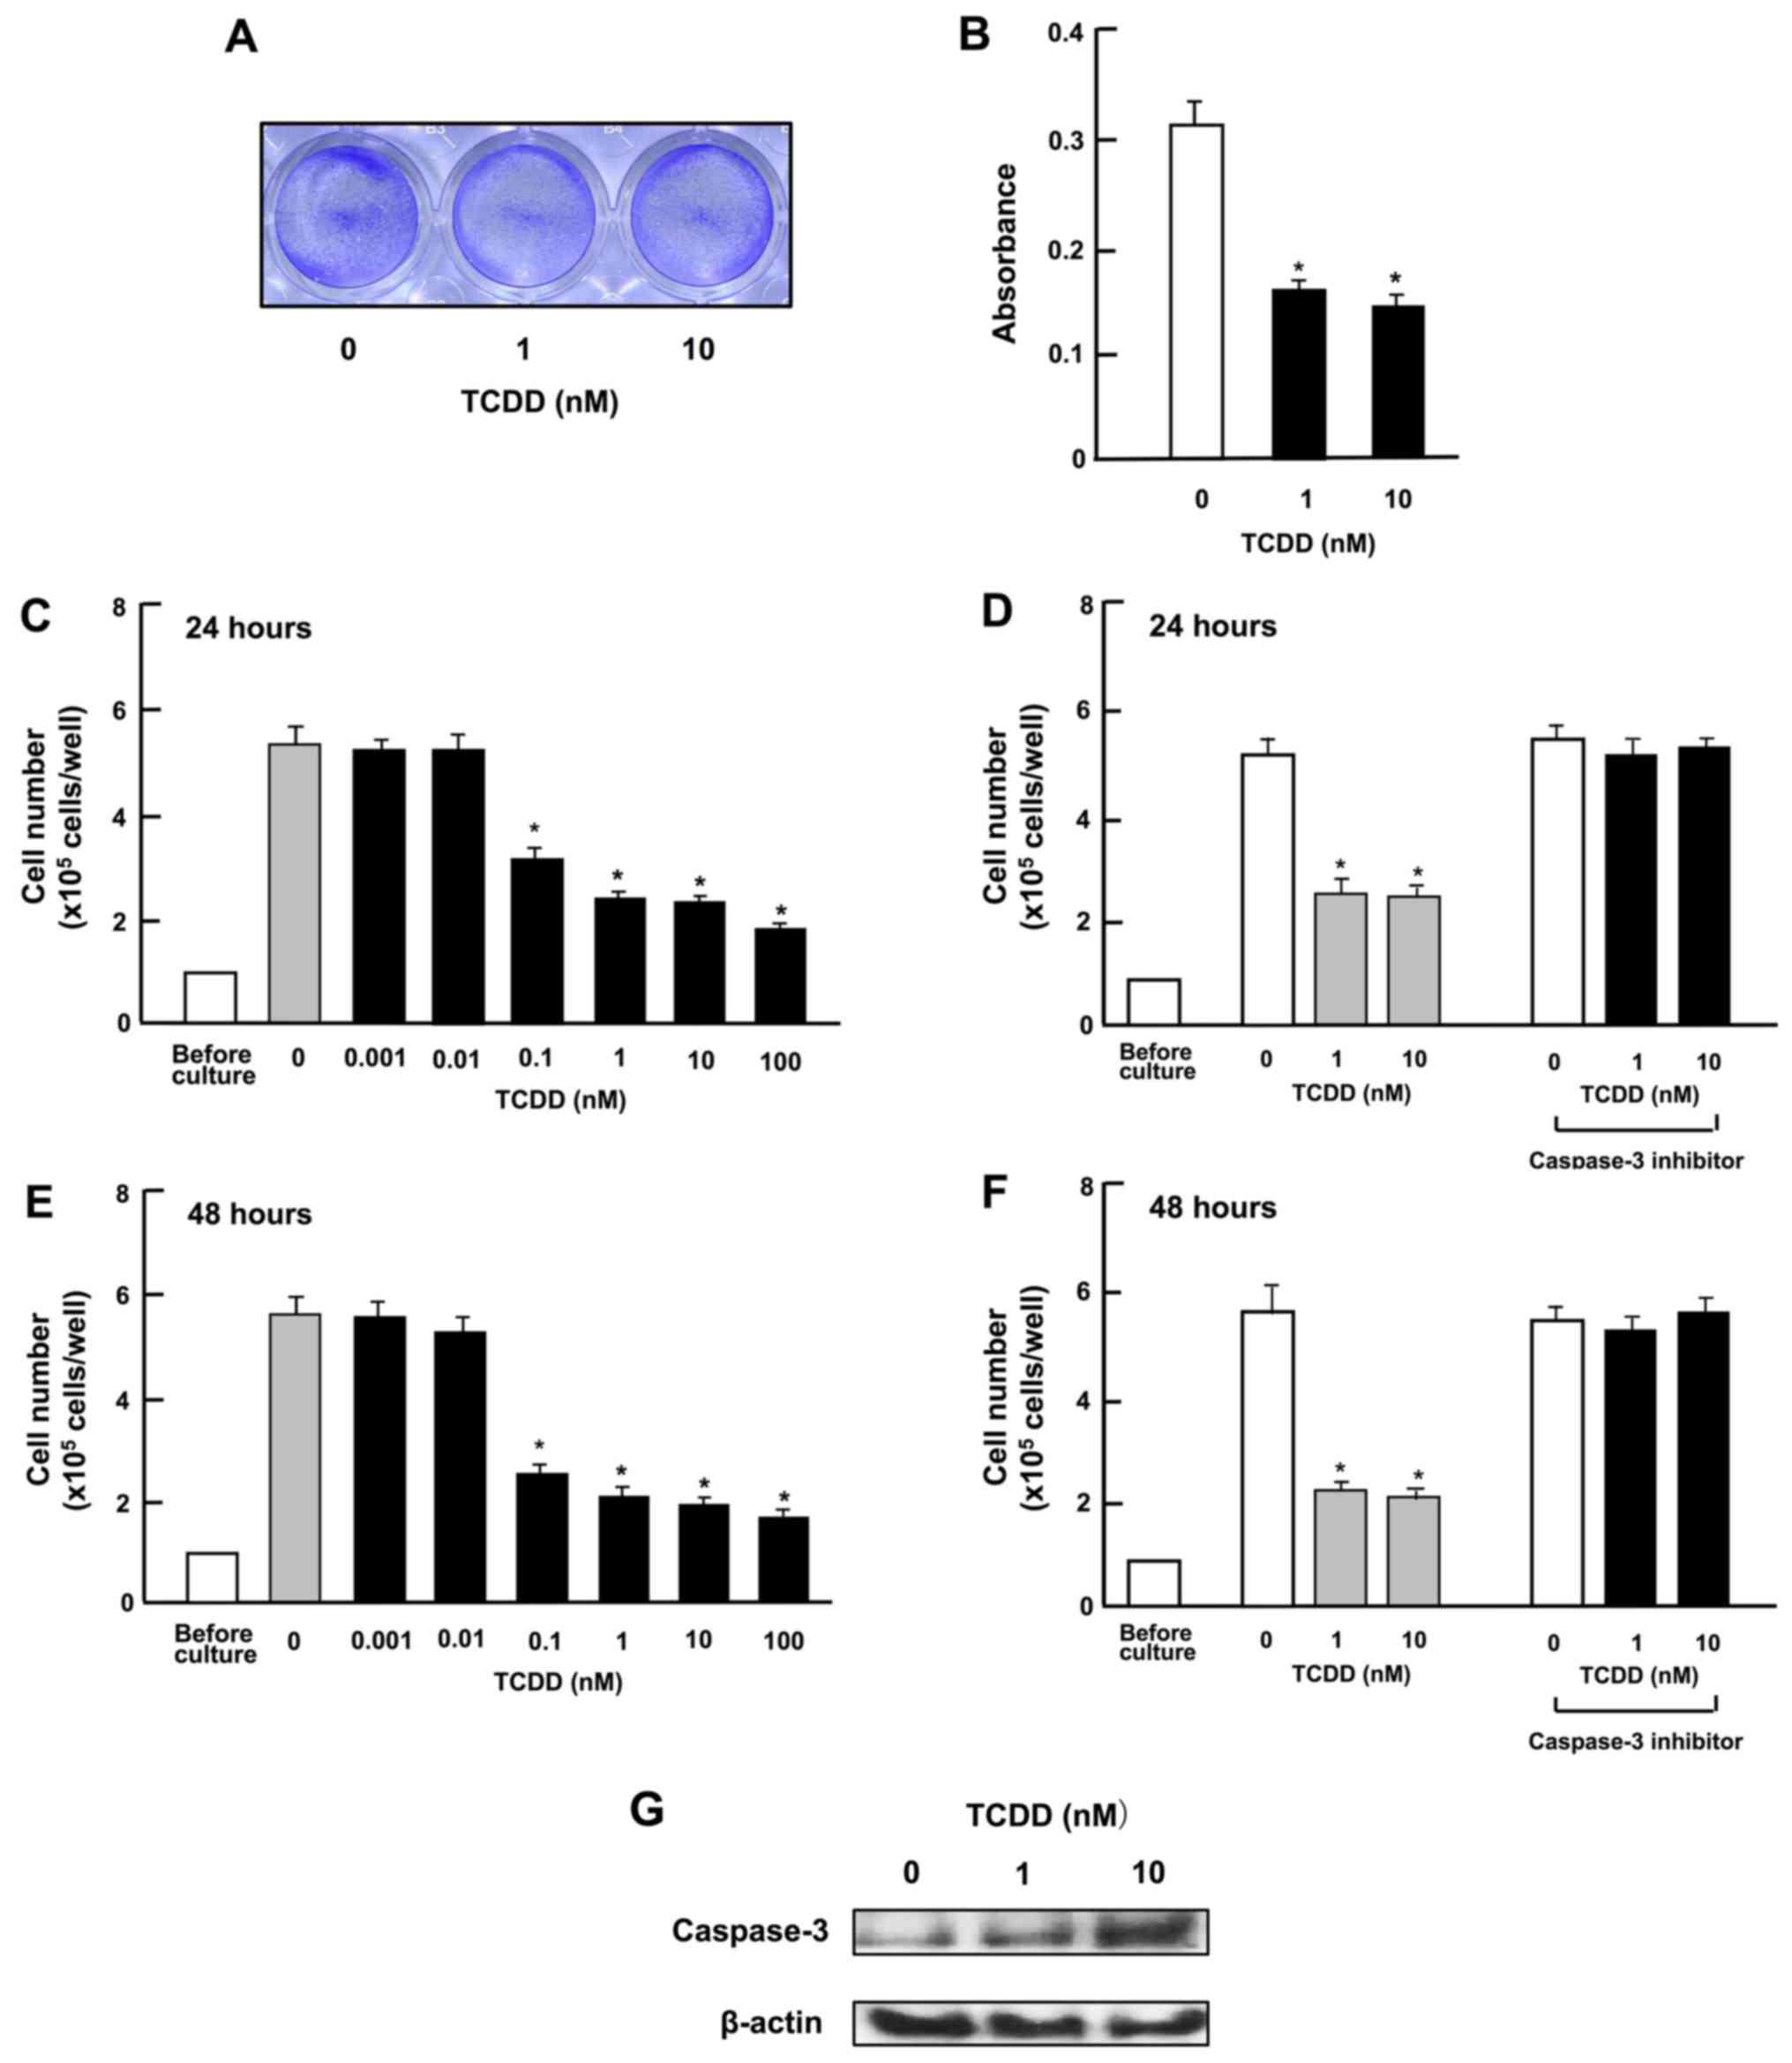 | Figure 3
2,3,7,8-Tetrachlorodibenzo-p-dioxin (TCDD) stimulates the
death of HepG2 cells in vitro. (A and B) Cells
(1×10⁵ cells in 1 ml per in 24-well plates) were
cultured in α-MEM for 3 days to reach subconfluency, and then
cultured in α-MEM containing 10% FBS in the presence of either the
vehicle (1% DMSO) or TCDD (1 or 10 nM) for 24 h, and stained with
crystal violet. Stained cells are shown in (A) and absorbance in
(B). In separate experiments, subconfluent cells were cultured in
the presence of either the vehicle or TCDD (0.001–100 nM) for (C)
24 or (E) 48 h, or were cultured for (D) 24 or (F) 48 h in the
presence of either vehicle or TCDD (1 or 10 nM) with or without
caspase-3 inhibitor (10 µM). Following culture, the number
of cells attached on dish was counted. (G) A total of
1×10⁶ cells were seeded in 100×21 mm dishes and cultured
in α-MEM for 3 days, to reach subconfluency, and then exposed to
either the vehicle or TCDD (1 or 10 nM) for 24 h. Following
culture, the cell lysate (40 µg protein per lane) were
applied to SDS-PAGE for western blot analysis using specific
antibodies against casapase-3. Data represent results obtained from
3 independent experiments using different cell preparations. Data
of cell number (C–F) are presented as the means ± SD obtained from
8 wells of 2 replicate plates per data set using different dishes
and cell preparations. *P<0.001 vs. control (without
TCDD), determined by one-way ANOVA with the Tukey-Kramer post hoc
test. |
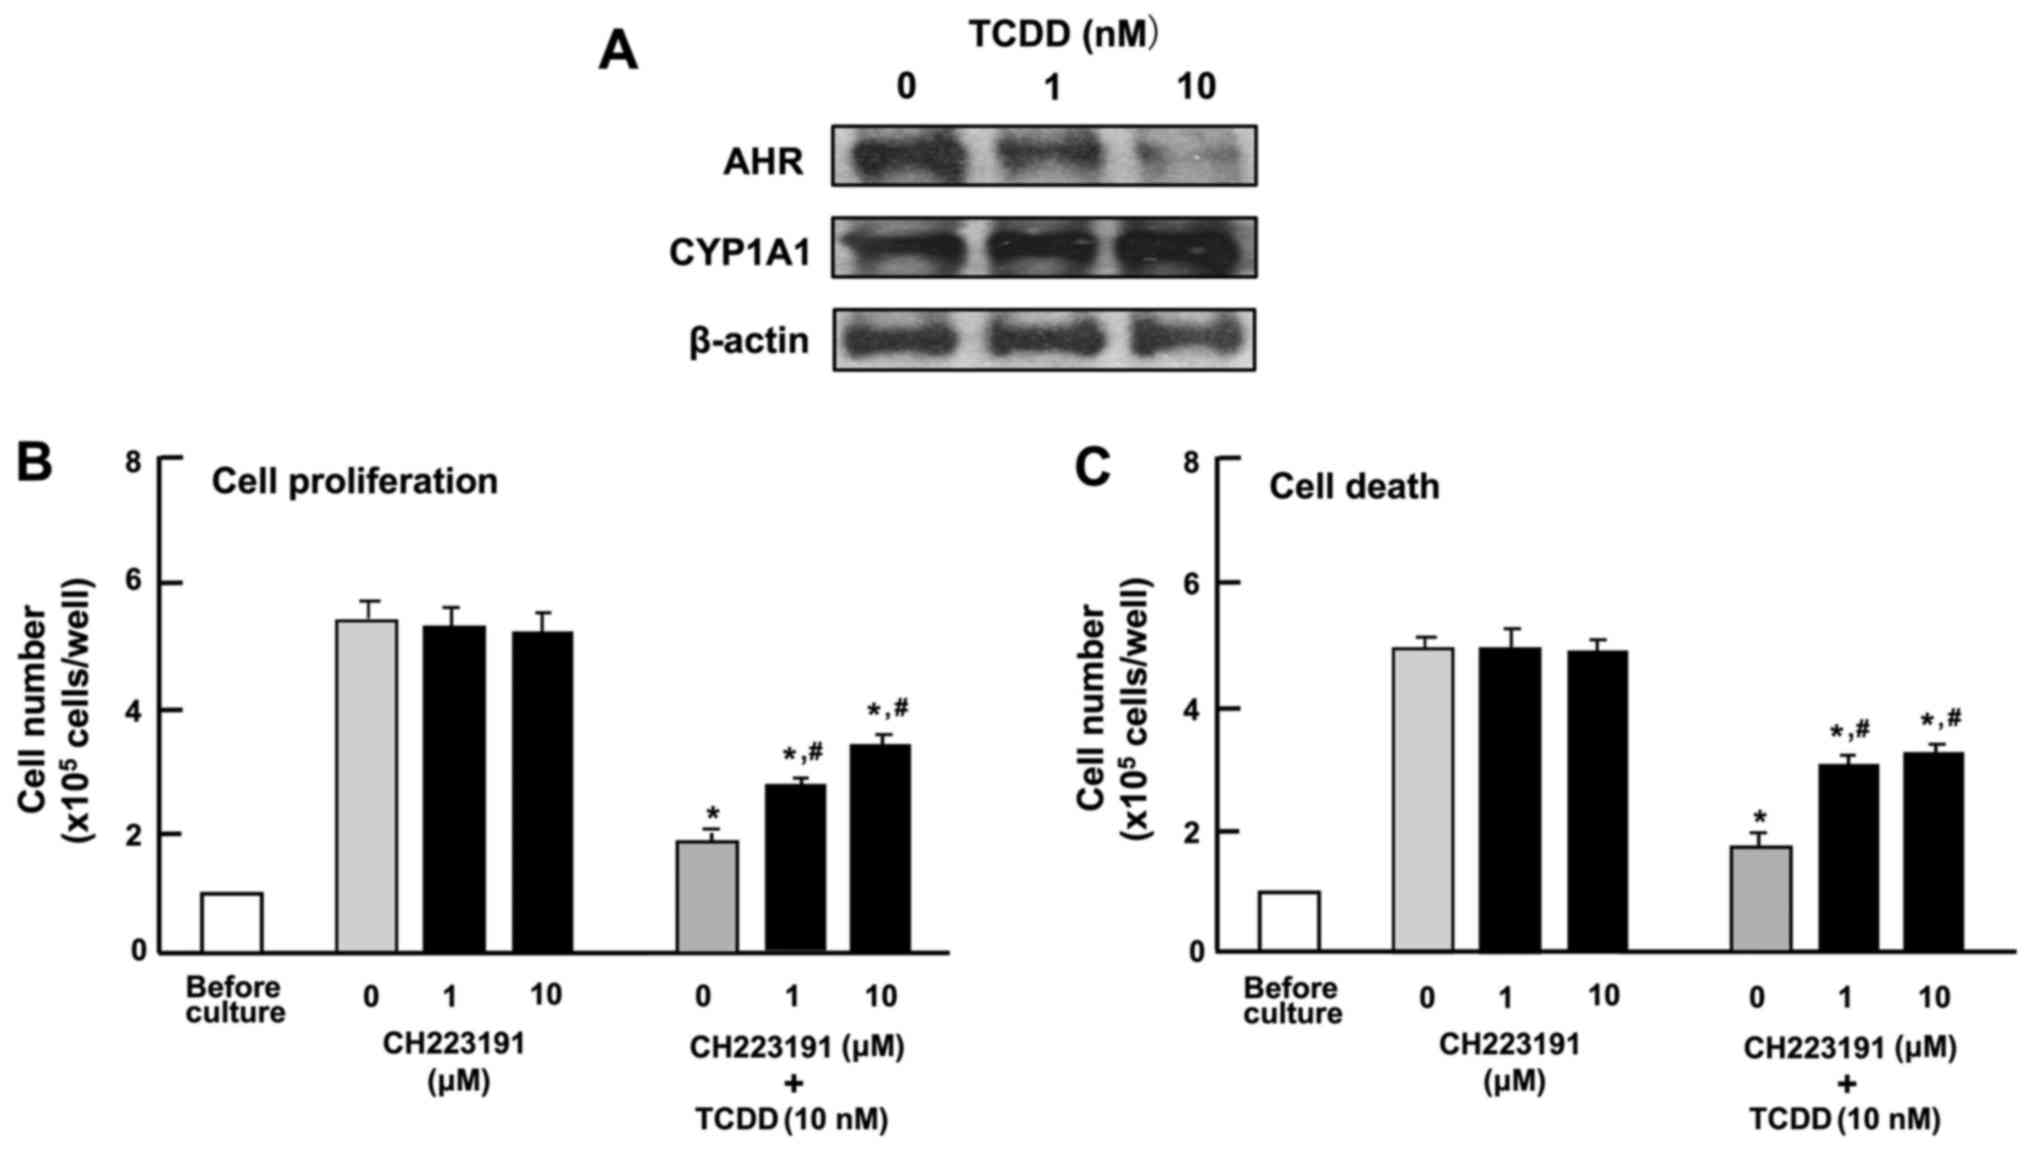
Characterization of the effects of TCDD
on the proliferation and death of HepG2 cells
To determine the mechanisms responsible for the
TCDD-induced suppression of the proliferation and the stimulation
of the death of HepG2 cells, the cells were cultured in the
presence of CH223191, an inhibitor of AHR signaling (31). Western blot analysis identified AHR
and AHR-inducible CYP1A1, representing a member of the cytochrome
P450 superfamily of enzymes (1,2), in
the HepG2 cells (Fig. 4A). TCDD (1
or 10 nM) induced a decrease in the levels of AHR and a
corresponding increase in the levels of CYP1A1 in the cytosol of
the HepG2 cells (Fig. 4A). Culture
with CH223191 (1 or 10 µM) alone did not exert a significant
effect on the proliferation (Fig.
4B) or death (Fig. 4C) of the
HepG2 cells. The suppressive effect of TCDD (1 or 10 nM) on the
proliferation and the stimulatory effect of TCDD (1 or 10 nM) on
cell death with decrease in attached HepG2 cells were not caused in
the presence of CH223191, although the effects of TCDD were not
completely blocked by the inhibitor (Fig. 4B and C). These findings suggested
that the effects of TCDD on the proliferation and death of HepG2
cells are at least partly mediated through AHR signaling.
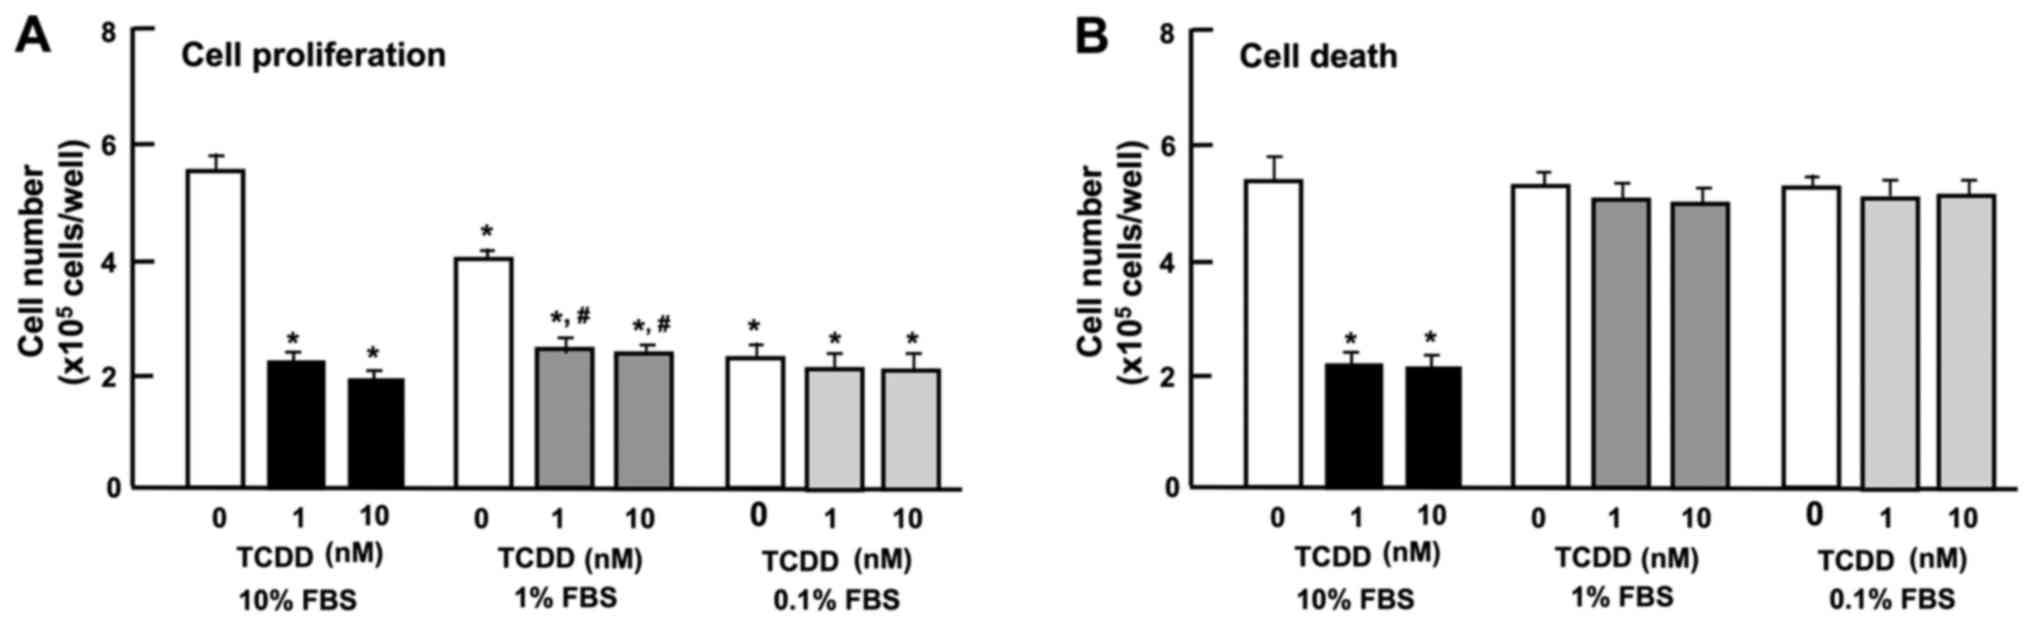
The expression of AHR has been shown to be regulated
by serum and mitogenic growth factors in murine 3T3 fibroblasts
(38). In this study, we thus
examined the effect of the serum concentration of TCDD on the
proliferation and death of HepG2 cells in vitro. Reduced
serum concentrations resulted in a diminished proliferation of
HepG2 cells. The suppressive effects of TCDD (1 or 10 nM) on cell
proliferation were not further enhanced by reducing the serum
concentration from 10 to 1 or 0.1% (Fig. 5A). Cell death was not altered with
increasing concentrations (0.1, 1 or 10%) of FBS (Fig. 5B). Moreover, the stimulatory
effects of TCDD (1 or 10 nM) on cell death with decrease in
attached cells were not exhibited with a lower concentration (0.1
or 1%) of FBS (Fig. 5B). These
results indicate that the TCDD-induced suppression of cell
proliferation and stimulation of cell death were dependent on the
concentration of serum, which contains various growth factors,
hormones and cytokines.
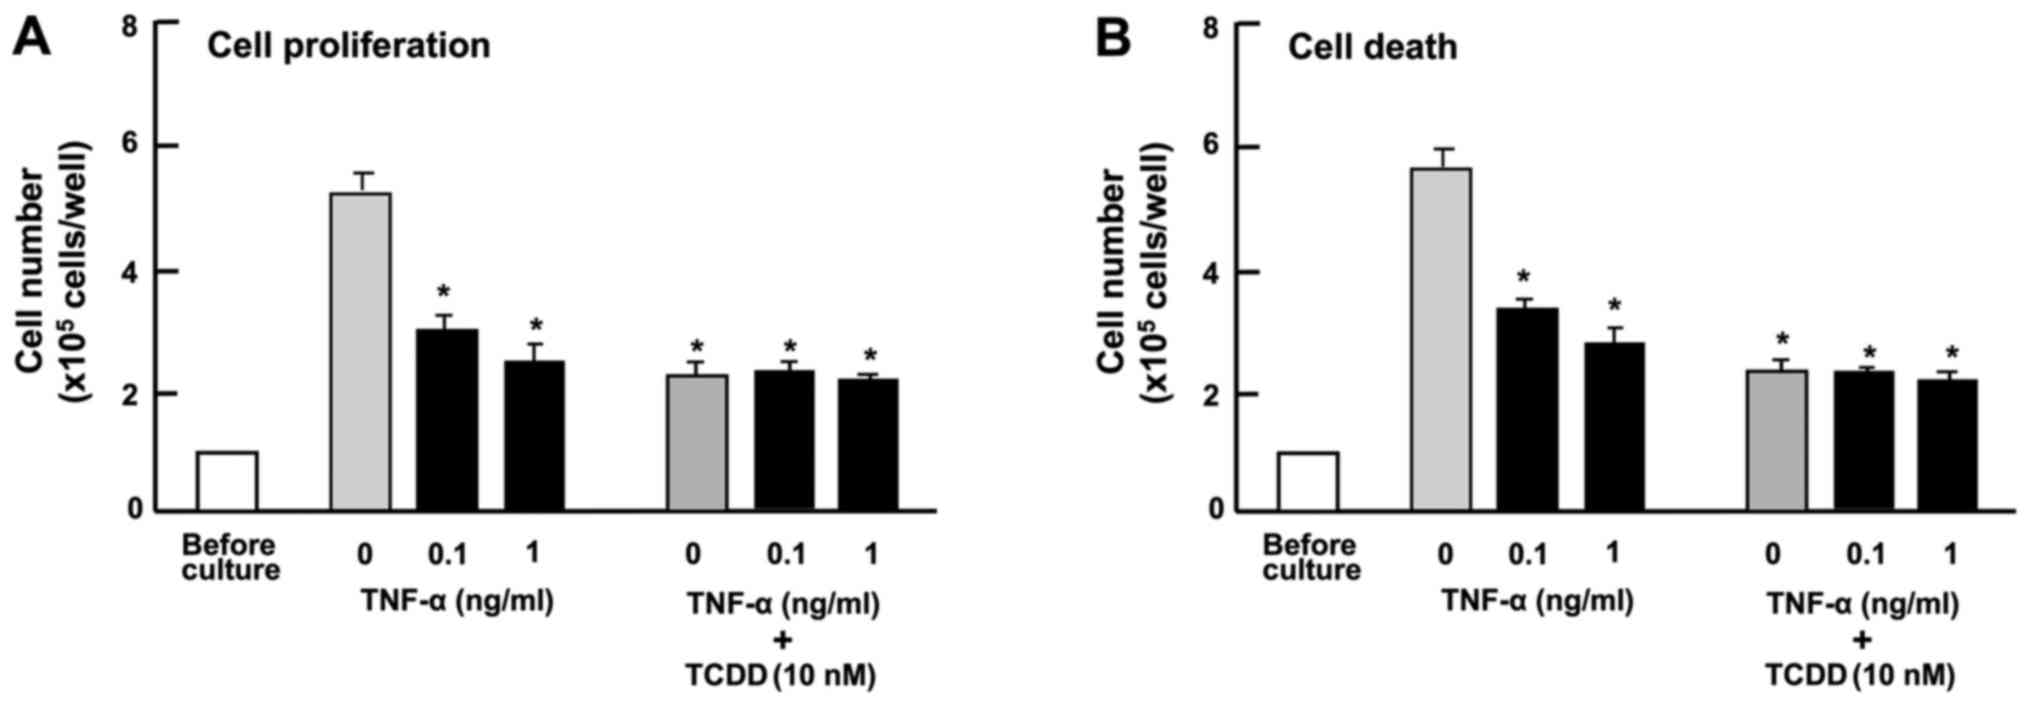
TNF-α has been shown to modulate the effects of AHR
ligands on cell proliferation and expression of cytochrome P450
enzymes in rat liver 'stem-like' cells (39). In our experiments, TNF-α (0.1 or 1
ng/ml) suppressed the proliferation of HepG2 cells (Fig. 6A) and reduced the number of
attached cells, indicating increased cell death (Fig. 6B) in vitro. The suppressive
effects of TCDD (10 nM) on the proliferation and the promoting
effects on the death of HepG2 cells were not potentiated by TNF-α
(0.1 or 1 ng/ml) (Fig. 6),
suggesting that these effects of TCDD are at least partially
mediated through the activation of NF-κB signaling.
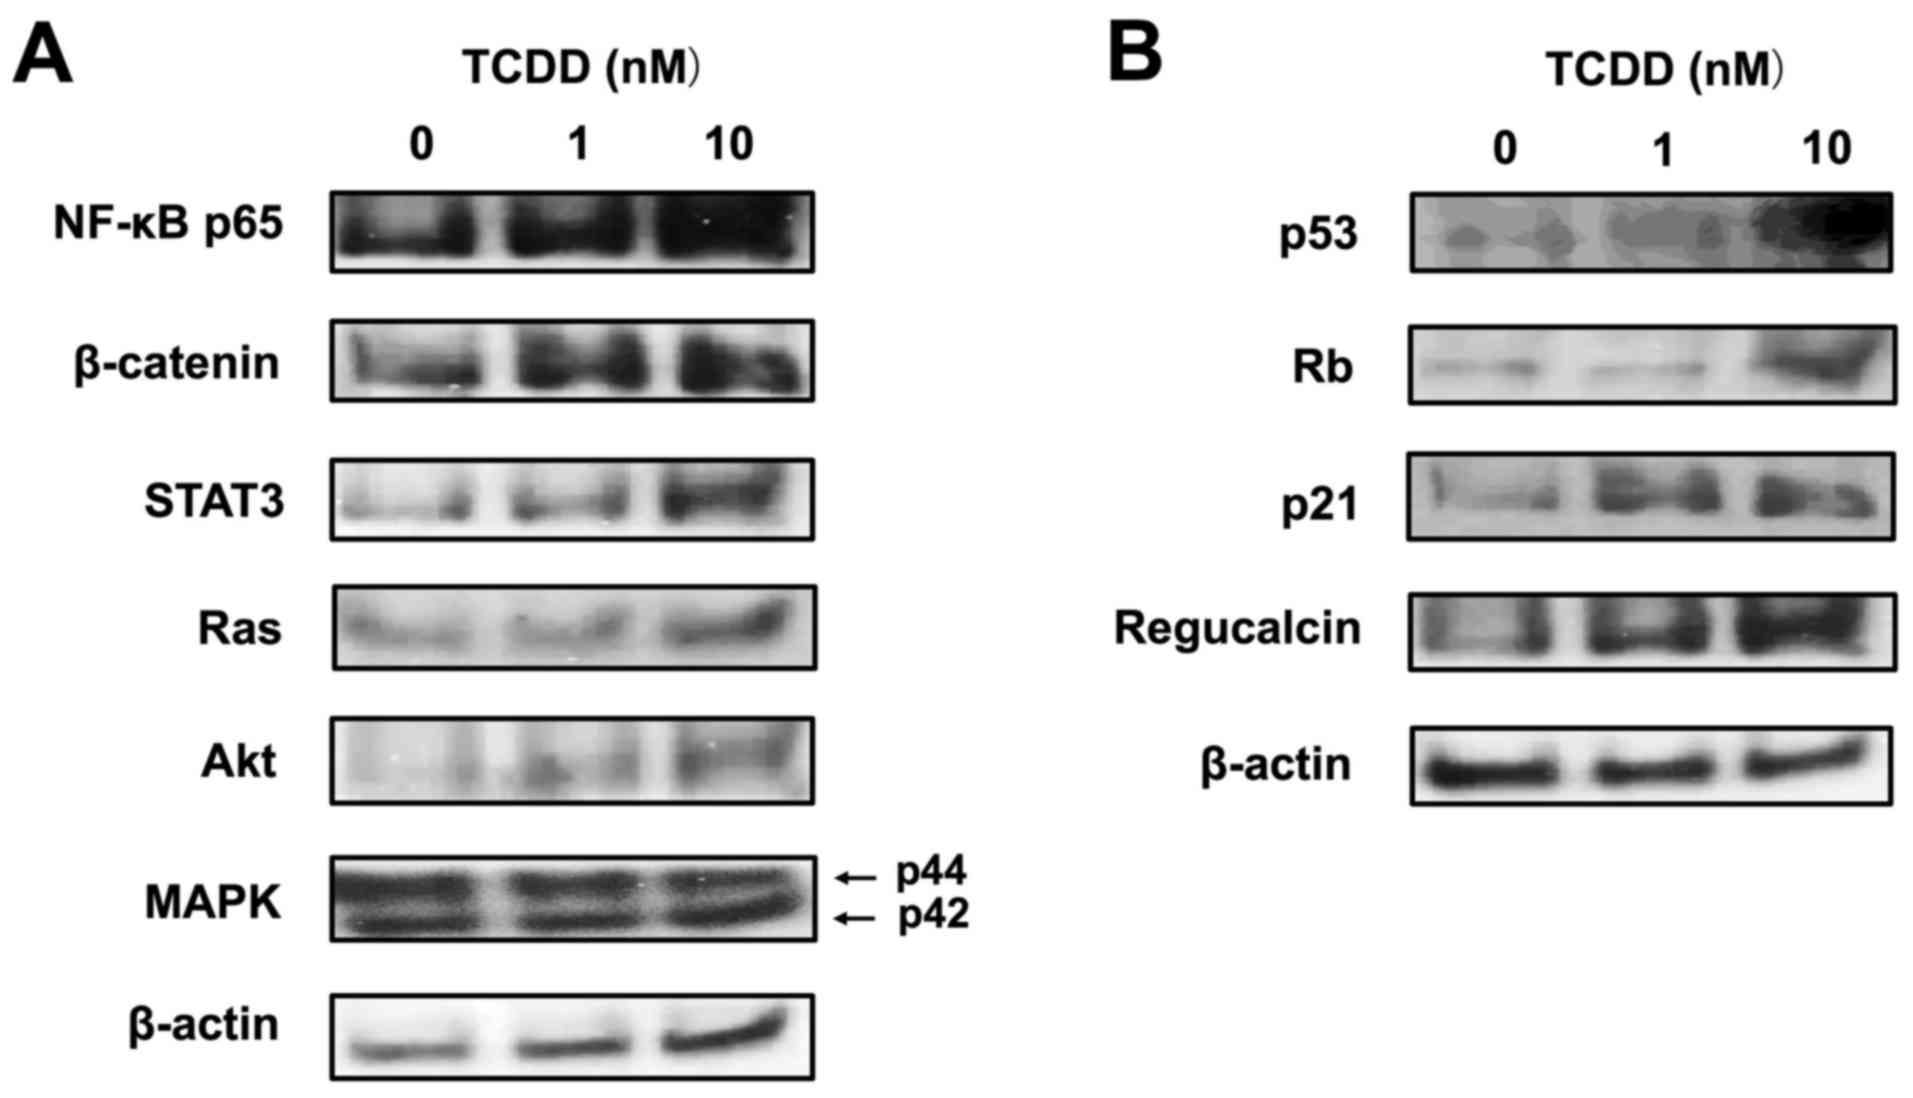
TCDD regulates protein levels linked to
certain key signaling pathways in HepG2 cells
To further investigate the mechanisms of action of
TCDD, we examined whether TCDD affects the expression of key
transcription factors and other proteins related to important
signaling pathways, using western blot analysis. TCDD (10 nM)
increased the protein levels of NF-κB p65, β-catenin and STAT3,
which are transcription factors linked to cell signaling (Fig. 7A). TCDD (10 nM) also elevated the
levels of Ras and Akt, but did not alter the level of MAPK, which
acts downstream of Ras and Akt signaling (Fig. 7A). Of note, TCDD (10 nM) markedly
increased the expression levels of p53, Rb, p21 and regucalcin,
which are suppressors of tumor cell growth (40,41)
(Fig. 7B).
The combination of TCDD and gemcitabine
exerts independent effects on the proliferation and death of HepG2
cells
Gemcitabine, an antitumor drug, the action of which
is not implicated in AHR signaling, is known to suppress the
proliferation and stimulate the death of cancer cells by inducing
nuclear DNA damage (42). In this
study, the effects of TCDD on the proliferation and death of HepG2
cells were compared with those of gemcitabine (Fig. 8). Gemcitabine (0.1, 1 or 10 nM)
suppressed cell proliferation (Fig.
8A) and decreased the number of attached cells, indicating
increased cell death (Fig. 8B).
TCDD (0.1 or 1 nM) also suppressed cell proliferation and
stimulated cell death; the effects of TCDD were significantly
enhanced in the presence of gemcitabine (0.1 or 1 nM) (Fig. 8). These findings suggest that the
mode of action of TCDD as regards cell proliferation and death
differs from that of gemcitabine (42). The combination of TCDD and
gemcitabine may have a potential additive suppressive effect on the
growth of tumor cells, suggesting a novel strategy in the treatment
of liver cancer.
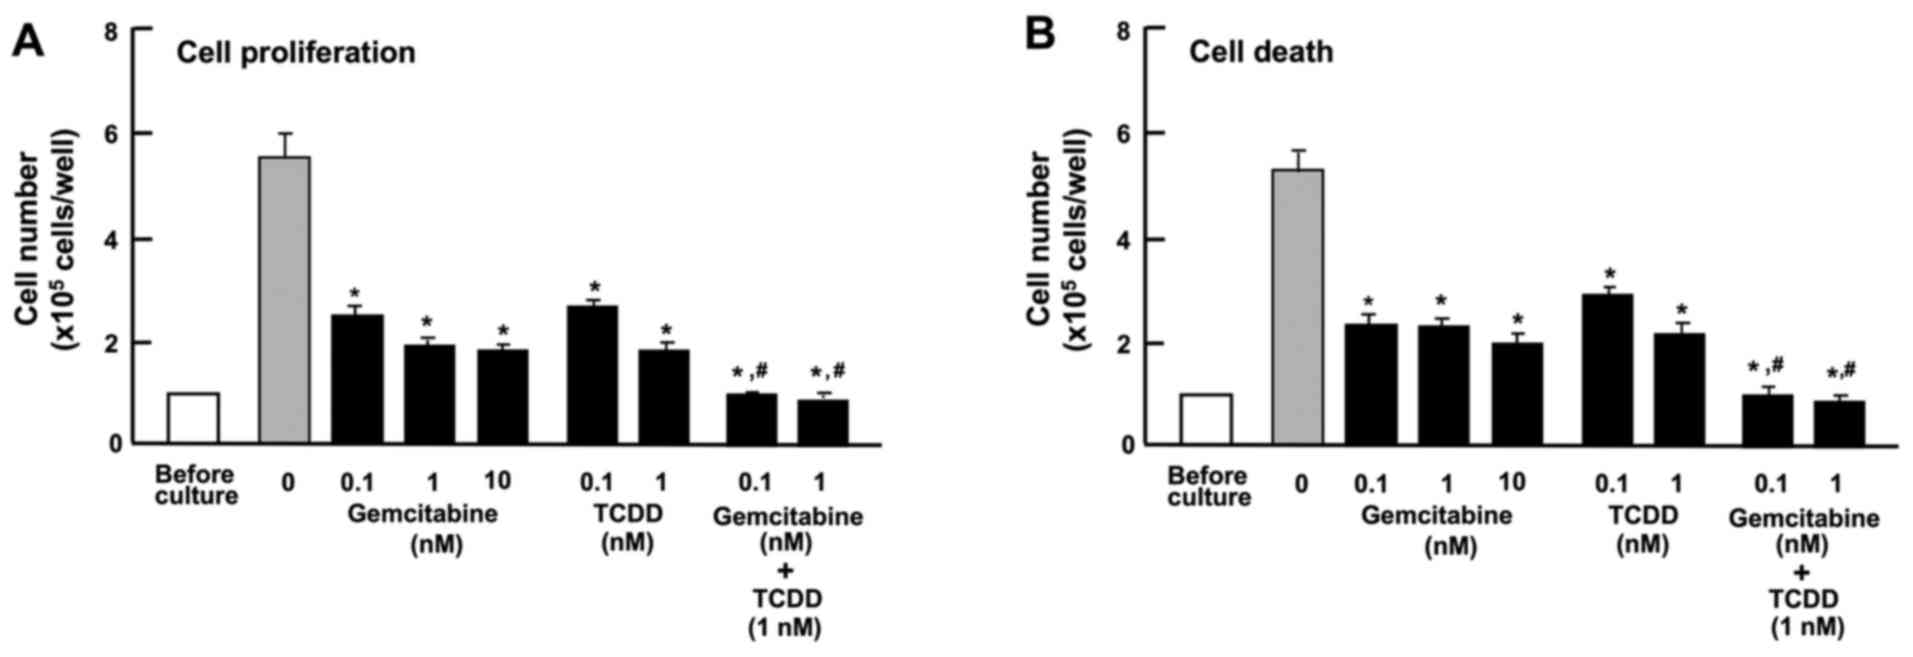 | Figure 8Combination of
2,3,7,8-tetrachlorodibenzo-p-dioxin (TCDD) and gemcitabine
reveals different mechanisms affecting the proliferation and death
of HepG2 cells in vitro. (A) Cells (1×10⁵
cells/per well in 24-well plates) were cultured in α-MEM containing
10% FBS in the presence of either the vehicle (1% DMSO),
gemcitabine (0.1, 1 or 10 nM), TCDD (0.1 or 1 nM), or gemcitabine
(0.1 or 1 nM) plus TCDD (1 nM) for 3 days. (B) Cells
(1×10⁵ cells/per well in 24-well plates) were cultured
in α-MEM containing 10% FBS for 3 days, and the cells on reaching
subconfluency were then cultured for 24 h in α-MEM containing 10%
FBS in the presence of either the vehicle, gemcitabine (0.1, 1 or
10 nM), TCDD (0.1 or 1 nM), or gemcitabine (0.1 or 1 nM) plus TCDD
(1 nM). Following culture, the numbers of attached cells were
counted. Data are presented as the means ± SD obtained from 8 wells
of 2 replicate plates per data set using different dishes and cell
preparations. *P<0.001 vs. control (without
gemcitabine and TCDD). #P<0.001 as compared with the
value obtained from gemcitabine or TCDD alone, determined by
one-way ANOVA with the Tukey-Kramer post hoc test. |
Discussion
AHR plays manifold roles in cell differentiation,
proliferation and organ homeostasis, including in the liver
(29). The depletion of AHR
induces dedifferentiation and pluripotency in normal and
transformed cells (29). The
activation of AHR has been shown to promote the development of
liver tumors in a model of hepatocarcinogenesis (22,24-26).
This receptor may also possess tumor suppressor activities in the
liver (23,27,28).
TCDD is a potent activator of AHR signaling. In this study, we
demonstrated that TCDD at a comparatively lower concentration,
suppressed the formation of colonies and the proliferation of human
liver cancer HepG2 cells in vitro, and stimulated the death
of these cells. The TCDD-induced suppression of colony formation
resulted from both the suppressed proliferation and the enhanced
death of HepG2 cells. The effects of TCDD on the proliferation and
death of HepG2 cells were diminished in the presence of CH223191,
an inhibitor of AHR signaling (31), supporting the view that observed
TCDD effects are at least partly mediated through the AHR signaling
pathway.
AHR expression has been shown to be regulated by
serum, containing mitogenic growth factors in murine 3T3
fibroblasts (38). AHR expression
has been shown to be diminished by culture in a lower concentration
of serum (38). Ligand activated
platelet-derived growth factor receptor and basic fibroblast growth
factor receptor, as well as an ectopically expressed tyrosine
kinase, have been shown to lead to an enhancement of AHR expression
in the absence of serum (38).
Tyrosine kinase signaling may be necessary for AHR expression
(38). Of note, in this study, we
found that the suppressive effects of TCDD on the proliferation in
HepG2 cells were not enhanced with the reduction of the serum
concentration in vitro. In addition, the stimulatory effects
of TCDD on the death of HepG2 cells were eliminated when the cells
were cultured with lower concentrations of serum. Thus, the
TCDD-induced suppression of the proliferation and the stimulation
of the death of HepG2 cells were dependent on the concentration of
serum, which contains various growth factors, hormones and
cytokines.
TNF-α, which activates NF-κB signaling, is known to
play a major role in liver regeneration, as well as in
carcinogenesis (39). This
cytokine has been shown to modulate the effects of AHR ligands on
proliferation and the expression of cytochrome P450 enzymes in rat
liver 'stem-like' cells (39). AHR
signaling causes NF-κB Rel B activation during dendritic-cell
differentiation (43). Moreover,
TCDD induces hepatic stellate cell activation and liver fibrosis in
C57BL/6 mice by activating the Akt and NF-κB signaling pathways
(44). In the present study, TNF-α
suppressed the proliferation and stimulated the death of HepG2
cells in vitro; however, the suppressive effects of TCDD on
the proliferation of and its promoting effects on the death of
HepG2 cells were not potentiated by TNF-α. We also demonstrated
that TCDD increased NF-κB p65 expression in HepG2 cells in
vitro. These observations indicate that the effects of TCDD may
be partly mediated through the activation of NF-κB signaling.
TCDD has been shown to increase Ras expression in
studies using transcriptomics and metabonomics to unravel modes of
action of TCDD in HepG2 cells in vitro (45). In the present study, TCDD was also
found to increase the levels of β-catenin, STAT3, Ras and Akt, all
of which are involved in cell proliferation and differentiation
(32,41), in HepG2 cells. These molecules may
be partly involved in mediating the effects of TCDD on the
proliferation and death of HepG2 cells. Importantly, we found that
TCDD increased the levels of p53, Rb, p21 and regucalcin, which
each play roles as suppressors of the growth of tumor cells
(40,41). β-catenin has been reported to
increase regucalcin expression in HepG2 cells in vitro
(46). The overexpression of
regucalcin has been shown to elevate the levels of p53, Rb and p21
in HepG2 cells in vitro (47). It is possible that these molecules
are partly involved in mediating the effects of TCDD on the
proliferation and death of HepG2 cells. It remains to be
elucidated, however, whether or not the TCDD-induced enhancement of
these molecules results from the activation of AHR signaling.
Gemcitabine, an antitumor drug, is known to suppress
the proliferation and stimulate the death of cancer cells by
inducing nuclear DNA damage (42),
although this drug may not be linked to AHR signaling. Of note, the
suppressive effects of TCDD on the proliferation and its promoting
effects on the death of HepG2 cells, were significantly potentiated
by gemcitabine. This suggests that the mode of action of TCDD on
cell proliferation and death differs from that of gemcitabine. TCDD
has been demonstrated to activate AHR signaling and thereby
regulate the expression of diverse molecules (1-4). The
combination of TCDD and gemcitabine may exert a potent antitumor
effect, suggesting a novel strategy for cancer therapy.
In conclusion, the findings of the present study
demonstrate that TCDD suppresses the growth of human liver cancer
HepG2 cells in vitro, suppressing colony formation and
proliferation and stimulating death, via various signaling
pathways. TCDD at a comparatively low dose may exert an antitumor
effect in vivo, suggesting a novel strategy for cancer
therapy.
Acknowledgments
Not applicable.
Funding
This study was supported in part from NIH grant
1RO1ES024434 (O.H.).
Availability of data and materials
The datasets used during the present study are
available from the corresponding author upon reasonable
request.
Authors' contributions
MY conceived and designed the study. MY and OH
performed the experiments and discussed the findings. MY wrote the
manuscript, and OH edited the manuscript. Both authors have read
and approved the manuscript and agree to be accountable for all
aspects of the research in ensuring that the accuracy or integrity
of any part of the work are appropriately investigated and
resolved.
Ethics approval and consent to
participate
Not applicable.
Patient consent for publication
Not applicable.
Competing interests
The authors declare that they have no competing
interests.
References
|
1
|
Hankinson O: The aryl hydrocarbon receptor
complex. Annu Rev Pharmacol Toxicol. 35:307–340. 1995. View Article : Google Scholar : PubMed/NCBI
|
|
2
|
Hankinson O: Role of coactivators in
transcriptional activation by the aryl hydrocarbon receptor. Arch
Biochem Biophys. 433:379–386. 2005. View Article : Google Scholar
|
|
3
|
Kamenickova A, Anzenbacherova E, Pavek P,
Soshilov AA, Denison MS, Anzenbacher P and Dvorak Z: Pelargonidin
activates the AhR and induces CYP1A1 in primary human hepatocytes
and human cancer cell lines HepG2 and LS174T. Toxicol Lett.
218:253–259. 2013. View Article : Google Scholar : PubMed/NCBI
|
|
4
|
Kamenickova A, Anzenbacherova E, Pavek P,
Soshilov AA, Denison MS, Zapletalova M, Anzenbacher P and Dvorak Z:
Effects of anthocyanins on the AhR-CYP1A1 signaling pathway in
human hepatocytes and human cancer cell lines. Toxicol Lett.
221:1–8. 2013. View Article : Google Scholar : PubMed/NCBI
|
|
5
|
Dvorak Z, Vrzal R, Henklova P, Jancova P,
Anzenbacherova E, Maurel P, Svecova L, Pavek P, Ehrmann J, Havlik
R, et al: JNK inhibitor SP600125 is a partial agonist of human aryl
hydrocarbon receptor and induces CYP1A1 and CYP1A2 genes in primary
human hepatocytes. Biochem Pharmacol. 75:580–588. 2008. View Article : Google Scholar
|
|
6
|
Pastorková B, Vrzalová A, Bachleda P and
Dvořák Z: Hydroxystilbenes and methoxystilbenes activate human aryl
hydrocarbon receptor and induce CYP1A genes in human hepatoma cells
and human hepatocytes. Food Chem Toxicol. 103:122–132. 2017.
View Article : Google Scholar : PubMed/NCBI
|
|
7
|
Palermo CM, Hernando JI, Dertinger SD,
Kende AS and Gasiewicz TA: Identification of potential aryl
hydrocarbon receptor antagonists in green tea. Chem Res Toxicol.
16:865–872. 2003. View Article : Google Scholar : PubMed/NCBI
|
|
8
|
Go RE, Hwang KA and Choi KC: Cytochrome
P450 1 family and cancers. J Steroid Biochem Mol Biol. 147:24–30.
2015. View Article : Google Scholar
|
|
9
|
Stejskalova L and Pavek P: The function of
cytochrome P450 1A1 enzyme (CYP1A1) and aryl hydrocarbon receptor
(AhR) in the placenta. Curr Pharm Biotechnol. 12:715–730. 2011.
View Article : Google Scholar : PubMed/NCBI
|
|
10
|
Forrester AR, Elias MS, Woodward EL,
Graham M, Williams FM and Reynolds NJ: Induction of a chloracne
phenotype in an epidermal equivalent model by
2,3,7,8-tetrachlorodibenzo-p-dioxin (TCDD) is dependent on aryl
hydrocarbon receptor activation and is not reproduced by aryl
hydrocarbon receptor knock down. J Dermatol Sci. 73:10–22. 2014.
View Article : Google Scholar :
|
|
11
|
Pierre S, Chevallier A, Teixeira-Clerc F,
Ambolet-Camoit A, Bui LC, Bats AS, Fournet JC, Fernandez-Salguero
P, Aggerbeck M, Lotersztajn S, et al: Aryl hydrocarbon
receptor-dependent induction of liver fibrosis by dioxin. Toxicol
Sci. 137:114–124. 2014. View Article : Google Scholar
|
|
12
|
Wu D, Nishimura N, Kuo V, Fiehn O, Shahbaz
S, Van Winkle L, Matsumura F and Vogel CF: Activation of aryl
hydrocarbon receptor induces vascular inflammation and promotes
atherosclerosis in apolipoprotein E−/− mice.
Arterioscler Thromb Vasc Biol. 31:1260–1267. 2011. View Article : Google Scholar : PubMed/NCBI
|
|
13
|
Roh E, Kwak SH, Jung HS, Cho YM, Pak YK,
Park KS, Kim SY and Lee HK: Serum aryl hydrocarbon receptor ligand
activity is associated with insulin resistance and resulting type 2
diabetes. Acta Diabetol. 52:489–495. 2015. View Article : Google Scholar
|
|
14
|
Brito JS, Borges NA, Esgalhado M, Magliano
DC, Soulage CO and Mafra D: Aryl hydrocarbon receptor activation in
chronic kidney disease: Role of uremic toxins. Nephron. 137:1–7.
2017. View Article : Google Scholar : PubMed/NCBI
|
|
15
|
Esser C: The aryl hydrocarbon receptor in
immunity: Tools and potential. Methods Mol Biol. 1371:239–257.
2016. View Article : Google Scholar
|
|
16
|
Murray IA, Patterson AD and Perdew GH:
Aryl hydrocarbon receptor ligands in cancer: Friend and foe. Nat
Rev Cancer. 14:801–814. 2014. View
Article : Google Scholar
|
|
17
|
Nukaya M, Moran S and Bradfield CA: The
role of the dioxin-responsive element cluster between the Cyp1a1
and Cyp1a2 loci in aryl hydrocarbon receptor biology. Proc Natl
Acad Sci USA. 106:4923–4928. 2009. View Article : Google Scholar : PubMed/NCBI
|
|
18
|
Uno S, Dalton TP, Sinclair PR, Gorman N,
Wang B, Smith AG, Miller MI, Shertzer HG and Nebert DW: Cyp1a1(−/−)
male mice: Protection against high-dose TCDD-induced lethality and
wasting syndrome, and resistance to intrahepatocyte lipid
accumulation and uroporphyria. Toxicol Appl Pharmacol. 196:410–421.
2004. View Article : Google Scholar : PubMed/NCBI
|
|
19
|
Singh KP, Garrett RW, Casado FL and
Gasiewicz TA: Aryl hydrocarbon receptor-null allele mice have
hematopoietic stem/progenitor cells with abnormal characteristics
and functions. Stem Cells Dev. 20:769–784. 2011. View Article : Google Scholar :
|
|
20
|
Barouki R, Coumoul X and
Fernandez-Salguero PM: The aryl hydrocarbon receptor, more than a
xenobiotic-interacting protein. FEBS Lett. 581:3608–3615. 2007.
View Article : Google Scholar : PubMed/NCBI
|
|
21
|
Mulero-Navarro S and Fernandez-Salguero
PM: New trends in aryl hydrocarbon receptor biology. Front Cell Dev
Biol. 4:452016. View Article : Google Scholar : PubMed/NCBI
|
|
22
|
Moennikes O, Loeppen S, Buchmann A,
Andersson P, Ittrich C, Poellinger L and Schwarz M: A
constitutively active dioxin/aryl hydrocarbon receptor promotes
hepatocarcinogenesis in mice. Cancer Res. 64:4707–4710. 2004.
View Article : Google Scholar : PubMed/NCBI
|
|
23
|
Fan Y, Boivin GP, Knudsen ES, Nebert DW,
Xia Y and Puga A: The aryl hydrocarbon receptor functions as a
tumor suppressor of liver carcinogenesis. Cancer Res. 70:212–220.
2010. View Article : Google Scholar
|
|
24
|
Corchero J, Martín-Partido G, Dallas SL
and Fernández-Salguero PM: Liver portal fibrosis in dioxin
receptor-null mice that overexpress the latent transforming growth
factor-beta-binding protein-1. Int J Exp Pathol. 85:295–302. 2004.
View Article : Google Scholar : PubMed/NCBI
|
|
25
|
Schmidt JV, Su GH-T, Reddy JK, Simon MC
and Bradfield CA: Characterization of a murine Ahr null allele:
Involvement of the Ah receptor in hepatic growth and development.
Proc Natl Acad Sci USA. 93:6731–6736. 1996. View Article : Google Scholar : PubMed/NCBI
|
|
26
|
Lahvis GP, Lindell SL, Thomas RS, McCuskey
RS, Murphy C, Glover E, Bentz M, Southard J and Bradfield CA:
Portosystemic shunting and persistent fetal vascular structures in
aryl hydrocarbon receptor-deficient mice. Proc Natl Acad Sci USA.
97:10442–10447. 2000. View Article : Google Scholar : PubMed/NCBI
|
|
27
|
Jackson DP, Li H, Mitchell KA, Joshi AD
and Elferink CJ: Ah receptor-mediated suppression of liver
regeneration through NC-XRE-driven p21Cip1 expression. Mol
Pharmacol. 85:533–541. 2014. View Article : Google Scholar : PubMed/NCBI
|
|
28
|
Mathew LK, Simonich MT and Tanguay RL:
AHR-dependent misregulation of Wnt signaling disrupts tissue
regeneration. Biochem Pharmacol. 77:498–507. 2009. View Article : Google Scholar :
|
|
29
|
Moreno-Marín N, Barrasa E,
Morales-Hernández A, Paniagua B, Blanco-Fernández G, Merino JM and
Fernández-Salguero PM: Dioxin receptor adjust liver regeneration
after acute toxic injury and protects against liver carcinogenesis.
Sci Rep. 7:104202017. View Article : Google Scholar
|
|
30
|
Knowles BB, Howe CC and Aden DP: Human
hepatocellular carcinoma cell lines secrete the major plasma
proteins and hepatitis B surface antigen. Science. 209:497–499.
1980. View Article : Google Scholar : PubMed/NCBI
|
|
31
|
Choi EY, Lee H, Dingle RWC, Kim KB and
Swanson HI: Development of novel CH223191-based antagonists of the
aryl hydrocarbon receptor. Mol Pharmacol. 81:3–11. 2012. View Article : Google Scholar :
|
|
32
|
Fang Z, Tang Y, Fang J, Zhou Z, Xing Z,
Guo Z, Guo X, Wang W, Jiao W, Xu Z and Liu Z: See comment in PubMed
Commons belowSimvastatin inhibits renal cancer cell growth and
metastasis via AKT/mTOR, ERK and JAK2/STAT3 pathway. PLoS One.
8:e628232013. View Article : Google Scholar
|
|
33
|
Wang K, Li Y, Jiang YZ, Dai CF, Patankar
MS, Song JS and Zheng J: An endogenous aryl hydrocarbon receptor
ligand inhibits proliferation and migration of human ovarian cancer
cells. Cancer Lett. 340:63–71. 2013. View Article : Google Scholar : PubMed/NCBI
|
|
34
|
Yamaguchi M and Daimon Y: Overexpression
of regucalcin suppresses cell proliferation in cloned rat hepatoma
H4-II-E cells: Involvement of intracellular signaling factors and
cell cycle-related genes. J Cell Biochem. 95:1169–1177. 2005.
View Article : Google Scholar : PubMed/NCBI
|
|
35
|
Izumi T and Yamaguchi M: Overexpression of
regucalcin suppresses cell death in cloned rat hepatoma H4-II-E
cells induced by tumor necrosis factor-alpha or thapsigargin. J
Cell Biochem. 92:296–306. 2004. View Article : Google Scholar : PubMed/NCBI
|
|
36
|
Yamaguchi M, Osuka S, Weitzmann MN,
El-Rayes BF, Shoji M and Murata T: Prolonged survival in pancreatic
cancer patients with increased regucalcin gene expression:
Overexpression of regucalcin suppresses the proliferation in human
pancreatic cancer MIA PaCa-2 cells in vitro. Int J Oncol.
48:1955–1964. 2016. View Article : Google Scholar : PubMed/NCBI
|
|
37
|
Yamaguchi M and Isogai M: Tissue
concentration of calcium-binding protein regucalcin in rats by
enzyme-linked immunoadsorbent assay. Mol Cell Biochem. 122:65–68.
1993. View Article : Google Scholar : PubMed/NCBI
|
|
38
|
Vaziri C, Schneider A, Sherr DH and Faller
DV: Expression of AHR is regulated by serum and mitogenic growth
factors in murine 3T3 fibroblasts. J Biol Chem. 271:25921–25927.
1996. View Article : Google Scholar : PubMed/NCBI
|
|
39
|
Umannová L, Zatloukalová J, Machala M,
Krcmár P, Májková Z, Hennig B, Kozubík A and Vondrácek J: Tumor
necrosis factor-α modulates effects of aryl hydrocarbon receptor
ligands on cell proliferation and expression of cytochrome P450
enzymes in rat liver 'stem-like' cells. Toxicol Sci. 99:79–89.
2007. View Article : Google Scholar
|
|
40
|
Tsurusaki Y and Yamaguchi M: Role of
regucalcin in liver nuclear function: Binding of regucalcin to
nuclear protein or DNA and modulation of tumor-related gene
expression. Int J Mol Med. 14:277–281. 2004.PubMed/NCBI
|
|
41
|
Yamaguchi M: Suppressive role of
regucalcin in liver cell proliferation: Involvement in
carcinogenesis. Cell Prolif. 46:243–253. 2013. View Article : Google Scholar : PubMed/NCBI
|
|
42
|
Tang SC and Chen YC: Novel therapeutic
targets for pancreatic cancer. World J Gastroenterol.
20:10825–10844. 2014. View Article : Google Scholar : PubMed/NCBI
|
|
43
|
Vogel CFA, Wu D, Goth SR, Baek J, Lollies
A, Domhardt R, Grindel A and Pessah IN: Aryl hydrocarbon receptor
signaling regulates NF-κB RelB activation during dendritic-cell
differentiation. Immunol Cell Biol. 91:568–575. 2013. View Article : Google Scholar : PubMed/NCBI
|
|
44
|
Han M, Liu X, Liu S, Su G, Fan X, Chen J,
Yuan Q and Xu G: 2,3,7,8-Tetrachlorodibenzo-p-dioxin (TCDD) induces
hepatic stellate cell (HSC) activation and liver fibrosis in C57BL6
mouse via activating Akt and NF-κB signaling pathways. Toxicol
Lett. 273:10–19. 2017. View Article : Google Scholar : PubMed/NCBI
|
|
45
|
Jennen D, Ruiz-Aracama A, Magkoufopoulou
C, Peijnenburg A, Lommen A, van Delft J and Kleinjans J:
Integrating transcriptomics and metabonomics to unravel
modes-of-action of 2,3,7,8-tetrachlorodibenzo-p-dioxin (TCDD) in
HepG2 cells. BMC Syst Biol. 5:1392011. View Article : Google Scholar : PubMed/NCBI
|
|
46
|
Nejak-Bowen KN, Zeng G, Tan X, Cieply B
and Monga SP: Beta-catenin regulates vitamin C biosynthesis and
cell survival in murine liver. J Biol Chem. 284:28115–28127. 2009.
View Article : Google Scholar : PubMed/NCBI
|
|
47
|
Yamaguchi M, Osuka S, Weitzmann MN,
El-Rayes BF, Shoji M and Murata T: Prolonged survival in
hepatocarcinoma patients with increased regucalcin gene expression:
HepG2 cell proliferation is suppressed by overexpression of
regucalcin in vitro. Int J Oncol. 49:1686–1694. 2016. View Article : Google Scholar : PubMed/NCBI
|