Introduction
Gastric cancer is one of the most common types of
cancer, with high incidence rates in the Asia-Pacific region. In
addition, it is the third most common cause of cancer-associated
mortality in this region (1);
notably, high incidence rates of gastric cancer have been reported
in China, Korea and Japan in the 20th century, and gastric cancer
remains a key cause of morbidity and mortality worldwide (2,3).
Gastric cancer has been ranked second in the top 10 most common
cancer types, and third in the primary causes of cancer-associated
mortality in China (2). Therefore,
there is an urgent need to identify and study novel targets for
gene therapy, and to determine their clinical significance in early
diagnosis and prognostic estimates. Coatomer protein complex
subunit β2 (COPB2) is a subunit of a typical cytoplasmic protein
complex, which binds dilysine motifs and associates with
Golgi-derived nonclathrin-coated vesicles. COPB2 functions as a
mediator to transport proteins from the endoplasmic reticulum to
the Golgi apparatus in the process of protein biosynthesis
(4). It has previously been
reported that COPB2 may be a target gene in prostate cancer cell
lines (5), whereby silencing COPB2
inhibits cell proliferation, arrests the cell cycle at
G1 and G2 phases, and induces apoptosis. RNA
interference (RNAi)-mediated knockdown of COPB2 has also been
observed to significantly inhibit the growth and invasion of
pulmonary cancer A549 cells (6).
Furthermore, knockdown of COPB2 inhibits the growth and colony
formation ability of human colon cancer cell lines, including RKO
and HCT116, and leads to cell cycle arrest at
G0/G1 or S phases via regulating cell
cycle-associated proteins (7).
These previous findings suggested that COPB2 may be considered a
promising target for cancer gene therapy. However, to the best of
our knowledge, the significance and function of COPB2 in gastric
cancer remains unknown. Therefore, there is an urgent requirement
to investigate the effects of silencing COPB2 on the cancerous
phenotype of gastric cancer cells to elucidate its role in gastric
cancer tumorigenesis, and to explore the possibility of uncovering
a novel potential biomarker and target gene for therapy.
In the present study, lentivirus-short hairpin RNA
(shRNA) COPB2 (Lv-shCOPB2) was designed and constructed, and
transduced into gastric cancer BGC-823 cells, in order to analyze
the effects of COPB2 knockdown on the cancerous phenotype. Briefly,
MTT, 5-bromo-2-deoxyuridine (BrdU) and colony formation assays were
used to detect cell proliferation, and flow cytometry was conducted
to analyze apoptosis. In addition, to characterize the regulatory
role of COPB2 in tumor growth in vivo, a nude mouse model
was constructed and fluorescence imaging was conducted, and COPB2
expression was detected in xenograft tumor tissues using reverse
transcription-quantitative polymerase chain reaction (RT-qPCR) and
immunohistochemistry. In addition, a receptor tyrosine kinase (RTK)
signaling pathway antibody array was used to determine the
molecular mechanisms underlying the effects of COPB2 knockdown.
Materials and methods
Cell lines and culture conditions
The gastric cancer cell lines, BGC-823, SGC-7901,
MGC-803 and MKN45, were purchased from the Type Culture Collection
of Cancer Institute and Hospital, Chinese Academy of Medical
Sciences (Beijing, China). The normal gastric mucous membrane
epithelial cell line, GES-1, was purchased from OBiO Technology
(Shanghai) Corp., Ltd. (Shanghai, China). All cell lines were
cultured in Dulbecco's modified Eagle's medium (Gibco; Thermo
Fisher Scientific, Inc., Waltham, MA, USA) supplemented with 100
IU/ml penicillin, 100 µg/ml streptomycin and 10%
heat-inactivated fetal bovine serum (Zhejiang Tianhang
Biotechnology Co. Ltd., Hangzhou, China). The cells were maintained
in a humidified incubator at 37°C in an atmosphere containing 5%
CO2. Gastric cancer cells in the exponential growth
phase were used for subsequent experiments.
Lentiviral transduction of BGC-823
cells
Human gastric cancer BGC-823 cells were seeded in
6-well plates at 5×10⁴ cells/well and incubated at 37°C
until 30% confluence was reached. Cells were then divided into the
lentivirus-short hairpin RNA (shRNA) control group (Lv-shCtrl),
where cells were infected with empty green fluorescent protein
(GFP) lentiviruses (sequence:
5′-CCGGTTCTCCGAACGTGTCACGTTTCAAGAGAACGTGACACGTTCGGAGAATTTTTG-3′),
and the Lv-shCOPB2 (sequence:
5′-CCGGGCAGATTAGAGTGTTCAATTACTCGAGTAATTGAACACTCTAATCTG CTTTTT-3′)
group, where cells were infected with GFP-tagged Lv-shCOPB2
lentiviruses. Lentviruses were purchased from Shanghai GeneChem
Co., Ltd. (Shanghai, China). A suitable amount of lentivirus
(multiplicity of infection, 10) was added to the culture medium of
BGC-823 cells for transduction, according to the multiplicity of
infection, and the cells were incubated for a further 8 h. The
medium containing lentiviruses was then removed and the cells were
cultured in normal culture medium for 12 h. GFP expression was
observed under a fluorescence microscope 3 days following
infection, and gastric cancer cells with an infection efficiency of
>80% were selected for subsequent analyses. Cells were harvested
48 h post-transduction for further analysis.
Expression of COPB2 mRNA and detection of
transduction efficiency by RT-qPCR analysis
To determine the expression of COPB2 in gastric
cancer cells and to confirm the silencing efficiency of COPB2
knockdown in BGC-823 cells, RT-qPCR analysis was conducted.
Briefly, gastric cancer cells in the exponential growth phase, and
BGC-823 cells infected with Lv-shCOPB2 or Lv-shCtrl, were collected
and lysed for total RNA extraction using the RNAiso Plus kit
(Takara Biotechnology Co., Ltd., Dalian, China). RNA purity and
concentration were determined using the NanoDrop-2000
spectrophotometer (NanoDrop; Thermo Fisher Scientific, Inc.,
Wilmington, DE, USA). Total RNA was reverse transcribed using the
Prime Script™ RT Reagent kit (Takara Biotechnology Co., Ltd.),
according to manufacturer's protocol at 37°C for 15 min and 85°C
for 20 sec. Subsequently, PCR amplification was performed using the
SYBR® Premix Ex Taq™ Master Mix (Takara Biotechnology
Co., Ltd.) and the Bio-Rad CFX96 Real-time PCR system (Bio-Rad
Laboratories, Inc., Hercules, CA, USA). The primers used were as
follows: COPB2, forward 5′-GTGGGGACAAGCCATACCTC-3′, reverse
5′-GTGCTCTCAAGCCGGTAGG-3′; and GAPDH, forward
5′-TGACTTCAACAGCGACACCCA-3′ and reverse
5′-CACCCTGTTGCTGTAGCCAAA-3′. PCR was performed on a final volume of
10 µl, comprising 2 µl cDNA, 0.5 mM of each primer
and 1X SYBR® Premix Ex Taq™ Master Mix. The
amplification program was as follows: Initial denaturation step at
95°C for 10 min, followed by 40 cycles at 95°C for 10 sec, 60°C for
30 sec and 72°C for 30 sec, where fluorescence signals were
acquired. Amplification was followed by a melting curve analysis,
which was used to determine the dissociation characteristics of the
PCR products. Each sample was run in triplicate and the mRNA
expression levels of COPB2 were calculated relative to the internal
reference gene, GAPDH, using the 2−ΔΔCq method (8).
Cell proliferation analysis
Following transduction, cells from both groups were
trypsinized and counted. Cells (3×10³ cells/well) were
plated in each well of a 96-well plate (five replicate wells for
each group) and incubated at 37°C for 24, 48, 72, 96 and 108 h. The
cell counts were monitored over 5 consecutive days. Briefly, 20
µl MTT (5 µmol/l; Sigma-Aldrich; Merck KGaA,
Darmstadt, Germany) dissolved in PBS was added to each well, and
the cells were incubated at 37°C for 4 h. Cells were subsequently
centrifuged at 1,000 × g for 2 min before the medium was removed
and 150 µl dimethyl sulfoxide was added to each well. After
incubation at 37°C for 5 min, the absorbance was measured using a
Benchmark microtiter plate reader (Bio-Rad Laboratories, Inc.) at a
wavelength of 490 nm.
BrdU assay
BGC-823 gastric cancer cells in the Lv-shCtrl and
Lv-shCOPB2 groups were seeded into triplicate wells of a 96-well
plate at 2×10⁴ cells/well with 100 µl complete
medium. The following day, 20 µmol/ml BrdU (Roche
Diagnostics, Shanghai, China) was added to the cultured cells
before they were incubated with complete medium for a sufficient
culture time (≤24 h). The culture medium was discarded, 200
µl FixDenat (Roche Diagnostics) was added to each well and
cells were fixed for 30 min in the dark at room temperature.
Following removal of the fixation solution, 10% bovine serum
albumin (BSA: Zhejiang Tianhang Biotechnology Co. Ltd.) was added
to block the cells for 30 min at room temperature in the dark. An
anti-BrdU monoclonal antibody (dilution, 1:100; cat. no.
11669915001; Roche Diagnostics) with peroxidase activity was then
added to the cells, which were incubated for 90 min at room
temperature in the dark. The cells were subsequently washed three
times with washing buffer, and the substrate solution (Component A
containing luminol and 4-iodophenol + Component B containing a
stabilized form of H2O2) was added (100
µl/well) for ~30 min at room temperature in the dark until
the solution became blue in color. H2SO4
(10%; 50 µl) was added to each well for colorimetry. The
optical density was measured using a spectrophotometer microplate
reader (Tecan Group, Ltd., Mannedorf, Switzerland) at 450/550 nm.
Each data point was calculated from the average of six replicates
and each experiment was repeated in triplicate.
Colony formation assay
BGC-823 gastric cancer cells in the Lv-shCtrl and
Lv-shCOPB2 groups were digested in 0.25% trypsin and diluted to a
concentration of 5×10⁴ cells/ml. A hemocytometer was
used to count the cells, and cell suspensions were seeded into
6-well plates at 400 cells/well. The medium was refreshed every 3
days, and cell growth was observed as normal. A total of 14 days
after the cells were seeded, or at the point where the number of
cells in each colony reached >50, the colonies were visualized
under a fluorescence microscope. Cells were washed with PBS and
fixed with 4% paraformaldehyde for 30 min at room temperature. The
fixed cells were stained with 500 µl Giemsa (Beijing Dingguo
Changsheng Biotechnology Co., Ltd., Beijing, China) for 20 min,
washed with ddH2O and air-dried at room temperature. The
total number of colonies with >50 cells were counted, and images
were captured using light and fluorescence microscopes. The assay
was repeated three times.
Quantification of apoptosis by flow
cytometry
Cells were harvested using 0.25% trypsin and washed
once with ice-cold (4°C) D-Hanks solution (pH 7.2-7.4). Cells were
centrifuged at 300 × g for 5 min and washed with 1X binding buffer
(eBioscience™ Annexin V Apoptosis Detection kit APC; cat, no.
88-8007; eBioscience; Thermo Fisher Scientific, Inc.), prior to
further centrifugation at 300 × g for 3 min. The cells were then
resuspended in 200 µl binding buffer to a final
concentration of 106 cells/ml for subsequent analysis.
The cell suspension (100 µl) was mixed with 10 µl APC
Annexin V (Apoptosis Detection kit; eBioscience; Thermo Fisher
Scientific, Inc.) and incubated in the dark for 15 min at room
temperature. If necessary, 400-800 µl 1X binding buffer was
added to the stained cells, according to the quantity of cells. The
percentage of apoptotic cells was analyzed by flow cytometry
(Guava® easyCyte 6HT; EMD Millipore, Billerica, MA,
USA). This assay was repeated in triplicate.
Tumorigenesis in nude mice and in vivo
imaging
Male BALB/c nude mice (n=20; weight, 15-19 g; age, 4
weeks; Shanghai Lingchang Biotechnology Co., Ltd., Shanghai, China)
were maintained under the following conditions: Temperature,
22-24°C, humidity, 40-70%; ad libitum food/water access;
artificial feeding for 2-3 days; 12-h light/dark cycle). Eligible
nude mice were inoculated with Lv-shCOPB2-infected and
Lv-shCtrl-infected BGC-823 cells. Briefly, a total of 20 mice were
divided into two equal groups at random. BGC-823 cells from both
groups were resuspended in physiological saline solution at a
density of 5×10⁷ cells/ml before a 0.2 ml cell
suspension was injected subcutaneously into the mice using a
6-gauge, 1 ml syringe. The mice were maintained until the tumors
were visible, and tumor diameter and size were measured 8, 11, 14,
16 and 18 days following inoculation. Tumor volume was monitored
frequently and was recorded on days 8, 11, 14, 16 and 18; volume
was calculated using the following formula for hemi-ellipsoids:
Volume = length (cm) x width (cm) x height (cm) x 3.14/6. At 28
days following inoculation of the gastric cancer cells, the mice
were injected intraperitoneally with 10 µl/g D-Luciferin
(Shanghai Yeasen Biotechnology Co., Ltd., Shanghai, China). After
15 min, 70 mg/kg pentobarbital sodium was injected
intraperitoneally to anesthetize the mice. A few minutes later, the
anesthetized mice were placed under a small animal live imaging
system (LT Lumina; PerkinElmer, Inc., Waltham, MA, USA) to observe
the fluorescence results. The mice were then sacrificed, and the
tumors were dissected and photographed. All animal experiments were
performed in strict accordance with international ethical
guidelines and the National Institutes of Health Guide for the Care
and Use of Laboratory Animals (9).
The experiments were authorized and approved by the Institutional
Animal Care and Use Committee of Gansu University of Chinese
Medicine (Lanzhou, China).
Detection of COPB2 mRNA and protein
expression in xenograft tumor tissues
The mRNA and protein expression levels of COPB2 were
detected in xenograft tumor tissues to validate knockdown of COPB2
in gastric cancer cells. After the mice were sacrificed, the
xenograft tumor tissues from both groups were dissected and
collected for further detection of COPB2 mRNA and protein
expression. Fresh tumor tissues were stored at −80°C. COPB2 mRNA
expression was detected using RT-qPCR analysis, as aforementioned.
In addition, different tumor tissue sections were immediately fixed
in 4% paraformaldehyde for 12 h at room temperature and embedded in
paraffin for subsequent histological and immunohistochemical
analysis of COPB2. To perform immunohistochemical analysis, tissues
from both groups were deparaffinized and cut into thin sections (5
µm). All sections were rehydrated and heated for antigen
retrieval with 0.3% H2O2 for 30 min. Prior to
staining, non-specific binding was blocked by incubation with 10%
BSA in PBS at 37°C for 1 h. The section slides were then incubated
with an anti-COPB2 primary antibody (dilution, 1:200; cat. no.
HPA036867, Sigma-Aldrich; Merck KGaA) at 4°C overnight. The
following day, slides were incubated with a biotin-conjugated
secondary antibody (dilution, 1:100; cat. no. TA130016; OriGene
Technologies, Inc., Rockville, MD, USA) for ~2 h at room
temperature. Subsequently, horseradish enzyme (HRP) labeled
streptavidin was added for 15 min to form a complex and
3,3′-diaminobenzidine solution was added to detect HRP activity.
The tissue sections were also stained with hematoxylin and eosin
(H&E) for 10 min at 37°C to analyze the growth of xenograft
tumor tissues with a microscope (Leica DM2700M; Leica Microsystems
GmbH, Wetzlar, Germany). The staining percentage was graded as
follows: 0 (0-5%), 1 (6-20%), 2 (21-60%) and 3 (61-100%), and the
staining intensity was graded as follows: 0 (negative), 1 (weak), 2
(moderate) and 3 (strong). The final sum of the staining percentage
and intensity scores was considered the staining score (0-6).
Tumors with final staining scores of 0, 1, 2-4 and 5 or 6 were
considered negative (−), slightly positive (+), moderately positive
(++) and strongly positive (+++), respectively; the method was
described in previous reports (10,11).
PathScan® RTK signaling
antibody array assay
To investigate the activation of intracellular
signaling pathways associated with tumor growth, the
PathScan® RTK Signaling Antibody array (Cell Signaling
Technology, Inc., Danvers, MA, USA) was used, according to the
manufacturer's protocol. This antibody array is a slide-based
antibody array that uses the sandwich immunoassay principle for the
detection of signaling nodes and downstream target nodes that have
undergone phosphorylation of tyrosine or other residues. Briefly, a
total of 5 days post-lentiviral infection, BGC-823 cells were
collected and lysed. Detection of COPB2-silenced and negative
control cells was performed in triplicate. Images were captured by
briefly exposing the slide to obtain the chemiluminescent film
signal at all sites of the array slide, and aberrantly expressed
protein targets were compared and calculated between two
groups.
Statistical analysis
All experimental data are expressed as the means ±
standard deviation from at least three separate experiments.
Statistical analyses were performed using a Student's two-tailed
t-test or one-way analysis of variance, and Dunnett method was used
to test multiple comparisons. P<0.05 was considered to indicate
a statistically significant difference, and all statistical
analyses were performed using SPSS 17.0 software (SPSS Inc.,
Chicago, IL, USA).
Results
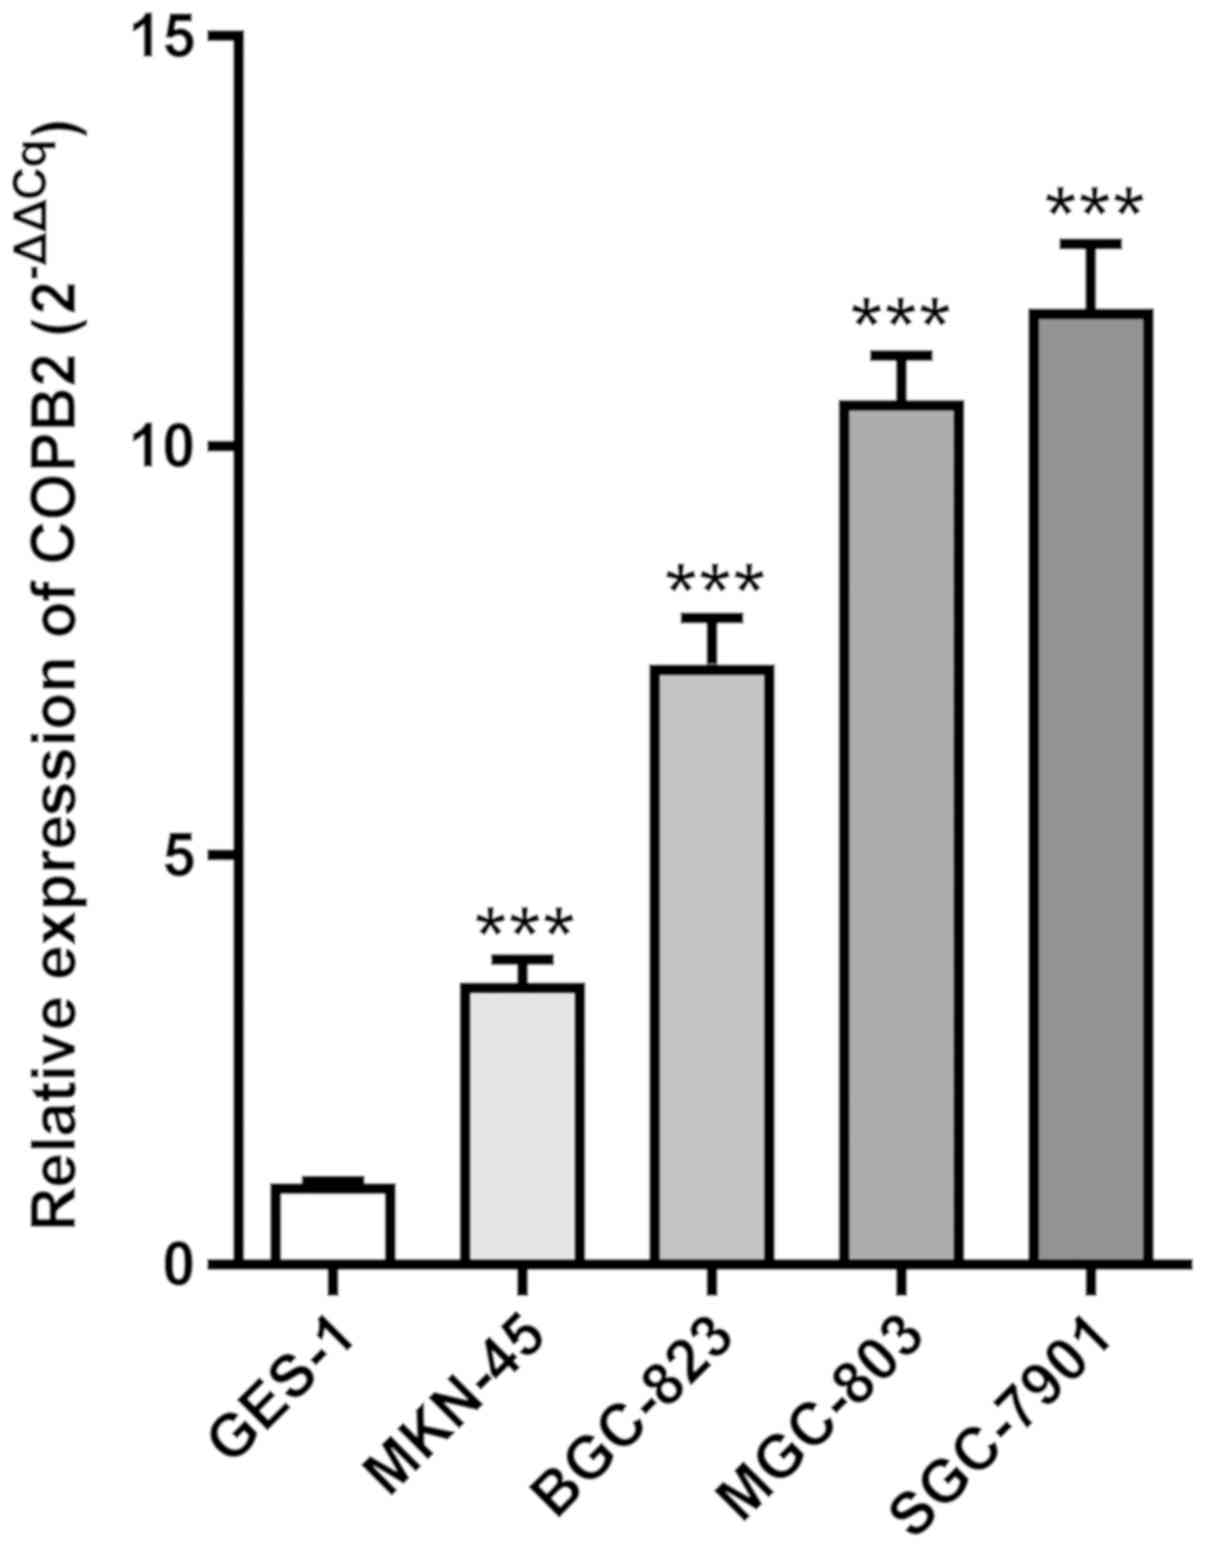
COPB2 is upregulated in gastric cancer
cell lines
To investigate COPB2 expression in gastric cancer
cell lines, RT-qPCR analysis was employed to analyze its expression
in four gastric cancer cell lines (BGC-823, SGC-7901, MGC-803 and
MKN45) and the normal gastric mucous membrane epithelial cell line,
GES-1. The results demonstrated that COPB2 mRNA expression was
increased in all four gastric cancer cell lines compared with in
the GES-1 cell line (Fig. 1).
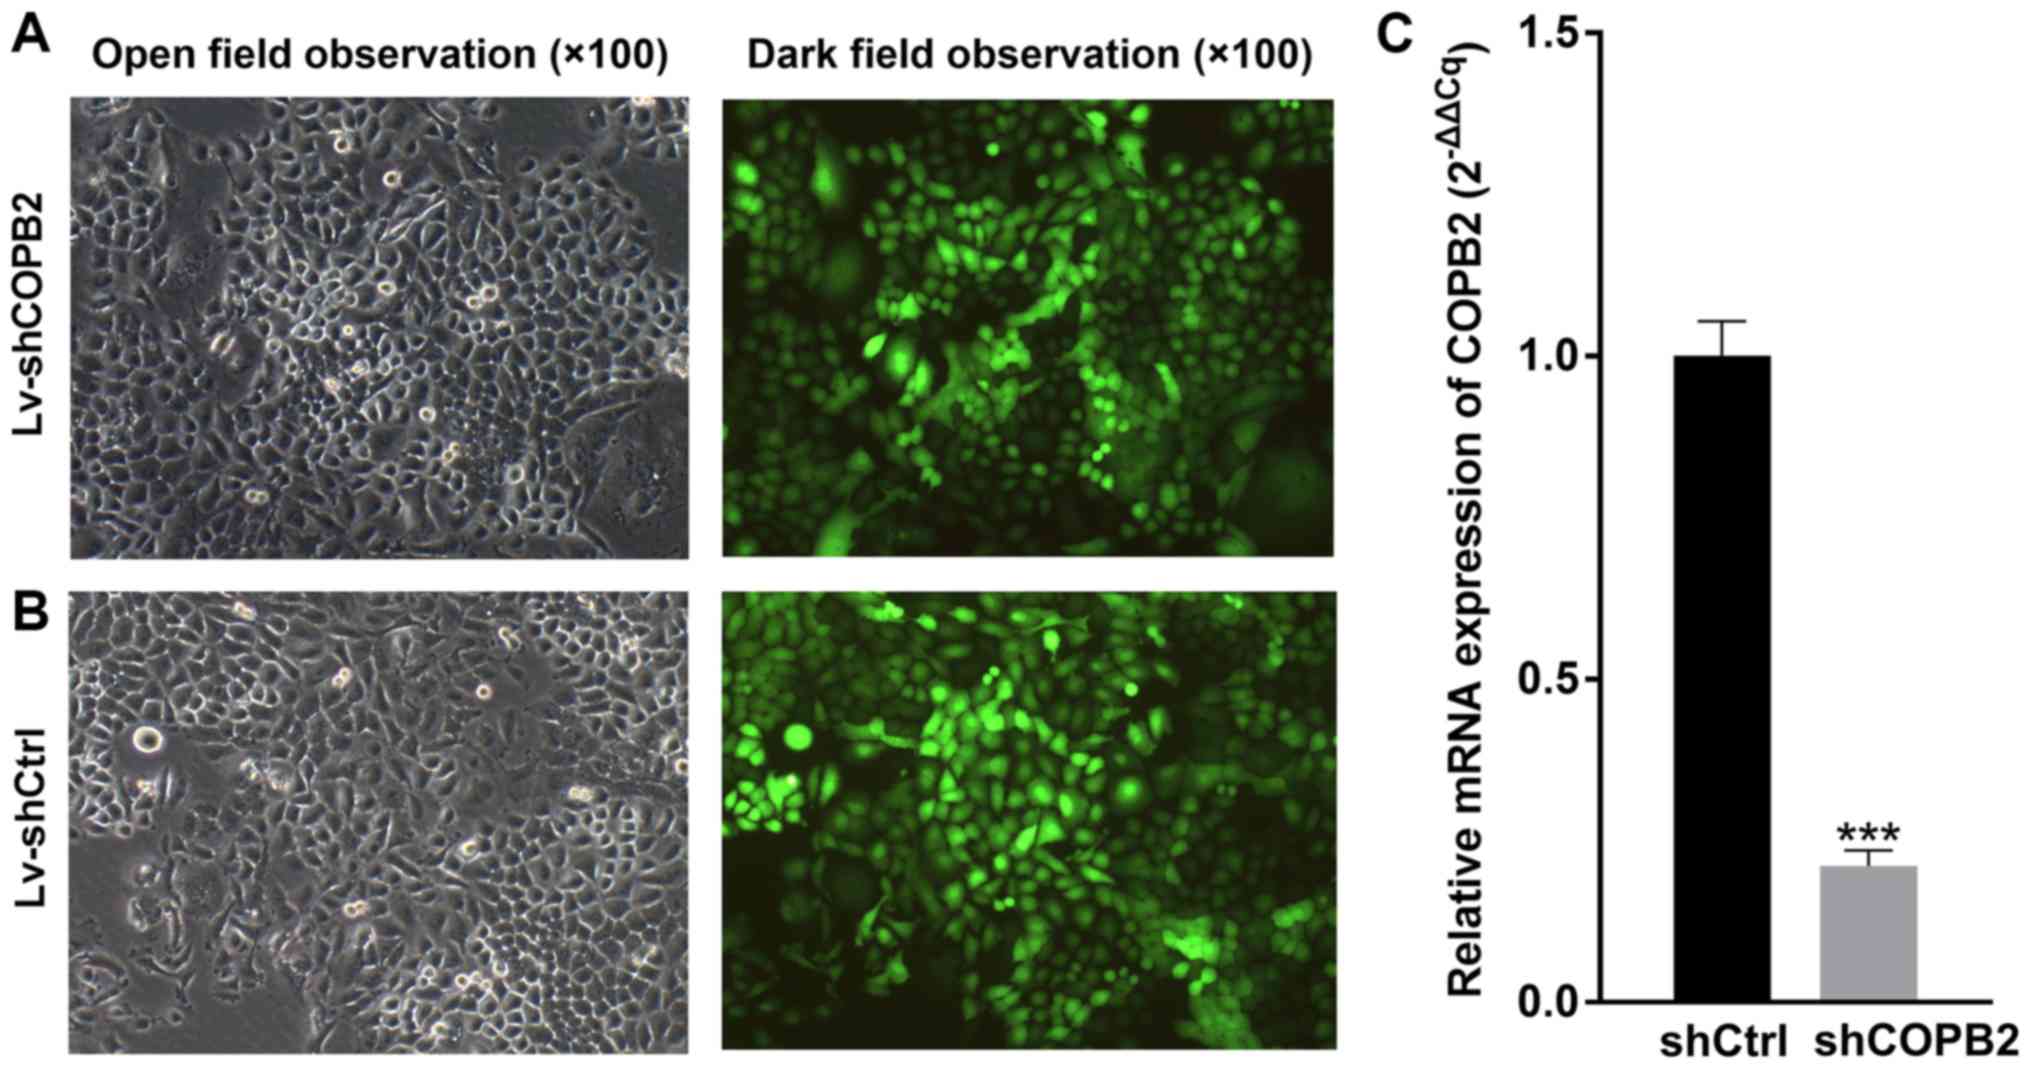
Efficiency of shRNA-mediated COPB2
knockdown in gastric cancer cells
BGC-823 cells infected with Lv-shCtrl or Lv-shCOPB2
were observed under a fluorescence microscope to determine
infection efficiency, and the infection rate was measured by
monitoring GFP fluorescence emitted by cells. The results indicated
that the infection efficiency was >80% (Fig. 2A and B). As determined by RT-qPCR
analysis, the mRNA expression levels of COPB2 were significantly
decreased in the Lv-shCOPB2 group, with a knockdown efficiency of
78.9% (P<0.01; Fig. 2C). These
findings indicated that lentivirus-mediated targeting of COPB2
effectively silenced COPB2 expression in the BGC-823 gastric cancer
cell line.
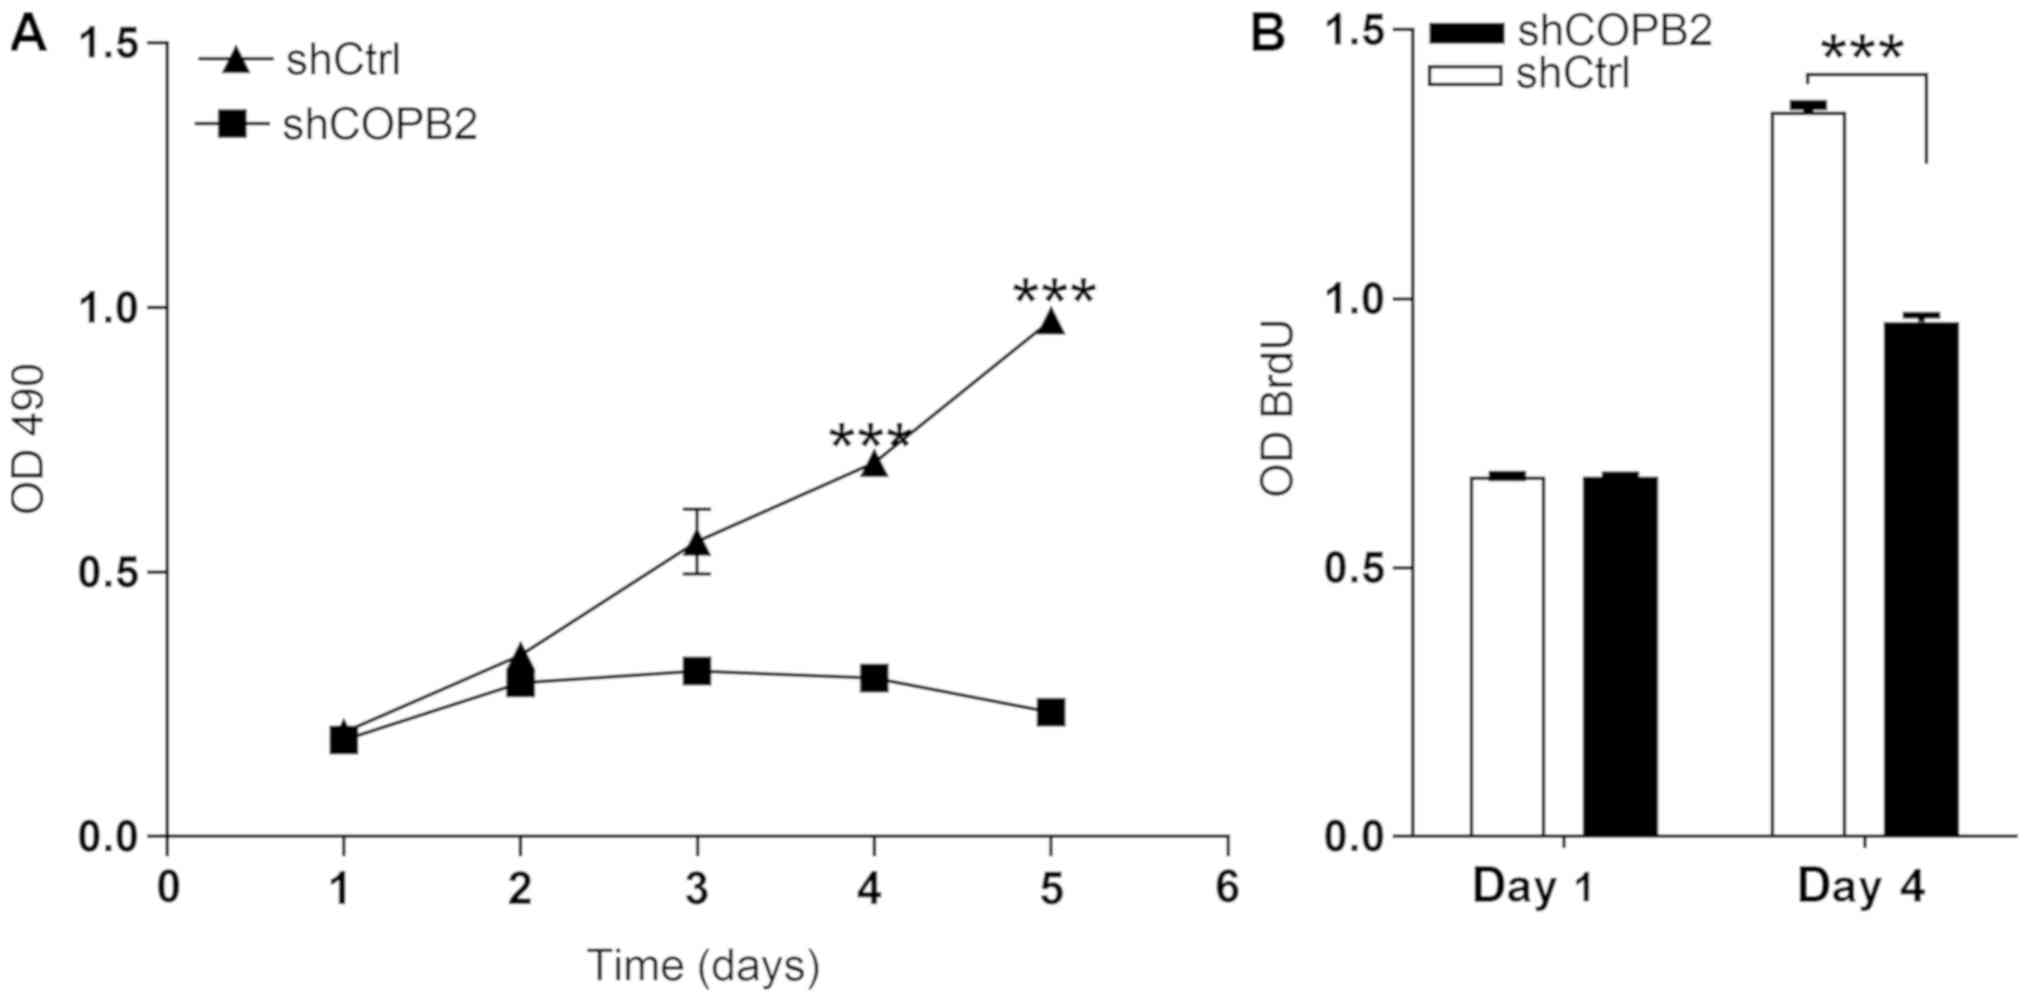
COPB2 silencing inhibits gastric cancer
cell proliferation
The MTT assay results demonstrated that the number
and fold-change in proliferation of cells in the Lv-shCOPB2 group
was markedly reduced when compared with the Lv-shCtrl group at 4
and 5 days following transduction of BGC-823 cells (P<0.05;
Fig. 3A). These findings suggested
that knockdown of COPB2 may be associated with a reduction in cell
proliferation. The BrdU thymidine analog naturally incorporates
into the DNA of proliferating cells during cell division. In the
present study, the effects of COPB2 knockdown on BrdU incorporation
were measured. Cell proliferation in the Lv-shCOPB2 group was
significantly reduced compared with the in Lv-shCtrl group at 4
days following transduction (P<0.05; Fig. 3B). Therefore, the results of the
BrdU incorporation assay indicated that inhibition of COPB2
expression may significantly suppress the proliferation of BGC-823
cells.
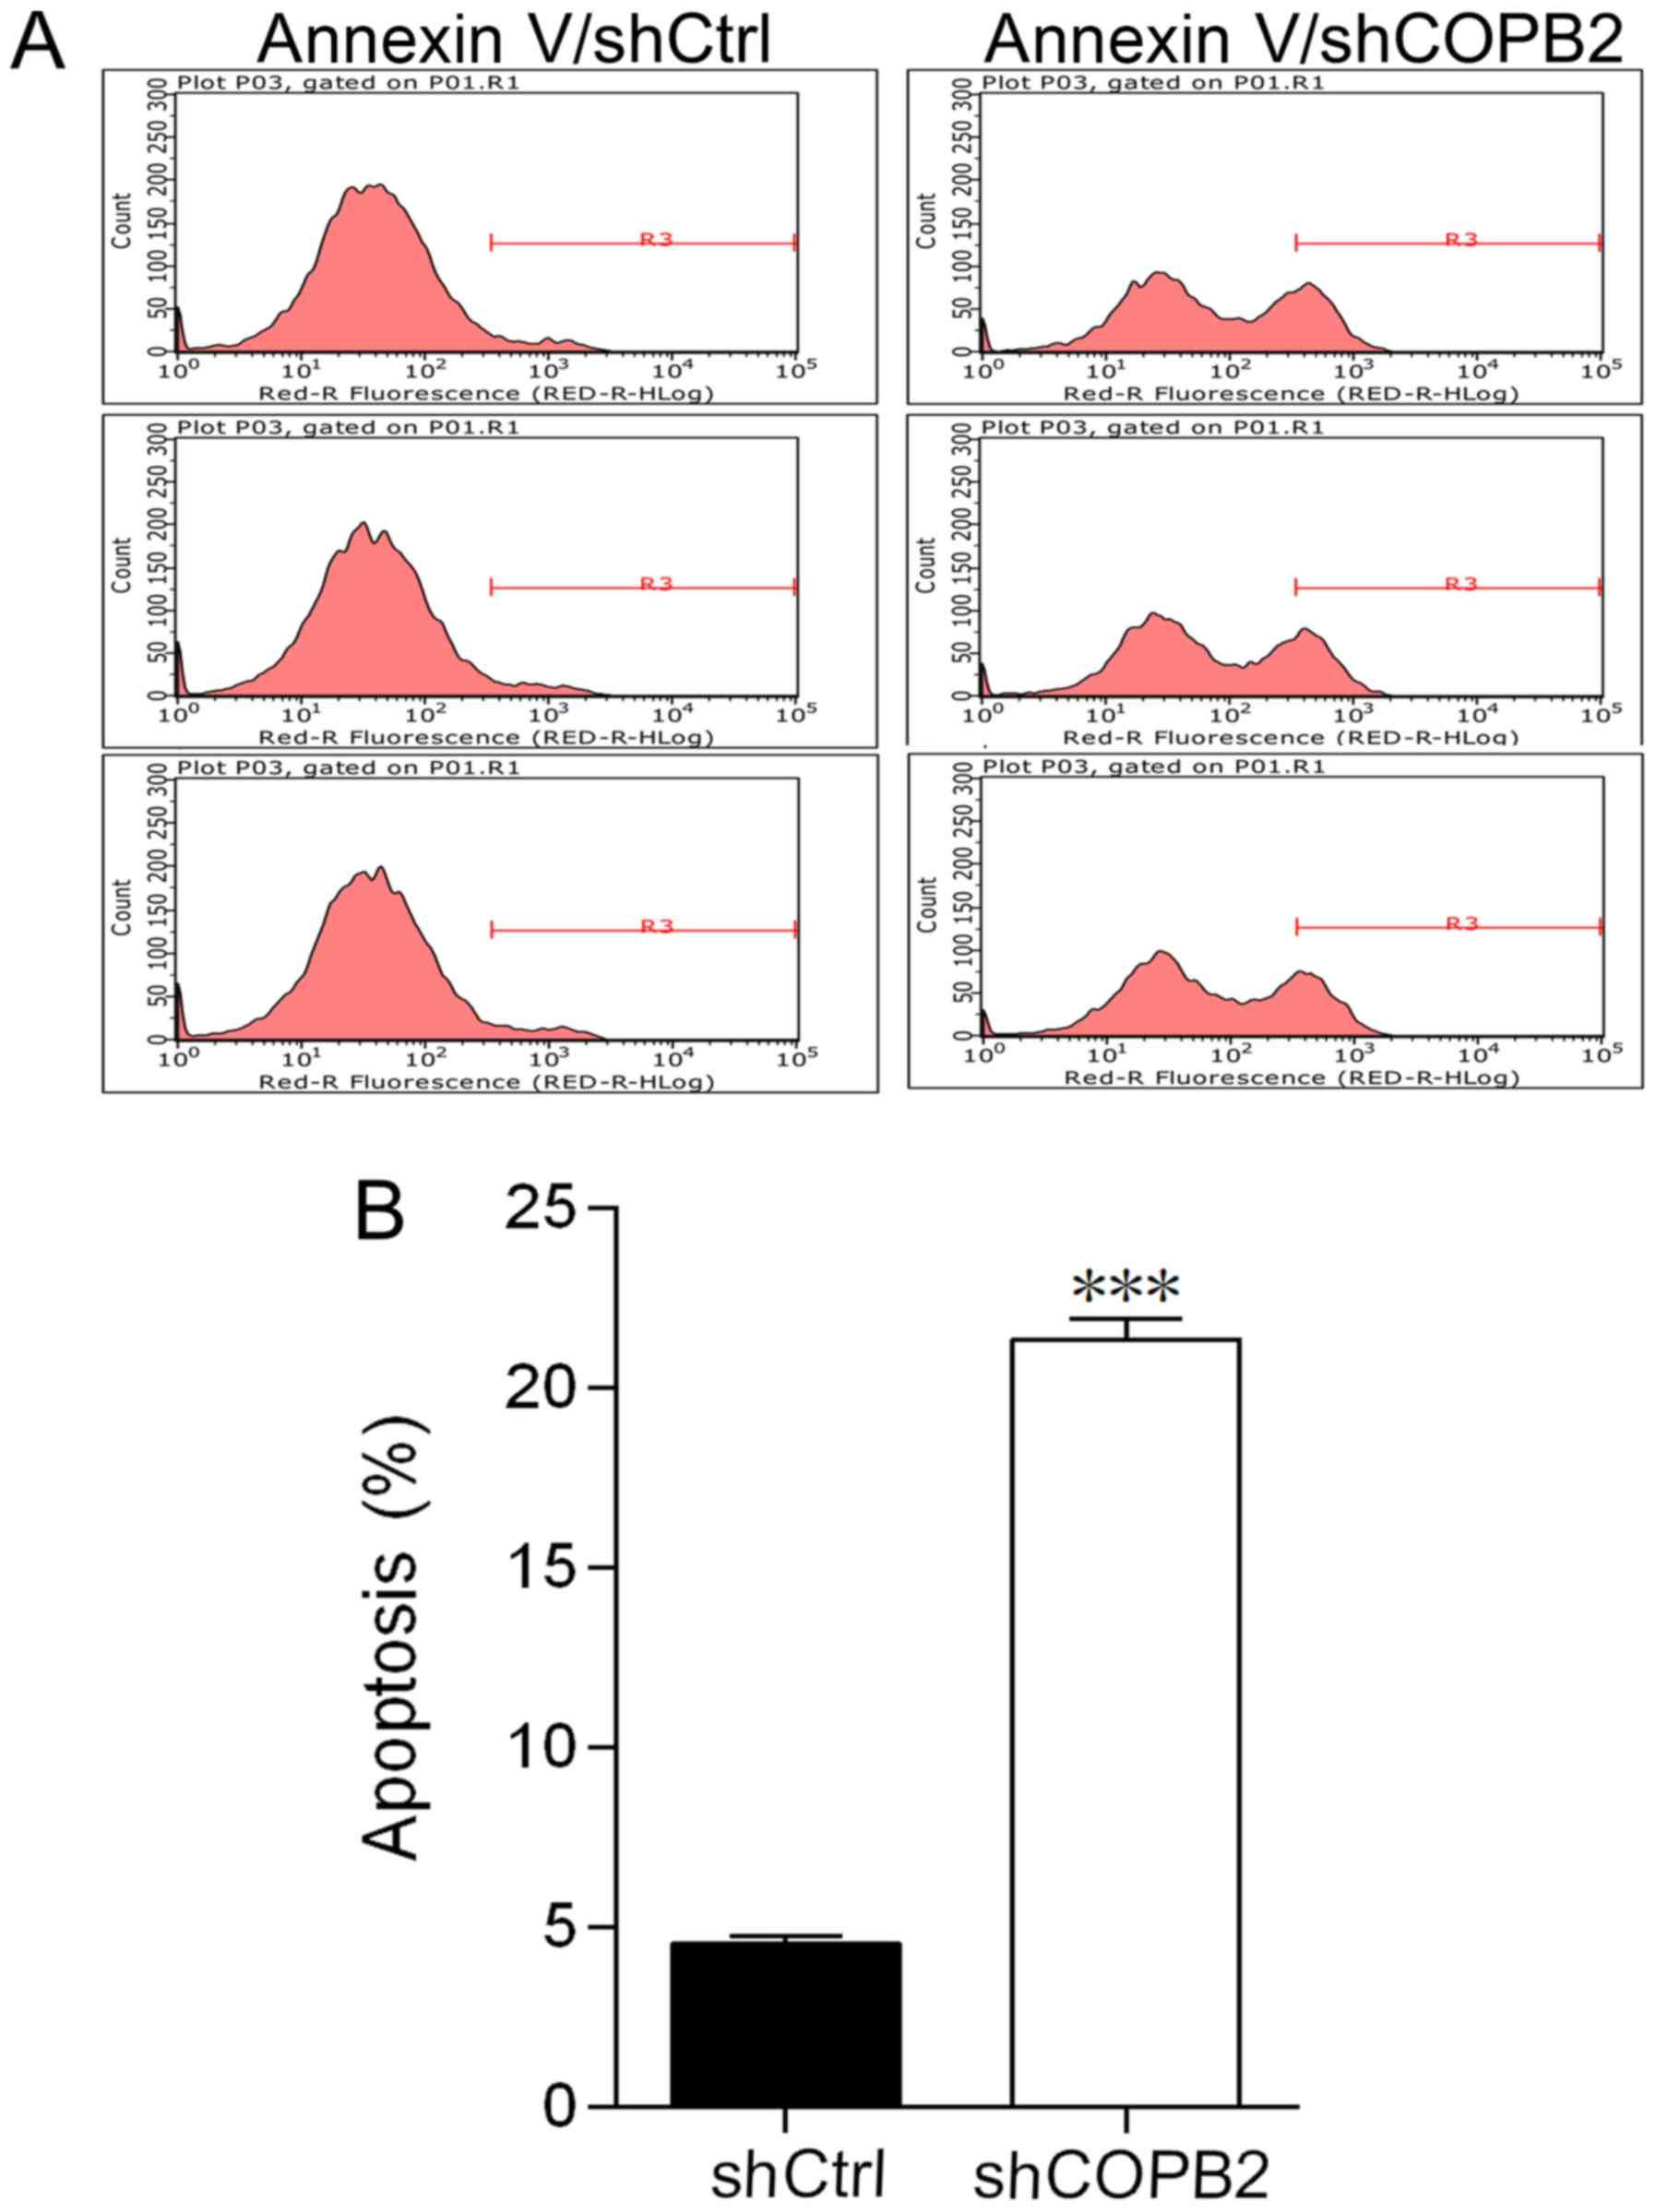
COPB2 silencing induces cell
apoptosis
In order to investigate the effects of COPB2
knockdown on apoptosis of BGC-823 cells, the levels of apoptosis
were compared in Lv-shCOPB2 and Lv-shCtrl groups. The apoptotic
rate was measured and evaluated by flow cytometry. The percentage
of apoptotic BGC-823 cells in the Lv-shCOPB2 group was
significantly higher compared with in the Lv-shCtrl group
(P<0.001; Fig. 4A and B). These
results suggested that knockdown of COPB2 may affect cell survival
and induce apoptosis.
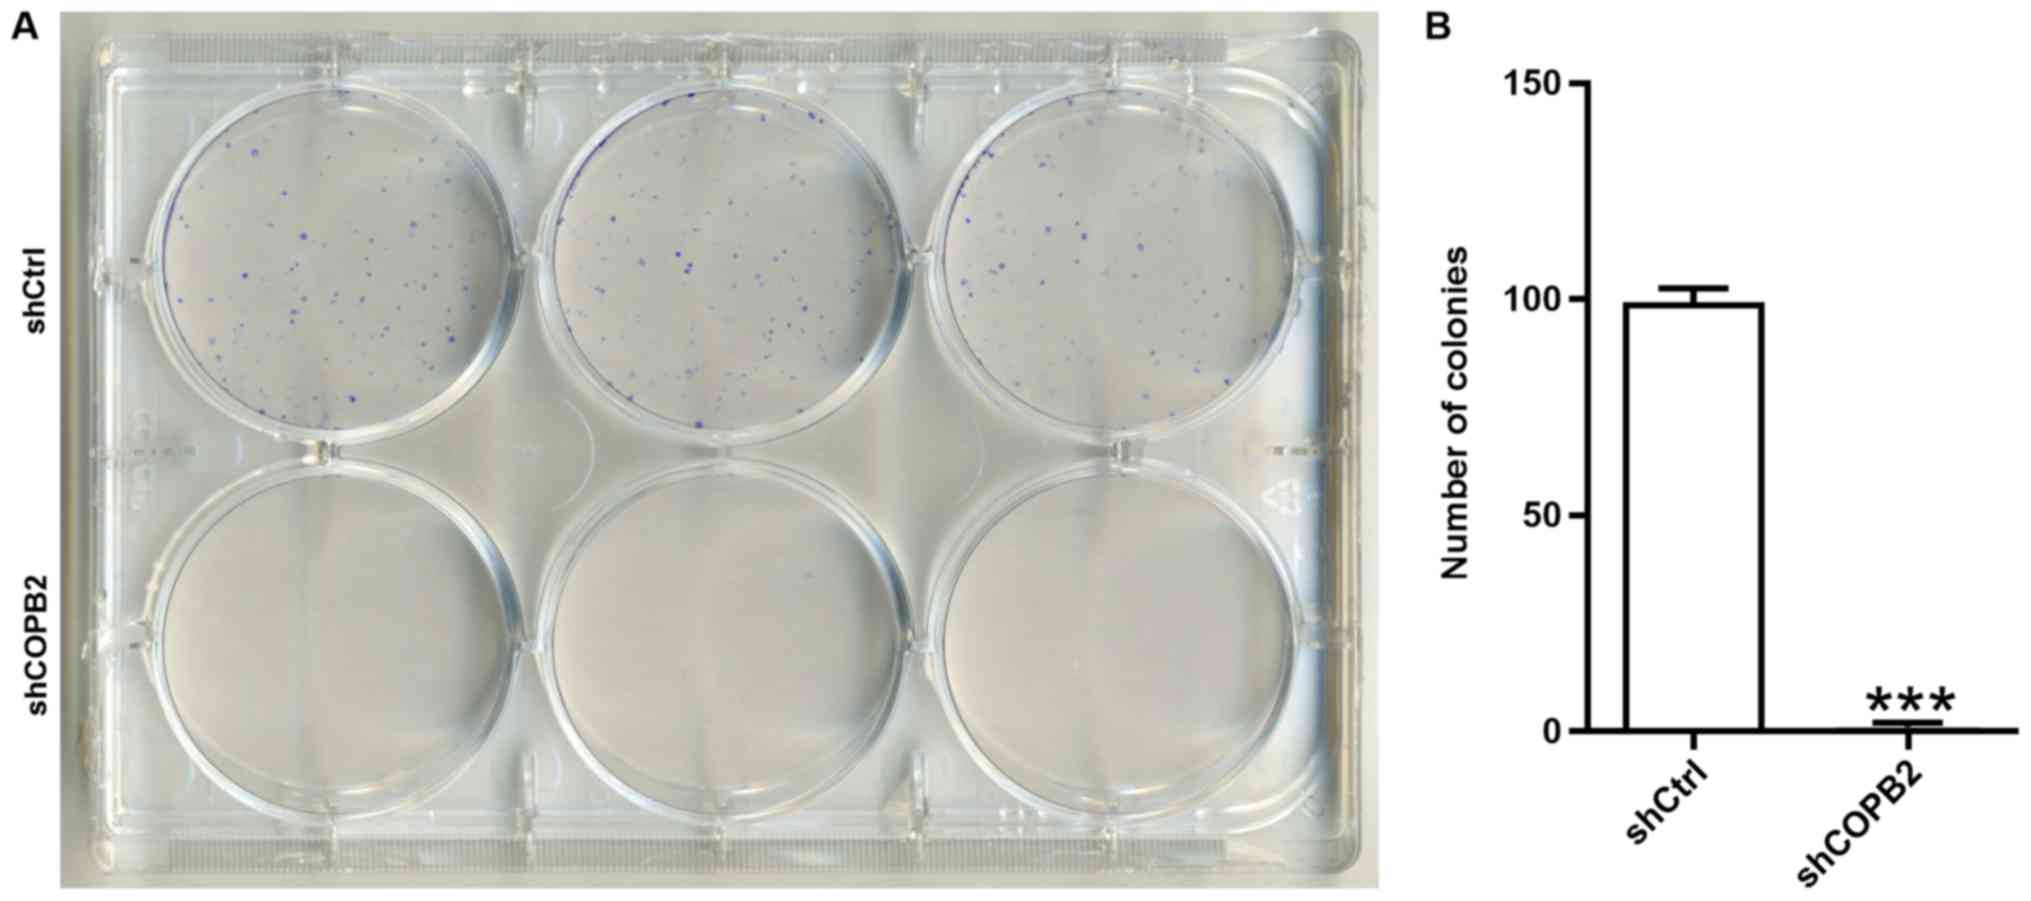
COPB2 silencing reduces gastric cancer
cell colony formation
A colony formation assay is used to assess the
proliferative potential of cells. In the present study, the colony
formation assay results demonstrated that the Lv-shCOPB2 group
formed significantly fewer colonies in soft agar when compared with
the Lv-shCtrl group (P<0.001; Fig.
5A and B). These results indicated that silencing COPB2 may
reduce the anchorage-independent proliferative potential of BGC-823
gastric cancer cells.
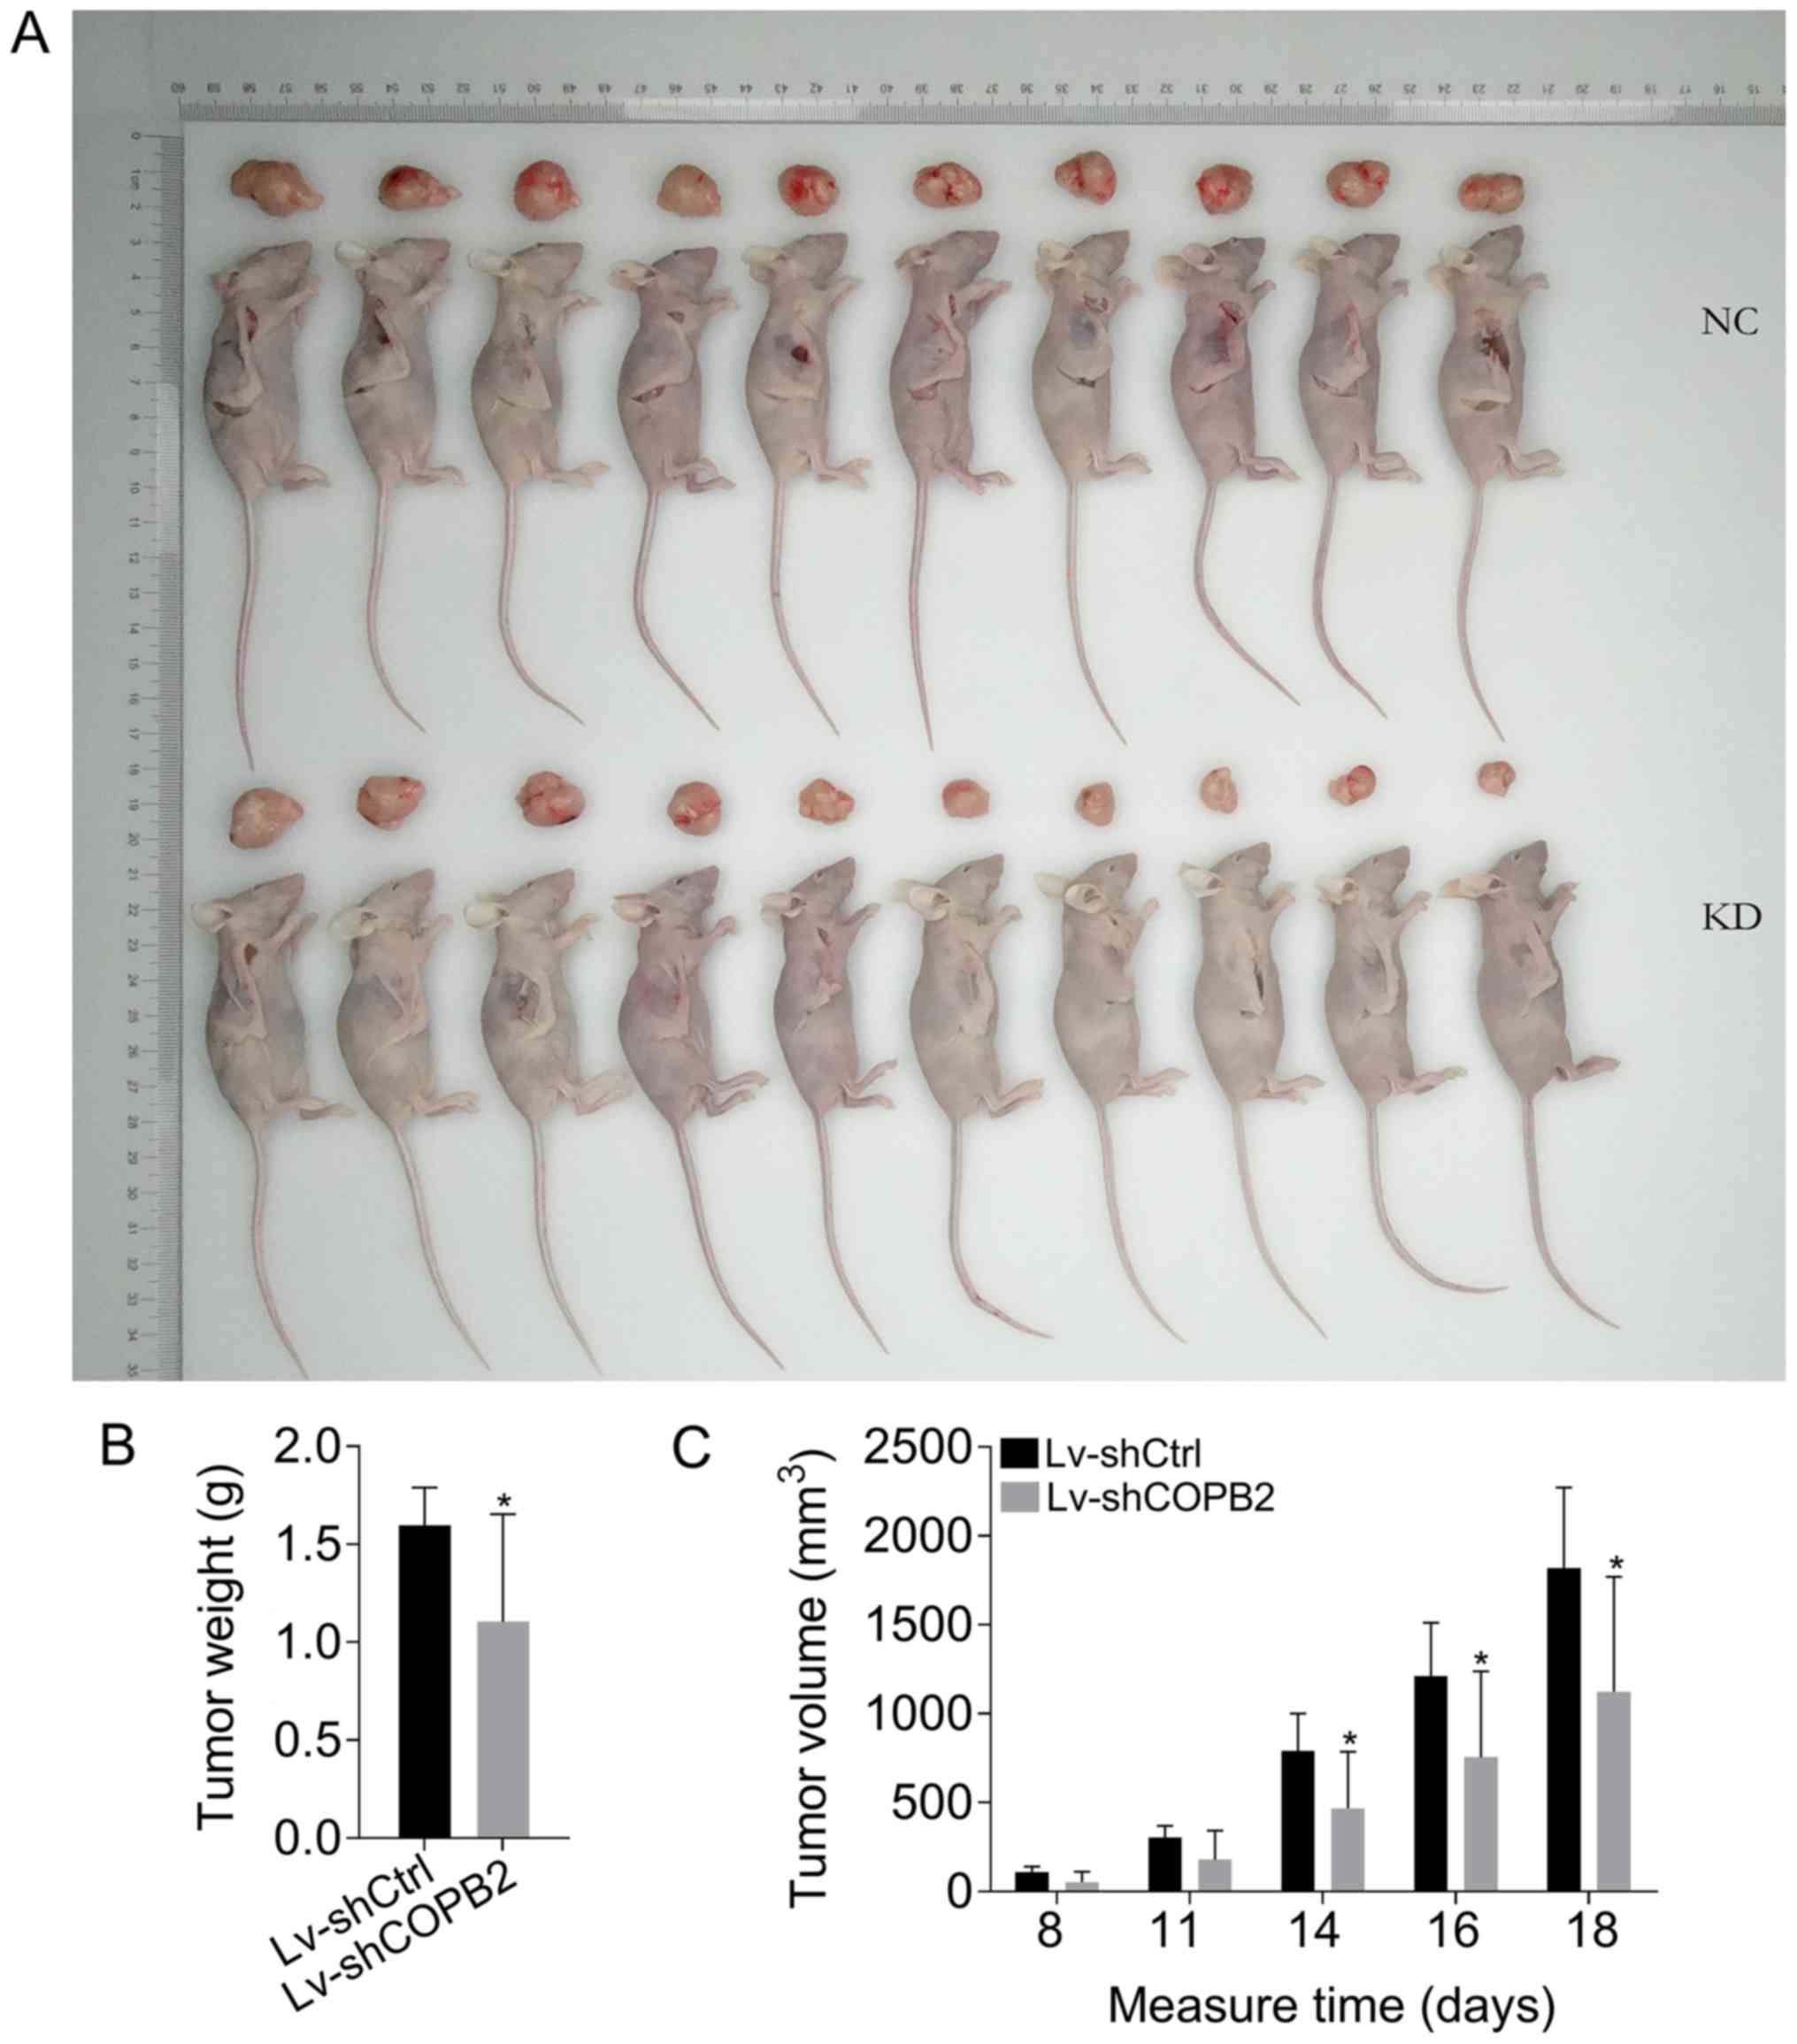
COPB2 silencing inhibits tumor growth in
vivo
To confirm the results of COPB2 knockdown in
vitro, an in vivo mouse tumorigenesis model, where mice
were injected with BGC-823 cells from the Lv-shCtrl or Lv-shCOPB2
groups, was generated. Over the course of 18 days, the rate of
tumor growth and the tumor volume were significantly reduced at 14,
16 and 18 days following injection with BGC-823 cells in the
Lv-shCOPB2 group compared with in the Lv-shCtrl group (P<0.05).
The results of tumor weight analysis revealed that COPB2-silenced
BGC-823 cells generated smaller subcutaneous xenograft tumors in
nude mice compared with in the Lv-shCtrl group (P<0.05; Fig. 6A-C). The results demonstrated that
silencing COPB2 using the Lv-shCOPB2 vector may significantly
inhibit the tumorigenicity of BGC-823 cells in a xenograft nude
mouse model.
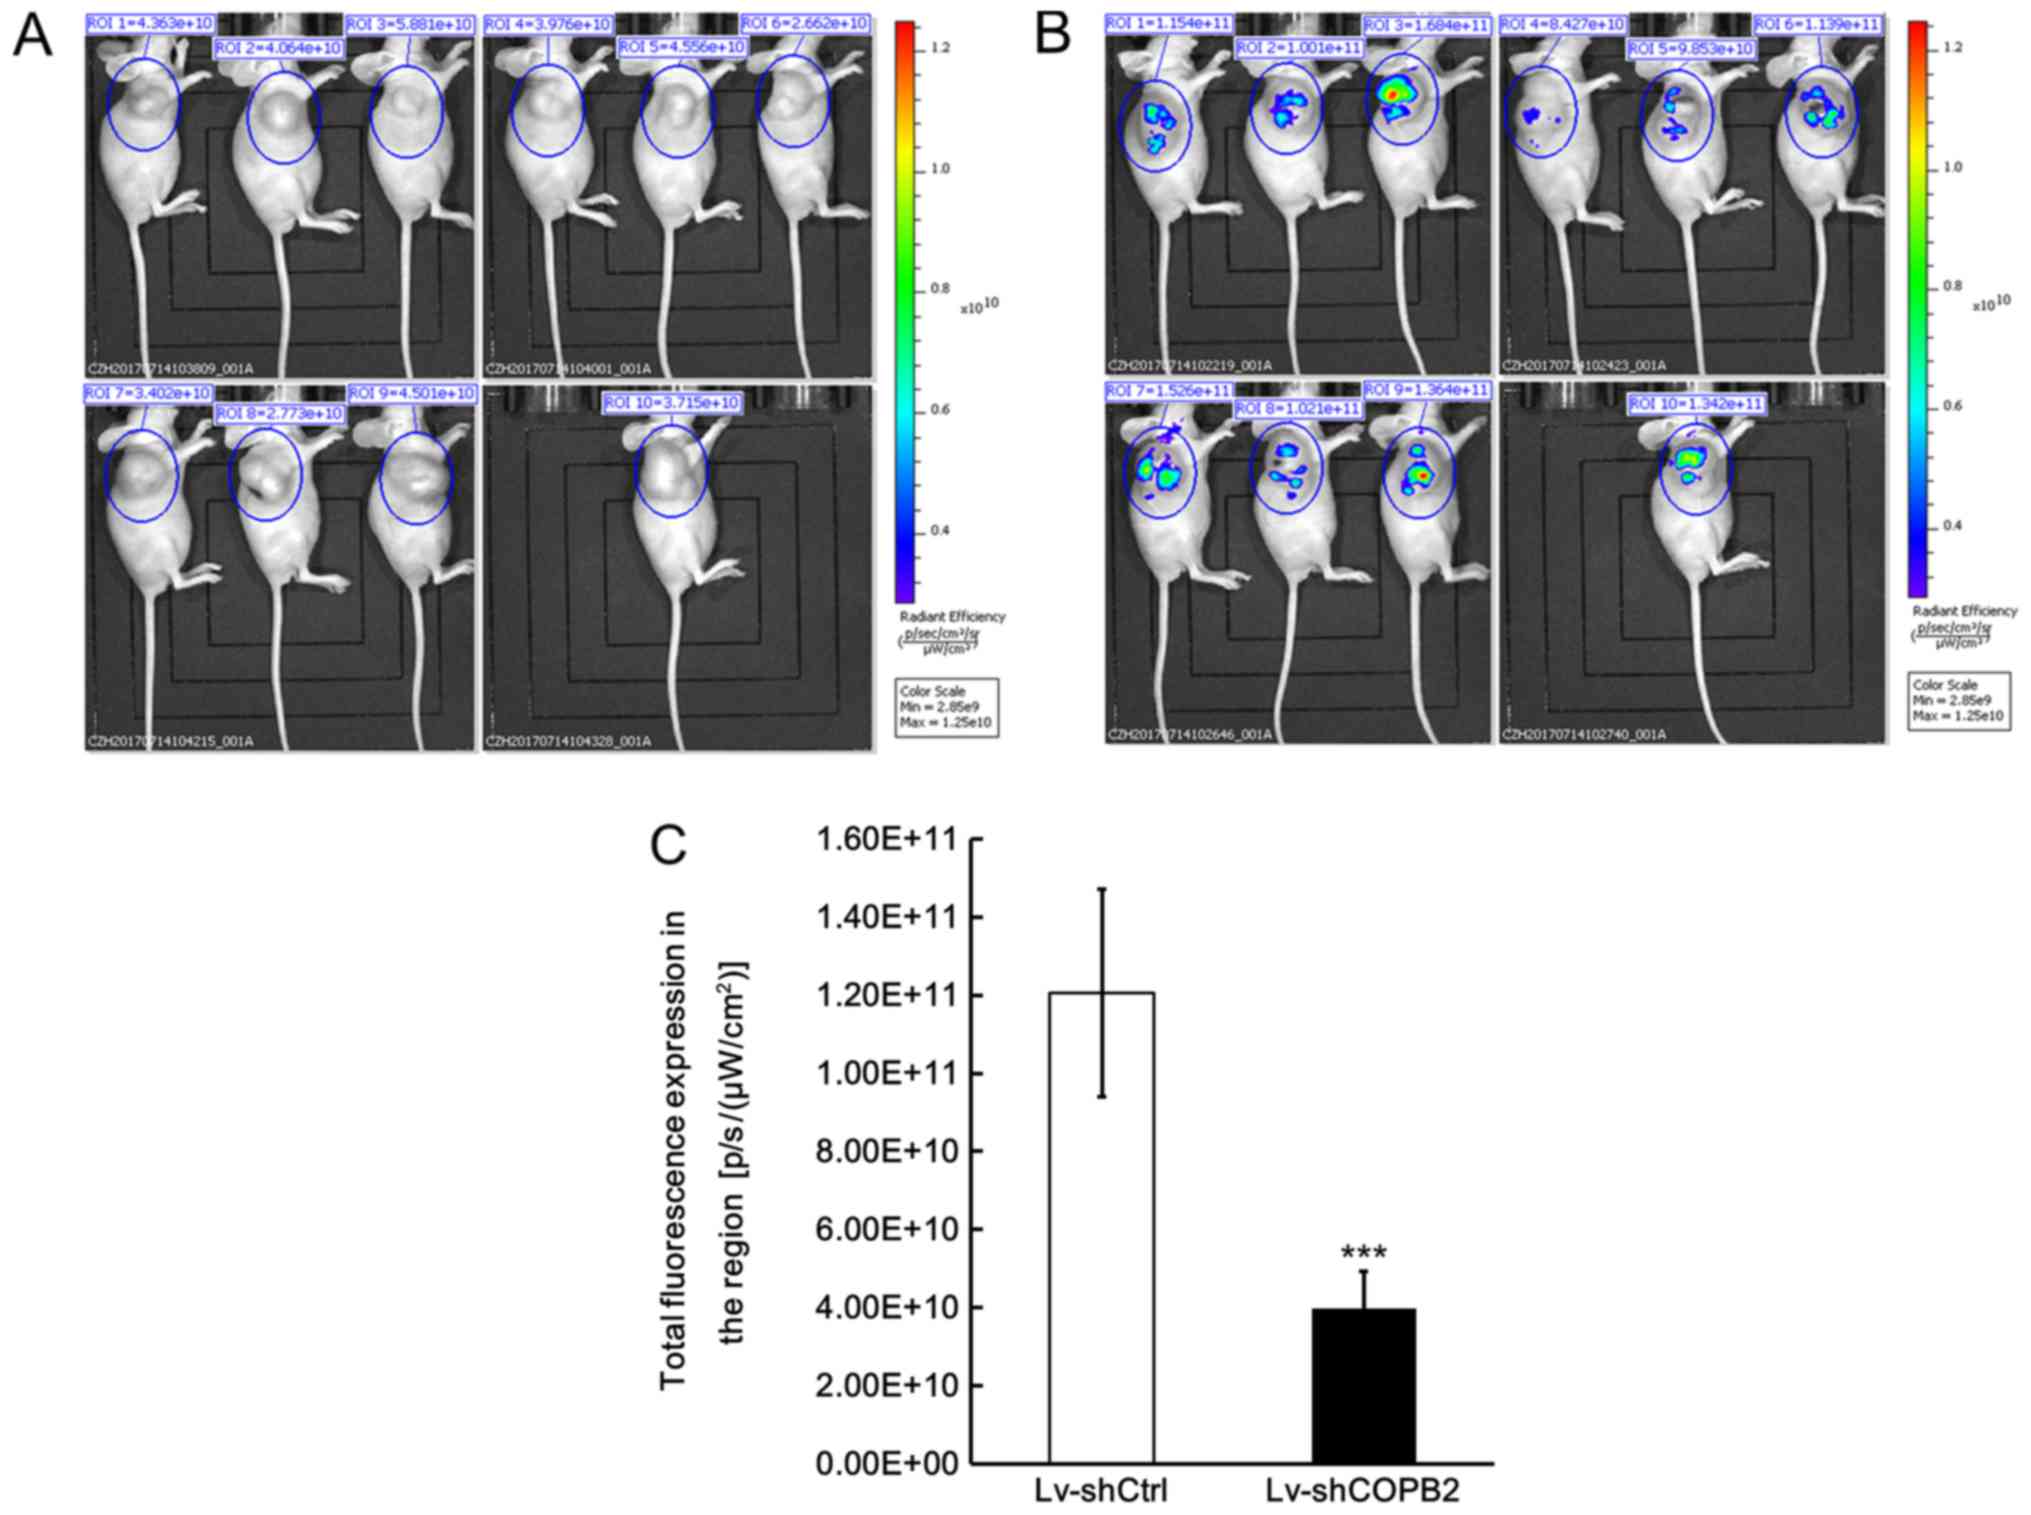
In order to confirm that knockdown of COPB2 was
directly associated with the observed effects on tumor growth, a
fluorescence imaging test was also conducted using a small animal
live imaging system, which monitors the fluorescence signals
emitted from cells and tissues. The Lv-shCOPB2-infected and
Lv-shCtrl-infected BGC-823 cells were also transduced with GFP;
therefore, tumor xenografts in both groups emit fluorescence
signals when triggered by specific fluorescence in the live imaging
system. The recorded fluorescence signal was used to calculate the
total radiant efficiency, which reflects the number of xenograft
tumor cells. The fluorescence imaging results demonstrated that the
total radiant efficiency of mice in the Lv-shCOPB2-infected group
was markedly reduced compared with in the Lv-shCtrl-infected group
(P<0.05; Fig. 7A and B). These
results confirmed successful infection of BGC-823 cells with the
lentiviral vectors and verified the effects of COPB2 on cell
proliferation in vivo.
Validation of COPB2 silencing effects in
xenograft tumor tissues
In order to confirm that COPB2 was successfully
silenced in xenograft tumor tissues at the mRNA and protein levels,
RT-qPCR, histological and immunohistochemical methods were employed
to analyze COPB2 expression. The results indicated that the mRNA
expression levels of COPB2 were significantly lower in xenograft
tumor tissues from mice in the Lv-shCOPB2 group compared with in
the Lv-shCtrl group (Fig. 8A).
H&E analysis of tissues from the Lv-shCtrl group indicated that
the tumor cells were scattered and varied in size, the nuclei were
enlarged, and exhibited intense staining. A high degree of
pathological mitosis in this group was observed, as characterized
by an abundance of cell nuclei, and a marked number of large tumor
cells was detected. In addition, necrotic areas were observed in
tumor tissues. H&E staining analysis of tissues from the
Lv-shCOPB2 group also indicated that the tumor cells were scattered
and varied in size, the nuclei were enlarged, and exhibited intense
staining. A high degree of pathological mitosis was also observed
in this group; however, only a small number of multinucleated giant
cells were identified in the tumor tissues. In addition, a number
of small necrotic areas were observed scattered throughout the
tumor tissues (Fig. 8B).
Immunohistochemical staining analysis of Lv-shCtrl group tissues
indicated that COPB2 expression could be observed in the cytoplasm
of tumor cells and was markedly increased in the cytoplasm of tumor
cells surrounding the necrotic regions. Immunohistochemical
analysis of Lv-shCOPB2 group tissues demonstrated that the
expression of COPB2 was increased in the cytoplasm of tumor cells
and in the central region of the tumor cell mass. In conclusion,
COPB2 expression in the Lv-shCOPB2 group tissues was markedly lower
than in the Lv-shCtrl group tissues (Fig. 8C).
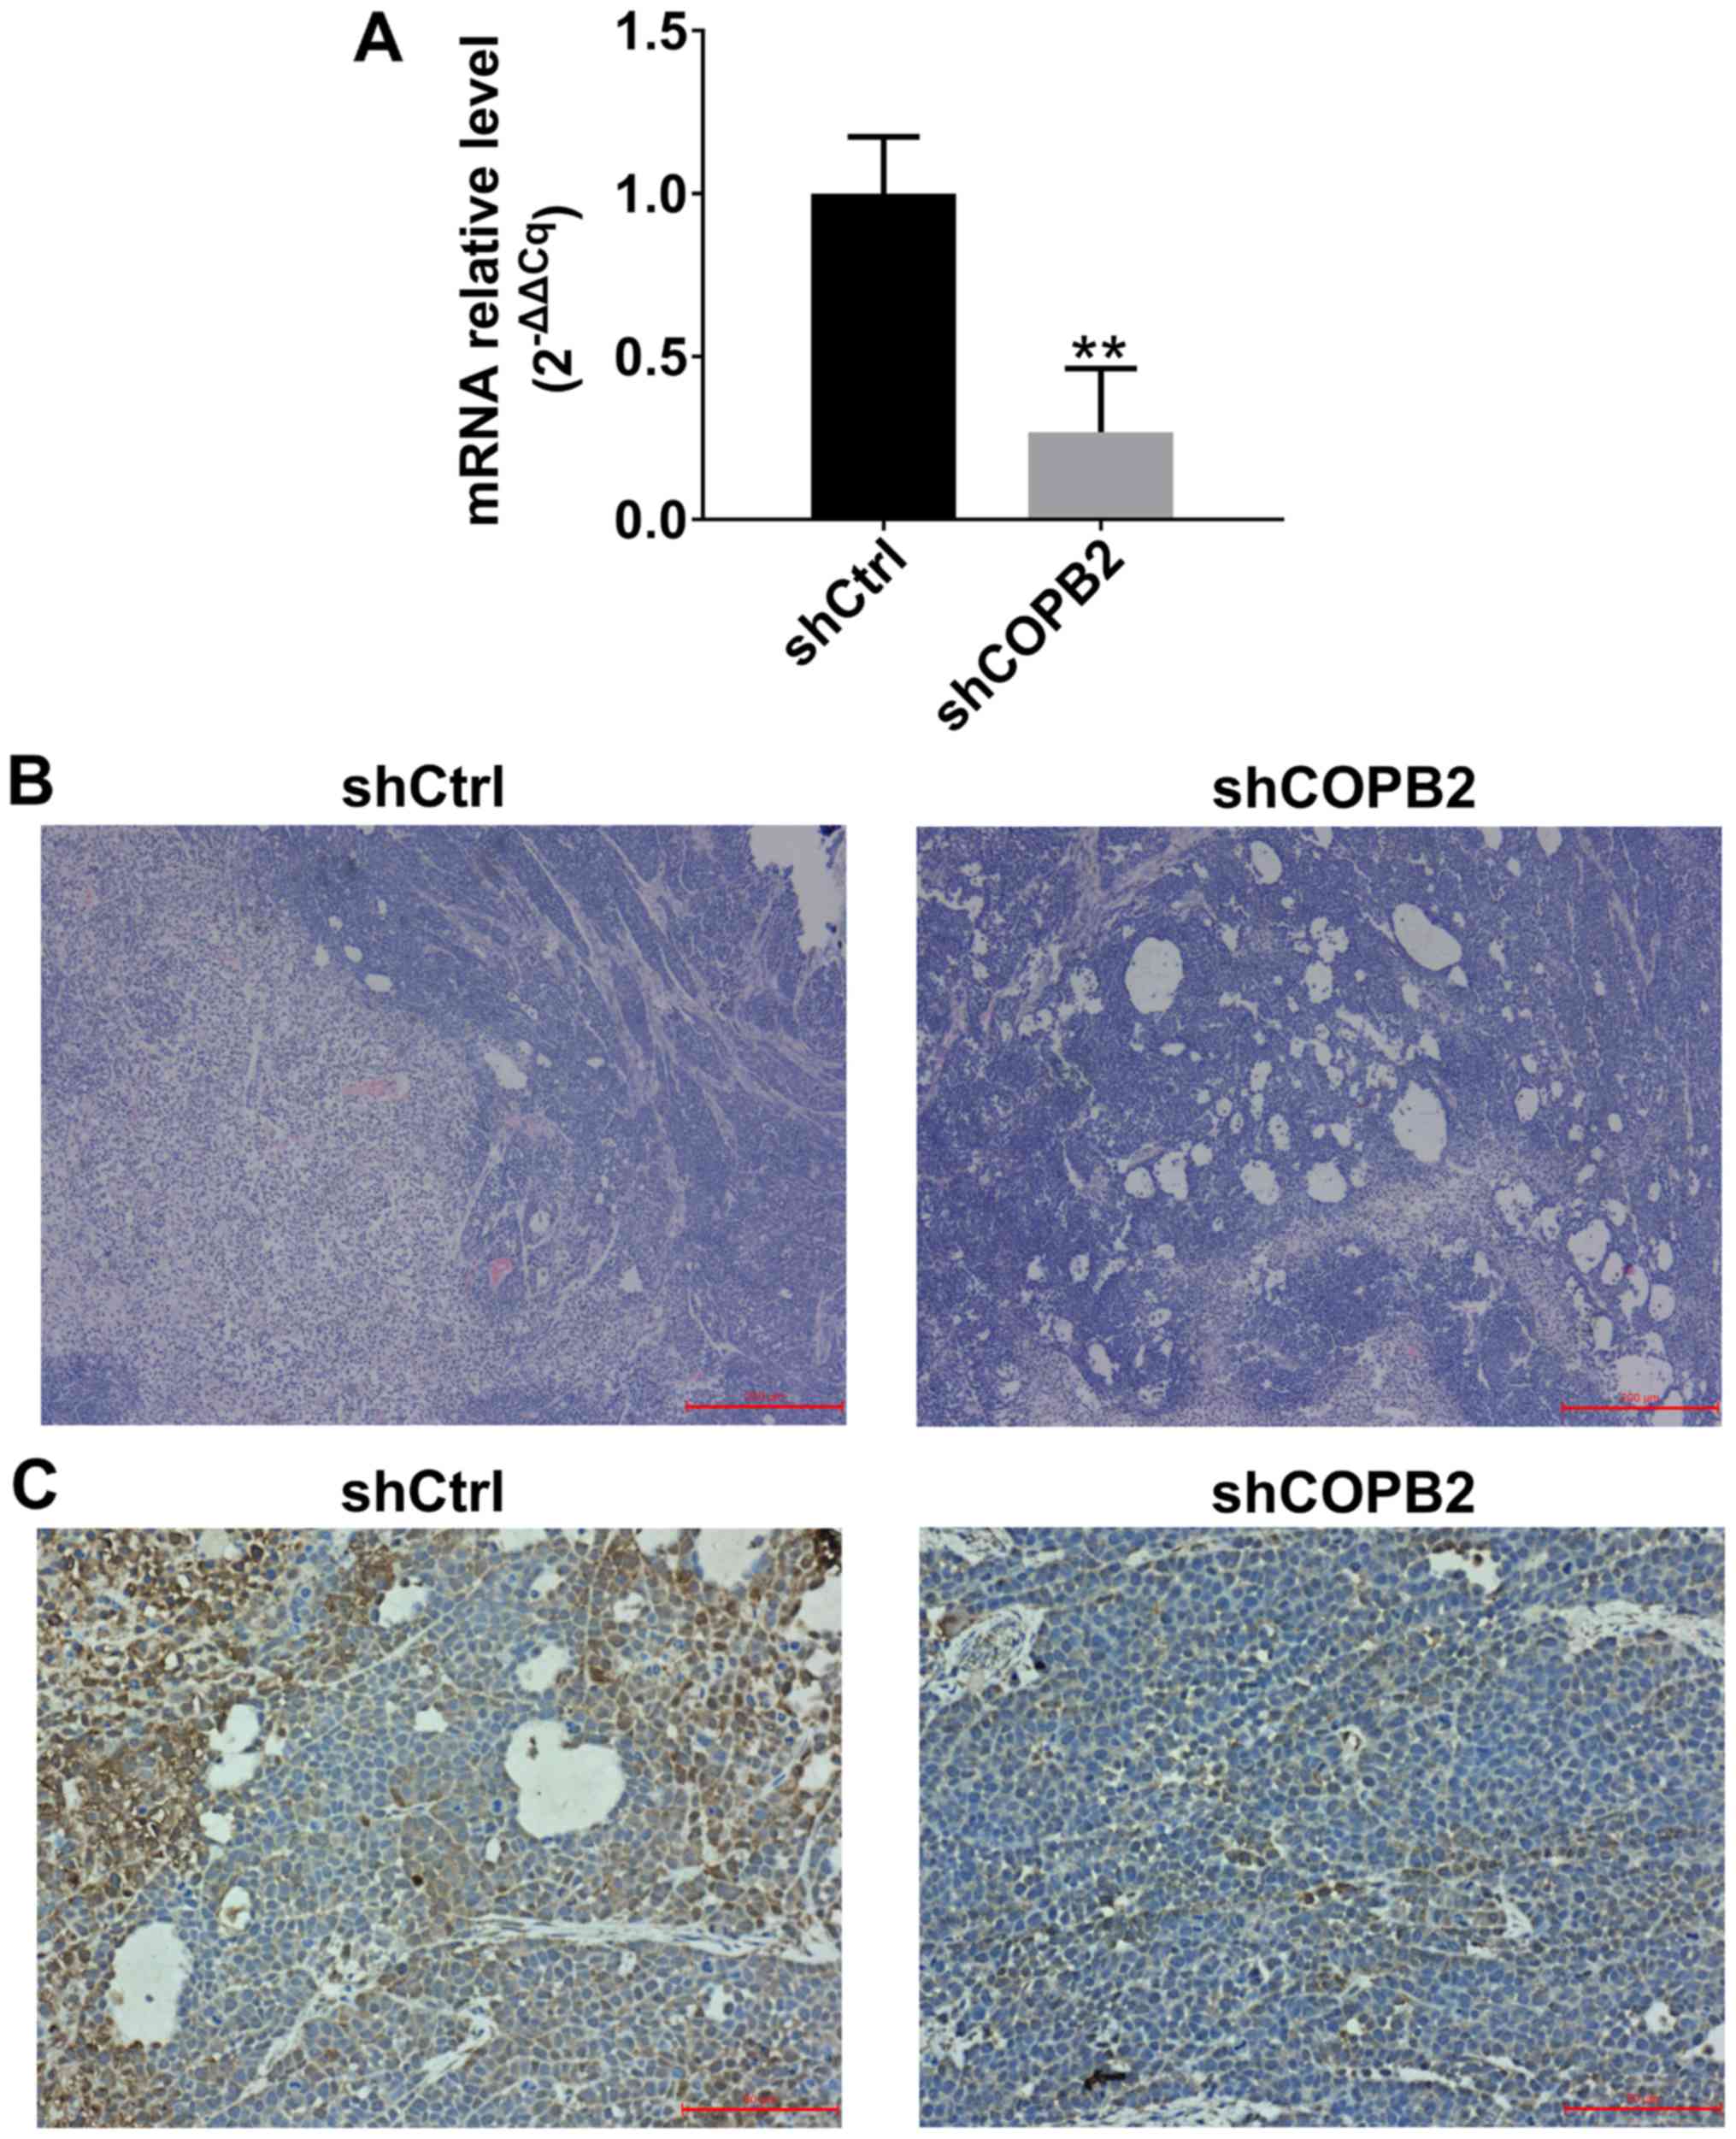 | Figure 8Detection of COPB2 mRNA and protein
expression in xenograft tumor tissues. (A) mRNA expression levels
of COPB2 in xenograft tumor tissues from the Lv-shCOPB2 group were
significantly lower than in the Lv-shCtrl group (P<0.01). (B)
H&E analysis of Lv-shCtrl group tissues indicated that the
tumor cells were scattered and varied in size, the nuclei were
enlarged, and the staining was intense. A high degree of
pathological mitosis was observed in this group, characterized by
an abundance of cell nuclei, and a marked number of large tumor
cells were detected. In addition, necrotic areas were observed in
tumor tissues. H&E staining analysis of tissues from the
Lv-shCOPB2 group indicated that the tumor cells were scattered and
varied in size. The nuclei were enlarged, and the staining was
intense. A high degree of pathological mitosis was also observed in
this group; however, only a small number of multinucleated giant
cells was identified in the tumor tissues. In addition, a number of
small necrotic areas were observed scattered throughout the tumor
tissues. Scale bar, 200 µm. (C) Immunohistochemical staining
analysis of Lv-shCtrl group tissues demonstrated that COPB2
expression was observed in the cytoplasm of tumor cells and was
markedly increased in the cytoplasm of tumor cells surrounding the
necrotic regions. Immunohistochemical staining analysis of
Lv-shCOPB2 group tissues indicated that COPB2 expression of was
increased in the cytoplasm of tumor cells and in the central region
of the tumor cell mass. The semi-quantitative score of COPB2
expression in Lv-shCtrl group tissues was moderately positive (++),
whereas the semi-quantitative score of COPB2 expression in
Lv-shCOPB2 group tissues was slightly positive(+). In conclusion,
COPB2 expression in the Lv-shCOPB2 group was markedly reduced
compared with in the Lv-shCtrl group. Scale bar, 50 µm.
**P<0.01, compared with the Lv-shCtrl group. COPB2,
coatomer protein complex subunit β2; H&E, hema-toxylin and
eosin; Lv, lentivirus; sh, short hairpin RNA. |
COPB2 silencing induces alterations in
the RTK signaling pathway
Tyrosine kinases serve important roles in the
modulation of growth factor signaling pathways; therefore, the
PathScan® RTK Signaling Pathway Antibody array was
employed to investigate the regulatory mechanisms underlying the
effects of COPB2 silencing on the tumorigenesis of BGC-823 gastric
cancer cells. The results demonstrated that knockdown of COPB2
significantly downregulated the expression (to varying degrees) of
phosphorylated target factors from the RTK signaling pathway (n=23
in total), including epidermal growth factor receptor (EGFR)/ErbB1,
human epidermal growth factor receptor (HER)2/ErbB2, HER3/ErbB3,
fibroblast growth factor receptor (FGFR)4, insulin receptor (InsR),
tropomyosin-related kinase (Trk)A/neurotrophic receptor tyrosine
kinase (NTRK)1, TrkB/NTRK2, recepteur d'origine nantais
(Ron)/macrophage stimulating 1 receptor (MST1R), Ret, c-Kit/stem
cell growth factor receptor (SCFR), FMS-like receptor tyrosine
kinase 3 (FLT3)/Flk2, EPH receptor (Eph)A3, EphB1, EphB4, TYRO3
protein tyrosine kinase (TYRO3)/Dtk, vascular endothelial growth
factor receptor (VEGFR)2/kinase insert domain receptor (KDR),
Akt/PKB/Rac (Thr308), Akt/PKB/Rac (Ser473), ribosomal S6 kinase
(RSK), c-Abl, Src, Lck and signal transducer and activator of
transcription 3 (Stat3; P<0.05 or P<0.01; Fig. 9 and Table I). These results indicated that
COPB2 affects the proliferation of BGC-823 cells potentially via
the phosphorylation-activated RTK signaling pathway. In addition,
knockdown of COPB2 decreased the expression levels of downstream
targets of the RTK signaling pathway in gastric cancer cells,
indicating that RTKs and downstream targets may serve important
roles in the apoptosis of COPB2-silenced BGC-823 cells. Further
studies are required to clarify the function and regulatory
mechanisms of COPB2 in gastric cancer development.
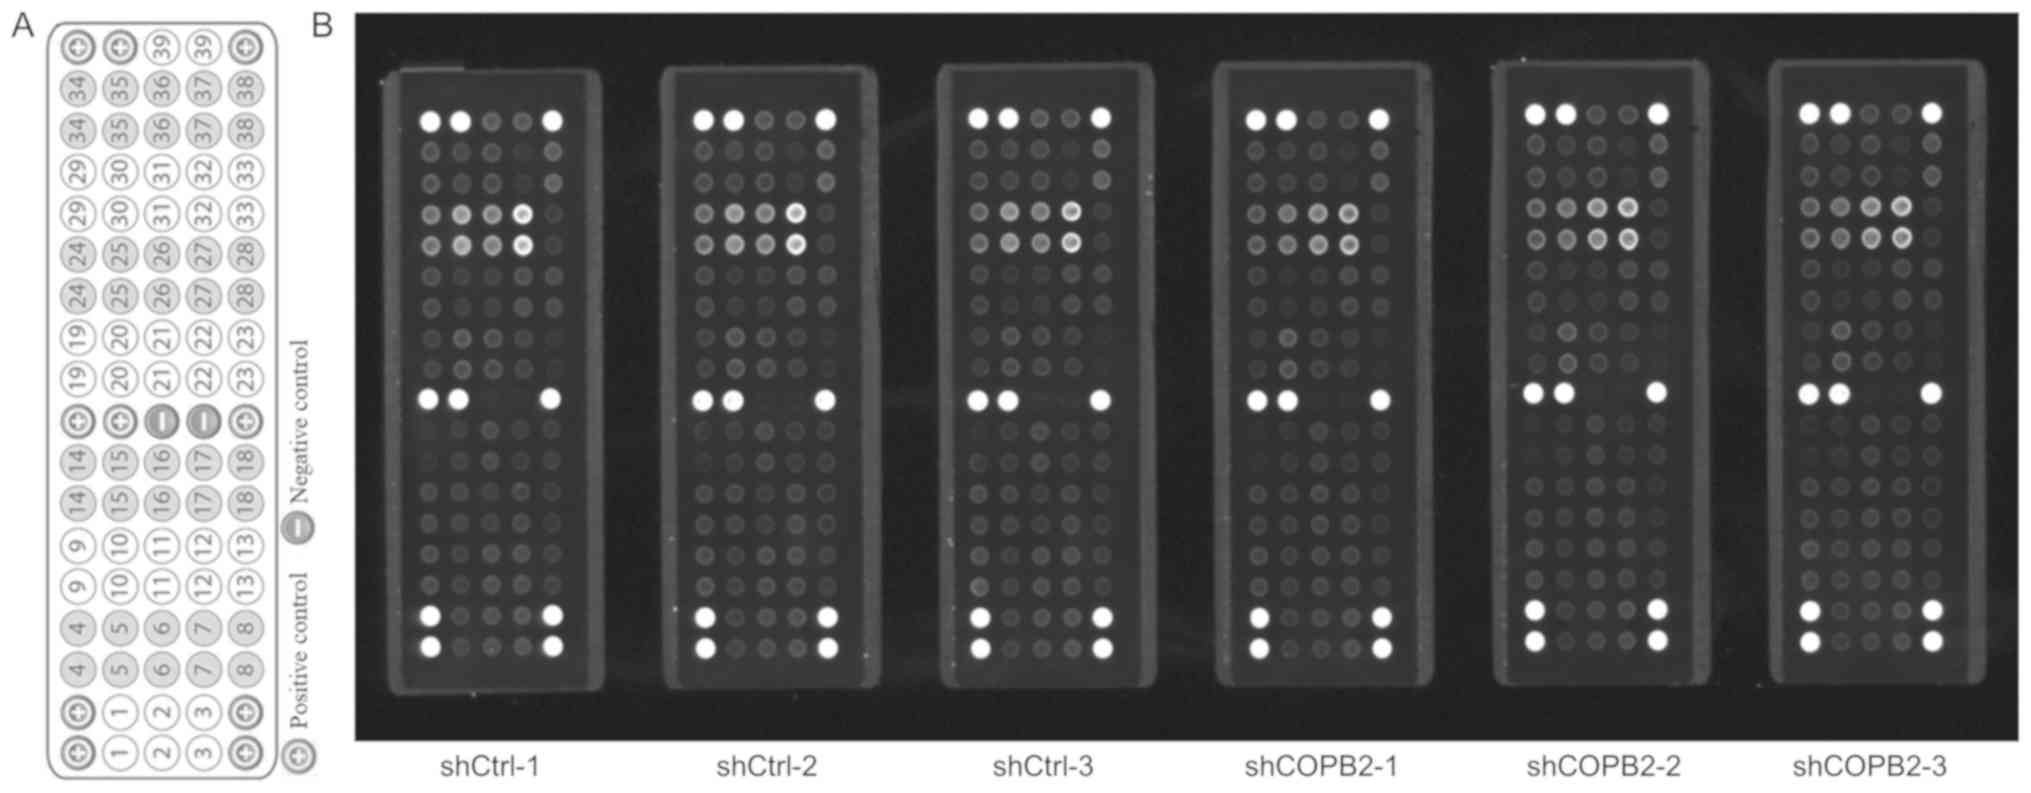 | Figure 9Effects of COPB2 gene knockdown on
specific RTK signaling pathway genes in BGC-823 cells. (A) Target
map of the PathScan® RTK Signaling Antibody Array kit
(Fluorescent Readout). This map image was taken from the Cell
Signaling Technology website (https://www.cst-c.com.cn/product/product-Detail.jsp?productId=7949).
Each site represents a target, which was indicated numerically and
corresponds to the numbers presented in Table I. (B) Effects of COPB2 gene
knockdown on relevant genes from the RTK signaling pathway in
BGC-823 cells. This slide-based antibody array image indicated the
reaction results for Lv-shCOPB2-infected and Lv-shCtrl-infected
BGC-823 cells. The results demonstrated that knockdown of COPB2
significantly reduced the phos-phorylation of 23 RTK signaling
pathway targets, including epidermal growth factor receptor/ErbB1,
HER2/ErbB2, HER3/ErbB3, fibroblast growth factor 4, insulin
receptor, tropomyosin-related kinase A/NTRK1, TrkB/NTRK2, recepteur
d'origine nantais/macrophage stimulating 1 receptor, Ret,
c-Kit/stem cell growth factor receptor, FMS-like receptor tyrosine
kinase 3/Flk2, EphA3, EphB1, EphB4, TYRO3 protein tyrosine
kinase/Dtk, vascular endothelial growth factor receptor 2/kinase
insert domain receptor, Akt/PKB/Rac (Thr308), Akt/PKB/Rac (Ser473),
ribosomal S6 kinase, c-Abl, Src, Lck and signal transducer and
activator of transcription 3 at different levels (P<0.05 or
P<0.01). COPB2, coatomer protein complex subunit β2; Eph, EPH
receptor; HER, human epidermal growth factor receptor; Lv,
lentivirus; NTRK, neurotrophic receptor tyrosine kinase 1; RTK,
receptor tyrosine kinase; sh, short hairpin RNA. |
 | Table IDetected proteins screened and
validated by PathScan® RTK Signaling Antibody array
between shCtrl-infected cells and shCOPB2-infected cells. |
Table I
Detected proteins screened and
validated by PathScan® RTK Signaling Antibody array
between shCtrl-infected cells and shCOPB2-infected cells.
| Site | Target | Phosphorylation
site | Family | Average gray value
| P-value | Up/down |
|---|
| shCtrl | shCOPB2 |
|---|
| 1 | EGFR/ErbB1 | pan-Tyr | EGFR | 20.95±1.10 | 16.63±1.56 | 0.0002 | −20.60% |
| 2 | HER2/ErbB2 | pan-Tyr | EGFR | 15.43±0.82 | 13.03±0.81 | 0.0005 | −15.55% |
| 3 | HER3/ErbB3 | pan-Tyr | EGFR | 22.87±0.99 | 19.73±2.17 | 0.0092 | −13.70% |
| 4 | FGFR1 | pan-Tyr | EGFR | 16.25±3.39 | 15.07±3.55 | 0.5682 | −7.28% |
| 5 | FGFR3 | pan-Tyr | EGFR | 12.25±0.59 | 11.25±1.26 | 0.1090 | −8.16% |
| 6 | FGFR4 | pan-Tyr | EGFR | 13.72±0.70 | 12.13±0.90 | 0.0068 | −11.54% |
| 7 | InsR | pan-Tyr | Insulin R | 14.52±0.60 | 12.05±0.43 | <0.00001 | −16.99% |
| 8 | IGF-IR | pan-Tyr | Insulin R | 14.75±2.82 | 13.5±4.19 | 0.5582 | −8.47% |
| 9 | TrkA/NTRK1 | pan-Tyr | NGFR | 11.73±0.20 | 10.07±0.65 | 0.0010 | −14.20% |
| 10 | TrkB/NTRK2 | pan-Tyr | NGFR | 11.72±0.78 | 10.05±0.44 | 0.0010 | −14.22% |
| 11 | Met/HGFR | pan-Tyr | HGFR | 11.83±0.74 | 11.2±0.26 | 0.1007 | −5.21% |
| 12 | Ron/MST1R | pan-Tyr | HGFR | 12.88±0.98 | 10.7±0.52 | 0.0007 | −16.95% |
| 13 | Ret | pan-Tyr | Ret | 11.27±0.68 | 8.93±0.41 | <0.00001 - | 20.71% |
| 14 | ALK | pan-Tyr | LTK | 14.73±4.62 | 12.37±4.24 | 0.3769 | −16.06% |
| 15 | PDGFR | pan-Tyr | PDGFR | 15.65±4.59 | 13.20±4.33 | 0.3639 | −15.65% |
| 16 | c-Kit/SCFR | pan-Tyr | PDGFR | 13.03±0.66 | 10.58±0.29 | <0.00001 - | 18.80% |
| 17 | FLT3/Flk2 | pan-Tyr | PDGFR | 11.77±0.60 | 9.43±0.29 | <0.00001 - | 19.83% |
| 18 | M-CSFR/CSF-1R | pan-Tyr | PDGFR | 15.05±4.40 | 12.57±3.97 | 0.3257 | −16.50% |
| 19 | EphA1 | pan-Tyr | EphR | 14.52±3.25 | 13.97±3. 40 | 0.7802 | −3.79% |
| 20 | EphA2 | pan-Tyr | EphR | 17.55±4.40 | 17.07±3.43 | 0.8361 | −2.75% |
| 21 | EphA3 | pan-Tyr | EphR | 13.93±1.26 | 11.72±1.12 | 0.0092 | −15.91% |
| 22 | EphB1 | pan-Tyr | EphR | 12.07±0.89 | 10.28±1.06 | 0.0101 | −14.78% |
| 23 | EphB3 | pan-Tyr | EphR | 12.53±2.60 | 12.25±3.98 | 0.8868 | −2.26% |
| 24 | EphB4 | pan-Tyr | EphR | 13.27±1.76 | 11.08±0.97 | 0.0237 | −16.46% |
| 25 | TYRO3/Dtk | pan-Tyr | Axl | 12.9±1.80 | 10.63±0.95 | 0.0213 | −17.57% |
| 26 | Axl | pan-Tyr | Axl | 13.1±1.70 | 11.5±1.95 | 0.1613 - | 12.21% |
| 27 | Tie2/TEK | pan-Tyr | Tie | 16.43±3.71 | 13.55±2.99 | 0.1694 | −17.55% |
| 28 | VEGFR2/KDR | pan-Tyr | VEGFR | 12.4±0.92 | 10.17±0.63 | 0.0006 | −18.01% |
| 29 | Akt/PKB/Rac | Thr308 | Akt | 22.42±3.13 | 16.65±1.45 | 0.0022 | −25.72% |
| 30 | Akt/PKB/Rac | Ser473 | Akt | 31.33±4.25 | 21.23±1.54 | 0.0013 | −32.23% |
| 31 | p44/42 MAPK
(ERK1/2) | Thr202/Tyr204 | MAPK | 31.12±3.54 | 30.1±3.11 | 0.6087 | −3.27% |
| 32 | S6 Ribosomal
Protein | Ser235/236 | RSK | 42.5±4.69 | 32.63±3.55 | 0.0021 | −23.22% |
| 33 | c-Abl | pan-Tyr | Abl | 16.58±1.81 | 12.9±1.22 | 0.0020 | −22.21% |
| 34 | IRS-1 | pan-Tyr | IRS | 18.93±4.60 | 16.1±3.69 | 0.2666 | −14.96% |
| 35 | Zap-70 | pan-Tyr | Zap-70 | 19.25±3.82 | 16.2±3.81 | 0.1957 | −15.84% |
| 36 | Src | pan-Tyr | Src | 15.65±0.91 | 13.32±0.90 | 0.0012 | −14.91% |
| 37 | Lck | pan-Tyr | Src | 15.7±2.57 | 12.15±1.48 | 0.0148 | −22.61% |
| 38 | Stat1 | Tyr701 | Stat | 19.8±4.13 | 16.287±3.74 | 0.1532 | −17.76% |
| 39 | Stat3 | Tyr705 | Stat | 22.38±1.37 | 20.067±1.89 | 0.0354 | −10.35% |
Discussion
In the present study, the mRNA expression levels of
COPB2 were abundant in gastric cancer cell lines, including MKN-45,
MGC-803, BGC-823 and SGC-7901 cells. In addition, silencing of
COPB2 expression inhibited gastric cancer cell proliferation in
vitro and in vivo, and reduced cell colony formation and
induced apoptosis of BGC-823 cells. These data indicated that COPB2
upregulation may serve an essential role in mediating the
tumorigenicity of human gastric cancer cells. In addition, these
observations provided strong evidence to suggest that COPB2 may
contribute to the pathogenesis of gastric cancer, as indicated by
the anti-proliferative and apoptosis-inducing effects of COPB2
knockdown. Therefore, COPB2 may represent a novel promising target
for gene therapy of gastric cancer. The results of the current
study were consistent with the results of COPB2 silencing in
prostate cancer cells (5), lung
adenocarcinoma cells (6) and colon
cancer cells (7), whereby cell
growth was inhibited and apoptosis was increased. Taken together,
these data suggested that COPB2 may serve an essential role in
gastric cancer cell growth. In addition, the size of gastric cancer
tumors was significantly decreased when COPB2 expression was
silenced, indicating that downregulation of COPB2 may inhibit the
progression of gastric cancer cells. Furthermore, silencing of
COPB2 using lentivirus-mediated shRNA effectively downregulated
gastric cancer progression in BGC-823 cells potentially via the RTK
signaling pathway.
The PathScan® RTK Signaling Antibody
Array kit (Fluorescent Readout) is a slide-based antibody array
product based on the sandwich immunoassay principle. This array kit
is capable of simultaneously detecting the levels of 28 RTKs and 11
important signaling nodes that have been phosphorylated at tyrosine
or other residues. RTKs, such as cell surface receptors, emit
signals primarily via tyrosine phosphorylation reactions, which
alter the function of downstream growth factors, including EGF,
nerve growth factor, platelet-derived growth factor (PDGF), VEGF,
FGF, insulin-like growth factor (IGF), ephrins and angiopoietins.
RTKs activate a wide range of downstream signaling cascades,
including the phosphatidylinositol 3-kinase (PI3K)/Akt,
mitogen-activated protein kinase (MAPK) and Janus kinase (Jak)/Stat
signaling pathways (12). It is
known that these pathways modulate fundamental cellular functions,
including cell division, growth, metabolism, differentiation,
migration and survival.
In addition to these normal cellular functions, it
has been reported that RTKs participate in the development and
progression of human cancer (13);
therefore, aberrantly expressed RTK signaling nodes are regarded as
novel therapeutic targets for pharmaceutical intervention (14). Following activation, indispensable
tyrosine kinases may stimulate numerous signaling pathways that
serve important roles in DNA repair, apoptosis and cell
proliferation. It has been suggested that tyrosine kinases may be
attractive targets for cancer therapy, and tyrosine kinase
inhibitors have been effective in the treatment of various tumor
types, including head and neck, gastric, prostate and breast
cancer, and leukemia (15). In the
present study, the phosphorylated forms of a total of 23 tyrosine
kinases were downregulated following knockdown of COPB2 in BGC-823
cells. Among these 23 targets, the EGFR family consists of four
members that belong to the ErbB lineage of proteins (ErbB1-4),
which, as a ligand of RTKs, may stimulate and modulate cell
function. Therefore, the EGFR family may be considered therapeutic
targets; EGFR inhibitors have been used for the treatment of
various types of cancer, including lung, breast, pancreas, bladder,
and head and neck cancers (16-19).
Additional tyrosine kinases in the RTK signaling pathway identified
in the present study were also confirmed to serve important roles
in modulating cancer behavior, and are regarded as therapeutic
targets in cancer, particularly in gastric cancer.
It has been demonstrated that silencing FGFR4 may
disrupt the biological features of gastric cancer cells, and it is
therefore considered a novel target molecule for therapy (20). The EphA2 RTK was also observed to
be a promising target for cancer therapy (21). The Raf protein kinases are key
intermediates in cellular signal transduction pathways, and Raf
inhibitors, such as vemurafenib and dabrafenib, are considered to
present a novel strategy for antitumor therapy (22). Targeting Stat3 signaling is also a
molecular strategy for therapeutic intervention (23,24).
The InsR and the IGF receptor 1 (IGF1R) exert oncogenic functions
(25), and participate in cancer
development and progression via the IGF network (26). RTKs and their associated growth
factors, including IGF1R, InsR, MET and HER3, have been observed to
be enriched in HER2-positive gastric cancer tissue samples from
patients, and have been identified as an important cause of
lapatinib resistance in HER2-positive gastric cancer cells
(27).
Trk receptors have been observed to be significantly
associated with tumor progression and survival (28). TrkC activates Akt and suppresses
transforming growth factor-β signaling, and is considered a
potential therapeutic target for colorectal cancer (29). Activation of Trks stimulates tumor
cell proliferation, aggressiveness and metastasis (30).
Ron, also known as MST1R, is an RTK from the Met
proto-oncogene family; its dimerization and subsequent
phosphorylation activates classical downstream signaling pathways,
including MAPK, Jak/Stat3 and PI3K/Akt (31). Previous studies have demonstrated
that knockdown of Ron by small interfering (si)RNA could suppress
tumor cell migration and invasion, induce apoptosis, and arrest the
cell cycle at S phase in AGS cells and G2/M phase in
MKN28 cells (31,32). In addition, Ron expression has been
significantly associated with tumor size, depth of invasion, lymph
node metastasis, tumor stage and poor survival (32).
The Ret proto-oncogene RTK may serve an important
role in cell growth, differentiation and survival. Following ligand
binding, it activates numerous downstream signaling pathways, such
as MAPK/extracellular signal-regulated kinase (ERK) and PI3k/Akt
(33). The tyrosine kinase domain
of Ret is considered to be a crucial therapeutic target (34).
The c-Kit proto-oncogene RTK belongs to the type III
receptor family. As c-Kit signaling serves a role in tumorigenesis,
imatinib has been used to treat tumors by inhibiting c-Kit
signaling (35). c-Kit activation
is pivotal in the majority of gastrointestinal stromal tumors, and
is likely an initiating tumorigenic event; therefore, c-Kit is
almost a universal therapeutic target (36).
FLT3, together with KIT, FMS and PDGF receptor
(PDGFR), belongs to the class III RTKs (37). Signal transduction pathways
activated by FLT3 include several conserved pathways, such as
RAS/MAPK and PI3K/Akt (38).
Combined inhibition of PI3Kδ and FLT3 exerts synergistic antitumor
activities in FLT3-activated acute myeloid leukemia (39).
The Eph RTK has been demonstrated to exert a complex
role in tumor formation, progression and metastasis. EphA2, EphA3
and EphB4 are some of the most widely overexpressed Eph RTKs in
cancer, which are associated with tumor aggressiveness. EphB4
signaling may activate downstream signaling factors, including VEGF
expression (40). EphB1-targeting
small interfering (si)RNA may reduce cell viability and growth,
alter cell cycle progression, decrease the expression of important
cell cycle regulators, and increase the percentage of cells in
G1 phase of the cell cycle. Knockdown of EphB1 in DAOY
cells results in a significant reduction in the migration of
medulloblastoma cells (41).
Silencing EphA2 may also suppress the growth and haptotaxis of
malignant mesothelioma cells (42). In addition, knockdown of EphA2
expression has been observed to inhibit gastric cancer cell
proliferation and invasion in vitro and in vivo
(43). An additional study
(44) demonstrated that
EphB4-targeting siRNA decreases non-small cell lung cancer cell
viability and the volume of established tumors in vivo.
FGF signaling regulates cell fate, angiogenesis,
immunity and metabolism via its receptors, FGFR1, FGFR2, FGFR3 and
FGFR4. Aberrantly expressed FGF signaling may lead to the
development of breast, gastric and lung cancer. Therefore,
anti-FGFR therapy, in the form of anti-FGF/FGFR monoclonal
antibodies and small-molecule FGFR inhibitors, is considered an
effective means of cancer treatment (45).
TYRO3 is involved in the process of controlling cell
survival and proliferation, and upregulation of TYRO3 may enhance
cell motility, invasion, anchorage-independent growth and
metastatic ability. Conversely, knockdown of TYRO3 may reverse
these biological behaviors (46,47).
A previous study demonstrated that overexpression of TYRO3 is
associated with a hepatocellular carcinoma serum biomarker,
α-fetoprotein (AFP), and alanine aminotransferase expression and
tumor diameter. Knockdown of TYRO3 in the Hep3B hepatocellular
carcinoma cell line reduces cell proliferation, ERK
phosphorylation, cyclin D1 expression and AFP levels (48). RNAi-targeting of TYRO3 inhibits the
proliferation of luminal-type cells in estradiol-rich and
estradiol-null conditions, and is associated with
G0-G1/S cell cycle arrest (49).
VEGFR2, also known as KDR, functions as the main
mediator of VEGF-induced endothelial proliferation, survival and
migration in response to numerous factors. VEGFR2 is a molecular
target for the treatment of gastric cancer. Ramucirumab is a
recombinant monoclonal antibody that targets VEGFR2, which has been
used to treat specific cancer types.
Once downstream signals of PI3K have been activated
by various growth factors, including PDGF, EGF and IGF-I, Akt is
activated by phosphorylation on Thr-308 and Tyr-474 residues.
Activation of the PI3K/AKT signaling pathway is frequently
associated with human malignancies and serves a key role in cancer
progression (50,51), including gastric cancer (52). Therefore, targeting the
PI3K-AKT-mTOR pathway may be considered an anticancer therapeutic
strategy. RSK contains two non-identical catalytic kinase domains,
which phosphorylate various substrates, including members of the
MAPK signaling pathway, and control cell growth and
differentiation. For example, RSK regulates cell migration and
invasion of metastatic breast cancer cells via stimulating the
phosphorylation of EphA2, thus activating the RSK-EphA2 signaling
pathway (53). In response to the
RSK inhibitor, or via RNAi-targeting of RSK2, EGF-induced cell
proliferation is suppressed (54),
and knockdown of RSK2, but not RSK1, in L3.6pl pancreatic cancer
cells significantly inhibits the macrophage-stimulating
protein-induced epithelial-mesenchymal-transition (EMT)-like
phenotype and cell migration. RSK2 activation serves a critical
determinant role in linking Ron signaling to the cellular EMT
program. Consequently, inhibition of RSK2 activity may provide a
therapeutic opportunity for inhibiting Ron-mediated cancer cell
migration and invasion (55).
The c-Abl proto-oncogene is not an RTK, but
participates in numerous cellular processes, such as cell division,
adhesion, differentiation and stress responses. c-Abl kinases may
promote PDGFR-mediated proliferation and migration (56).
The non-RTK Src proto-oncogene has been observed to
be involved in numerous signaling pathways associated with cell
proliferation, migration, tumor adhesion and angiogenesis, and may
also mediate signaling pathways from many types of receptors,
including RTKs (57). Treatment
with the novel Src/Abl inhibitor, bosutinib, alone or in
combination with additional chemotherapeutic agents, may be a
valuable therapeutic strategy for neuroblastoma treatment (58). An inhibitor of Src kinase has been
observed to inhibit the growth of cervical cancer cells in
vitro and in vivo. Downregulation of phosphorylated-Src
(Y416) inhibits cell proliferation and cell cycle arrest in HeLa
and SiHa cells by regulating cyclin-dependent kinases and cyclin X.
Results from a nude mouse xenograft model indicated that PP2, an
inhibitor of Src kinase, may significantly inhibit subcutaneous
tumor growth of cervical cancer cells (59).
The Lck proto-oncogene, a Src family member of
protein tyrosine kinases, may protect cells from
glucocorticoid-induced apoptosis. Small-molecule inhibitors of Lck,
such as dasatinib, reverse glucocorticoid resistance in some
lymphoid malignancies (60).
Inhibition of Lck by treatment with PP2, an Src kinase family
inhibitor, or via targeting Lck with siRNA, suppresses
sphingosine-induced conformational activation and oligomerization
of B-cell lymphoma 2 homologous antagonist/killer, and leads to
mitochondrial membrane potential loss and apoptotic cell death
(61).
Stat3 is constitutively activated in various tumor
types, and serves an important role in tumor survival, metastasis,
chemoresistance and escape from immune responses (62,63).
Stat3 is activated upon tyrosine phosphorylation, which is mediated
by upstream cytokines, including, JAK, Src, Abl or RTKs.
Conversely, Stat3 is inhibited by Debio 0617B, a novel RTK
inhibitor that inhibits Stat3 in Stat3-activated carcinoma cell
lines and causes a dose-dependent decrease in cell proliferation
(63). Inhibiting Stat3 reduces
cell growth and induces apoptosis in head and neck cancer (64), glioma (65), prostate cancer (66) and pancreatic cancer (67) cells. Specifically, silencing of
Stat3 significantly inhibits the growth of gastric cancer cells
in vitro and in vivo via cell apoptosis and cell
cycle shift (68).
In conclusion, the present study demonstrated that
COPB2 was abundantly expressed in human gastric cancer cell lines.
Knockdown of COPB2 in BGC-823 cells inhibited cell growth and
colony formation abilities, and promoted cell apoptosis,
potentially via modulating RTK signaling and its downstream
signaling cascades. Factors, including EGFR/ErbB1, HER2/ErbB2,
HER3/ErbB3, FGFR4, InsR, TrkA/NTRK1, TrkB/NTRK2, Ron/MST1R, Ret,
c-Kit/SCFR, FLT3/Flk2, EphA3, EphB1, EphB4, TYRO3/Dtk, VEGFR2/KDR,
Akt/PKB/Rac (Thr308), Akt/PKB/Rac (Ser473), S6 ribosomal protein,
c-Abl, Src, Lck and Stat3, may be involved in the effects of COPB2
knockdown. Therefore, COPB2 may be considered a valuable gene
therapy target for the treatment of gastric cancer.
Funding
This study was supported by the Lanzhou Science and
Technology Planning Project (grant no. 2016-3-113), the 60th
Project of China Postdoctoral Foundation (grant no. 2016M602888),
the China's National Science and Technology Program for Public
Wellbeing (grant no. 2012GS620101) and the National Key Research
and Development Plan (grant no. 2017YFC0908302).
Availability of data and materials
All data generated or analyzed during this study are
included in this published article.
Authors' contributions
CA, HL and YZ were involved in conception and
design. XZ, JW, YQ, XY, QL and QG were involved in the collection
and assembly of data. YZ provided study materials and patients. All
authors contributed to data analysis and interpretation, and wrote
and gave final approved for the manuscript.
Ethics approval and consent to
participate
The experiments were authorized and approved by the
Institutional Animal Care and Use Committee of Gansu University of
Chinese Medicine (Lanzhou, China).
Patient consent for publication
Not applicable.
Competing interests
The authors declare that they have no competing
interests.
Acknowledgments
Not applicable.
References
|
1
|
Yang BH, Parkin DM, Cai L and Zhang ZF:
Cancer burden and trends in the Asian Pacific Rim region. Asian Pac
J Cancer Prev. 5:96–117. 2004.PubMed/NCBI
|
|
2
|
Zheng R, Zeng H, Zhang S and Chen W:
Estimates of cancer incidence and mortality in China, 2013. Chin J
Cancer. 36:662017. View Article : Google Scholar : PubMed/NCBI
|
|
3
|
Jim MA, Pinheiro PS, Carreira H, Espey DK,
Wiggins CL and Weir HK: Stomach cancer survival in the United
States by race and stage (2001–2009): Findings from the CONCORD-2
study. Cancer. 123(Suppl 24): 4994–5013. 2017. View Article : Google Scholar
|
|
4
|
Beck R, Rawet M, Wieland FT and Cassel D:
The COPI system: Molecular mechanisms and function. FEBS Lett.
583:2701–2709. 2009. View Article : Google Scholar : PubMed/NCBI
|
|
5
|
Mi Y, Yu M, Zhang L, Sun C, Wei B, Ding W,
Zhu Y, Tang J, Xia G and Zhu L: COPB2 is upregulated in prostate
cancer and regulates PC-3 cell proliferation, cell cycle, and
apoptosis. Arch Med Res. 47:411–418. 2016. View Article : Google Scholar : PubMed/NCBI
|
|
6
|
Erdogan E, Klee EW, Thompson EA and Fields
AP: Meta-analysis of oncogenic protein kinase Ciota signaling in
lung adenocarcinoma. Clin Cancer Res. 15:1527–1533. 2009.
View Article : Google Scholar : PubMed/NCBI
|
|
7
|
Wang Y, Chai Z, Wang M, Jin Y, Yang A and
Li M: COPB2 suppresses cell proliferation and induces cell cycle
arrest in human colon cancer by regulating cell cycle-related
proteins. Exp Ther Med. 15:777–784. 2018.PubMed/NCBI
|
|
8
|
Livak KJ and Schmittgen TD: Analysis of
relative gene expression data using real-time quantitative PCR and
the 2(−Delta Delta C(T)) Method. Methods. 25:402–408. 2001.
View Article : Google Scholar
|
|
9
|
Committee for the Update of the Guide for
the Care and Use of Laboratory Animals, Institute for Laboratory
Animal Research, Division on Earth and Life Studies, National
Research Council of The National Academies: Guide For The Care And
Use Of Laboratory Animals. 8th edition. The National Academies
Press; Washington, DC: 2011
|
|
10
|
Schuster C, Malinowsky K, Liebmann S, Berg
D, Wolff C, Tran K, Schott C, Reu S, Neumann J, Faber C, et al:
Antibody validation by combining immunohistochemistry and protein
extraction from formalin-fixed paraffin-embedded tissues.
Histopathology. 60(6B): E37–E50. 2012. View Article : Google Scholar : PubMed/NCBI
|
|
11
|
Wang J, Yu S, Cui L, Wang W, Li J, Wang K
and Lao X: Role of SMC1A overexpression as a predictor of poor
prognosis in late stage colorectal cancer. BMC Cancer. 15:902015.
View Article : Google Scholar : PubMed/NCBI
|
|
12
|
Song S, Rosen KM and Corfas G: Biological
function of nuclear receptor tyrosine kinase action. Cold Spring
Harb Perspect Biol. 5:52013. View Article : Google Scholar
|
|
13
|
Bennasroune A, Gardin A, Aunis D, Crémel G
and Hubert P: Tyrosine kinase receptors as attractive targets of
cancer therapy. Crit Rev Oncol Hematol. 50:23–38. 2004. View Article : Google Scholar : PubMed/NCBI
|
|
14
|
Choura M and Rebaï A: Receptor tyrosine
kinases: From biology to pathology. J Recept Signal Transduct Res.
31:387–394. 2011. View Article : Google Scholar : PubMed/NCBI
|
|
15
|
Pytel D, Sliwinski T, Poplawski T,
Ferriola D and Majsterek I: Tyrosine kinase blockers: New hope for
successful cancer therapy. Anticancer Agents Med Chem. 9:66–76.
2009. View Article : Google Scholar : PubMed/NCBI
|
|
16
|
Cripps C, Winquist E, Devries MC,
Stys-Norman D and Gilbert R; Head and Neck Cancer Disease Site
Group: Epidermal growth factor receptor targeted therapy in stages
III and IV head and neck cancer. Curr Oncol. 17:37–48. 2010.
View Article : Google Scholar : PubMed/NCBI
|
|
17
|
Qing L and Qing W: Development of
epidermal growth factor receptor targeted therapy in pancreatic
cancer. Minerva Chir. 73:488–496. 2018. View Article : Google Scholar : PubMed/NCBI
|
|
18
|
Tiseo M, Loprevite M and Ardizzoni A:
Epidermal growth factor receptor inhibitors: A new prospective in
the treatment of lung cancer. Curr Med Chem Anticancer Agents.
4:139–148. 2004. View Article : Google Scholar : PubMed/NCBI
|
|
19
|
Bellmunt J, Hussain M and Dinney CP: Novel
approaches with targeted therapies in bladder cancer. Therapy of
bladder cancer by blockade of the epidermal growth factor receptor
family. Crit Rev Oncol Hematol. 46(Suppl): S85–S104. 2003.
View Article : Google Scholar : PubMed/NCBI
|
|
20
|
Ye Y, Jiang D, Li J, Wang M, Han C, Zhang
X, Zhao C, Wen J and Kan Q: Silencing of FGFR4 could influence the
biological features of gastric cancer cells and its therapeutic
value in gastric cancer. Tumour Biol. 37:3185–3195. 2016.
View Article : Google Scholar
|
|
21
|
Ireton RC and Chen J: EphA2 receptor
tyrosine kinase as a promising target for cancer therapeutics. Curr
Cancer Drug Targets. 5:149–157. 2005. View Article : Google Scholar : PubMed/NCBI
|
|
22
|
Durrant DE and Morrison DK: Targeting the
Raf kinases in human cancer: The Raf dimer dilemma. Br J Cancer.
118:3–8. 2018. View Article : Google Scholar :
|
|
23
|
Nikitakis NG, Siavash H and Sauk JJ:
Targeting the STAT pathway in head and neck cancer: Recent advances
and future prospects. Curr Cancer Drug Targets. 4:637–651. 2004.
View Article : Google Scholar : PubMed/NCBI
|
|
24
|
Turkson J and Jove R: STAT proteins: Novel
molecular targets for cancer drug discovery. Oncogene.
19:6613–6626. 2000. View Article : Google Scholar
|
|
25
|
Heidegger I, Kern J, Ofer P, Klocker H and
Massoner P: Oncogenic functions of IGF1R and INSR in prostate
cancer include enhanced tumor growth, cell migration and
angiogenesis. Oncotarget. 5:2723–2735. 2014. View Article : Google Scholar : PubMed/NCBI
|
|
26
|
Ofer P, Heidegger I, Eder IE, Schöpf B,
Neuwirt H, Geley S, Klocker H and Massoner P: Both IGF1R and INSR
knockdown exert antitumorigenic effects in prostate cancer in vitro
and in vivo. Mol Endocrinol. 29:1694–1707. 2015. View Article : Google Scholar : PubMed/NCBI
|
|
27
|
Zhang Z, Wang J, Ji D, Wang C, Liu R, Wu
Z, Liu L, Zhu D, Chang J, Geng R, et al: Functional genetic
approach identifies MET, HER3, IGF1R, INSR pathways as determinants
of lapatinib unresponsiveness in HER2-positive gastric cancer. Clin
Cancer Res. 20:4559–4573. 2014. View Article : Google Scholar : PubMed/NCBI
|
|
28
|
Kamiya A, Inokuchi M, Otsuki S, Sugita H,
Kato K, Uetake H, Sugihara K, Takagi Y and Kojima K: Prognostic
value of tropomyosin-related kinases A, B, and C in gastric cancer.
Clin Transl Oncol. 18:599–607. 2016. View Article : Google Scholar
|
|
29
|
Kim MS, Suh KW, Hong S and Jin W: TrkC
promotes colorectal cancer growth and metastasis. Oncotarget.
8:41319–41333. 2017.PubMed/NCBI
|
|
30
|
Meldolesi J: Neurotrophin Trk receptors:
New targets for cancer therapy. Rev Physiol Biochem Pharmacol.
174:67–79. 2018. View Article : Google Scholar
|
|
31
|
Yang SY, Nguyen TT, Ung TT and Jung YD:
Role of recepteur d'origine nantais on gastric cancer development
and progression. Chonnam Med J. 53:178–186. 2017. View Article : Google Scholar : PubMed/NCBI
|
|
32
|
Song YA, Park YL, Kim KY, Myung E, Chung
CY, Cho SB, Lee WS, Jung YD, Kweon SS and Joo YE: RON is associated
with tumor progression via the inhibition of apoptosis and cell
cycle arrest in human gastric cancer. Pathol Int. 62:127–136. 2012.
View Article : Google Scholar : PubMed/NCBI
|
|
33
|
Richardson DS, Lai AZ and Mulligan LM: RET
ligand-induced internalization and its consequences for downstream
signaling. Oncogene. 25:3206–3211. 2006. View Article : Google Scholar : PubMed/NCBI
|
|
34
|
Plaza-Menacho I, Mologni L and McDonald
NQ: Mechanisms of RET signaling in cancer: Current and future
implications for targeted therapy. Cell Signal. 26:1743–1752. 2014.
View Article : Google Scholar : PubMed/NCBI
|
|
35
|
Ali S and Ali S: Role of c-kit/SCF in
cause and treatment of gastrointestinal stromal tumors (GIST).
Gene. 401:38–45. 2007. View Article : Google Scholar : PubMed/NCBI
|
|
36
|
Fletcher JA: KIT oncogenic mutations:
Biologic insights, therapeutic advances, and future directions.
Cancer Res. 76:6140–6142. 2016. View Article : Google Scholar : PubMed/NCBI
|
|
37
|
Kiyoi H and Naoe T: Biology, clinical
relevance, and molecularly targeted therapy in acute leukemia with
FLT3 mutation. Int J Hematol. 83:301–308. 2006. View Article : Google Scholar : PubMed/NCBI
|
|
38
|
Schmidt-Arras D, Schwäble J, Böhmer FD and
Serve H: Flt3 receptor tyrosine kinase as a drug target in
leukemia. Curr Pharm Des. 10:1867–1883. 2004. View Article : Google Scholar : PubMed/NCBI
|
|
39
|
He Y, Sun L, Xu Y, Fu L, Li Y, Bao X, Fu
H, Xie C and Lou L: Combined inhibition of PI3Kδ and FLT3 signaling
exerts synergistic antitumor activity and overcomes acquired drug
resistance in FLT3-activated acute myeloid leukemia. Cancer Lett.
420:49–59. 2018. View Article : Google Scholar : PubMed/NCBI
|
|
40
|
Charmsaz S and Boyd AW: Eph receptors as
oncotargets. Oncotarget. 8:81727–81728. 2017. View Article : Google Scholar : PubMed/NCBI
|
|
41
|
Bhatia S, Baig NA, Timofeeva O, Pasquale
EB, Hirsch K, MacDonald TJ, Dritschilo A, Lee YC, Henkemeyer M,
Rood B, et al: Knockdown of EphB1 receptor decreases
medul-loblastoma cell growth and migration and increases cellular
radiosensitization. Oncotarget. 6:8929–8946. 2015. View Article : Google Scholar : PubMed/NCBI
|
|
42
|
Nasreen N, Mohammed KA and Antony VB:
Silencing the receptor EphA2 suppresses the growth and haptotaxis
of malignant mesothelioma cells. Cancer. 107:2425–2435. 2006.
View Article : Google Scholar : PubMed/NCBI
|
|
43
|
Yuan W, Chen Z, Chen Z, Wu S, Guo J, Ge J,
Yang P and Huang J: Silencing of EphA2 inhibits invasion of human
gastric cancer SGC-7901 cells in vitro and in vivo. Neoplasma.
59:105–113. 2012. View Article : Google Scholar
|
|
44
|
Becerikli M, Merwart B, Lam MC, Suppelna
P, Rittig A, Mirmohammedsadegh A, Stricker I, Theiss C, Singer BB,
Jacobsen F, et al: EPHB4 tyrosine-kinase receptor expression and
biological significance in soft tissue sarcoma. Int J Cancer.
136:1781–1791. 2015. View Article : Google Scholar
|
|
45
|
Katoh M: Therapeutics targeting FGF
signaling network in human diseases. Trends Pharmacol Sci.
37:1081–1096. 2016. View Article : Google Scholar : PubMed/NCBI
|
|
46
|
Chien CW, Hou PC, Wu HC, Chang YL, Lin SC,
Lin SC, Lin BW, Lee JC, Chang YJ, Sun HS, et al: Targeting TYRO3
inhibits epithelial-mesenchymal transition and increases drug
sensitivity in colon cancer. Oncogene. 35:5872–5881. 2016.
View Article : Google Scholar : PubMed/NCBI
|
|
47
|
Schmitz R, Valls AF, Yerbes R, von Richter
S, Kahlert C, Loges S, Weitz J, Schneider M, Ruiz de Almodovar C,
Ulrich A, et al: TAM receptors Tyro3 and Mer as novel targets in
colorectal cancer. Oncotarget. 7:56355–56370. 2016. View Article : Google Scholar : PubMed/NCBI
|
|
48
|
Duan Y, Wong W, Chua SC, Wee HL, Lim SG,
Chua BT and Ho HK: Overexpression of Tyro3 and its implications on
hepato-cellular carcinoma progression. Int J Oncol. 48:358–366.
2016. View Article : Google Scholar
|
|
49
|
Ekyalongo RC, Mukohara T, Funakoshi Y,
Tomioka H, Kataoka Y, Shimono Y, Chayahara N, Toyoda M, Kiyota N
and Minami H: TYRO3 as a potential therapeutic target in breast
cancer. Anticancer Res. 34:3337–3345. 2014.PubMed/NCBI
|
|
50
|
Koundouros N and Poulogiannis G:
Phosphoinositide 3-kinase/Akt signaling and redox metabolism in
cancer. Front Oncol. 8:1602018. View Article : Google Scholar : PubMed/NCBI
|
|
51
|
Faes S and Dormond O: PI3K and AKT:
Unfaithful partners in cancer. Int J Mol Sci. 16:21138–21152. 2015.
View Article : Google Scholar : PubMed/NCBI
|
|
52
|
Sasaki T, Kuniyasu H, Luo Y, Kitayoshi M,
Tanabe E, Kato D, Shinya S, Fujii K, Ohmori H and Yamashita Y: AKT
activation and telomerase reverse transcriptase expression are
concurrently associated with prognosis of gastric cancer.
Pathobiology. 81:36–41. 2014. View Article : Google Scholar
|
|
53
|
Zhou Y, Yamada N, Tanaka T, Hori T,
Yokoyama S, Hayakawa Y, Yano S, Fukuoka J, Koizumi K, Saiki I, et
al: Crucial roles of RSK in cell motility by catalysing serine
phosphorylation of EphA2. Nat Commun. 6:76792015. View Article : Google Scholar : PubMed/NCBI
|
|
54
|
Hamaoka Y, Negishi M and Katoh H: EphA2 is
a key effector of the MEK/ERK/RSK pathway regulating glioblastoma
cell proliferation. Cell Signal. 28:937–945. 2016. View Article : Google Scholar : PubMed/NCBI
|
|
55
|
Ma Q, Guin S, Padhye SS, Zhou YQ, Zhang RW
and Wang MH: Ribosomal protein S6 kinase (RSK)-2 as a central
effector molecule in RON receptor tyrosine kinase mediated
epithelial to mesenchymal transition induced by
macrophage-stimulating protein. Mol Cancer. 10:662011. View Article : Google Scholar : PubMed/NCBI
|
|
56
|
Srinivasan D, Kaetzel DM and Plattner R:
Reciprocal regulation of Abl and receptor tyrosine kinases. Cell
Signal. 21:1143–1150. 2009. View Article : Google Scholar : PubMed/NCBI
|
|
57
|
Yezhelyev MV, Koehl G, Guba M, Brabletz T,
Jauch KW, Ryan A, Barge A, Green T, Fennell M and Bruns CJ:
Inhibition of SRC tyrosine kinase as treatment for human pancreatic
cancer growing orthotopically in nude mice. Clin Cancer Res.
10:8028–8036. 2004. View Article : Google Scholar : PubMed/NCBI
|
|
58
|
Bieerkehazhi S, Chen Z, Zhao Y, Yu Y,
Zhang H, Vasudevan SA, Woodfield SE, Tao L, Yi JS, Muscal JA, et
al: Novel Src/Abl tyrosine kinase inhibitor bosutinib suppresses
neuroblastoma growth via inhibiting Src/Abl signaling. Oncotarget.
8:1469–1480. 2017. View Article : Google Scholar :
|
|
59
|
Kong L, Deng Z, Zhao Y, Wang Y, Sarkar FH
and Zhang Y: Down-regulation of phospho-non-receptor Src tyrosine
kinases contributes to growth inhibition of cervical cancer cells.
Med Oncol. 28:1495–1506. 2011. View Article : Google Scholar
|
|
60
|
Harr MW, Caimi PF, McColl KS, Zhong F,
Patel SN, Barr PM and Distelhorst CW: Inhibition of Lck enhances
glucocorticoid sensitivity and apoptosis in lymphoid cell lines and
in chronic lymphocytic leukemia. Cell Death Differ. 17:1381–1391.
2010. View Article : Google Scholar : PubMed/NCBI
|
|
61
|
Kim MJ, Park MT, Yoon CH, Byun JY and Lee
SJ: Activation of Lck is critically required for
sphingosine-induced conformational activation of Bak and
mitochondrial cell death. Biochem Biophys Res Commun. 370:353–358.
2008. View Article : Google Scholar : PubMed/NCBI
|
|
62
|
Kanda N, Seno H, Konda Y, Marusawa H,
Kanai M, Nakajima T, Kawashima T, Nanakin A, Sawabu T, Uenoyama Y,
et al: STAT3 is constitutively activated and supports cell survival
in association with survivin expression in gastric cancer cells.
Oncogene. 23:4921–4929. 2004. View Article : Google Scholar : PubMed/NCBI
|
|
63
|
Murone M, Vaslin Chessex A, Attinger A,
Ramachandra R, Shetty SJ, Daginakatte G, Sengupta S, Marappan S,
Dhodheri S, Rigotti S, et al: Debio 0617B inhibits growth of
STAT3-driven solid tumors through combined inhibition of JAK, SRC,
and class III/V receptor tyrosine kinases. Mol Cancer Ther.
15:2334–2343. 2016. View Article : Google Scholar : PubMed/NCBI
|
|
64
|
Leong PL, Andrews GA, Johnson DE, Dyer KF,
Xi S, Mai JC, Robbins PD, Gadiparthi S, Burke NA, Watkins SF, et
al: Targeted inhibition of Stat3 with a decoy oligonucleotide
abrogates head and neck cancer cell growth. Proc Natl Acad Sci USA.
100:4138–4143. 2003. View Article : Google Scholar : PubMed/NCBI
|
|
65
|
Gu J, Li G, Sun T, Su Y, Zhang X, Shen J,
Tian Z and Zhang J: Blockage of the STAT3 signaling pathway with a
decoy oligo-nucleotide suppresses growth of human malignant glioma
cells. J Neurooncol. 89:9–17. 2008. View Article : Google Scholar : PubMed/NCBI
|
|
66
|
Mora LB, Buettner R, Seigne J, Diaz J,
Ahmad N, Garcia R, Bowman T, Falcone R, Fairclough R, Cantor A, et
al: Constitutive activation of Stat3 in human prostate tumors and
cell lines: Direct inhibition of Stat3 signaling induces apoptosis
of prostate cancer cells. Cancer Res. 62:6659–6666. 2002.PubMed/NCBI
|
|
67
|
Kim C, Kim JH, Oh EY, Nam D, Lee SG, Lee
J, Kim SH, Shim BS and Ahn KS: Blockage of STAT3 signaling pathway
by morusin induces apoptosis and inhibits invasion in human
pancreatic tumor cells. Pancreas. 45:409–419. 2016. View Article : Google Scholar
|
|
68
|
Sun Y, Guo BF, Xu LB, Zhong JT, Liu ZW,
Liang H, Wen NY, Yun WJ, Zhang L and Zhao XJ: Stat3-siRNA inhibits
the growth of gastric cancer in vitro and in vivo. Cell Biochem
Funct. 33:495–502. 2015. View Article : Google Scholar : PubMed/NCBI
|