Introduction
Colorectal cancer (CRC) is the third most commonly
diagnosed malignancy and the fourth leading cause of cancer-related
mortality worldwide (1). It is
expected that the number of patients with CRC will increase by 60%,
to exceed 2.2 million by the year 2030 (1). Despite significant progress being
made over the past decades, a number of events related to the
pathogenesis, metastasis, progression and relapse of CRC remain
unclear. During the past 10 years, seminal studies have provided
evidence of the existence of cancer stem cell-like cells (CSC-like
cells) in CRC. These cells represent a specific tumor cellular
fraction with the ability to self-renew, an unregulated
proliferation resulting in abnormal growth, slow-cycling, and
differentiation into a non-tumorigenic cell progeny (2,3).
CSC-like cells seem to play a crucial role in the resistance to
conventional chemotherapy that is directed mainly against rapidly
replicating cells. Moreover, it has been suggested that
chemotherapy and/or radiotherapy may contribute to the formation of
a CSC-like population (4).
CSC-like cells also participate in the mechanisms of metastasis
since epithelial-mesenchymal transition (EMT) and cells with a
CSC-like phenotype share similar molecular pathways (5,6).
Hence, the isolation and advanced characterization of CSC-like
cells is claimed as a pre-requisite of effective CRC treatment.
Marked investments in the cancer research field have
not yet improved new cancer drug approval rates, which are
estimated at <5% and are markedly lower than those in other
therapeutic areas, e.g., 20% for cardiovascular diseases (7). Although a number of factors
contribute to such a poor result of anticancer drug development,
one of the most relevant involves inadequate models for the testing
of agents. The commonly used preclinical models fail to
recapitulate the complexity and heterogeneity of human cancers and
the hampered drug penetration into different areas of the tumor
bulk, which occurs in the natural microenvironment (8,9).
Monolayer cell cultures are unable to mimic the natural elements of
the tumor spatial organization. Hence, in recent years, spherical
models of cancer cell cultures have gained popularity, as they more
adequately represent tumor growth and in vivo development
(2,3,8,10,11).
Therefore, a crucial process for the effective testing of
anticancer drugs is the development of novel in vitro cell
culture systems that can better reproduce such traits of in
vivo tumors as varied expression of genes, access to nutrients,
oxygen, growth factors or waste metabolites delivery systems
(8). Notably, spherical cultures
were presented as a population enriched in cells possessing
CSC-like traits (12). This
statement was based on the unusual features of CSC-like cells which
do not require connections to extracellular matrix molecules or
other cells, whereas non-CSC-like cells required such junctions
with the environment for survival. By contrast, non-CSC-like cells
undergo anoikis when they are not anchored, unless they are
protected by cytokines or exosomes released by CSC-like cells
(13,14), but of note is the fact that spheres
also contain more differentiated tumor cells. A number of different
approaches have been proposed to detect and isolate CSC-like cells
from the overall tumor cell population, such as cell sorting,
functional tests based on their colony-formation ability or
resistance to chemo- or radiotherapy, molecular analyses using PCR
techniques and image-based methods (15). As CSC-like cells can be
characterized by the expression of some cell-surface antigens and
soluble proteins, cell sorting is one of the most commonly used
techniques for the isolation of CSC-like cells. However, CSC-like
cells represent a diversified population which can reside in
multiple, alternative phenotypic states within a tumor, accounting
for intratumoral cell heterogeneity (16,17).
Although cell sorting can enrich the cancer cell population with
cells possessing tumor-initiating capacity, the expression of
CSC-markers is variable, not only among patient samples, but also
between established cancer cell lines (2,3,10,18,19).
Independently of some discrepancies in the estimations of the
number of CSC-like cells within spherical cell culture systems, it
can be claimed that spherical models present a useful tool for
testing the effectiveness of anticancer agents.
Despite the continuous therapeutic progress, cancer
recurrence and therapeutic resistance still occur in the majority
of patients. Conventional treatment with CRC-targeting
chemotherapeutic regimens principally include different
combinations of 5-fluorouracil (5-FU), oxaliplatin, leucovorin or
irinotecan (20). However,
patients evolve resistance to these therapeutics, which
necessitates attempts to improve the efficacy of treatment through
the combination of drugs. Studies published over the past decade
have suggested that 5-acetylsalicylic acid (or aspirin; ASA) may be
effective in primary cancer prevention and in reducing the risk of
adenomas and CRC; e.g., the use of ASA was associated with a 28%
reduction in the risk of death from CRC and a 12% reduction in the
risk of death from any type of cancer (21). ASA has been also investigated in
other types of cancer, including esophageal, breast, prostate and
lung cancer (22). The exact
mechanisms of action of ASA as regards anticancer
prevention/treatment have not yet been fully explained. ASA
irreversibly, but not selectively, inactivates both cyclooxygenase
(COX)-1 and COX-2 (22). Moreover,
ASA may be involved in the inhibition of the mammalian target of
rapamycin (mTOR) signaling pathway (23) and in the induction of AMP-activated
protein kinase (23), affecting
the phosphoinositide 3-kinase (PI3K) pathway (24) or its crosstalk with COX-2 (24). ASA and its prodrugs may also affect
CSC-like cells through the disruption of nuclear factor (NF)-κB
activity (25,26) or the inhibition of
prostaglandin-endoperoxide synthase 2 (PTGS2) and the activation of
peroxisome proliferator-activated receptor γ (PPARG) (27). Targeting epidermal growth factor
receptor (EGFR) by monoclonal antibodies was previously presented
as an effective therapy in some patients with CRC (20,28).
These anticancer drugs may affect major downstream pathways
activated by EGFR, such as the RAS/RAF/mitogen-activated protein
kinase (MAPK), PI3K/phosphatase and tensin homologue (PTEN)/AKT and
JAK/signal transducer and activator of transcription (STAT)
pathways, and may thus regulate/inhibit cancer cell growth and
proliferation (28,29).
The aim of this study was to assess the effects of
5-FU, anti-EGFR antibody and ASA on the behavior and survival of
colonospheres derived from CRC cell lines cultured in a serum-free
medium. We performed multiple analyses to determine the effects of
the tested therapeutic agents, alone or in combination, on the
cancer cells with particular focus on the CSC-like cells present
within the spherical cultures. In particular, we paid attention to
the CSC-suppressing activity of the agents included in this
study.
Materials and methods
Cell lines and cell culture
The HT29 human adenocarcinoma colorectal cell line
and HCT116 human colorectal carcionoma cell line were originally
purchased from the American Type Culture Collection (ATCC). The
cells were cultured at 37°C under a humidified atmosphere of 5%
CO2 in medium recommended by ATCC, i.e., McCoy's medium
supplemented with 10% fetal bovine serum (FBS), 1%
penicillin-streptomycin and 2 mM L-glutamine. All experimental
chemicals were purchased from Sigma-Aldrich.
Expansion of CRC lines in the spherical
form and incubation with the tested drugs
The original adherently cultured cells were
cultivated in the medium recommended by the manufacturer,
trypsinized, washed twice in PBS and maintained in a serum-free
stem cell medium (referred to as SCM) containing DMEM-F12
supplemented with ITS Liquid Media Complement, 5 mM HEPES, 4 mg/ml
bovine serum albumin (BSA), 2 nM L-glutamine, 20 ng/ml epidermal
growth factor (EGF), 20 ng/ml basic fibroblast growth factor (bFGF)
and antibiotic antimycotic solution. For passaging, the spheroid
cultures were collected into a tube, centrifuged (400 × g; 10 min;
4°C) and resuspended in fresh SCM following rigorous pipetting to
dissociate the the spheres into cell suspension. All experimental
chemicals were purchased from Sigma-Aldrich, apart from the growth
factors, which were purchased from R&D Systems.
A total of 5×10⁶ cells were seeded in
24-well ultra-low attachment plates and maintained in SCM. After 4
passages, the newly formed spheres were treated with 50 µM
5-FU, 1.5 mM ASA (both from Sigma-Aldrich), 20 µg/ml
anti-EGFR antibody (Santa Cruz Biotechnology) or their combinations
dissolved in a freshly prepared culture medium. 5-FU and anti-EGFR
antibody solutions were prepared in DMEM/F12 medium, whereas ASA
was dissolved in dimethyl sulfoxide (DMSO) (Sigma-Aldrich). In all
the experiments, the DMSO concentration was never higher than 1%
(v/v) and did not affect cell growth. All solutions were prepared
immediately prior use. The control cells were maintained in SCM.
Changes in the morphology and size of the spheres were determined
after 72 h of incubation at 37°C (under a humidified atmosphere of
5% CO2) under an inverted microscope Olympus-CKX53
coupled with Olympus SC50 digital camera (Olympus).
Sphere formation following pre-treatment
of adherent cells with the tested drugs
The assay was carried out with an aim to determine
the ability of CRC cell lines to form colonospheres following
72-h-long incubation (at 37°C) of the cells cultured in adherent
form with the tested drugs. A total of 5×10⁶ of parental
adherent cells were cultured in standard 24-well plates in complete
McCoy's medium (Sigma-Aldrich) and incubated at 37°C for 24 h to
induce cell adherence. The medium was then removed and replaced
with complete McCoy's medium supplemented with 50 µM 5-FU,
1.5 mM ASA, or 20 µg/ml anti-EGFR, alone or in combination
for 72 h. Subsequently, the cells were washed with PBS
(Sigma-Aldrich) and suspended in the bovine serum-free SCM in
24-well ultra-low attachment plates for 7 days. The medium was
replaced every 3 days. The ability of the cells to form
colonospheres was assessed after that time was documented by a
series of images obtained using an inverted microscope
(Olympus).
Secondary sphere formation
A total of 5×10⁶ adherent cells were
seeded in 24-well ultra-low attachment plates and maintained in
DMEM/F12 (Sigma-Aldrich) with all the required supplements. After 4
passages, the spheres were treated with 50 µM 5-FU, 1.5 mM
ASA, 20 µg/ml anti-EGFR antibody or their combination for 72
h. The cells were then collected, washed in PBS (Sigma-Aldrich) and
resuspended in fresh supplemented DMEM/F12 medium. The cells were
then seeded in 24-well ultra-low attachment plate for 7 days. Their
ability to form colonospheres was assessed after that time and
documented by a series of images obtained using an inverted
microscope (Olympus).
Phenotypic analysis of cell suspensions
obtained from colonospheres
Colonospheres were washed with rigorous pipetting in
PBS (Sigma-Aldrich) for 5 min to obtain a suspension of individual
cells. Subsequently, 1×10⁵ cells were suspended in 100
µl and stained with 10 µl of the following monoclonal
antibodies: anti-CD29-APC (clone MAR4, IgG1, κ) (559883),
anti-CD44-FITC (clone, G44-26, IgG2b, κ) (555478), anti-FasL-biotin
(clone NOK-1, IgG1) (556374) coupled with streptavidin-APC
(554067), anti-CD95-PE (555674) (all from BD Biosciences) and
anti-CD133/2-PE (clone 293C3, IgG2b, κ) (130-112-195; Miltenyi
Biotec). Following incubation for 30 min in the dark at room
temperature, the samples were resuspended in PBS with EDTA
(Sigma-Aldrich) (to avoid cell clustering) for further analysis.
Flow cytometric analyses were performed using a FACSCalibur flow
cytometer (BD Biosciences) and BD CellQuest Pro Software. The
acquisition gates were restricted to cell gates based on
morphological characteristics (FSC-Forward SCatter vs. SSC-Side
SCatter), and at least 30,000 cells were acquired and analyzed. The
results are expressed as a percentage of the studied cell
population. Data were further analyzed with BD CellQuest Pro
software (BD Biosciences).
Cell death assay
The 7-aminoactinomycin D (7-AAD) dye (BD
Biosciences), a DNA-binding compound, was used for the cytometric
measurement of the fraction of dead cells. Following the addition
of 10 µl of Via-Probe reagent, 1×10⁵ cells were
incubated for 30 min at room temperature, washed and re-suspended
in PBS with EDTA (Sigma-Aldrich) prior to cytometric analysis. The
acquisition gates were restricted to cell gates based on
morphological characteristics (FSC vs. SSC), and at least 30,000
cells were acquired and analyzed. The results are expressed as a
percentage of the studied cell population.
Analysis of apoptotic and necrotic
cells
The Annexin-V-FITC Apoptosis Detection kit I was
used to measure the translocation of phosphatidylserine within the
membranes of apoptotic cells according to the manufacturer's
instructions (BD Biosciences). A total of 1×10⁶ cells
were suspended in 1 ml of binding buffer. Subsequently, 5 µl
of Annexin-V (An-V)-FITC and 5 µl of propidium iodide (PI)
were added, gently pipetted and the cells were then incubated for
15 min at room temperature in the dark. After that time, 400
µl of binding buffer were added and flow cytometric analysis
was performed within 1 h. All experimental chemicals were purchased
from BD Biosciences. The acquisition gates were restricted to cell
gates based on morphological characteristics (FSC vs. SSC), and at
least 30,000 cells were acquired and analyzed. The results are
expressed as a percentage of the studied cell population.
Caspase-3 activation assay
Caspase-3, synthesized as an inactive pro-enzyme, is
a key protease that is activated during apoptosis. The percentage
of cells with active caspase-3 was measured cytometrically by
applying monoclonal anti-active-caspase-3 antibody. A total of
1×10⁶ cells were suspended in the
Fixation/Permeabilization solution for 20 min at 4°C. Staining of
the cells was followed by washing them in the Perm/Wash Buffer. The
excess of antibody was removed by washing in the Perm/Wash Buffer
and analysis was performed using FACSCalibur flow cytometer (BD
Biosciences). All experimental chemicals were purchased from BD
Biosciences. The acquisition gates were restricted to cell gates
based on morphological characteristics (FSC vs. SSC), and at least
30,000 cells were acquired and analyzed. The results are expressed
as a percentage of the studied cell population.
Mitochondrial membrane depolarization
assay
A total of 5×10⁵ cells were suspended in
the Stain Buffer and the MitoStatus Red solution was added to
obtain the final concentration of 20 nM. The cells were incubated
for 30 min at 37°C in the dark and then washed twice. Subsequently,
200 µl of Stain Buffer was used to suspend the stained
cells. Differences in mitochondrial membrane depolarization between
the tested and control cells were assessed on a FACSCalibur flow
cytometer (BD Biosciences). All experimental chemicals were
purchased from BD Biosciences. The acquisition gates were
restricted to cell gates based on morphological characteristics
(FSC vs. SSC), and at least 20,000 cells were acquired and
analyzed. The results are expressed as a percentage of the studied
cell population.
Cell proliferation assay
Cell proliferation was measured by the CellTrace™
Cell Proliferation kit (Invitrogen; Thermo Fisher Scientific)
according to the manufacturer's protocol. Briefly, 5×10⁶
cells from colonospheres in suspension were incubated with 5
µM CellTrace-carboxyfluoresceinsuccinimidyl ester (CFSE) Dye
for 20 min at 37°C in the dark. Subsequently, the excess of unbound
dye was removed by addition of culture medium and centrifugation.
Pelleted cells were re-suspended in complete serum-free medium
containing 5-FU, ASA anti-EGFR antibody or their combination and
cultured for 3 days prior to analysis on a FACSCalibur flow
cytometer (BD Biosciences). The acquisition gates were restricted
to cell gates based on morphological characteristics (FSC vs. SSC),
and at least 50,000 cells were acquired and analyzed. The results
are expressed as a percentage of the studied cell population.
Cell cycle analysis in colonospheres
After culturing the colonospheres for 7 days, cells
were washed twice in PBS (BD Biosciences), and 1×10⁷
cells were fixed in 70% ethanol (EtOH) at −20°C. After 2 weeks,
EtOH was removed by centrifugation in 400 × g for 5 min at room
temperature and cell pellet was washed with cold PBS (400 × g; 10
min; 4°C) and resuspended in 450 µl in staining buffer
composed of PBS (Sigma-Aldrich), PI (50 µg/ml) (BD
Biosciences) and RNase A (25 µg/ml) (Sigma-Aldrich),
incubated for 30 min in the dark at 37°C, and finally analyzed
using a FACSCalibur flow cytometer (BD Biosciences). The
acquisition gates were restricted to cell gates based on
morphological characteristics (FSC vs. SSC), next pulse processing
was used to exclude cell clumps and doublets from the analysis
(FL-2A vs. FL-2W) and finally those gates were combined and applied
to PI histogram plots.
Acridine orange staining
The morphological changes of the drug-treated cells
were examined microscopically following acridine orange (AO)
staining (Sigma-Aldrich). By AO staining, viable cells appear
green, whereas early apoptotic cells stain green and show chromatin
condensation or nuclear fragmentation presented as bright green
dots in nuclei. When AO is protonated and trapped in acidic
vesicular organelles (AVOs), it forms aggregates which emit bright
red fluorescence in concentration-dependent manner. AO solution was
prepared before use by mixing AO stock (1 mg/ml) with PBS
(Sigma-Aldrich). Following drug treatment, the cells were washed
and suspended in PBS. Forty-five microliters of cell suspension was
mixed gently with 5 µl of AO solution to obtain a final
concentration of 1 µg/ml AO. The samples were incubated for
15 min in the dark, placed onto microscopic poly-L-lysine-coated
slides (Sigma-Aldrich) and covered with glass coverslips thereon.
The slides were examined under a fluorescence microscope Nikon
Eclipse E800 (Nikon).
Measurement of the presence of COX-2
The expression of COX-2 in the stimulated and
non-stimulated cells was determined by intracellular staining.
Following fixation and permeabilization of cells, they were washed
in Perm/Wash Buffer (BD Biosciences) and stained with monoclonal
anti-COX-2-PE antibody (IgG1, κ) (565125; BD Biosciences).
Following 30 min of incubation in the dark at room temperature,
samples were fixed and prepared for cytometric analysis using a
FACSCalibur flow cytometer (BD Biosciences).
COX-2 activity assay
COX-2 activity was measured using a fluorimetric
Cyclooxygenase Activity Assay kit according to manufacturer's
protocol (Abcam). Briefly, standards were prepared and read on a
microplate reader Synergy H1 (BioTek). Next steps included
preparation of COX Working Solution, Arachidonic Acid Working
Solution and Reaction Mix as described in the protocol. Protein
concentration in the lysates from spheres treated for 72 h with
5-FU, ASA, anti-EGFR antibody or their combination was measured
with Bradford reagent (Sigma-Aldrich). On the 96 well ultra-low
attachment plates combination of Reaction Buffer Mix, COX specific
inhibitor, DMSO and cell lysates samples were added. Arachidonic
Acid Solution was added to each well immediately before the read on
a microplate reader. Fluorescence was measured at Ex/Em = 535/587
nm every 2 min for 1 h. Each probe was prepared in duplicate.
Standard curve was used to determine the activity of COX-2 in the
samples.
Statistical analysis
Data were analyzed using the GraphPad Prism ver.
6.05 (GraphPad Software) and Statistica 12 software (Statsoft). The
statistical significance of differences between mean values was
based on non-parametric tests, such as Mann-Whitney U test or
Kruskal-Wallis test followed by Dunn's multiple comparisons test as
a post hoc procedure, moreover Spearman's rank coefficient was used
to assess correlation. All data are presented as the means ±
standard error of the mean (SEM) based on at least 3 independent
experiments.
Results
Morphology and size of colonospheres
after treatment with drugs
Based on our preliminary experiments (data not
shown) to establish the effective concentrations of the tested
drugs and the results of other studies (12,30-33),
in this study, we decided to use the following concentrations of
the tested drugs: 50 µM 5-FU, 1.5 mM ASA and 20 µg/ml
anti-EGFR antibody.
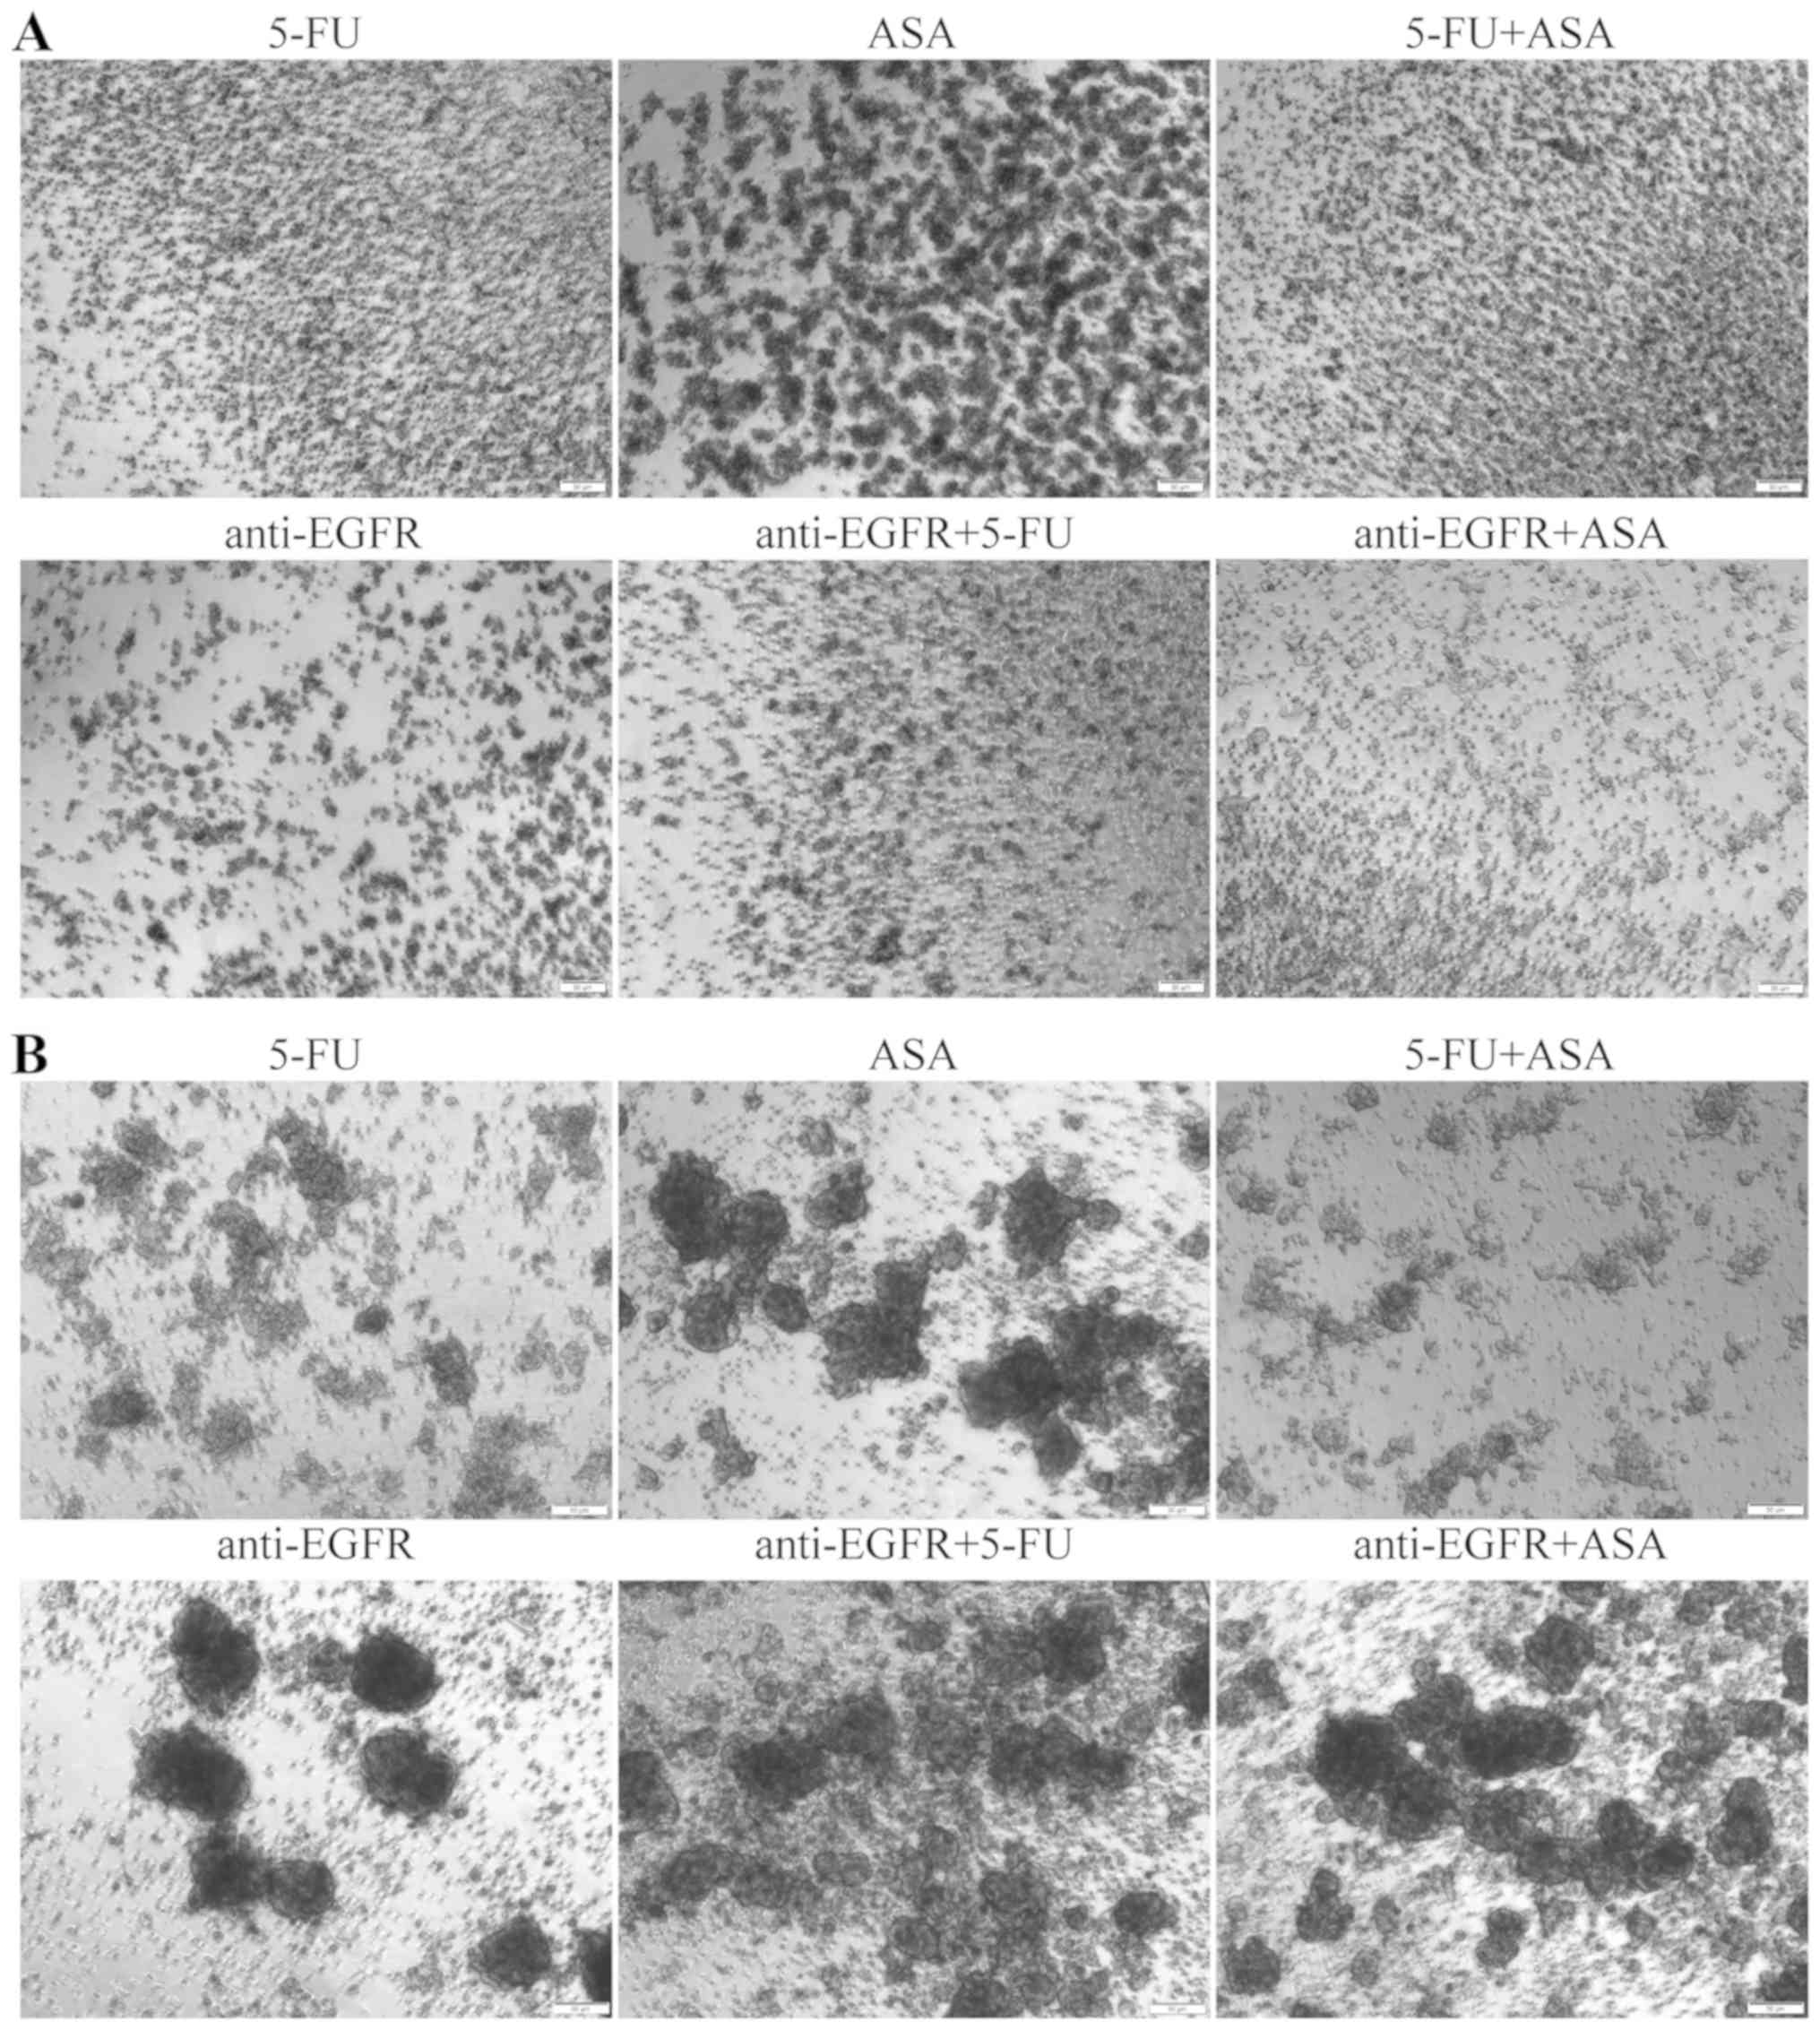
All the tested drugs produced visible changes in the
morphology of spheres derived from both tested CRC cell lines. The
HCT116 cell-derived spheres seemed to retain their characteristic
outline even when the amount of dead cells and debris in the medium
visibly increased following treatment with 5-FU, ASA and 5-FU + ASA
(Fig. 1A). Notably, the
colonospheres stimulated with anti-EGFR antibody, anti-EGFR
antibody + 5-FU, and anti-EGFR antibody + ASA acquired a more
swelled appearance. Moreover, the HCT116 cell-derived spheres
treated with anti-EGFR antibody + 5-FU and anti-EGFR antibody + ASA
were almost deprived of clearly visible dead cells, which were
present in the absence of anti-EGFR antibody in the medium. The
size of the HCT116 cell-derived colonospheres was significantly
reduced when the cells were treated with used drugs and their
combinations (Fig. 1B).
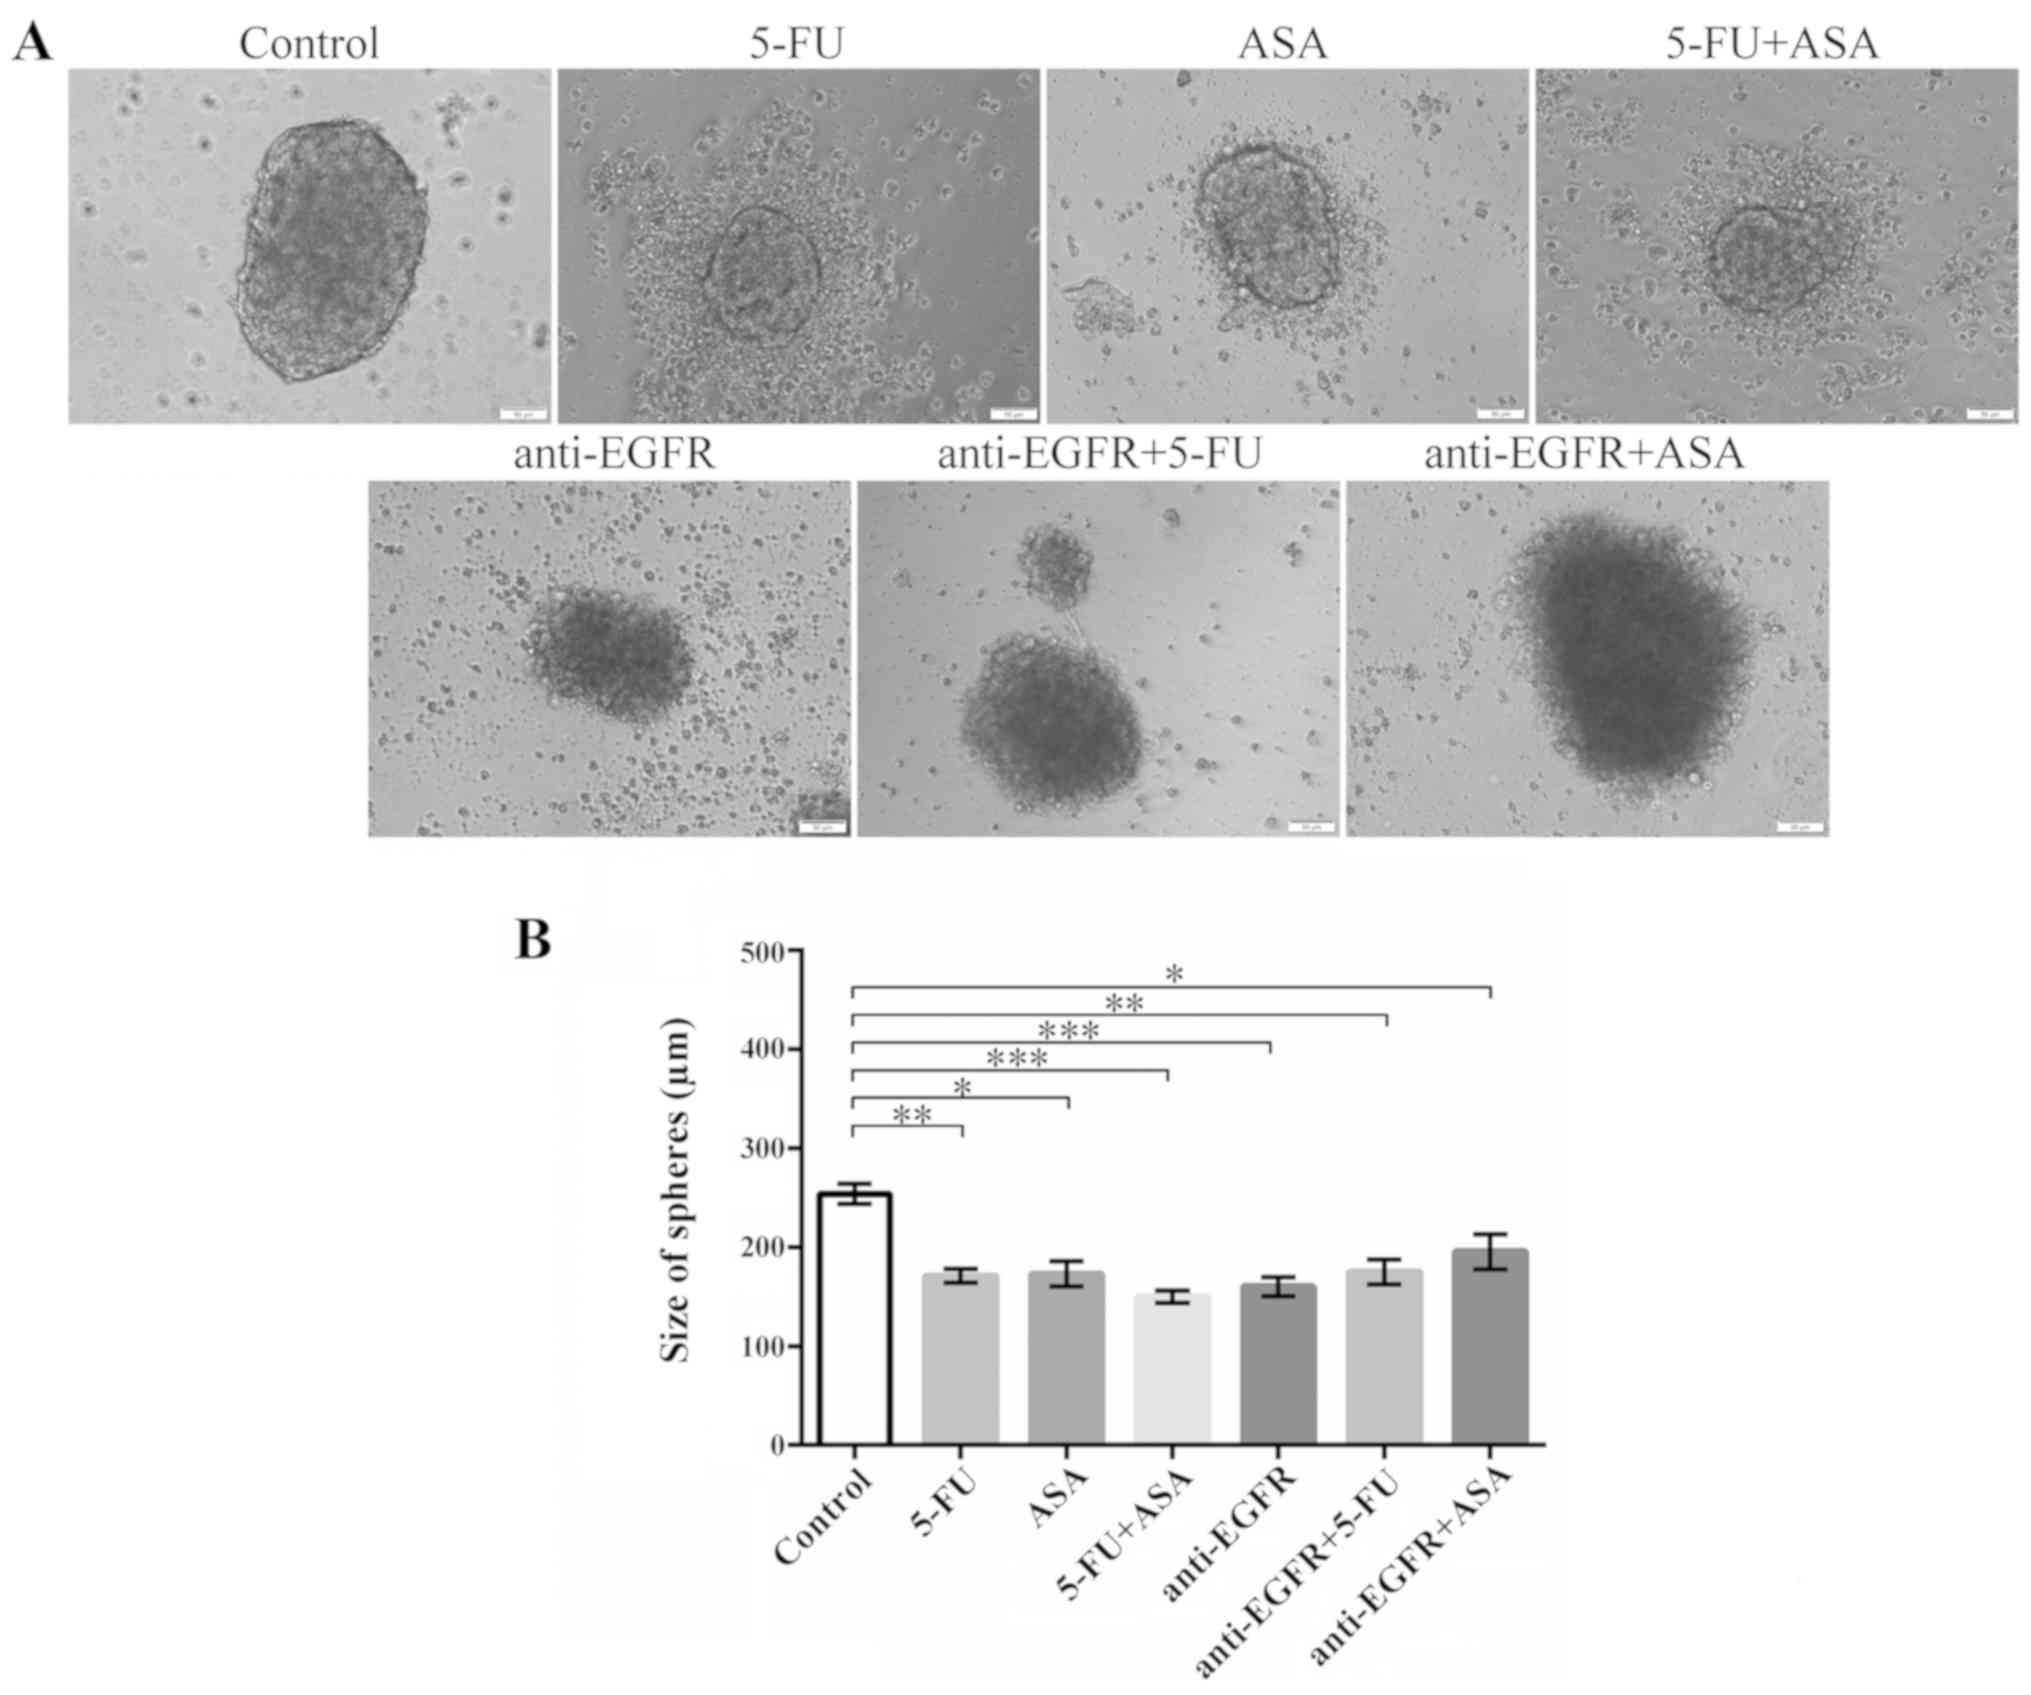 | Figure 1Effects of the drugs on the
morphology and size of HCT116-derived colonospheres. HCT116-derived
colonospheres were incubated with 5-FU, ASA anti-EGFR antibody and
their combinations for 72 h. (A) Morphology of colonospheres
cultured with the drugs. Scale bar, 50 µm. (B) Size of
HCT116 cell-derived spheres following incubation with the drugs.
Statistically significant differences assessed by Kruskal-Wallis
test followed by Dunn's test as a post hoc procedure.
*P<0.05, **P<0.001 and
***P<0.0001. The number of replicates N for
particular experiments were: NCONTROL = 13,
N5-FU = 12, NASA = 10, N5-FU+ASA =
13, Nanti-EGFR = 24, Nanti-EGFR+5-FU = 14,
Nanti-EGFR+ASA = 15. All data are presented as the means
± SEM. 5-FU, 5-fluorouracil; ASA, aspirin; EGFR, epidermal growth
factor receptor. |
A similar analysis was performed for colonospheres
derived from the HT29 CRC cell line (Fig. 2). The morphology of the spheres was
markedly affected by all drugs and their combinations, with the
most notable change being observed in the HT29 cell-derived
colonospheres cultured with ASA, 5-FU + ASA, and anti-EGFR antibody
(Fig. 2A). These evident
structural changes were paralleled by the drug-induced reduction of
spheres' diameter (Fig. 2B). The
largest reduction in the size of the colonospheres was observed
following their incubation with 5-FU + ASA and anti-EGFR antibody +
ASA, while 5-FU or anti-EGFR alone were less effective. Notably,
anti-EGFR antibody treatment alone did not decrease the size of the
HT29 cell-derived colonospheres.
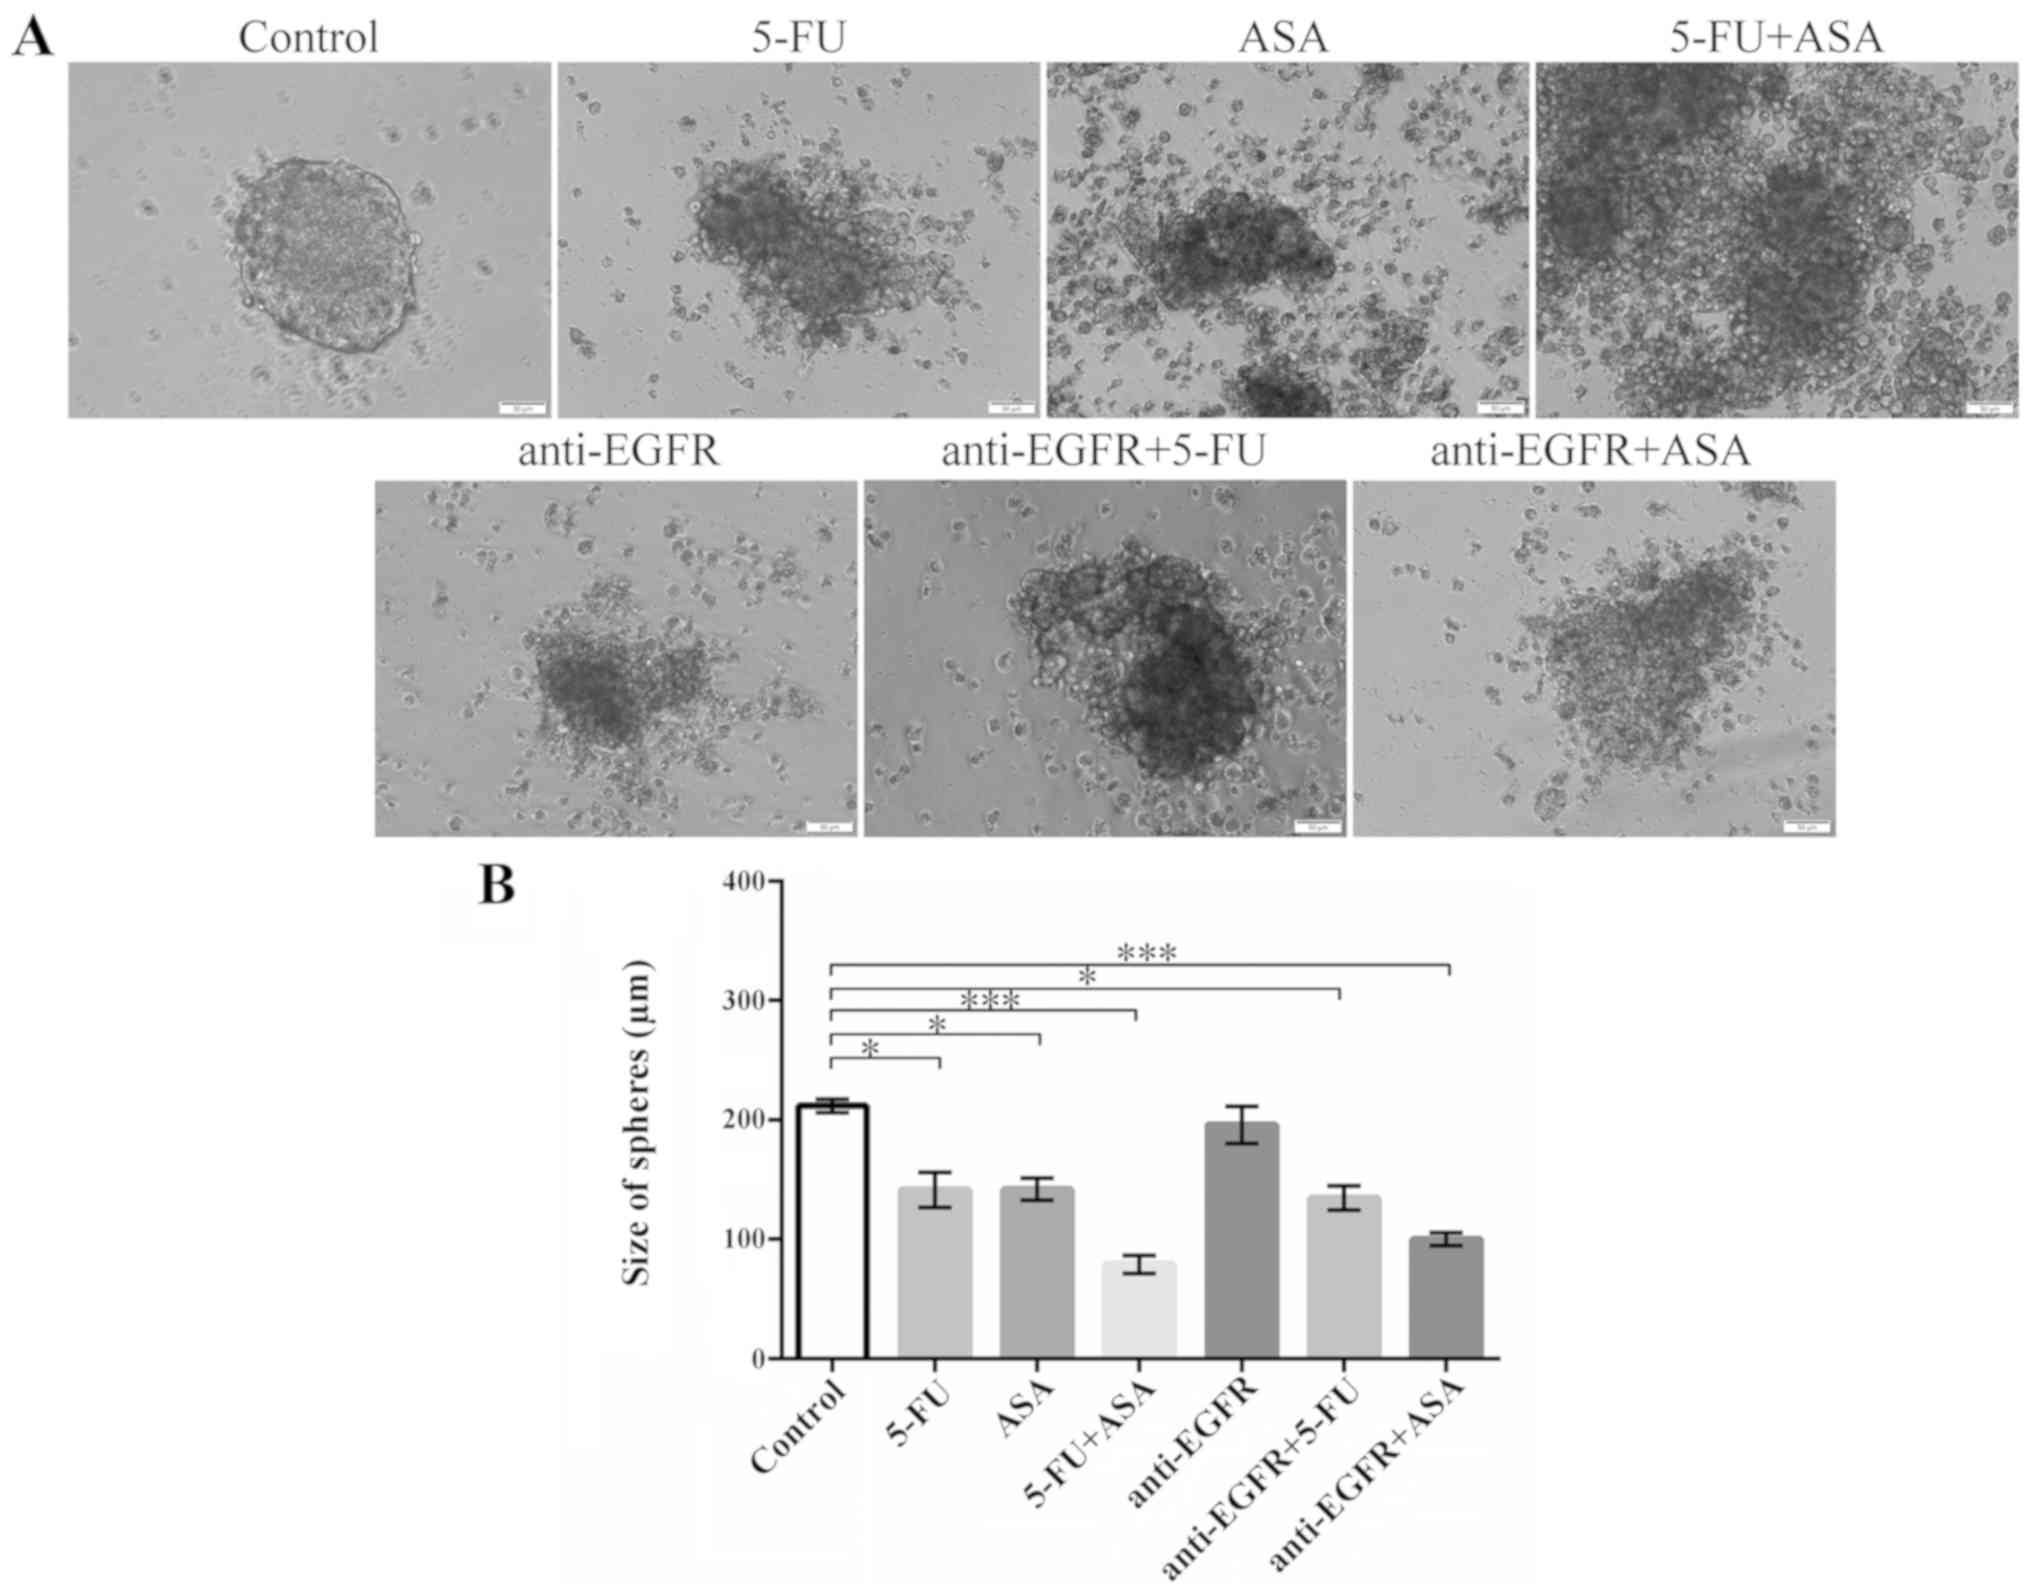 | Figure 2Effects of the drugs on the
morphology and size of HT29-derived colonospheres. HT29-derived
colonospheres were incubated with 5-FU, ASA, anti-EGFR and their
combinations for 72 h. (A) Morphology of colonospheres cultured
with the drugs. Scale bar, 50 µm. (B) Size of HT29
cell-derived spheres following incubation with the drugs.
Statistically significant differences assessed by Kruskal-Wallis
test followed by Dunn's test as a post hoc procedure.
*P<0.05 and ***P<0.0001. The number of
replicates N for particular experiments were: NCONTROL =
12, N5-FU = 16, NASA = 16,
N5-FU+ASA = 14, Nanti-EGFR = 11,
Nanti-EGFR+5-FU = 11, Nanti-EGFR+ASA = 11.
All data are presented as the means ± SEM. 5-FU, 5-fluorouracil;
ASA, aspirin; EGFR, epidermal growth factor receptor. |
Additionally, to compare the sensitivity of the
cells cultured in the adherent and spherical forms to the tested
drugs, we conducted two independent experiments. First, we
incubated adherent cells with 5-FU, ASA and anti-EGFR antibody, or
their combinations for 72 h and the cells were then transferred
into SCM to assess their ability to form colonospheres, which
reflects their tumor-initiating capacity (Fig. 3A). Both CRC cell lines presented
similar results; thus, we prepared a representative panel
presenting data for only the HT29 cells cultured for 7 days in
medium dedicated for CSC-like cells. After that time, untreated
HT29 cells should form colonospheres with the typical morphology
presented in Fig. 2. However, the
pre-treated cells were evidently affected by the used agents and
exhibited a reduced ability to create spheres (Fig. 3A). The formation of small clusters
of aggregated cells was most evident for the ASA-pre-treated cells
in comparison to the other incubations. In addition, the anti-EGFR
antibody- and anti-EGFR antibody + 5-FU-pre-treated cultures
apparently contained smaller amorphic spheres (rather than cell
aggregates), whereas the 5-FU + ASA- and anti-EGFR antibody +
ASA-pre-treated cells practically did not form colonospheres.
To determine the heterogeneity of the cells within
spheres, we washed the cultures treated with the tested agents for
72 h, and seeded the cell suspension in fresh SCM. After 7 days, we
examined the effects of the agents on the 'secondary sphere'
formation ability, reflecting the tumor-initiating capacity and
susceptibility of the CSC-like cells to the used agents in both CRC
lines. The results for both cell lines were similar; thus, we
present a representative panel for the HT29 cell line only
(Fig. 3B). The combination of 5-FU
+ ASA suppressed the re-formation of colonospheres to the highest
degree. Notably, ASA and anti-EGFR antibody alone or in combination
only slightly suppressed the re-aggregation of cells, as we
observed many freely-floating spheres following such incubations.
In general, the colonospheres of the both CRC cell lines analyzed
presented a higher tumor-initiating capacity in comparison to their
adherent cultures, suggesting that they are more resistant to the
chemotherapy, probably due to the occurrence of more primitive and
quiescent CSC-like cells.
Phenotypic analysis of colonospheres
following drug treatment
The phenotypic analysis of the drug-treated spheres
aimed to determine the fractions of putative CSC-like cells that
express characteristic markers, such as CD133, CD29 and CD44
(10,20). We observed a significant decrease
in the percentage of CD133+ cells, a marker which was
for the first time used to define CSC-like cells from CRC (2,3), in
HCT116 cell-derived spheres following incubation with the majority
of the applied drugs. Surprisingly, neither 5-FU alone nor its
combination with anti-EGFR antibody markedly affected the fraction
of CD133+ cells (Fig.
4A). When the spherical population was analyzed with respect to
the presence of CD29 and CD44 integrins, we noted a lack of changes
in the CD29/CD44-positive cell population except for the HCT116
cells treated with anti-EGFR antibody + ASA, which presented an
elevated percentage of CD29/CD44-positive cells in comparison to
the control (Fig. 4B). The
untreated HT29 cell-derived spheres presented a lower percentage of
CD133+ cells than the HCT116 cell-derived spheres, as we
have reported previously (10).
Phenotypic analysis revealed a statistically significant decrease
in the fraction of HT29-CD133+ only in the 5-FU +
ASA-treated cells (Fig. 4C).
Notably, none of the tested drugs markedly affected the
CD29+CD44+ fraction within the HT29-derived
colonospheres (Fig. 4D).
Phenotypic analysis confirmed that the CSC-like fraction was not
vulnerable to the therapeutic agents since it was only slightly
affected by the tested drugs.
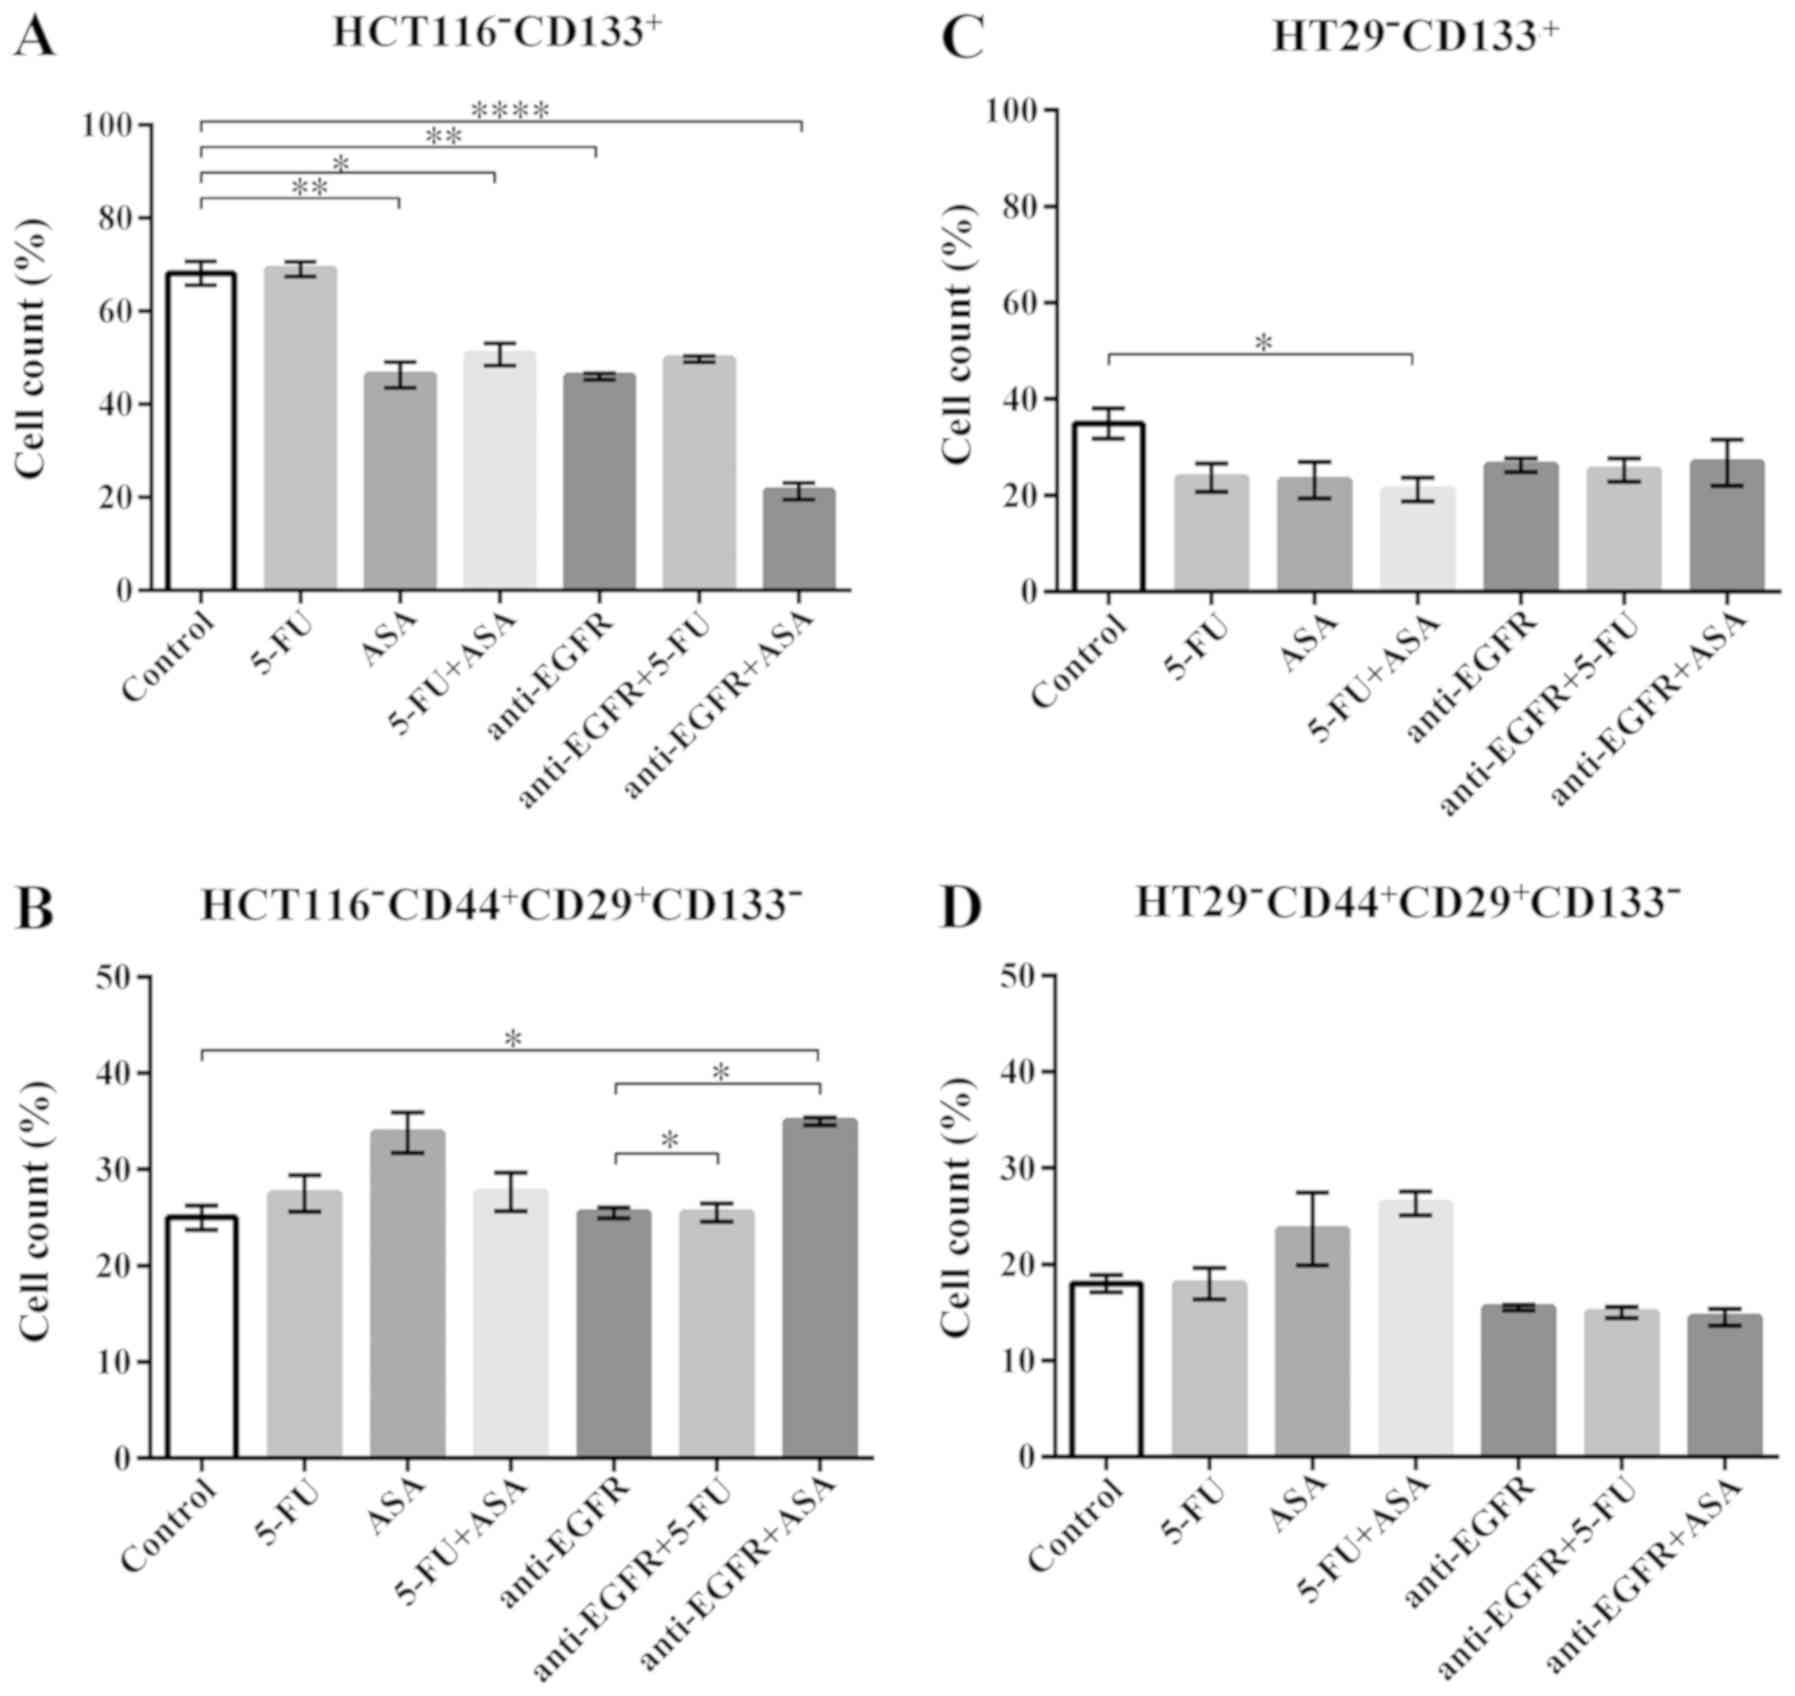 | Figure 4The phenotype of cells present in
colonospheres derived from the HCT116 and HT29 CRC cell lines
cultured with the drugs for 72 h. (A and C) The percentage of cells
expressing the CSC marker, CD133, in HCT116 cell- and HT29
cell-derived spheres, respectively. The number of replicates N for
particular experiments with HCT116-derived colonospheres were:
NCONTROL = 14, N5-FU = 12, NASA =
12, N5-FU+ASA = 12, Nanti-EGFR = 6,
Nanti-EGFR+5-FU = 8, Nanti-EGFR+ASA = 6. For
HT29-derived colonospheres: NCONTROL = 8,
N5-FU = 6, NASA = 6, N5-FU+ASA =
6, Nanti-EGFR = 6, Nanti-EGFR+5-FU = 6,
Nanti-EGFR+ASA = 6. (B and D) The percentage of cells
expressing the CSC markers, CD44 and CD29, in HCT116 cell- and HT29
cell-derived colonospheres, respectively. For HCT116-derived
colonospheres: NCONTROL = 8, N5-FU = 12,
NASA = 12, N5-FU+ASA = 12,
Nanti=EGFR = 8, Nanti=EGFR+5-FU = 8,
Nanti=EGFR+ASA = 8. For HT29-derived colonospheres:
NCONTROL = 10, N5-FU = 6, NASA =
6, N5-FU+ASA = 6, Nanti-EGFR = 6,
Nanti-EGFR+5-FU = 6, Nanti-EGFR+ASA = 6.
Cells were analyzed by flow cytometry. Statistically significant
differences assessed by Kruskal-Wallis test followed by Dunn's test
as a post hoc procedure. *P<0.05,
**P<0.005 and ****P<0.0005. All data
are presented as the means ± SEM. 5-FU, 5-fluorouracil; ASA,
aspirin; EGFR, epidermal growth factor receptor. |
Analysis of FasL and FasR expression in
CRC spheres following drug treatment
Fas receptor (termed FasR), commonly known as the
death receptor, and one of its ligands, FasL, may trigger the
apoptotic process. However, recent studies have also suggested the
non-apoptotic activity of this signaling pathway, not only to
maintain the cellular homeostasis, but also the CSC-like population
(34-37). Thus, in this study, we aimed to
determine whether 5-FU, ASA, anti-EGFR antibody, and their
combinations could affect the expression of FasL and FasR in the
treated spherical cultures of the tested CRC cell lines.
We found that only the HCT116-derived colonospheres
treated with ASA displayed a significantly lower number of
FasL+ cells in comparison to the untreated control
(85.5±5.4%), whereas the other drugs did not affect FasL expression
compared to the control (Fig. 5A).
When the FasR level was tested in the HCT116-derived colonospheres,
no significant alterations in the percentage of FasR-expressing
cells were noted following treatment with the tested drugs in
comparison to the unstimulated cells (Fig. 5B).
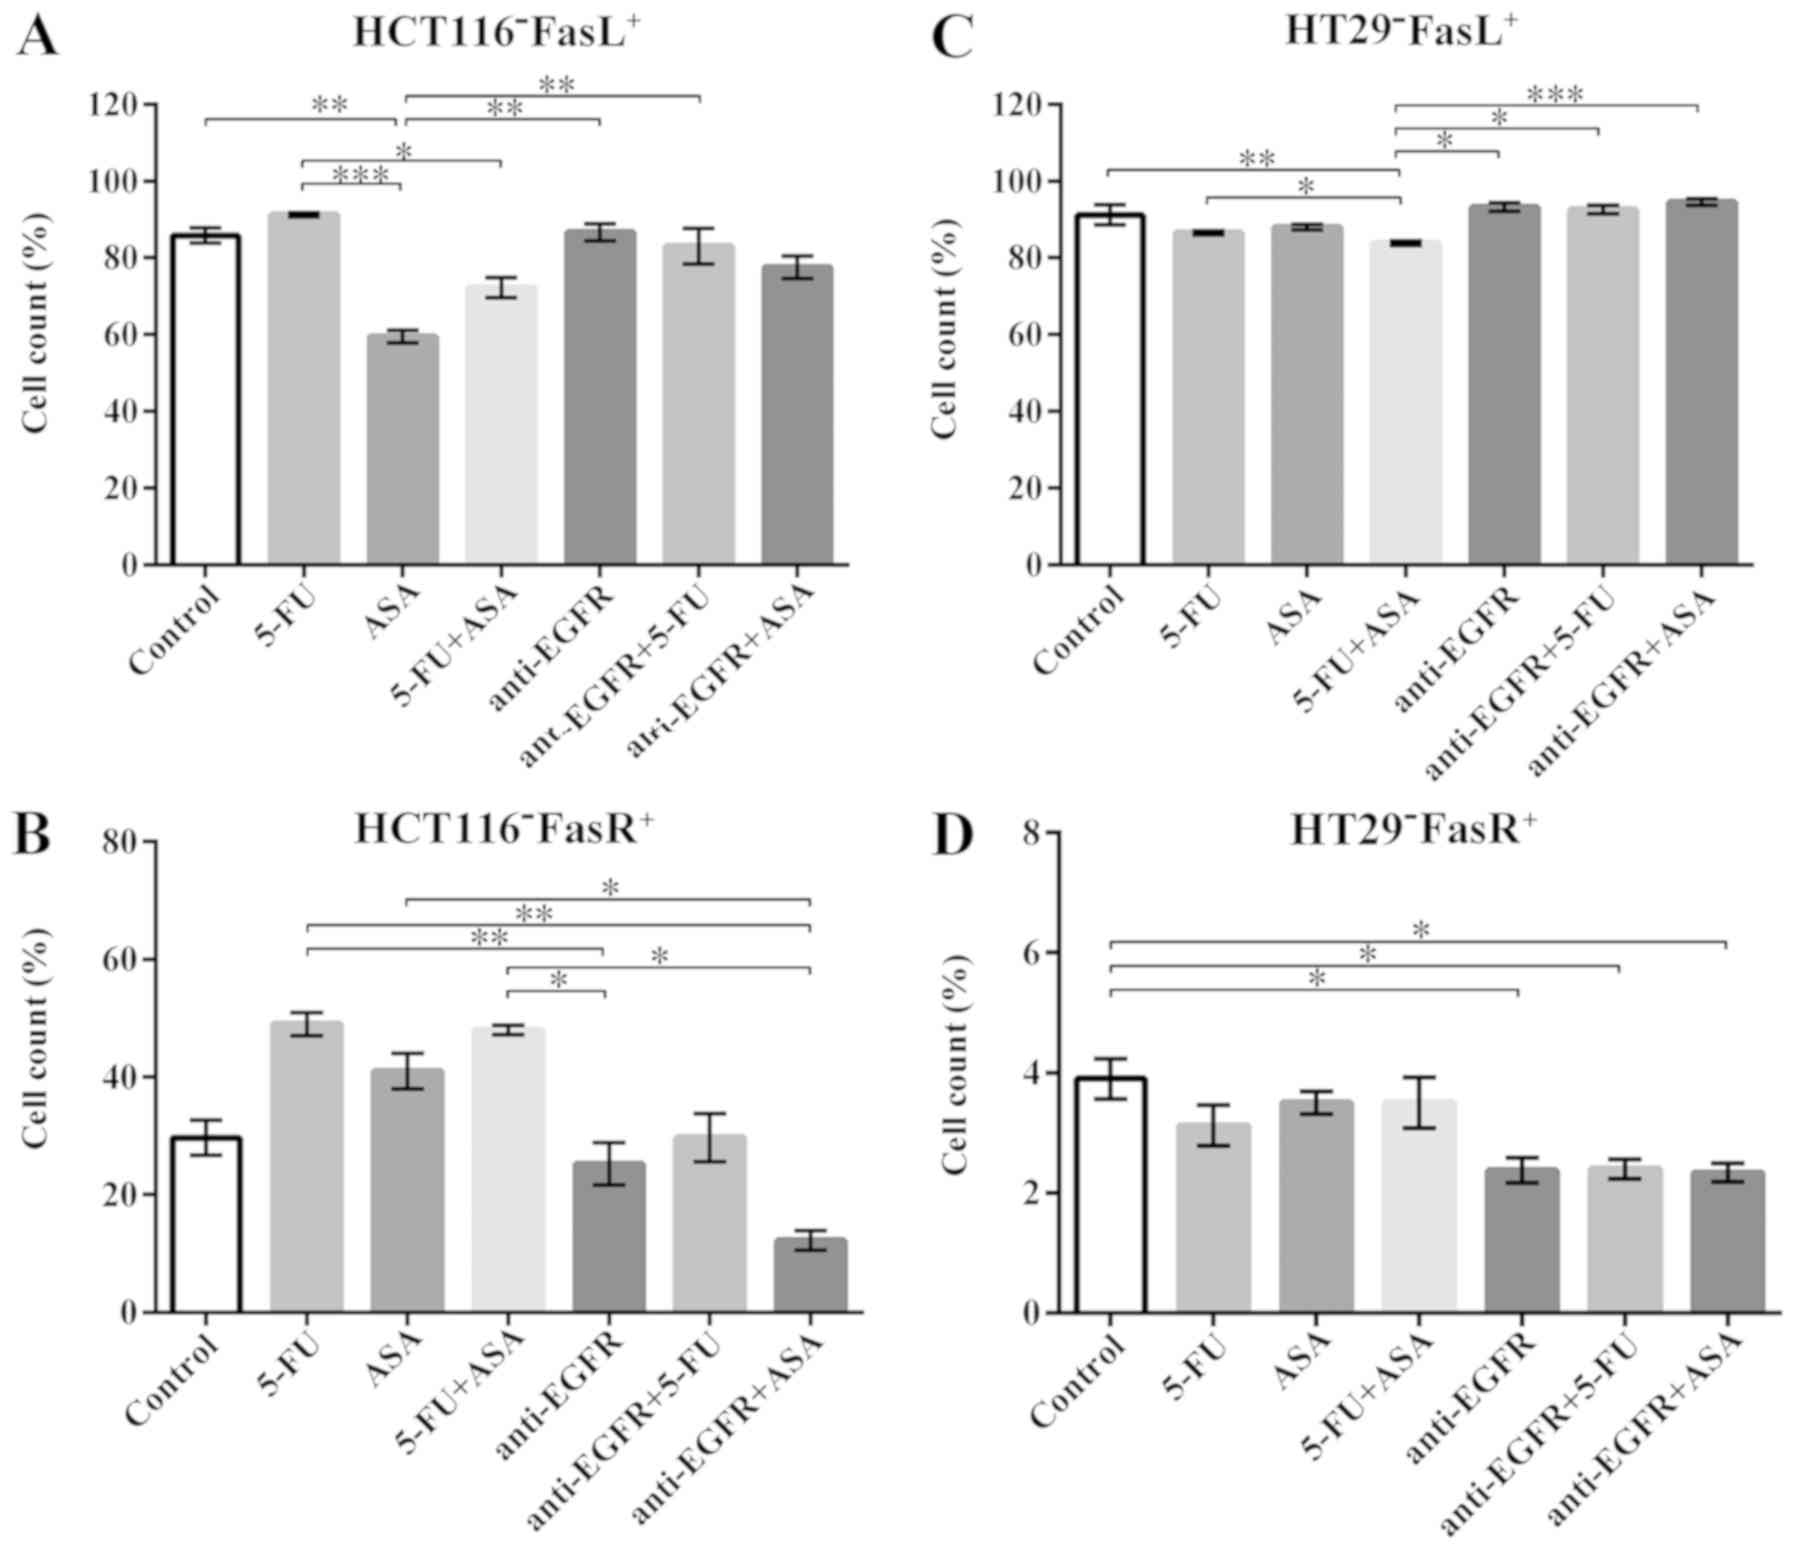 | Figure 5Effect of the drugs on the FasL and
FasR presence on the surface of HCT116 and HT29 cells cultured with
5-FU, ASA, anti-EGFR antibody, and their combinations. (A and C)
The percentage of FasL-positive cells in HCT116- and HT29-cells,
respectively, quantified by flow cytometry. The number of
replicates N for particular experiments with HCT116-derived
colonospheres were: N = 8. For HT29-derived colonospheres:
NCONTROL = 10, N5-FU = 8, NASA =
8, N5-FU+ASA = 8, Nanti-EGFR = 9,
Nanti-EGFR+5-FU = 9, Nanti-EGFR+ASA = 9. (B
and D) The percentage of FasR-positive cells in HCT116 cells and
HT29 cells, respectively, quantified by flow cytometry. For
HCT116-derived colonospheres: NCONTROL = 10,
N5-FU = 8, NASA = 8, N5-FU+ASA =
8, Nanti-EGFR = 8, Nanti-EGFR+5-FU = 8,
Nanti-EGFR+ASA = 8. For HT29-derived colonospheres:
NCONTROL = 10, N5-FU = 8, NASA =
8, N5-FU+ASA = 8, Nanti-EGFR = 8,
Nanti-EGFR+5-FU = 8, Nanti-EGFR+ASA = 8.
Statistically significant differences assessed by Kruskal-Wallis
test followed by Dunn's test as a post hoc procedure.
*P<0.05, **P<0.005 and
***P<0.0005. All data presented as the means ± SEM.
5-FU, 5-fluorouracil; ASA, aspirin; EGFR, epidermal growth factor
receptor. |
We found that in the HT29-derived colonospheres,
91.2±8.6% of the control cells were FasL+ whereas 5-FU +
ASA stimulation significantly decreased that number to 84.3±1.3%
(Fig. 5C). Notably, the
combination of ASA with anti-EGFR antibody was not as effective and
abolished the suppressive effect of ASA. In general, the HT29
cell-derived spheres contained a high fraction of FasL-positive
cells, while the percentage of cells exhibiting FasR on their
surface was extremely low and did not exceed 6% (Fig. 5D). Moreover, the HT29 cell line
seemed to be more sensitive to anti-EGFR antibody and its
combination with 5-FU or ASA treatment; thus, only these drugs
diminished the FasR+ population.
Viability of the HCT116
derived-colonospheres following drug treatment
We evaluated the percentage of non-viable cells
following incubation with the agents in both cultured CRC cell
lines by flow cytometry using 7-AAD dye. 7-AAD is excluded from
viable cells, but binds selectively to GC regions of the DNA of
damaged cells. Statistical analysis revealed that the viability of
the HCT116-derived colonospheres was not affected by incubation
with each of the drugs alone; however, the combinations of the
agents significantly decreased the viability (Fig. 6A).
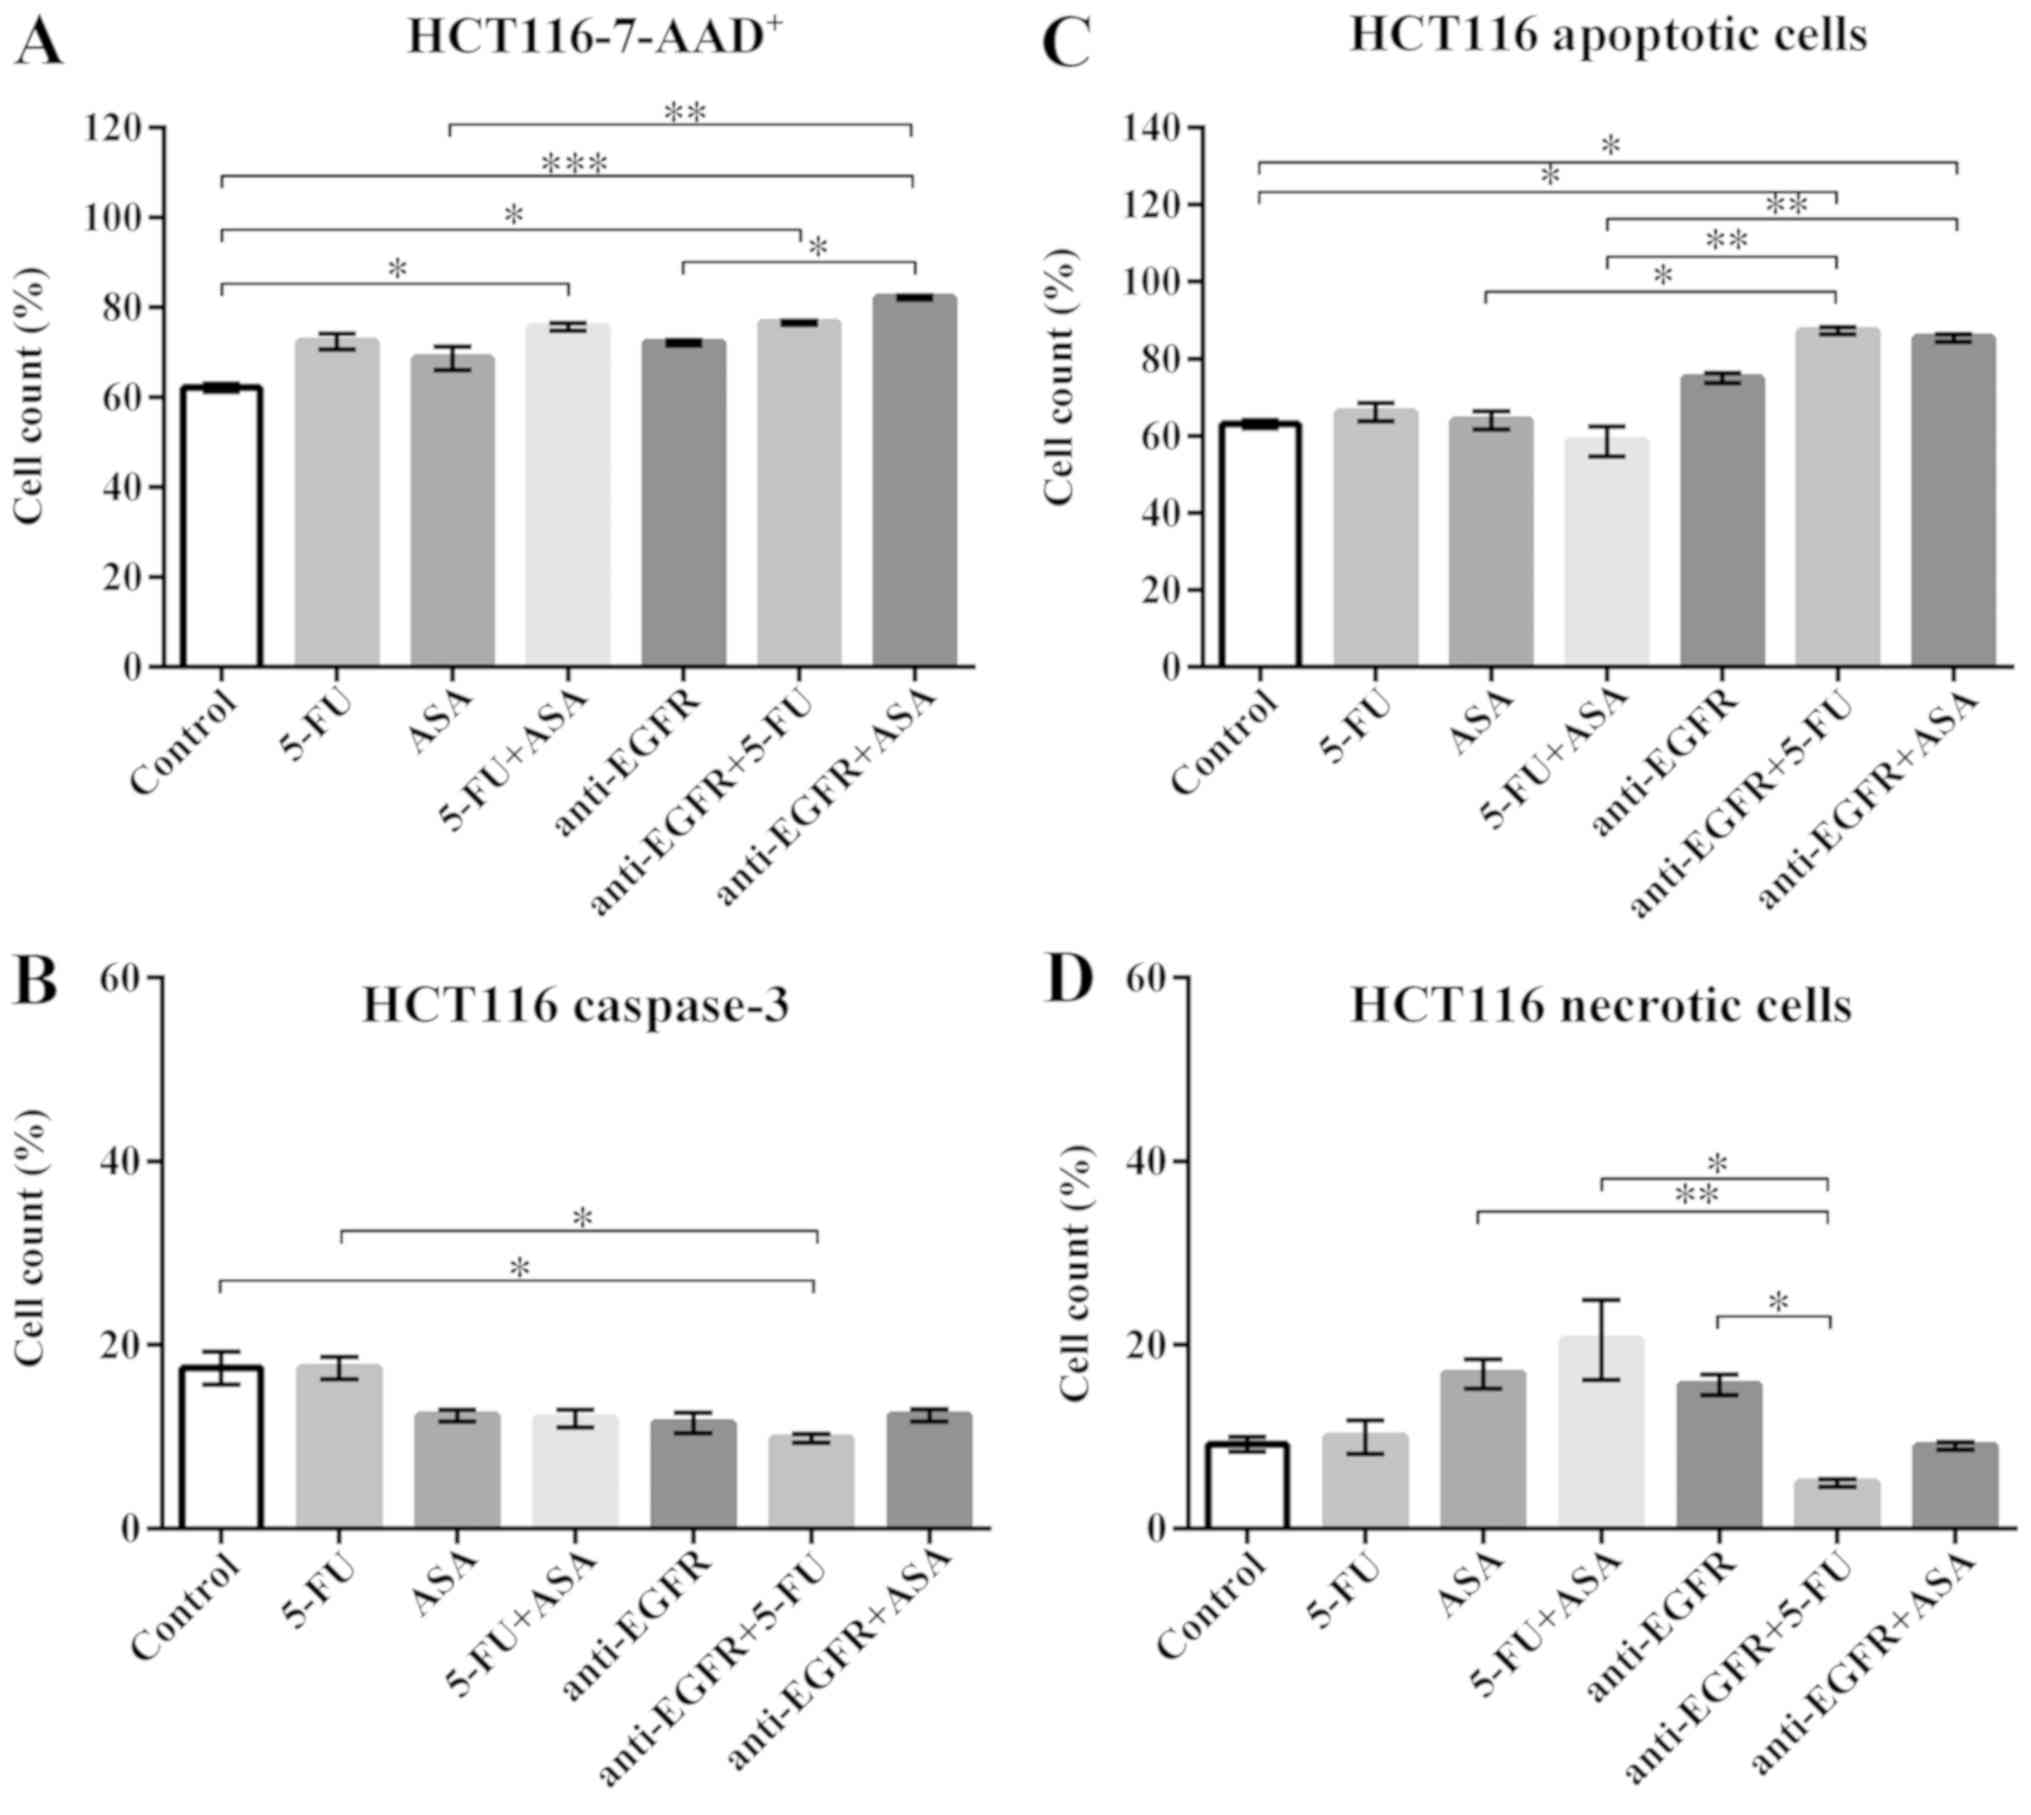 | Figure 6Effects of drugs on various measures
of viability of HCT116-derived colonospheres. (A) 7-AAD staining of
HCT116 cell-derived spheres. The number of replicates N = 6. (B)
The expression of caspase-3 in HCT116 cell-derived spheres. The
number of replicates N for particular experiments were:
NCONTROL = 8, N5-FU = 8, NASA =
12, N5-FU+ASA = 10, Nanti-EGFR = 6,
Nanti-EGFR+5-FU = 6, Nanti-EGFR+ASA = 6. (C)
Annexin-V (An) and PI staining of apoptotic cells within HCT116
cell-derived spheres. NCONTROL = 6, N5-FU =
7, NASA = 5, N5-FU+ASA = 7,
Nanti-EGFR = 5, Nanti-EGFR+5-FU = 5,
Nanti-EGFR+ASA = 5. (D) The percentage of necrotic
(An-PI+) cells within HCT116 cell-derived spheres.
NCONTROL = 6, N5-FU = 7, NASA = 5,
N5-FU+ASA = 7, Nanti-EGFR = 5,
Nanti-EGFR+5-FU = 5, Nanti-EGFR+ASA = 5.
Statistically significant differences assessed by Kruskal-Wallis
test followed by Dunn's test as a post hoc procedure.
*P<0.05, **P<0.005 and
***P<0.0005. All data presented as the means ± SEM.
5-FU, 5-fluorouracil; ASA, aspirin; EGFR, epidermal growth factor
receptor. |
To assess whether the changes in the percentage of
non-viable cells are caused by apoptosis, we measured the presence
of a key protease activated during the process, i.e., active
caspase-3. The HCT116 cell-derived control population presented
17.5±4.7% of cells expressing an active form of caspase-3. Although
a reductive tendency was observed for all drugs, apart from 5-FU,
statistical analysis revealed that the fraction of
caspase-3-positive cells decreased when the HCT116-derived
colonospheres were incubated with anti-EGFR antibody + 5-FU
(9.9±0.9%) only compared to the control (Fig. 6B).
An-V and PI staining was used to determine the
fractions of apoptotic and necrotic cells. In contrast to active
caspase-3 expression, An-V staining detects cells with
phosphatidylserine in the extracellular layer of cell membrane, one
of the basic features of the apoptosis, while PI penetrates cells
with more permeable plasma membrane. The incubation of the
HCT116-derived colonospheres with anti-EGFR antibody + 5-FU and
anti-EGFR antibody + ASA, but not with the other drugs or their
combinations, increased the percentage of apoptotic cells compared
to the control (Fig. 6C). The
simultaneous staining with An-V and PI revealed that the control
HCT116-derived colonospheres contained 9.2±1.9% of necrotic cells
(Ann-V−PI+). Surprisingly, none of the tested
drugs or their combinations affected the percentage of necrotic
cells compared to the control (Fig.
6D).
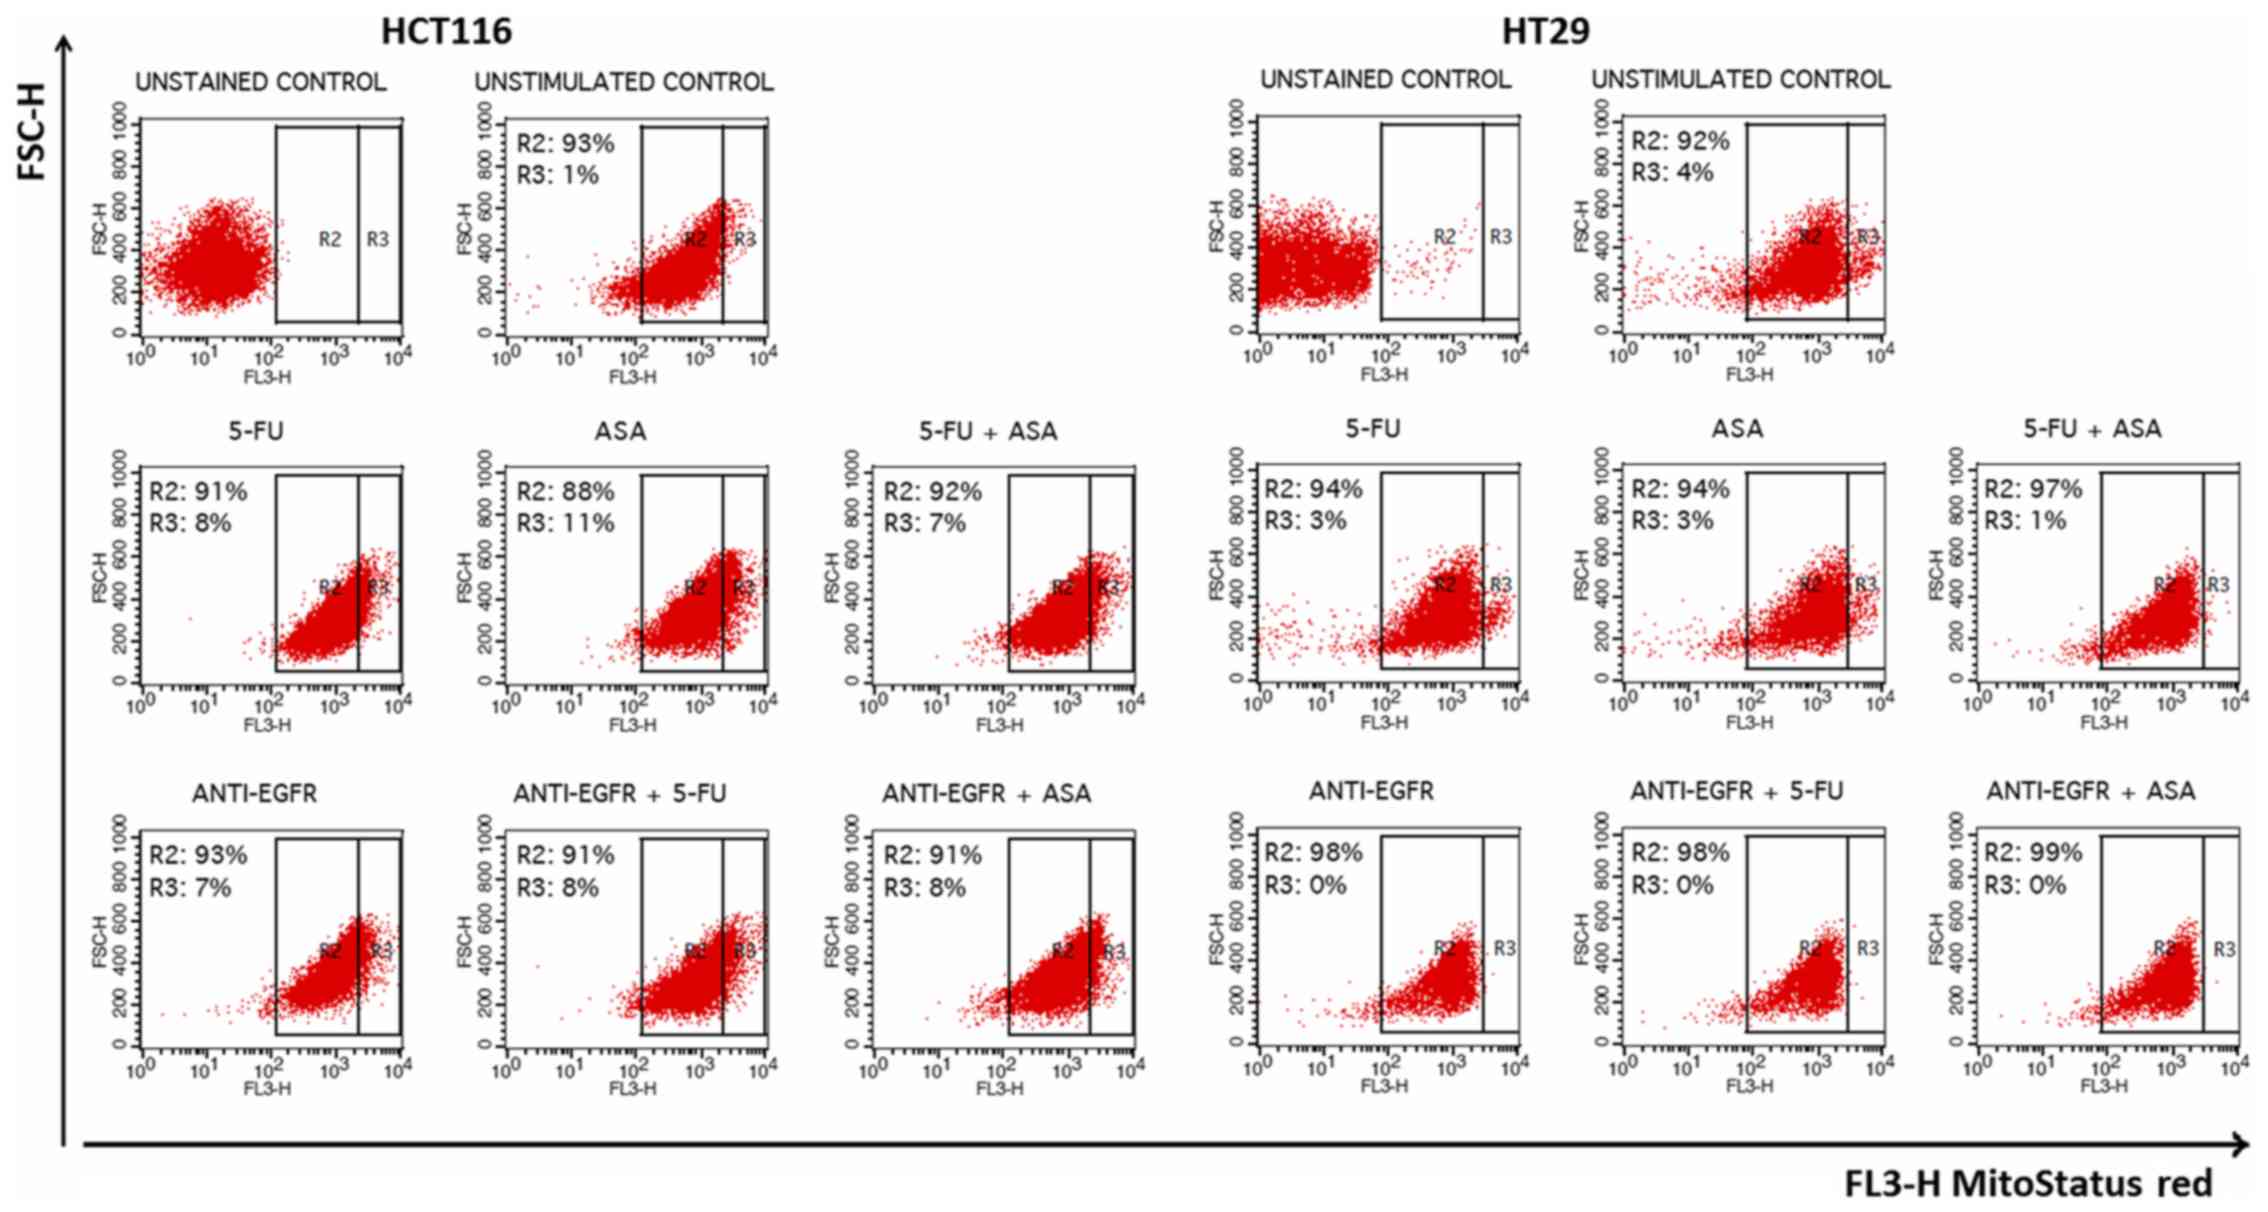
Subsequently, we decided to evaluate the involvement
of mitochondria which play a crucial role in the apoptosis process.
We used a fluorescent dye, MitoStatus Red, that is readily
sequestered by active mitochondria, allowing for flow cytometric
assessment of internal mitochondrial membrane depolarization that
results in diminished levels of fluorescence. The fraction of
HCT116 cells with a depolarized membrane (Δψm) increased following
treatment. Surprisingly, the percentage of intensively stained
cells following incubation with each of the analyzed agents was
highly increased in comparison to the unstimulated HCT116 control
cells (R3 gate) (Fig. 8).
Viability of HT29-derived colonospheres
following drug treatment
The most notable gain of 7-AAD+ cells was
revealed when the HT29 cell-derived spheres were stimulated with
the drug combinations, such as 5-FU + ASA, anti-EGFR antibody +
5-FU, and anti-EGFR antibody + ASA (Fig. 7A). ASA combined with anti-EGFR
antibody triggered a greater increase of the non-viable cell
fraction than the singly-applied agents (Fig. 7A). When we compared the percentage
of cells exposing an active caspase-3, we found a significant
decrease following stimulation with anti-EGFR antibody and its
combination with 5-FU and ASA in comparison to the untreated
HT29-derived colonospheres (8.5±0.5%, 10.5±0.5%, 11.5±0.5% vs.
40.3±3.3%, respectively) (Fig.
7B). Of note, An-V-PI staining revealed a significant increase
in the apoptotic cell fraction following incubation with anti-EGFR
antibody + 5-FU and anti-EGFR antibody + ASA in comparison to both
5-FU and ASA alone (Fig. 7C), what
was related to a decrease in the necrotic cell fraction (Fig. 7D). Notably, the ASA- and 5-FU +
ASA-stimulated HT29-derived colonospheres displayed an increase in
necrotic cells by 26.3±7.2 and 28.0±4.2%, respectively, in
comparison to the control (14.3±2.1%); however, these alterations
were not statistically significant compared to the control
(Fig. 7D). We also found that the
cellular fraction with a depolarized internal mitochondrial
membrane was only slightly affected by the tested drugs. Although
all of the tested agents reduced the number of intensively stained
cells (even more than that of the control cells), only anti-EGFR
antibody alone and in combination with 5-FU or ASA affected the
distribution of cells by eradication of that population (R3 gate)
(Fig. 8).
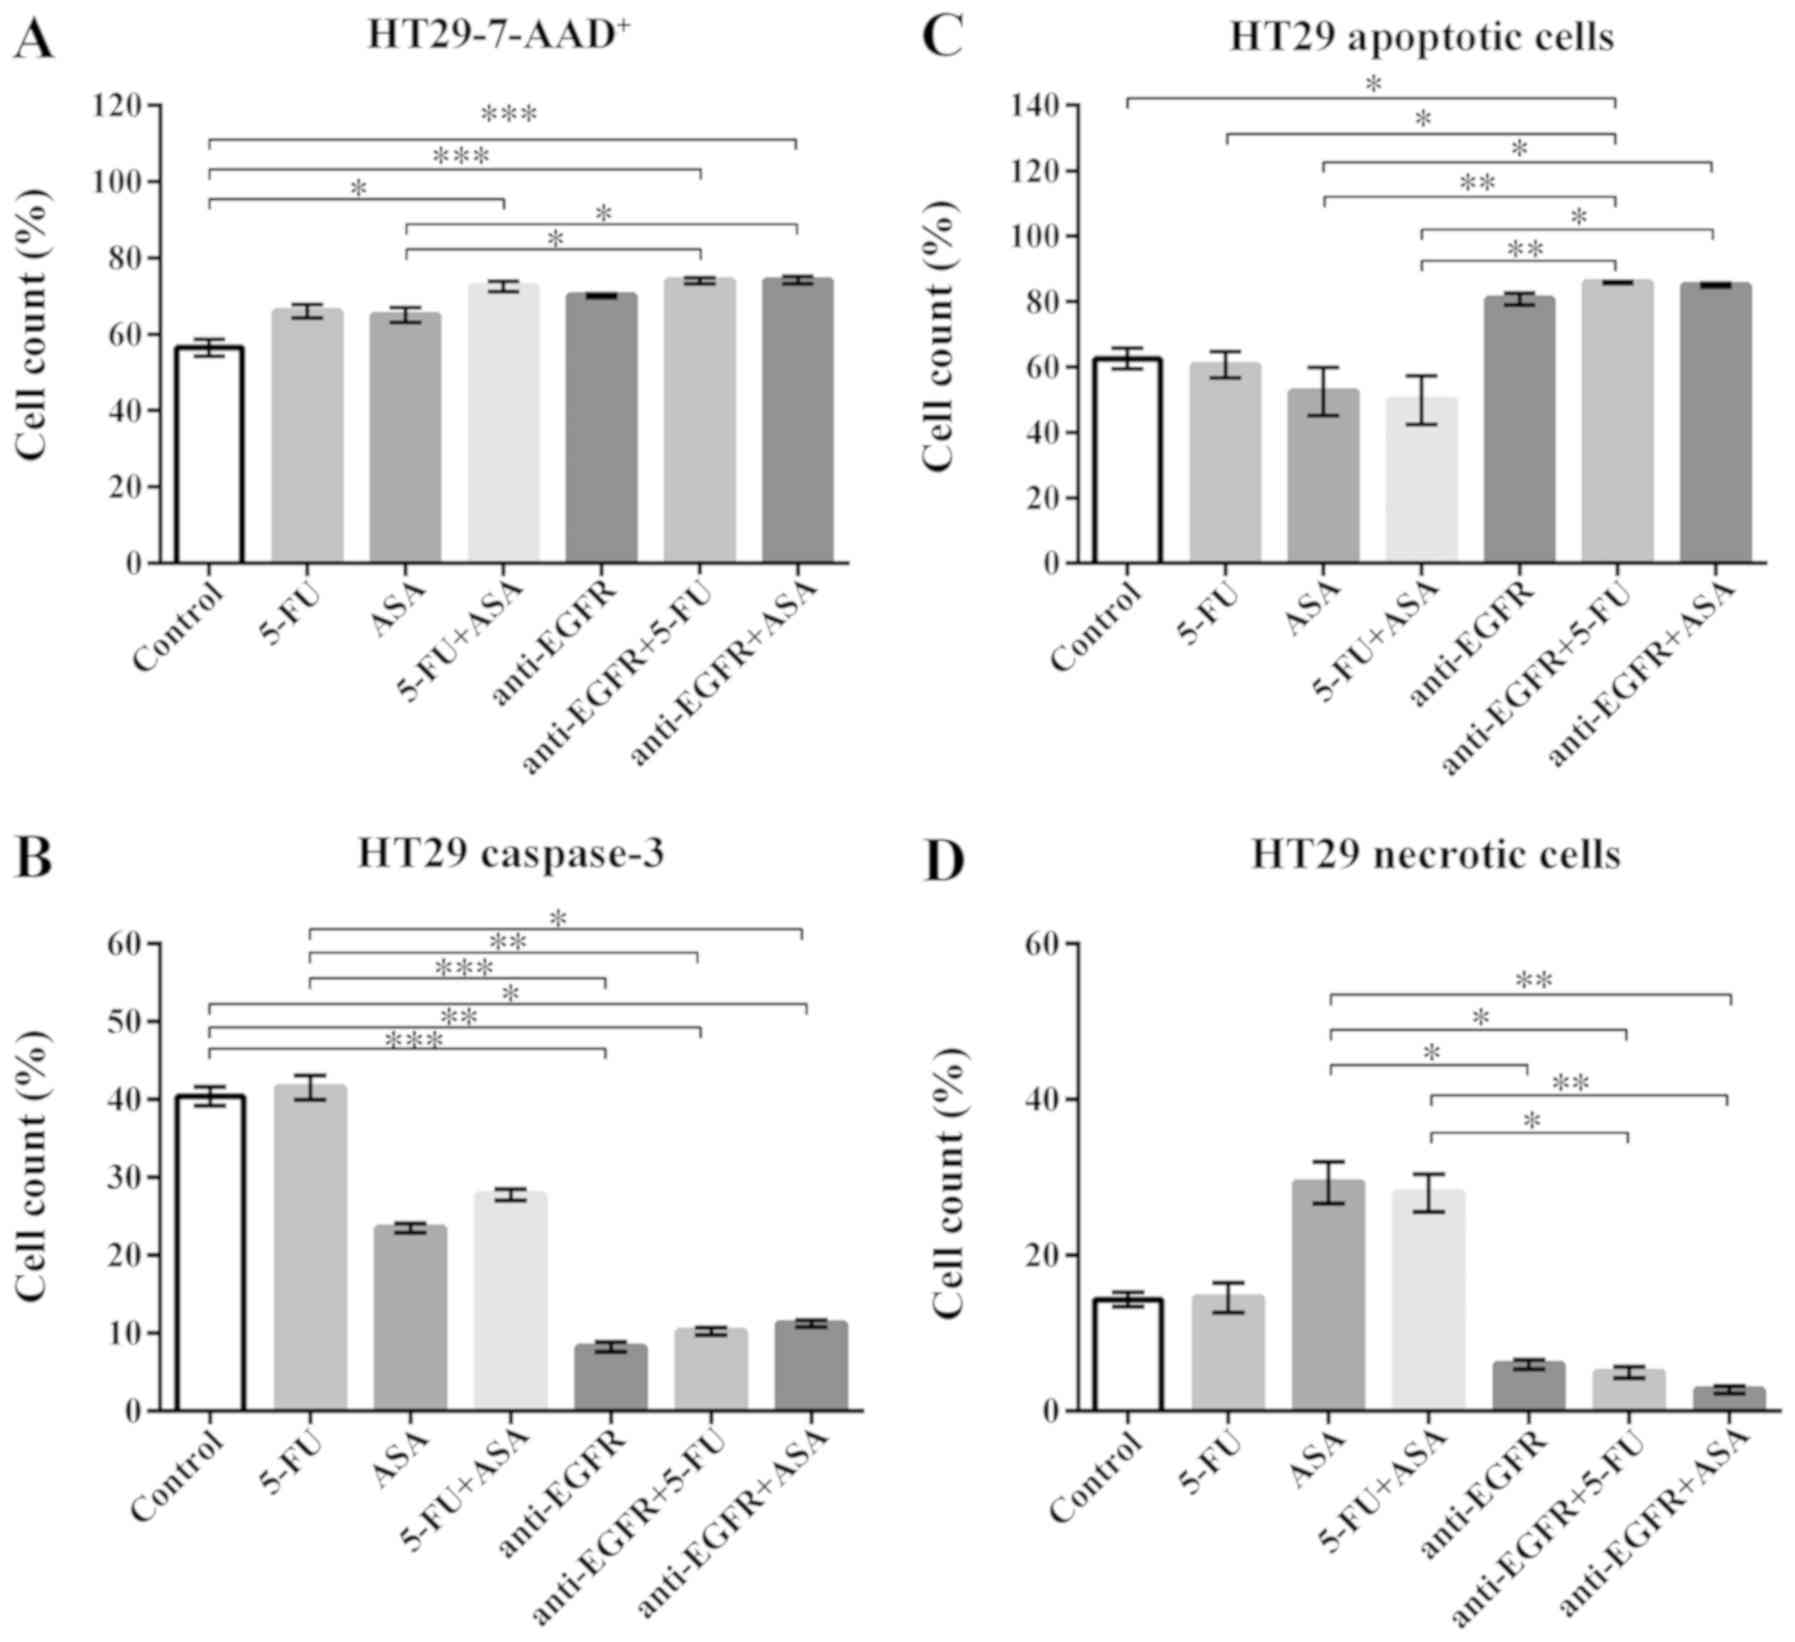 | Figure 7Effects of drugs on various measures
of viability of HT29-derived colonospheres. (A) 7-AAD staining of
HT29-spheres. The number of replicates N = 6. (B) The expression of
caspase-3 in HT29 cell-derived spheres. The number of replicates N
for particular experiments were: NCONTROL = 8,
N5-FU = 10, NASA = 8, N5-FU+ASA =
8, Nanti-EGFR = 6, Nanti-EGFR+5-FU = 6,
Nanti-EGFR+ASA = 6. (C) Annexin-V (An) and PI staining
of apoptotic cells within HT29 cell-derived spheres.
NCONTROL = 8, N5-FU = 8, NASA = 8,
N5-FU+ASA = 7, Nanti-EGFR = 5,
Nanti-EGFR+5-FU = 5, Nanti-EGFR+ASA = 5. (D)
The percentage of necrotic (An-PI+) cells
within HT29 cell-derived spheres. NCONTROL = 8,
N5-FU = 8, NASA = 8, N5-FU+ASA =
7, NantiEGFR = 5, Nanti-EGFR+5-FU = 5,
Nanti-EGFR+ASA = 5. Statistically significant
differences assessed by Kruskal-Wallis test followed by Dunn's test
as a post hoc procedure. *P<0.05,
**P<0.005 and ***P<0.0005. All data
presented as the means ± SEM. 5-FU, 5-fluorouracil; ASA, aspirin;
EGFR, epidermal growth factor receptor. |
Effects of the tested agents on the
proliferation and cell cycle distribution of the HCT116- and
HT29-derived colonospheres
The proliferative capacity of the stimulated
colonospheres obtained from both CRC cell lines was assessed by
CFSE-based proliferation assay. CFSE diffuses into cells and binds
covalently to cellular amine residues, and thereon it emits
fluorescence proportional to the number of stained cells. Changes
in the CFSE median fluorescence intensity (MFI) after 3 days of
incubation of the spheres with the drugs relative to the MFI
observed at day 0 represent fold increase related to the rate of
proliferation (Fig. 9A and D).
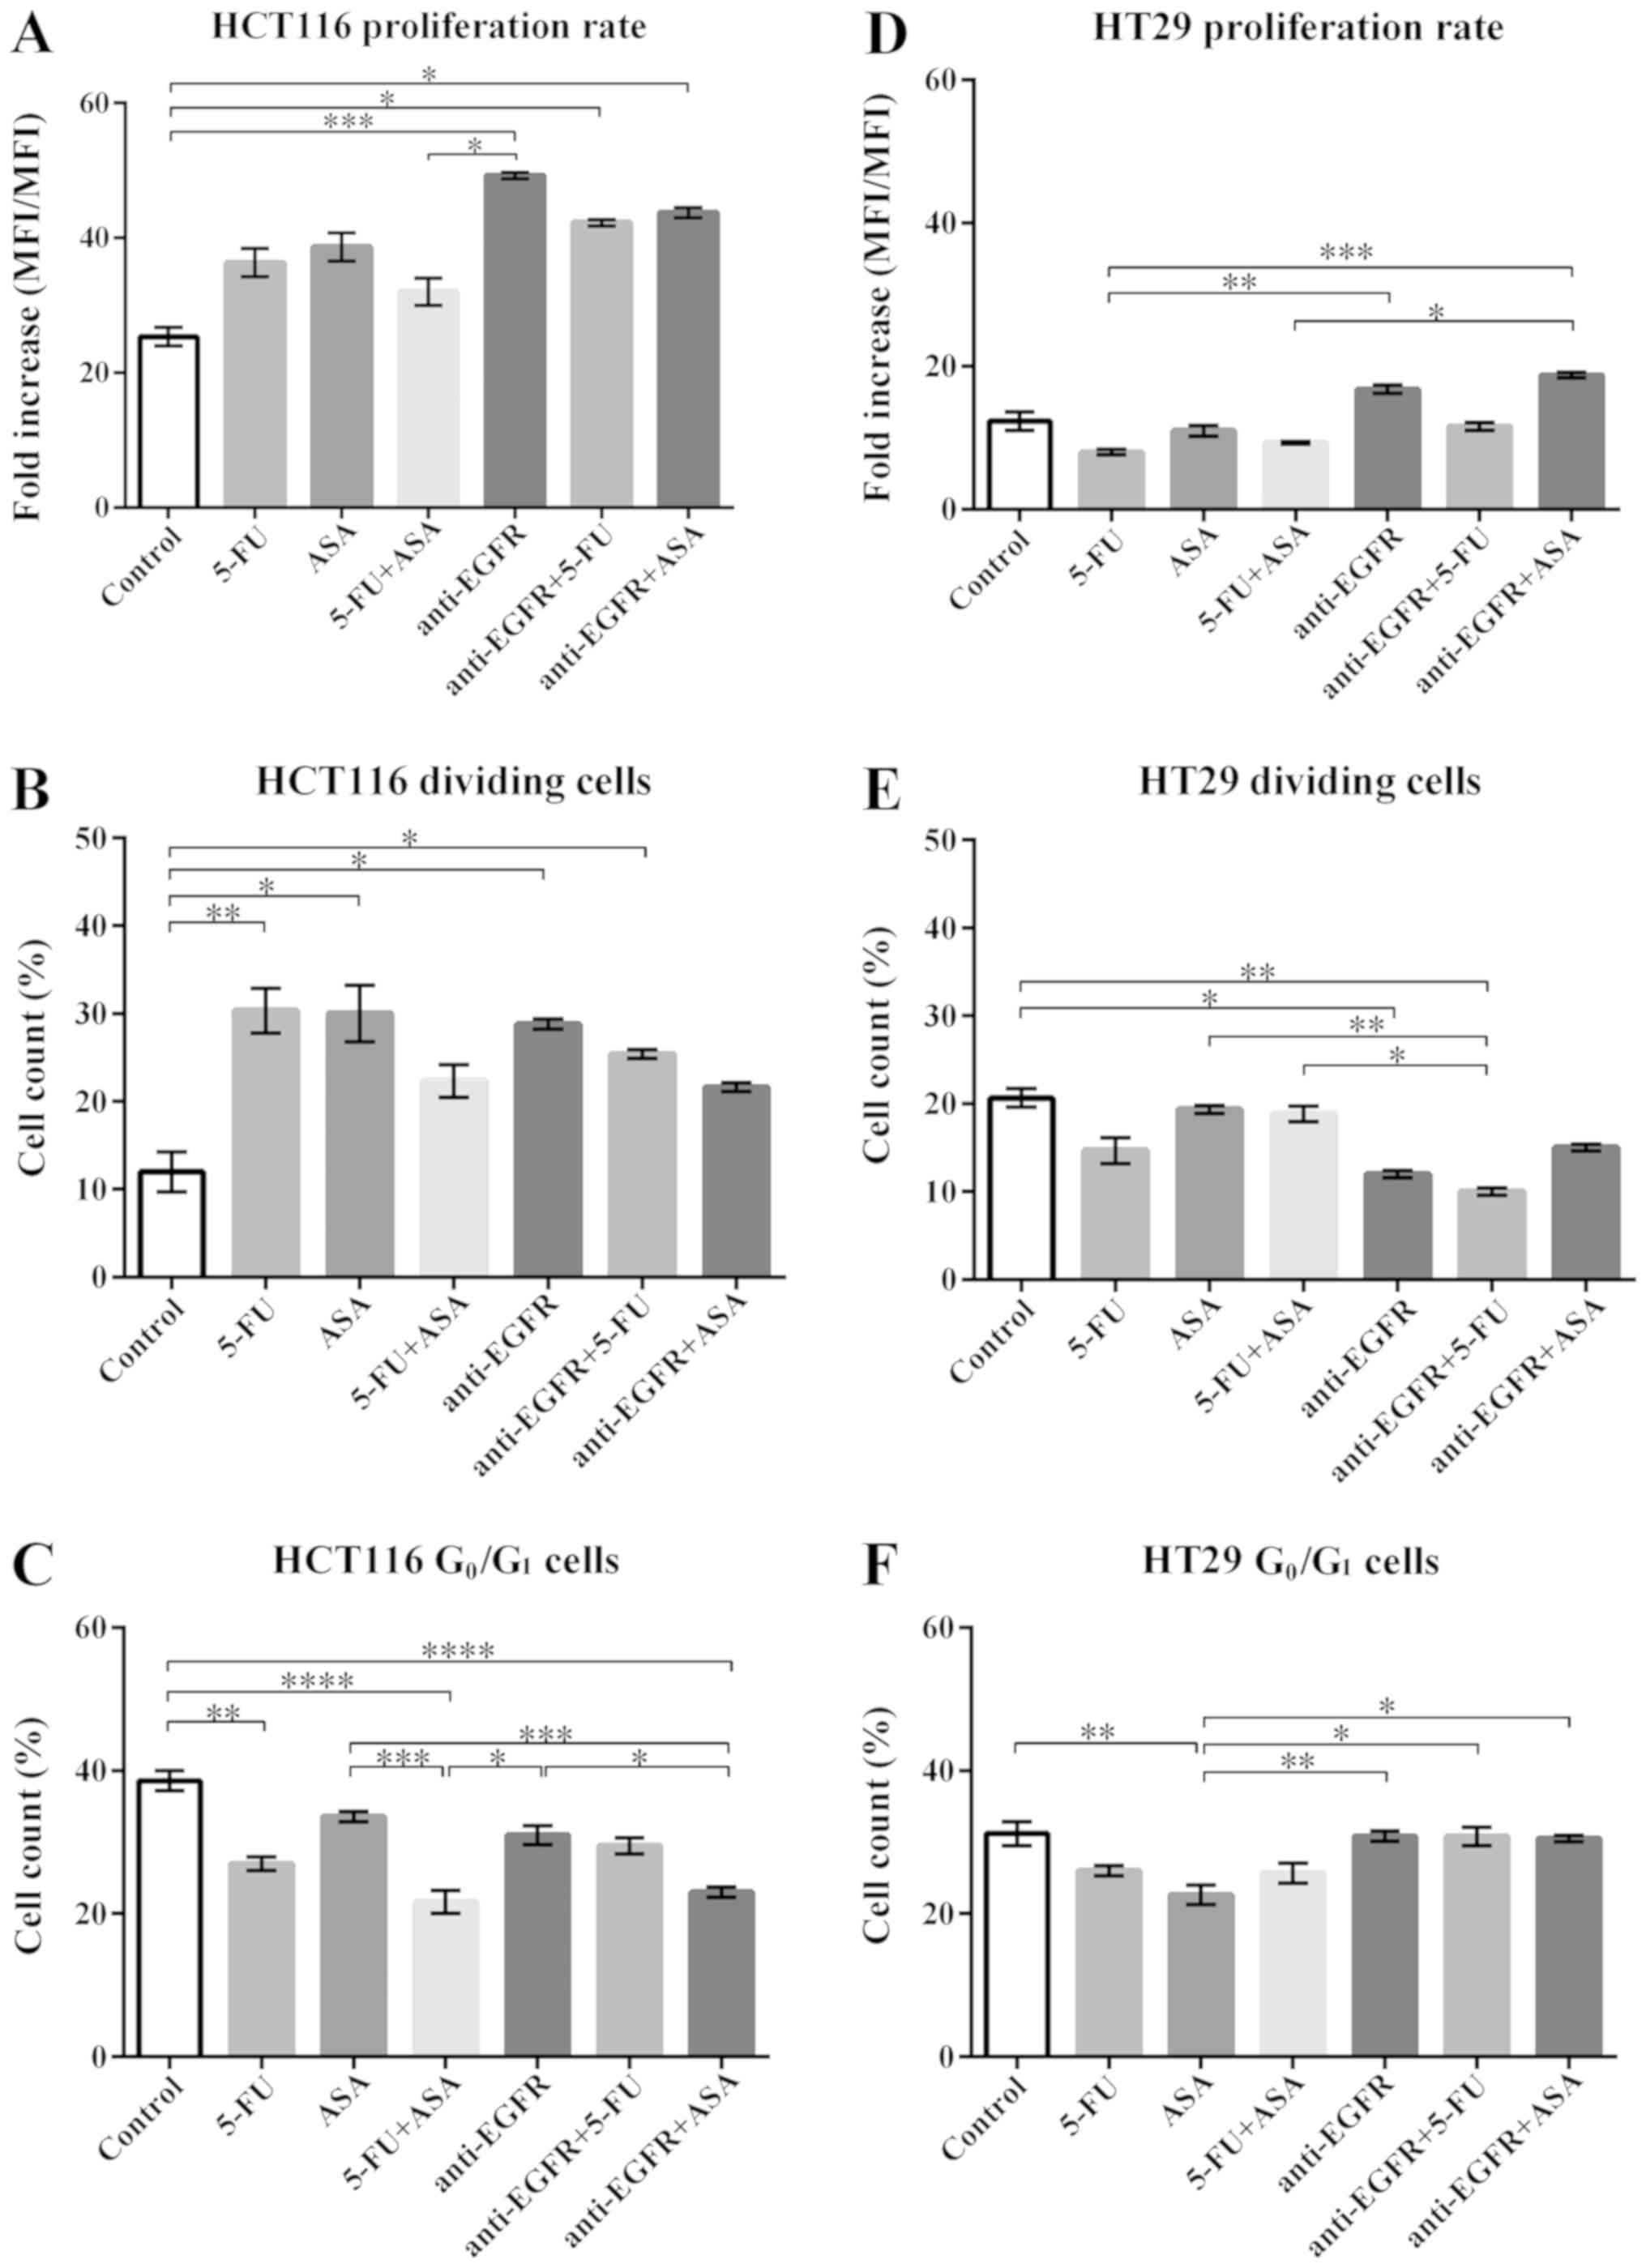 | Figure 9Effects of drugs on the proliferative
capabilities of HCT116- and HT29-derikved colonospheres. (A and D)
The fold increase of CFSE-MFI following drug treatment in HCT116-
and HT29-derived spheres, respectively. The number of replicates N
for particular experiments with HCT116 cell- and HT29 cell-derived
spheres were: NCONTROL = 6, N5-FU = 6,
NASA = 6, N5-FU+ASA = 6,
Nanti-EGFR = 5, Nanti-EGFR+5-FU = 5,
Nanti-EGFR+ASA = 5. (B and E) The proportions of HCT116
and HT29 cells, respectively, which underwent cellular divisions
and presented decreased fluoresce of CFSE. For HCT116 and HT29
spheres: NCONTROL = 6, N5-FU = 6,
NASA = 6, N5-FU+ASA = 6,
Nanti-EGFR = 5, NantiEGFR+5-FU = 5,
Nanti-EGFR+ASA = 5. (C and F) The proportion of HCT116
and HT29 cells accumulated in the G0/G1 phase
of the cell cycle, respectively. For HCT116-derived colonospheres:
NCONTROL = 10, N5-FU = 12, NASA =
12, N5-FU+ASA = 12, Nanti-EGFR = 8,
NantiEGFR+5-FU = 8, NantiEGFR+ASA = 8. For HT29-derived
colonospheres: NCONTROL = 10, N5-FU = 12,
NASA = 12, N5-FU+ASA = 12,
Nanti-EGFR = 6, NantiEGFR+5-FU = 6,
Nanti-EGFR+ASA = 6. Statistically significant
differences assessed by Kruskal-Wallis test followed by Dunn's test
as a post hoc procedure and Mann-Whitney test. P<0.05,
**P<0.005, ***P<0.0005 and
****P<0.00005. All data presented as the means ± SEM.
5-FU, 5-fluorouracil; ASA, aspirin; EGFR, epidermal growth factor
receptor. |
The HCT116 cell-derived spheres treated with the
majority of the tested drugs exhibited an elevated rate of
proliferation in comparison to the control cells (Fig. 9A). The proliferation rate was the
highest when the cells were treated with anti-EGFR antibody and its
combination with 5-FU or ASA. Of note, we found that following
single-agent treatment, the percentage of actively dividing cells
increased significantly, whereas the combinations of two tested
agents did not significantly alter the proliferation rate, apart
from anti-EGFR antibody + 5-FU, although an increasing tendency was
evident (Fig. 9B).
In addition to the CFSE-based proliferation assay,
we performed cell cycle analysis. Compared to the control,
treatment with 5-FU, 5-FU + ASA, and anti-EGFR antibody + ASA
significantly decreased the number of cells accumulated in the
G0/G1 phase (Fig. 9C), which is postulated as a phase
housing dormant/quiescent CSC-like cells. Of note, a strong
negative correlation was observed between the proliferation rate
(CSFE-based assay) and the fraction of cells in the
G0/G1-phase following treatment with
anti-EGFR antibody + ASA (Spearman's rank correlation coefficient,
R=-0.86, P<0.05), indicating the reduction of dormant CSC-like
cells in favor of actively proliferating cells (Fig. S1).
The HT29-derived colonospheres presented a lower
rate of proliferation in comparison to the HCT116-derived
colonospheres (Fig. 9D), as we
have reported previously (10).
Moreover, the HT29 cells cultured with the agents displayed varying
patterns of cellular division than the HCT116-derived
colonospheres, since the HT29-derived colonospheres exhibited a
lower percentage of dividing cells following treatment (Fig. 9E). In contrast to the
HCT116-derived colonospheres, neither treatment with single agents
nor with their combinations affected the distribution of cells in
the cell cycle (Fig. 9F). The
proportion of HT29 cells in the G0/G1 phase
was similar to that of the HCT116 cells and was independent of the
tested agent, apart from ASA, which reduced the fraction of HT29
cells in the G0/G1 phase compared to the
control (Fig. 9F).
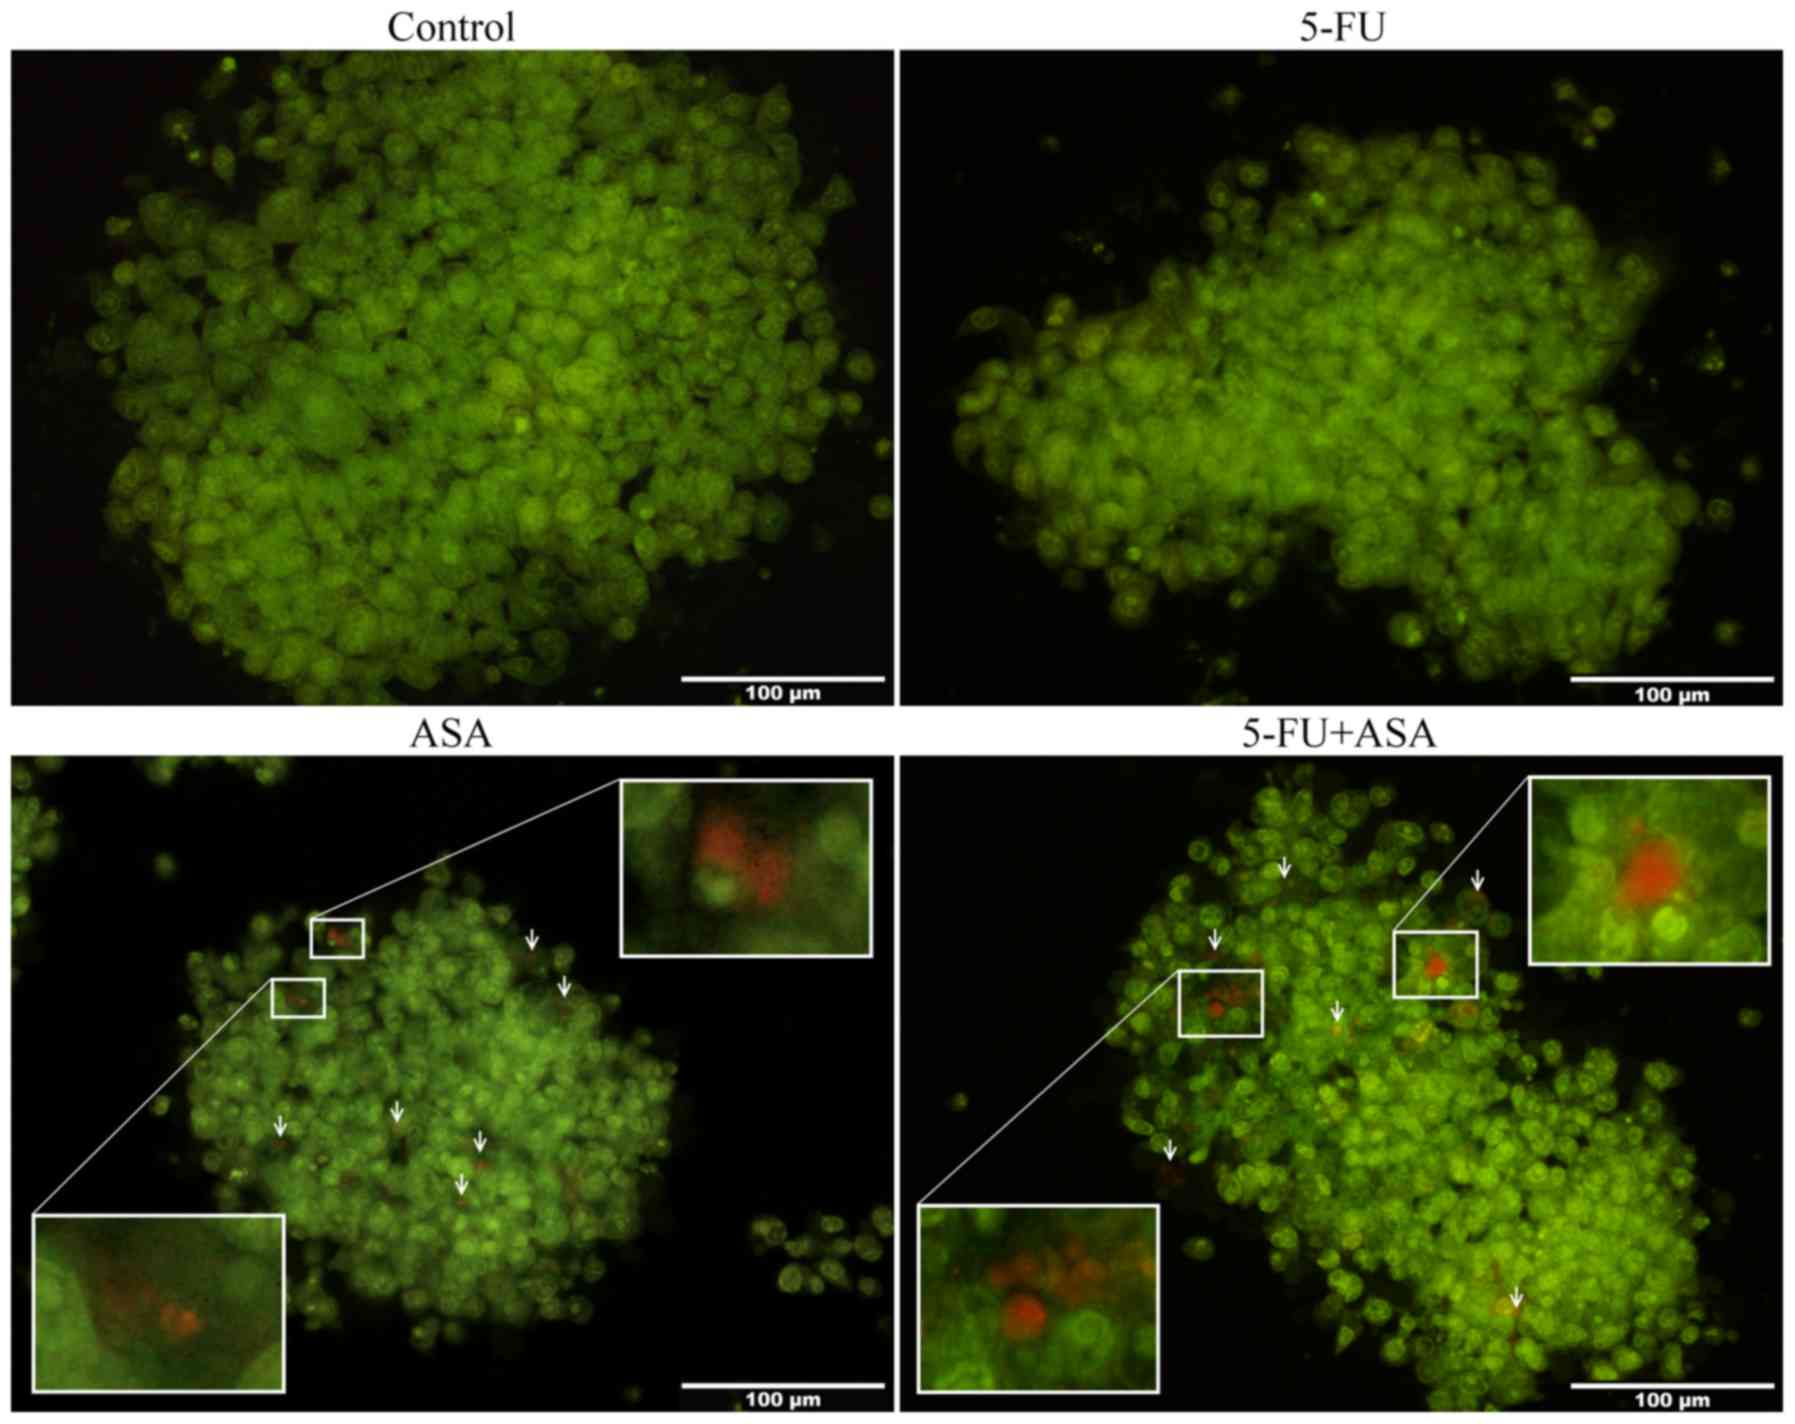
Analysis of autophagy induced in ASA and
5-FU + ASA-treated colonospheres
While culturing the colonospheres with drugs, we
observed morphological changes in the studied CRC cell lines. The
HT29 cell-derived spheres, but not the HCT116-derived
colonospheres, treated with ASA and 5-FU + ASA contained cells
whose cytoplasm housed vesicles and bright halo-like rings. To
determine the process/es responsible for these morphological
changes, we performed AO staining of the treated colonospheres. AO
is a cell-penetrating green fluorophore which upon protonation and
trapping in acidic vesicular organelles (AVOs) (such as
autolysosomes), forms aggregates that emit bright red fluorescence
in a concentration-dependent manner, whereas cellular cytoplasm
remains green. We found that incubation of the colonospheres
derived from HT29 cells, but not from HCT116 cells, with 5-FU, ASA
and 5-FU + ASA influenced the autophagy process. The HT29
cell-derived spheres treated with ASA and 5-FU + ASA contained a
greater number of clearly visible AVOs in comparison to the
control, while 5-FU did not markedly affect this amount (Fig. 10). In compliance with AO staining,
a single repetition of western blot analysis of the LC3-I/II level
[microtubule-associated protein 1A/1B-light chain 3 (LC3), which
plays a critical role in autophagy (38)] confirmed the progression of that
process in the HT29 cell-derived spheres treated with ASA and 5-FU
+ ASA (data not shown).
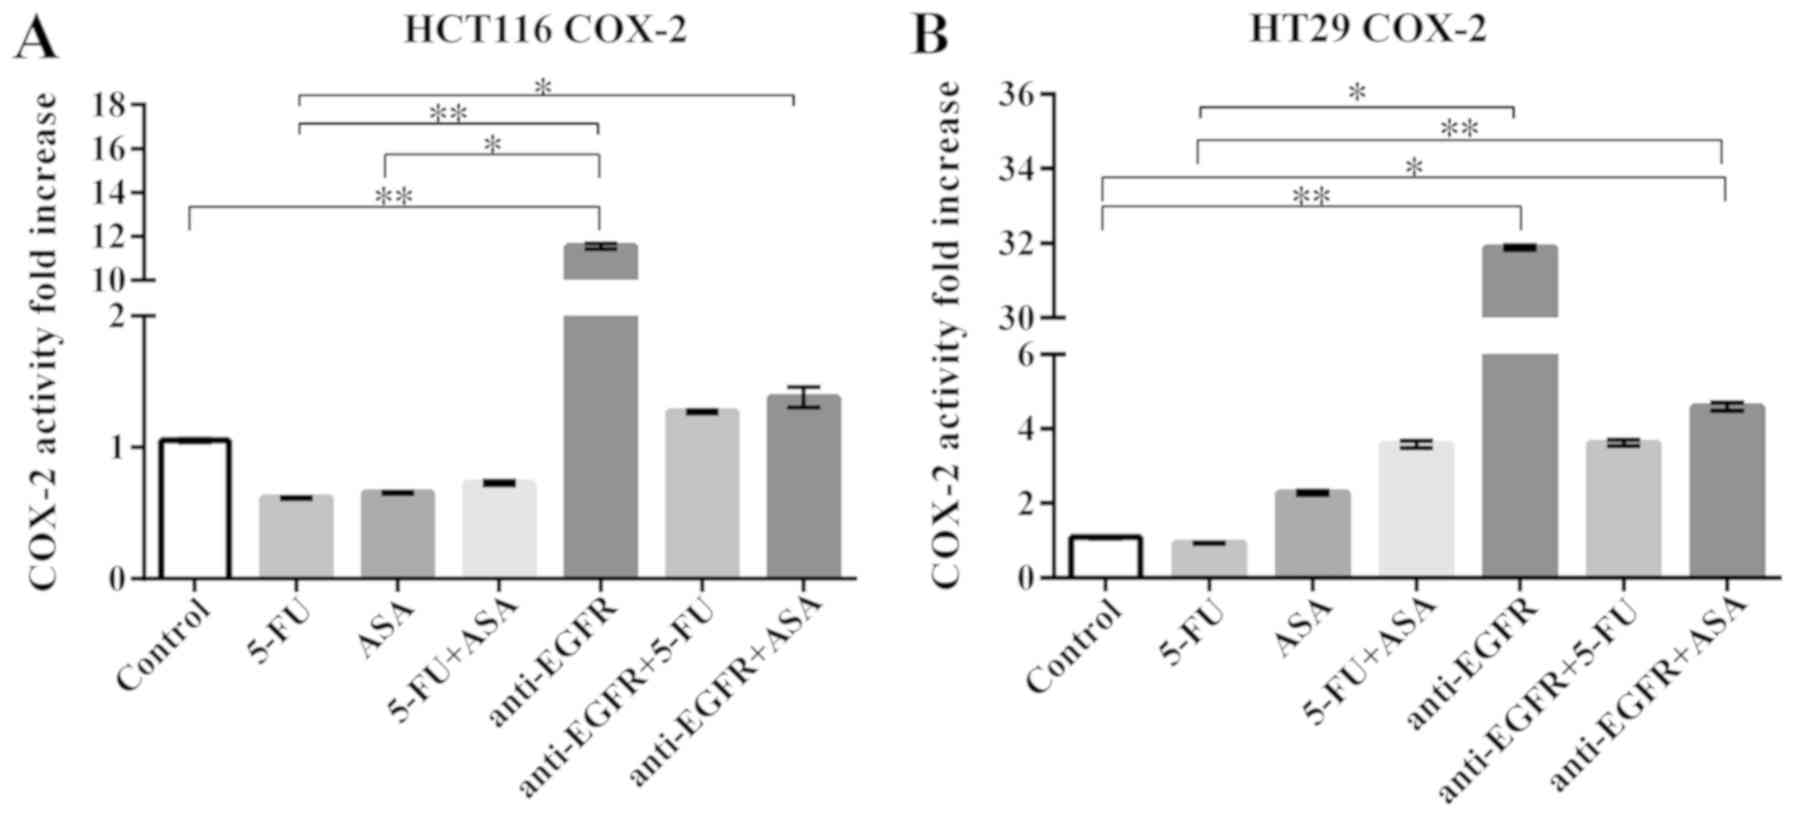
Analysis of COX-2 activity and
expression
Since a high COX-2 expression, which catalyzes the
reduction of arachidonic acid to prostaglandins, accompanies a
number of pathological processes, including cancer growth, we
decided to examine its level in the treated colonospheres.
Independently of the CRC cell line or type of drug/drugs, the cell
fractions containing intracellular COX-2 did not change after 72 h
of treatment of the spheres in the cytometrical analysis (Table I). Nevertheless, we decided also to
determine the enzyme's activity in a COX activity assay which
compares changes in the medium fluorescence (Ex/Em = 535/587 nm)
caused by the conversion of a COX substrate, arachidonic acid, into
prostaglandins. Incubation of the HCT116-derived colonospheres with
5-FU, ASA and 5-FU + ASA resulted in a slight, statistically
insignificant decrease in COX-2 activity, whereas anti-EGFR
antibody caused a 12-fold increase in COX-2 activity in comparison
to the unstimulated cells (Fig.
11A). We observed that the HT29-derived colonospheres incubated
with the tested drugs exhibited an increased COX-2 activity, apart
from those treated with 5-FU. However, the increase was
statistically significant in comparison to the control only for the
anti-EGFR antibody- and anti-EGFR antibody + ASA-treated cells
(Fig. 11B).
 | Table IAssessment of the COX-2-positive
cells in HCT116- and HT29-colonospheres. |
Table I
Assessment of the COX-2-positive
cells in HCT116- and HT29-colonospheres.
| Control | 5-FU | ASA | 5-FU+
ASA | anti-EGFR |
anti-EGFR+ 5-FU |
anti-EGFR+ ASA |
|---|
| Colonosphere
population (%) | | | | | | | |
| HCT116 | 13.3±1.8 | 12.5±1.5 | 12.3±1.5 | 12.5±1.5 | 12.2±1.7 | 11.0±0.9 | 11.6±1.4 |
| HT29 | 15.5±2.3 | 17.3±1.4 | 17.0±2.5 | 16.5±2.1 | 14.0±1.7 | 12.6±1.2 | 13.3±1.1 |
Discussion
CRC is one of the most commonly diagnosed and lethal
types of cancer worldwide. Colorectal carcinogenesis is a multistep
process requiring the accumulation of various genetic and
epigenetic aberrations. There are two different models of
carcinogenesis: The stochastic and the CSC model (39). According to the stochastic model,
any type of cell is capable of initiating and promoting cancer
development, whereas the CSC model is an attractive hypothesis that
translates the properties of normal stem cells into the cancer
field, and explains some of the most lethal features of cancer
(39). CSCs are known to maintain
a non-proliferative state and to enter the cell cycle only
infrequently. Conventional anticancer therapies preferentially
target dividing cells, whereas CSC-like cells are resistant to such
treatments. Moreover, they can potentially initiate disease relapse
and metastasis as they re-enter the cell cycle after a period of
dormancy (40,41). CSC-like cells were considered as a
population with well-defined phenotypic and molecular features;
however, a growing body of evidence suggests that they are a rather
dynamic cellular fraction continuously shaped by the convergence of
genetic, epigenetic and microenvironmental factors (42).
Solid tumors grow in a three-dimensional (3D)
spatial conformation, resulting in heterogeneous exposure to oxygen
and nutrients, as well as to physical and chemical stresses, which
is not mirrored in the 2D adherent systems of cancer cell cultures
(43). It has been suggested that
spherical cultures better mimic the cancer cell organization and
development in vivo (10,12,44).
Similar to solid tumors, the external layer of a sphere is composed
of cells displaying high proliferation rates, the middle layer is
essentially formed by senescent cells, and the core contains
necrotic cells (11).
In this study, we performed a series of experiments
to determine the effects of some therapeutic agents and their
combinations on the features of the CSC-like cells present within
the spherical cultures of two different CRC lines. We selected
5-FU, as a conventional agent in the first line of CRC treatment
(20), ASA due to its potential
chemopreventive role in CRC (30,45),
and anti-EGFR antibody, since the blockage of EGFR has been shown
to be effective in some types of cancer, including CRC (28). Taken together, ASA and anti-EGFR
antibodies are suggested as promising agents in the prevention or
treatment of CRC, and their potential therapeutic usage may result
in enhanced, synergistic anticancer effects (46). Admittedly, the morphology of the
colonospheres and their sizes were significantly reduced by
single-agent treatment; however, we observed that combinations of
two agents had the most significant impact on the viability of CRC
spheres. Pre-treatment of the CRC cells displayed that the
spherical cultures were more resistant to the tested drugs what was
reflected in their capability to re-create colonospheres when
maintained in serum-free medium. The CRC cell lines used in this
study presented a different status with respect to the expression
of some genes important in CRC pathogenesis. HT29 cells express
KRASWT, mutated both BRAFV600E and
p53R273H, while HCT116 cells express mutated
KRASG13D and non-mutated BRAFWT and
p53WT (47). Thus,
these CRC cell lines presented a differential response to the
selected agents. Of note, the HCT116-derived CSC-like cells were
more affected by the tested drugs in comparison to the
HT29-CSC-derived fraction. Furthermore, a series of experiments
revealed that the tested compounds induced an increase in the
frequency of non-viable cells in spherical cultures. This
phenomenon seems to not depend on the reduction of cells expressing
an active form of caspase-3. Hence, it indicated that different
cellular pathways were involved in development of cellular death.
Additionally, we demonstrated that ASA alone or in combination with
5-FU caused the progression of the autophagy process in the treated
colonospheres. We hypothesized this may be related to the action
mechanism of ASA, since the inhibition of COX-2 was not confirmed
in the performed experiments. Notably, we also noted that the
blockage of EGFR positively influenced the activity of COX-2,
indicating the crosstalk between EGFR and COX-2 in the
colonospheres.
First of all, the colonospheres incubated with 5-FU,
ASA anti-EGFR antibody or their combinations for 72 h presented
visible morphological changes. General morphology changes included
a significant decrease in the size of the colonospheres in both
lines, apart from the anti-EGFR antibody-treated HT29-derived
colonospheres, thus confirming the effective concentrations of the
used drugs. In agreement with our findings, other authors have also
observed a decreased colonosphere diameter (12,31,33).
Since according to our previous study (10), not only colonospheres, but also
adherent forms of HCT116 and HT29 cells contain cells with CSC-like
antigens on their surface, we decided to treat the cells in
monolayer with the selected drugs and then transferred them into
sphere-forming conditions to assess their sphere-forming ability
following such pre-treatment. However, both the parental cell lines
pre-treated with the therapeutic agents were unable to build the
colonospheres when cultured in SCM. Notably, ASA pre-treatment led
to the aggregation of cells into larger groups in both CRC cell
lines; thus, it was suggested that ASA affected the
colonosphere-forming ability, although at the same time, ASA
allowed the formation of cellular aggregates, which is in agreement
with the analysis of CD44+CD29+ phenotype of
HCT116 cells. Subsequently, to determine the secondary sphere
formation capacity, we treated the developed colonospheres with the
therapeutic agents for 72 h. The re-creation of colonospheres
following such a pre-treatment was evaluated thereon. Overall,
spherical cultures were less affected by the therapeutic agents
than their adherent correspondents as revealed by the greater
capacity to recreate colonospheres following the exposure to the
tested drugs. We hypothesized that it may be related to the
internal heterogeneity of cells within spheres and the presence of
fraction with more primitive phenotype, such as CSC-like cells.
Additionally, the lack of differences in the proliferation rate
between HT29-derived colonospheres exposed to the studied agents
and untreated cells confirms that colonospheres are a more stable
research system than correspondent adherent cultures. Colonospheres
also present a greater resistance to standard chemotherapeutic
agents probably due to the occurrence of CSC-like cells within
them. These remarks are in agreement with the observations of other
authors (9,12,43).
In our previous study, we characterized the fraction
of cells within colonospheres from both studied CRC lines according
to their phenotype (10). It must
be stressed that there is no unique CRC CSC-like marker. In recent
literature, a number of molecules have been proposed as such
markers, e.g., CD44, CD24, CD26, CD29, CD166, Bmi-1, Lgr-5, ABCB5,
ALDH, and the most well-known CD133 (15,20).
CD133 was originally used by two independent research groups to
isolate and characterize the CSC-like cells for the first time
(2,3). Therefore, the expression of this
antigen was our first choice to determine whether the studied
agents may affect the fraction of CSC-like cells. Notably, in our
study, the HT29-derived colonospheres seemed to be less affected
than the HCT116 cell-derived spheres by all of the drugs, as they
maintained the CD133-positive fraction on a constant level, apart
from the combined agents 5-FU + ASA. By contrast, treatment of the
HCT116-derived colonospheres reduced the percentage of
CD133-positive cells. However, the decrease in the CD133-fraction
was related to the evident tendency to increase the proportion of
CD44+CD29+CD133− cells following
incubation with ASA, 5-FU + ASA, and anti-EGFR + ASA. CD44 and CD29
belong to integrins; therefore, we hypothesized that ASA may have
strengthened junctions between cells within colonospheres in our
study. This may explain why the ASA-pre-treated cells could form
cell aggregates. Overall, when the amount of CD133+
cells were partially reduced following treatment with the drugs, we
simultaneously observed a tendency for
CD44+CD29+CD133− cell enrichment.
This may suggest that CSCs in suboptimal culture condition leave
the spheres, which corresponds to EMT and the invasion of CSC-like
cells in vivo. As CSC-like cells do not undergo anoikis when
they lose the attachment to neighboring cells or extracellular
matrix elements, they may leave the sphere and survive in the
serum-free medium. Thus, on the basis of the aforementioned
results, it can be concluded that CSC-like cells were probably
responsible for the regeneration of secondary spheres in our
assay.
FasR, belonging to the tumor necrosis factor (TNF)
family, is a transmembrane protein with a cytoplasmic death domain.
However, studies have demonstrated the importance of the
non-apoptotic role of the FasR/FasL cascade also for tumor
promotion. FasR, acting as an activator of PI3K, can induce the
invasion of glioblastoma cells, since its neutralization with
MFL3-antibody markedly reduces the number of invading cells
(48). Subsequently, the knockdown
of either FasR or FasL induced by siRNA or shRNA has been shown to
significantly decrease the growth of cancer cells derived from
various cancer cell lines (35).
Once cancer cells achieve resistance to FasR-mediated apoptosis,
further stimulation of that death receptor is tumorigenic (49). Therefore, the downregulation of
FasR expression is associated with cancer progression; however, its
complete loss is rather infrequent; thus, FasR expression in cancer
cells is suspected to represent a part of a tumor-security
mechanism (35). We have
previously demonstrated (36) that
spherical cultures were characterized by the diminished level of
FasR in comparison to their adherent counterparts, thus confirming
the resemblance of the spherical system to the cancer tissue in
vivo. In the present study, we observed a very low percentage
of FasR-positive cells in the HT29-derived colonospheres, which
further decreased following treatment with anti-EGFR antibody and
its combination with 5-FU and ASA. It may be interpreted as an
adaptation of the cancer cells to minimize the probability of
apoptosis induction, while benefiting from tumorigenic activities.
We previously found significant positive correlations between FasR
and some CSC-like markers, which seemed to indicate the
cancer-promoting role of FasR signaling, while FasL seemed to be
involved in cancer progression rather than in CSC-like cells
maintenance (36). Furthermore,
the FasR/FasL of HCT116-spherical system was not markedly affected
by the exposure to the tested agents. The percentage of
FasL-positive cells from the HT29-derived colonospheres and
HCT116-derived colonospheres was significantly reduced only by 5-FU
+ ASA and ASA, respectively, whereas the other agents had no marked
effect on the high fraction of FasL-positive cells. Therefore, we
propose that ASA or its combinations may present a useful tool with
which to reduce the FasL level.
The incubation of colonospheres with the tested
agents resulted in a decreased viability; however, the percentage
of non-living cells was markedly higher in the adherent models in
comparison to their spherical counterparts (data not shown), thus
confirming that spheres are more resistant platform to the
therapeutic agents. In our previous study (10), we demonstrated that spherical CRC
cultures contained a prominent percentage of non-living cells, but
still presented a very stable population with a fraction of cells
continuously proliferating. As was expected, the combination of two
agents, such as 5-FU + ASA, anti-EGFR antibody + 5-FU, or anti-EGFR
antibody + ASA, significantly increased the amount of non-viable
cells in both CRC cell lines, whereas single agents were
inefficient in that manner. These data are partially in agreement
with our data on the proliferation and accumulation of cells in
G0/G1 phase of the cell cycle. In brief,
although the proportion of dividing cells following incubation with
ASA alone increased significantly, the general proliferation rate
of the HCT116 cells was not affected. We observed that the
simultaneous administration of ASA with 5-FU or anti-EGFR antibody
decreased the number of spherical HCT116 proliferating cells. This
decrease may be associated with the ability of these drug
combinations to target cells in their active phases of the cell
cycle, since the percentage of cells in G0/G1
phase was reduced. Basing on the presented results, we suggest that
HCT116-derived colonosphere exposition to ASA diminishes the amount
of quiescent cells and induces their transformation into
extensively dividing cells, which could be easier eliminated by
5-FU or anti-EGFR antibody. By contrast, HT29 cell proliferation
and the number of cells in the G0/G1 phase
were affected by ASA, alone whereas combined treatment with 5-FU or
anti-EGFR antibody was not effective.
Of note, we obtained similar viability results for
both the anti-EGFR antibody-treated CRC cell lines, in spite of the
fact that HT29 and HCT116 cell lines represent a different KRAS
gene status, which is wild-type and G13D-mutated, respectively
(47). According to other studies,
the susceptibility of cancer cell lines to anti-EGFR antibody
stimulation depends on a number of different factors, and the
genetic status of the KRAS gene is not the only feature that may
influence the cells' behavior (50-52).
Moreover, despite a positive response to the treatment with
anti-EGFR antibodies, a number of patients with CRC develop
resistance to such EGFR blockade, which may be driven by the
emergence of KRAS mutations or by the development of EGFR
extracellular domain variants, which impair antibody binding
(29,53). Hence, patients with mutations
within codon 12 or 13 should be excluded from the anti-EGFR
therapeutic regiments as they would not gain any benefits from such
a therapy (54). However, recent
studies presented contrary results, suggesting that a therapeutic
effect may be obtained even in patients harboring the KRAS G13D
mutation (55,56). Furthermore, our in vitro
results revealed that 5-FU treatment with the simultaneous blockage
of EGFR in both CRC lines decreased the percentage of living cells
in colonospheres and in cells cultured in their adherent mode (data
not shown). However, the NORDIC-VII in vivo study reported
no effect of adding cetuximab, which is a chimeric monoclonal
antibody inhibiting EGFR, to a regimen of bolus 5-FU/folinic acid
(FA) and oxaliplatin in the first-line therapy of metastatic CRC
(57). Furthermore, Guren et
al demonstrated an effect of cetuximab monotherapy in patients
with RAS/BRAF wild-type tumors (58), while the COIN trial demonstrated a
lack of effect when adding cetuximab to an oxaliplatin-capecitabine
regimen in KRAS wild-type cases (59). This study demonstrated that EGFR
blockage exerts a significant impact on many features of the
colonospheres independently of their KRAS status. We hypothesized
that the positive outcome of anti-EGFR treatment is related to the
general mutational gene status of cells. For instance, the HCT116
cell line harbors mutated KRASG13D, but it expresses the
non-mutated wild-type of two crucial death-associated genes, BRAF
and p53. Thus, their non-affected status may partially explain the
significant response to EGFR blockage. Still, the discrepancies
amongst the results require further investigations, since EGFR and
its ligand are implicated in a number of signaling pathways.
The development and progression of a number of
types of cancer, including CRC, and the existence of pre-malignant
tissues has been reported to be commonly accompanied by the
overexpression of the COX-2 gene (60), which is usually associated with a
poor prognosis of cancer patients (61-63).
However, it has to be stressed that these data strongly vary and
seem to depend on the used methodology (60,61).
In fact, western blot analyses of COX-2 protein have indicated its
expression in the HT29 cell line (61,64),
whereas HCT116 lacks that particular protein (61,65).
In this study, we established that COX-2+ spherical HT29
and HCT116 cells comprised 15.5 and 13.3% of the total cell
population respectively, and these numbers were mostly unaffected
by treatment with the tested agents. Subsequently, we decided to
test the activity of the COX-2, since ASA is known as an
irreversible and nonselective inhibitor of that enzyme (66). It must be stressed that none of the
agents inhibited COX-2 activity in the HT29- or HCT116-derived
colonospheres. Surprisingly, although ASA is considered to act as a
COX-2 inhibitor, in this study, it did not suppress COX-2 activity.
This may be due to the used 1.5 mM concentration, while other
researchers used varying concentrations ranging up to 10 mM. Some
researchers have suggested that ASA can act through COX-independent
mechanisms to exert an anti-neoplastic effect (30,66).
Notably, the anti-EGFR antibody-treated HCT116-derived
colonospheres, as well as the anti-EGFR antibody- and anti-EGFR
antibody + ASA-treated HT29-derived colonospheres, presented an
elevated COX-2 activity. We hypothesized that COX-2 expression may
be stimulated by other factors. Furthermore, in both the studied
CRC spherical lines, anti-EGFR antibody increased COX-2 activity.
The significance of crosstalk between EGFR and COX-2 in
carcinogenesis has been shown in previous independent studies on
different types of cancer, including CRC (67,68).
Notably, the COX-2 and EGFR pathways mutually enhance their
pro-tumorigenic effects in a number of types of cancer (69-71)
through the stimulation of their effectors, such as EGFR-ligand,
AKT, ERK and MAPK (70,72).
Furthermore, to establish the type of cell death
resulting from a treatment, we decided to assess the percentage of
cells exhibiting the active form of caspase-3, which is known as an
executioner type of a cysteine-aspartic protease involved in the
apoptotic process. Surprisingly, its level was significantly
reduced in the colonospheres derived from the HT29 CRC cell line
treated with anti-EGFR antibody and ASA, but not 5-FU, whereas its
expression in the HCT116-derived colonospheres was only slightly
affected by the tested drugs. It is widely known that caspases may
act as mediators in different types of cell death, such as
apoptosis, pyroptosis and necroptosis. However, is has to be
stressed that their function is not limited to the regulation of
cell death mechanisms (73). A
deficiency in caspase-3 expression has been shown to affect the
differentiation of embryonic and hematopoietic stem cells due to a
cleavage of Nanog and the maintenance of a dormant state of stem
cells (74,75). Of note, Flanagan et al
revealed that a subgroup of CRC patients with low levels of active
form of caspase-3 was characterized by an increased disease-free
survival (76). In line with our
findings, a study conducted on CRC-patient-derived primary tumor
explant cultures revealed that ASA did not affect caspase-3
activation and apoptosis induction (76). According to the results of this
study, ASA did not trigger the typical apoptotic process with
caspase-3 activation, but induced only a slight tendency in the
increase of the necrotic cell percentage. Notably, despite the
decreased caspase-3 level in the HT29-derived colonospheres treated
with anti-EGFR antibody and its combination with 5-FU and ASA, we
found an increased percentage of apoptotic cells and a reduced
amount of necrotic cells within the culture. This indicated that
the apoptosis-associated changes in colonospheres were not
caspase-3-related, since the execution of cell death may occur in a
caspase-dependent manner even in cells with reduced levels or
devoid of caspase-3. It has been shown that other executioner
caspases, e.g., caspase-6 or caspase-7, may in part substitute for
the diminished or lacking caspase-3 activity (77). Additionally, this phenomenon may be
triggered by alternative and compensatory signaling cascades
involving other proteases, such as serine proteases, cathepsins and
calpains (77). Moreover, Huang
et al in multiple in vitro and in vivo
experiments, proved that dying breast cancer cells influenced the
remaining cancer cell population to replenish the cancer bulk via
the caspase-3 stimulation which in turn may induce the growth of
surviving tumor cells by paracrine mode (78). They showed that wild-type and
Casp3−/− mouse embryonic fibroblasts presented a
similarly decreased survival after irradiation, thus indicating
that the absence of caspase-3 shifts the mode of cell death from
apoptosis to necrosis or autophagy (78). Of note, the activation of a pathway
downstream of caspase-3 results in the increased secretion of
prostaglandin 2 (PGE2) (78,79),
which then stimulates stem cell proliferation, tissue regeneration
and repair (79). This can explain
why the HCT116 cells in our cultures exhibited a decreased
CD133+ CSC-like cell number, particularly following
anti-EGFR antibody stimulation when we found a much lower caspase-3
level.
The next step of this study was to assess the
change of the inner mitochondrial membrane potential, which is not
only a hallmark of apoptosis, but also influences stem cell
viability, proliferation, differentiation and their lifespan
(80). An increased mitochondrial
membrane potential (Δψm) is found in many tumors, and alterations
in mitochondrial function are hallmarks of neoplastic
transformation of colonic epithelial cells (81). Heerdt et al created 5
isogenic SW620 CRC cell lines using mitochondria-targeted agents
which differed according to the Δψm. Their detailed analyses
revealed that Δψm was not necessarily related to the alterations in
cell viability in culture. In this study, we observed that
following treatment with the drugs, the percentage of intensively
stained cells with highly polarized mitochondrial membranes
increased in the HCT116 spherical cultures, whereas the HT29
cell-derived spheres exhibited a reduced percentage of these cells.
A series of studies have confirmed that cells with an elevated
intrinsic Δψm are characterized by higher resistance to apoptotic
inducers and hypoxia, increased invasive behavior, a greater
ability to escape from anoikis, and growth under
anchorage-independent conditions, in comparison to the parental
cell lines or cells with decreased Δψm (81-83).
Thus, mitochondrial Δψm changes play a role in carcinogenesis,
including tumor development, expansion and progression.
Accordingly, Ye et al postulated that a higher Δψm may be
used to isolate lung cancer stem cells, since these cells exhibited
also CD133 antigen (84). In
vivo analyses of patient-derived glioblastoma multiforme
tissues and ovarian cancer have demonstrated that CSCs possess
higher Δψm than the neighboring non-CSCs (85,86).
These data suggest that differences in the intrinsic Δψm of cancer
cells are likely to be associated with subtle shifts in the
biochemical pathways and/or cell phenotypes that play fundamental
roles in determining the probability of tumorigenesis. The results
of this study demonstrating a decrease in the population of cells
with the highest Δψm within the spherical HT29 cell line could be
associated with increased apoptosis, necrosis, and a lower
proliferation rate of these cells, which seems to confirm the
hypothesis that cells with an elevated mitochondrial membrane
potential are responsible for tumor progression. However, spheres
following treatment with the tested agents, the HCT116 cell-derived
presented an increased percentage of cells with a higher Δψm, thus
confirming the general hypothesis that chemotherapy can increase
the fraction of cells with CSC-like features.
Since the low level or absence of caspase-3 can
trigger the mode shift from apoptosis to necrosis or autophagy, we
decided to analyze the progression of autophagy. Treatment of the
HT29-derived colonospheres, but not the HCT116-derived
colonospheres, with ASA and 5-FU + ASA led to the progression of
autophagy, assessed by the immunofluorescence staining with AO. The
ability of ASA to induce autophagy has been reported in studies
which have suggested that ASA can impair the mTOR signaling cascade
due to the inhibition of mTOR effectors, S6K1 and 4E-BP1, or
AMPK-mediated ULK1 phosphorylation (23,87).
Under physiological conditions, mTOR prevents the progression of
autophagy by maintaining the hyperphosphorylation of proteins
required for the initiation of the autophagic cascade (88).
To summarize, in this study, we examined the
effects of drugs targeting different processes and signaling
pathways within a heterogeneous cancer cell population enriched
within CSC-like cells present in colonospheres derived from two
widely studied CRC cell lines. We suggest that the difference in
the susceptibility of cells to the tested agents may be caused by
their different differentiation status. Since HCT116 cells
represent a non-differentiated and highly aggressive cell line
corresponding to the TNM III stage, we hypothesized that the
fraction of highly resistant cancer stem-like cells should be
higher than in HT29 cells, which are known as less invasive
(corresponding to the TNM II). Our study further confirms that the
cancer cell spherical culture systems (rather than adherent cell
cultures) should be used for the in vitro testing of
anticancer therapeutics, since functional tests confirmed the
presence of cells harboring CSC-like features within 3D models of
CRC. Our results confirm that the use of a single (potentially)
anticancer agent affects mostly the cells constituting the major
tumor mass, which can be easily rebuilt by the activation of cells
with CSC-properties (89).
Ambiguous results concerning both analyzed CRC cell lines suggest
that the three tested drugs act on various cellular processes and
signaling pathways, and therefore should be considered for the
combined therapeutic treatment of CRC. Moreover, the results of our
investigations clearly demonstrate that cancer cell spheres should
be used as a preferable model for in vitro anticancer drug
testing, particularly those targeting CSCs responsible for the most
serious therapeutic limitations.
Supplementary Materials
Funding
This study was supported by the grant from the
Polish Ministry of Science and Higher Education no. MN
01-0232/08/280.
Availability of data and materials
The datasets used and/or analyzed during the
current study are available from the corresponding author on
reasonable request.
Authors' contributions
AOK was responsible for planning and conducting the
experiments, analyzing the results and writing and reviewing the
manuscript. MS was involved in planning the experiments, analyzing
the results and editing the manuscript. AW and KSK were involved in
performing the autophagy experiments and editing the manuscript. ZK
was involved in the conception and the planning of the experiments
and editing the manuscript. All authors have read and approved the
final manuscript.
Ethics approval and consent to
participate
Not applicable.
Patient consent for publication
Not applicable.
Competing interests
The authors declare that they have no competing
interests.
Abbreviations:
|
5-FU
|
5-fluorouracil
|
|
ASA
|
aspirin
|
|
CRC
|
colorectal cancer
|
|
CSC
|
cancer stem cell
|
Acknowledgments
Not applicable.
References
|
1
|
Arnold M, Sierra MS, Laversanne M,
Soerjomataram I, Jemal A and Bray F: Global patterns and trends in
colorectal cancer incidence and mortality. Gut. 66:683–691. 2017.
View Article : Google Scholar
|
|
2
|
Ricci-Vitiani L, Lombardi DG, Pilozzi E,
Biffoni M, Todaro M, Peschle C and De Maria R: Identification and
expansion of human colon-cancer-initiating cells. Nature.
445:111–115. 2007. View Article : Google Scholar
|
|
3
|
O'Brien CA, Pollett A, Gallinger S and
Dick JE: A human colon cancer cell capable of initiating tumour
growth in immunodeficient mice. Nature. 445:106–110. 2007.
View Article : Google Scholar
|
|
4
|
Chen X, Liao R, Li D and Sun J: Induced
cancer stem cells generated by radiochemotherapy and their
therapeutic implications. Oncotarget. 8:17301–17312. 2017.
|
|
5
|
Wang SS, Jiang J, Liang XH and Tang YL:
Links between cancer stem cells and epithelial-mesenchymal
transition. Onco Targets Ther. 8:2973–2980. 2015.PubMed/NCBI
|
|
6
|
Celià-Terrassa T and Kang Y: Distinctive
properties of metastasis-initiating cells. Genes Dev. 30:892–908.
2016. View Article : Google Scholar : PubMed/NCBI
|
|
7
|
Hutchinson L and Kirk R: High drug
attrition rates--where are we going wrong? Nat Rev Clin Oncol.
8:189–190. 2011. View Article : Google Scholar : PubMed/NCBI
|
|
8
|
Sant S and Johnston PA: The production of
3D tumor spheroids for cancer drug discovery. Drug Discov Today
Technol. 23:27–36. 2017. View Article : Google Scholar : PubMed/NCBI
|
|
9
|
Karlsson H, Fryknäs M, Larsson R and
Nygren P: Loss of cancer drug activity in colon cancer HCT-116
cells during spheroid formation in a new 3-D spheroid cell culture
system. Exp Cell Res. 318:1577–1585. 2012. View Article : Google Scholar : PubMed/NCBI
|
|
10
|
Olejniczak A, Szaryńska M and Kmieć Z: In
vitro characterization of spheres derived from colorectal cancer
cell lines. Int J Oncol. 52:599–612. 2018.
|
|
11
|
Costa EC, Moreira AF, de Melo-Diogo D,
Gaspar VM, Carvalho MP and Correia IJ: 3D tumor spheroids: An
overview on the tools and techniques used for their analysis.
Biotechnol Adv. 34:1427–1441. 2016. View Article : Google Scholar : PubMed/NCBI
|
|
12
|
Qureshi-Baig K, Ullmann P, Rodriguez F,
Frasquilho S, Nazarov PV, Haan S and Letellier E: What do we learn
from spheroid culture systems? Insights from tumorspheres derived
from primary colon cancer tissue. PLoS One. 11:e01460522016.
View Article : Google Scholar : PubMed/NCBI
|
|
13
|
Kim SY, Hong SH, Basse PH, Wu C, Bartlett
DL, Kwon YT and Lee YJ: Cancer stem cells protect non-stem cells
from anoikis: Bystander effects. J Cell Biochem. 117:2289–2301.
2016. View Article : Google Scholar : PubMed/NCBI
|
|
14
|
Paoli P, Giannoni E and Chiarugi P:
Anoikis molecular pathways and its role in cancer progression.
Biochim Biophys Acta. 1833:3481–3498. 2013. View Article : Google Scholar : PubMed/NCBI
|
|
15
|
Islam F, Gopalan V, Smith RA and Lam AK:
Translational potential of cancer stem cells: A review of the
detection of cancer stem cells and their roles in cancer recurrence
and cancer treatment. Exp Cell Res. 335:135–147. 2015. View Article : Google Scholar : PubMed/NCBI
|
|
16
|
Siddique HR and Saleem M: Role of BMI1, a
stem cell factor, in cancer recurrence and chemoresistance:
Preclinical and clinical evidences. Stem Cells. 30:372–378. 2012.
View Article : Google Scholar : PubMed/NCBI
|
|
17
|
Yan KS, Chia LA, Li X, Ootani A, Su J, Lee
JY, Su N, Luo Y, Heilshorn SC, Amieva MR, et al: The intestinal
stem cell markers Bmi1 and Lgr5 identify two functionally distinct
populations. Proc Natl Acad Sci USA. 109:466–471. 2012. View Article : Google Scholar
|
|
18
|
Manhas J, Bhattacharya A, Agrawal SK,
Gupta B, Das P, Deo SV, Pal S and Sen S: Characterization of cancer
stem cells from different grades of human colorectal cancer. Tumour
Biol. 37:14069–14081. 2016. View Article : Google Scholar : PubMed/NCBI
|
|
19
|
Butler SJ, Richardson L, Farias N,
Morrison J and Coomber BL: Characterization of cancer stem cell
drug resistance in the human colorectal cancer cell lines HCT116
and SW480. Biochem Biophys Res Commun. 490:29–35. 2017. View Article : Google Scholar : PubMed/NCBI
|
|
20
|
Szaryńska M, Olejniczak A, Kobiela J,
Spychalski P and Kmieć Z: Therapeutic strategies against cancer
stem cells in human colorectal cancer. Oncol Lett. 14:7653–7668.
2017.
|
|
21
|
Chan AT, Manson JE, Feskanich D, Stampfer
MJ, Colditz GA and Fuchs CS: Long-term aspirin use and mortality in
women. Arch Intern Med. 167:562–572. 2007. View Article : Google Scholar : PubMed/NCBI
|
|
22
|
Thorat MA and Cuzick J: Role of aspirin in
cancer prevention. Curr Oncol Rep. 15:533–540. 2013. View Article : Google Scholar : PubMed/NCBI
|
|
23
|
Din FV, Valanciute A, Houde VP, Zibrova D,
Green KA, Sakamoto K, Alessi DR and Dunlop MG: Aspirin inhibits
mTOR signaling, activates AMP-activated protein kinase, and induces
autophagy in colorectal cancer cells. Gastroenterology.
142:1504–1515.e1503. 2012. View Article : Google Scholar : PubMed/NCBI
|
|
24
|
Kaur J and Sanyal SN: PI3-kinase/Wnt
association mediates COX-2/PGE(2) pathway to inhibit apoptosis in
early stages of colon carcinogenesis: Chemoprevention by
diclofenac. Tumour Biol. 31:623–631. 2010. View Article : Google Scholar : PubMed/NCBI
|
|
25
|
Saha S, Mukherjee S, Khan P, Kajal K,
Mazumdar M, Manna A, Mukherjee S, De S, Jana D, Sarkar DK, et al:
Aspirin suppresses the acquisition of chemoresistance in breast
cancer by disrupting an NFkappaB-IL6 signaling axis responsible for
the generation of cancer stem cells. Cancer Res. 76:2000–2012.
2016. View Article : Google Scholar : PubMed/NCBI
|
|
26
|
Kastrati I, Litosh VA, Zhao S, Alvarez M,
Thatcher GR and Frasor J: A novel aspirin prodrug inhibits NFκB
activity and breast cancer stem cell properties. BMC Cancer.
15:8452015. View Article : Google Scholar
|
|
27
|
Moon CM, Kwon JH, Kim JS, Oh SH, Jin Lee
K, Park JJ, Pil Hong S, Cheon JH, Kim TI and Kim WH: Nonsteroidal
anti-inflammatory drugs suppress cancer stem cells via inhibiting
PTGS2 (cyclooxygenase 2) and NOTCH/HES1 and activating PPARG in
colorectal cancer. Int J Cancer. 134:519–529. 2014. View Article : Google Scholar
|
|
28
|
Miyamoto Y, Suyama K and Baba H: Recent
advances in targeting the EGFR signaling pathway for the treatment
of metastatic colorectal cancer. Int J Mol Sci. 18:182017.
View Article : Google Scholar
|
|
29
|
Van Emburgh BO, Sartore-Bianchi A, Di
Nicolantonio F, Siena S and Bardelli A: Acquired resistance to
EGFR-targeted therapies in colorectal cancer. Mol Oncol.
8:1084–1094. 2014. View Article : Google Scholar : PubMed/NCBI
|
|
30
|
Goel A, Chang DK, Ricciardiello L, Gasche
C and Boland CR: A novel mechanism for aspirin-mediated growth
inhibition of human colon cancer cells. Clin Cancer Res. 9:383–390.
2003.PubMed/NCBI
|
|
31
|
Wang H, Liu B, Wang J, Li J, Gong Y, Li S,
Wang C, Cui B, Xue X, Yang M, et al: Reduction of NANOG mediates
the inhibitory effect of aspirin on tumor growth and stemness in
colorectal cancer. Cell Physiol Biochem. 44:1051–1063. 2017.
View Article : Google Scholar : PubMed/NCBI
|
|
32
|
Mhaidat N M and Bouk lihacene M:
5-Fluorouracil-induced apoptosis in colorectal cancer cells is
caspase-9-dependent and mediated by activation of protein kinase
C-δ. Oncol Lett. 8:699–704. 2014. View Article : Google Scholar : PubMed/NCBI
|
|
33
|
Virgone-Carlotta A, Lemasson M, Mertani
HC, Diaz JJ, Monnier S, Dehoux T, Delanoë-Ayari H, Rivière C and
Rieu JP: In-depth phenotypic characterization of multicellular
tumor spheroids: Effects of 5-Fluorouracil. PLoS One.
12:e01881002017. View Article : Google Scholar : PubMed/NCBI
|
|
34
|
Martin-Villalba A, Llorens-Bobadilla E and
Wollny D: CD95 in cancer: Tool or target? Trends Mol Med.
19:329–335. 2013. View Article : Google Scholar : PubMed/NCBI
|
|
35
|
Chen L, Park SM, Tumanov AV, Hau A, Sawada
K, Feig C, Turner JR, Fu YX, Romero IL, Lengyel E, et al: CD95
promotes tumour growth. Nature. 465:492–496. 2010. View Article : Google Scholar : PubMed/NCBI
|
|
36
|
Szarynska M, Olejniczak A, Wierzbicki P,
Kobiela J, Laski D, Sledzinski Z, Adrych K, Guzek M and Kmiec Z:
FasR and FasL in colorectal cancer. Int J Oncol. 51:975–986. 2017.
View Article : Google Scholar : PubMed/NCBI
|
|
37
|
Ceppi P, Hadji A, Kohlhapp FJ, Pattanayak
A, Hau A, Liu X, Liu H, Murmann AE and Peter ME: CD95 and CD95L
promote and protect cancer stem cells. Nat Commun. 5:52382014.
View Article : Google Scholar : PubMed/NCBI
|
|
38
|
Mancias JD and Kimmelman AC: Mechanisms of
selective autophagy in normal physiology and cancer. J Mol Biol.
428:1659–1680. 2016. View Article : Google Scholar : PubMed/NCBI
|
|
39
|
Vaiopoulos AG, Kostakis ID, Koutsilieris M
and Papavassiliou AG: Colorectal cancer stem cells. Stem Cells.
30:363–371. 2012. View Article : Google Scholar : PubMed/NCBI
|
|
40
|
Gao XL, Zhang M, Tang YL and Liang XH:
Cancer cell dormancy: Mechanisms and implications of cancer
recurrence and metastasis. OncoTargets Ther. 10:5219–5228. 2017.
View Article : Google Scholar
|
|
41
|
Takeishi S and Nakayama KI: To wake up
cancer stem cells, or to let them sleep, that is the question.
Cancer Sci. 107:875–881. 2016. View Article : Google Scholar : PubMed/NCBI
|
|
42
|
Kreso A and Dick JE: Evolution of the
cancer stem cell model. Cell Stem Cell. 14:275–291. 2014.
View Article : Google Scholar : PubMed/NCBI
|
|
43
|
Weiswald LB, Bellet D and Dangles-Marie V:
Spherical cancer models in tumor biology. Neoplasia. 17:1–15. 2015.
View Article : Google Scholar : PubMed/NCBI
|
|
44
|
Szaryńska M, Olejniczak A, Kobiela J,
Łaski D, Śledziński Z and Kmieć Z: Cancer stem cells as targets for
DC-based immunotherapy of colorectal cancer. Sci Rep. 8:120422018.
View Article : Google Scholar
|
|
45
|
Drew DA, Cao Y and Chan AT: Aspirin and
colorectal cancer: The promise of precision chemoprevention. Nat
Rev Cancer. 16:173–186. 2016. View Article : Google Scholar : PubMed/NCBI
|
|
46
|
Valverde A, Peñarando J, Cañas A,
López-Sánchez LM, Conde F, Guil-Luna S, Hernández V, Villar C,
Morales-Estévez C, de la Haba-Rodríguez J, et al: The addition of
celecoxib improves the antitumor effect of cetuximab in colorectal
cancer: Role of EGFR-RAS-FOXM1-β- catenin signaling axis.
Oncotarget. 8:21754–21769. 2017. View Article : Google Scholar : PubMed/NCBI
|
|
47
|
Ahmed D, Eide PW, Eilertsen IA, Danielsen
SA, Eknæs M, Hektoen M, Lind GE and Lothe RA: Epigenetic and
genetic features of 24 colon cancer cell lines. Oncogenesis.
2:e712013. View Article : Google Scholar : PubMed/NCBI
|
|
48
|
Kleber S, Sancho-Martinez I, Wiestler B,
Beisel A, Gieffers C, Hill O, Thiemann M, Mueller W, Sykora J, Kuhn
A, et al: Yes and PI3K bind CD95 to signal invasion of
glioblastoma. Cancer Cell. 13:235–248. 2008. View Article : Google Scholar : PubMed/NCBI
|
|
49
|
Peter ME, Hadji A, Murmann AE, Brockway S,
Putzbach W, Pattanayak A and Ceppi P: The role of CD95 and CD95
ligand in cancer. Cell Death Differ. 22:885–886. 2015. View Article : Google Scholar : PubMed/NCBI
|
|
50
|
De Roock W, Claes B, Bernasconi D, De
Schutter J, Biesmans B, Fountzilas G, Kalogeras KT, Kotoula V,
Papamichael D, Laurent-Puig P, et al: Effects of KRAS, BRAF, NRAS,
and PIK3CA mutations on the efficacy of cetuximab plus chemotherapy
in chemotherapy-refractory metastatic colorectal cancer: A
retrospective consortium analysis. Lancet Oncol. 11:753–762. 2010.
View Article : Google Scholar : PubMed/NCBI
|
|
51
|
Karapetis CS, Khambata-Ford S, Jonker DJ,
O'Callaghan CJ, Tu D, Tebbutt NC, Simes RJ, Chalchal H, Shapiro JD,
Robitaille S, et al: K-ras mutations and benefit from cetuximab in
advanced colorectal cancer. N Engl J Med. 359:1757–1765. 2008.
View Article : Google Scholar : PubMed/NCBI
|
|
52
|
Gajate P, Sastre J, Bando I, Alonso T,
Cillero L, Sanz J, Caldés T and Díaz-Rubio E: Influence of KRAS
p.G13D mutation in patients with metastatic colorectal cancer
treated with cetuximab. Clin Colorectal Cancer. 11:291–296. 2012.
View Article : Google Scholar : PubMed/NCBI
|
|
53
|
Misale S, Di Nicolantonio F,
Sartore-Bianchi A, Siena S and Bardelli A: Resistance to anti-EGFR
therapy in colorectal cancer: From heterogeneity to convergent
evolution. Cancer Discov. 4:1269–1280. 2014. View Article : Google Scholar : PubMed/NCBI
|
|
54
|
Allegra CJ, Jessup JM, Somerfield MR,
Hamilton SR, Hammond EH, Hayes DF, McAllister PK, Morton RF and
Schilsky RL: American Society of Clinical Oncology provisional
clinical opinion: Testing for KRAS gene mutations in patients with
metastatic colorectal carcinoma to predict response to
anti-epidermal growth factor receptor monoclonal antibody therapy.
J Clin Oncol. 27:2091–2096. 2009. View Article : Google Scholar : PubMed/NCBI
|
|
55
|
De Roock W, Jonker DJ, Di Nicolantonio F,
Sartore-Bianchi A, Tu D, Siena S, Lamba S, Arena S, Frattini M,
Piessevaux H, et al: Association of KRAS p.G13D mutation with
outcome in patients with chemotherapy-refractory metastatic
colorectal cancer treated with cetuximab. JAMA. 304:1812–1820.
2010. View Article : Google Scholar : PubMed/NCBI
|
|
56
|
Tejpar S, Celik I, Schlichting M,
Sartorius U, Bokemeyer C and Van Cutsem E: Association of KRAS G13D
tumor mutations with outcome in patients with metastatic colorectal
cancer treated with first-line chemotherapy with or without
cetuximab. J Clin Oncol. 30:3570–3577. 2012. View Article : Google Scholar : PubMed/NCBI
|
|
57
|
Tveit KM, Guren T, Glimelius B, Pfeiffer
P, Sorbye H, Pyrhonen S, Sigurdsson F, Kure E, Ikdahl T, Skovlund
E, et al: Phase III trial of cetuximab with continuous or
intermittent fluorouracil, leucovorin, and oxaliplatin (Nordic
FLOX) versus FLOX alone in first-line treatment of metastatic
colorectal cancer: The NORDIC-VII study. J Clin Oncol.
30:1755–1762. 2012. View Article : Google Scholar : PubMed/NCBI
|
|
58
|
Guren TK, Thomsen M, Kure EH, Sorbye H,
Glimelius B, Pfeiffer P, Österlund P, Sigurdsson F, Lothe IM,
Dalsgaard AM, et al: Cetuximab in treatment of metastatic
colorectal cancer: Final survival analyses and extended RAS data
from the NORDIC-VII study. Br J Cancer. 116:1271–1278. 2017.
View Article : Google Scholar : PubMed/NCBI
|
|
59
|
Maughan TS, Adams RA, Smith CG, Meade AM,
Seymour MT, Wilson RH, Idziaszczyk S, Harris R, Fisher D, Kenny SL,
et al: MRC COIN Trial Investigators: Addition of cetuximab to
oxali-platin-based first-line combination chemotherapy for
treatment of advanced colorectal cancer: Results of the randomised
phase 3 MRC COIN trial. Lancet. 377:2103–2114. 2011. View Article : Google Scholar : PubMed/NCBI
|
|
60
|
Roelofs HM, Te Morsche RH, van Heumen BW,
Nagengast FM and Peters WH: Overexpression of COX-2 mRNA in
colorectal cancer. BMC Gastroenterol. 14:12014. View Article : Google Scholar
|
|
61
|
Lin PC, Lin YJ, Lee CT, Liu HS and Lee JC:
Cyclooxygenase-2 expression in the tumor environment is associated
with poor prognosis in colorectal cancer patients. Oncol Lett.
6:733–739. 2013. View Article : Google Scholar : PubMed/NCBI
|
|
62
|
Xu F, Li M, Zhang C, Cui J, Liu J, Li J
and Jiang H: Clinicopathological and prognostic significance of
COX-2 immu-nohistochemical expression in breast cancer: A
meta-analysis. Oncotarget. 8:6003–6012. 2017.
|
|
63
|
Wang ZM, Liu J, Liu HB, Ye M, Zhang YF and
Yang DS: Abnormal COX2 protein expression may be correlated with
poor prognosis in oral cancer: A meta-analysis. BioMed Res Int.
2014:3642072014.PubMed/NCBI
|
|
64
|
Elder DJ, Halton DE, Crew TE and Paraskeva
C: Apoptosis induction and cyclooxygenase-2 regulation in human
colorectal adenoma and carcinoma cell lines by the
cyclooxygenase-2-selective non-steroidal anti-inflammatory drug
NS-398. Int J Cancer. 86:553–560. 2000. View Article : Google Scholar : PubMed/NCBI
|
|
65
|
Xu XT, Hu WT, Zhou JY and Tu Y: Celecoxib
enhances the radiosensitivity of HCT116 cells in a COX-2
independent manner by up-regulating BCCIP. Am J Transl Res.
9:1088–1100. 2017.PubMed/NCBI
|
|
66
|
Alfonso L, Ai G, Spitale RC and Bhat GJ:
Molecular targets of aspirin and cancer prevention. Br J Cancer.
111:61–67. 2014. View Article : Google Scholar : PubMed/NCBI
|
|
67
|
Cao S, Yan Y, Zhang X, Zhang K, Liu C,
Zhao G, Han J, Dong Q, Shen B, Wu A, et al: EGF stimulates
cyclooxygenase-2 expression through the STAT5 signaling pathway in
human lung adenocarcinoma A549 cells. Int J Oncol. 39:383–391.
2011.PubMed/NCBI
|
|
68
|
Lippman SM, Gibson N, Subbaramaiah K and
Dannenberg AJ: Combined targeting of the epidermal growth factor
receptor and cyclooxygenase-2 pathways. Clin Cancer Res.
11:6097–6099. 2005. View Article : Google Scholar : PubMed/NCBI
|
|
69
|
Choe MS, Zhang X, Shin HJ, Shin DM and
Chen ZG: Interaction between epidermal growth factor receptor- and
cyclooxygenase 2-mediated pathways and its implications for the
chemoprevention of head and neck cancer. Mol Cancer Ther.
4:1448–1455. 2005. View Article : Google Scholar : PubMed/NCBI
|
|
70
|
Huang CY and Yu LC: Pathophysiological
mechanisms of death resistance in colorectal carcinoma. World J
Gastroenterol. 21:11777–11792. 2015. View Article : Google Scholar : PubMed/NCBI
|
|
71
|
Kim YM, Park SY and Pyo H:
Cyclooxygenase-2 (COX-2) negatively regulates expression of
epidermal growth factor receptor and causes resistance to gefitinib
in COX-2-overexpressing cancer cells. Mol Cancer Res. 7:1367–1377.
2009. View Article : Google Scholar : PubMed/NCBI
|
|
72
|
Hu H, Han T, Zhuo M, Wu LL, Yuan C, Wu L,
Lei W, Jiao F and Wang LW: Elevated COX-2 expression promotes
angio-genesis through EGFR/p38-MAPK/Sp1-dependent signalling in
pancreatic cancer. Sci Rep. 7:4702017. View Article : Google Scholar
|
|
73
|
Shalini S, Dorstyn L, Dawar S and Kumar S:
Old, new and emerging functions of caspases. Cell Death Differ.
22:526–539. 2015. View Article : Google Scholar :
|
|
74
|
Fujita J, Crane AM, Souza MK, Dejosez M,
Kyba M, Flavell RA, Thomson JA and Zwaka TP: Caspase activity
mediates the differentiation of embryonic stem cells. Cell Stem
Cell. 2:595–601. 2008. View Article : Google Scholar : PubMed/NCBI
|
|
75
|
Janzen V, Fleming HE, Riedt T, Karlsson G,
Riese MJ, Lo Celso C, Reynolds G, Milne CD, Paige CJ, Karlsson S,
et al: Hematopoietic stem cell responsiveness to exogenous signals
is limited by caspase-3. Cell Stem Cell. 2:584–594. 2008.
View Article : Google Scholar : PubMed/NCBI
|
|
76
|
Flanagan L, Meyer M, Fay J, Curry S, Bacon
O, Duessmann H, John K, Boland KC, McNamara DA, Kay EW, et al: Low
levels of Caspase- 3 predict favourable response to 5FU-based
chemotherapy in advanced colorectal cancer: Caspase-3 inhibition as
a therapeutic approach. Cell Death Dis. 7:e20872016. View Article : Google Scholar
|
|
77
|
Liang Y, Yan C and Schor NF: Apoptosis in
the absence of caspase 3. Oncogene. 20:6570–6578. 2001. View Article : Google Scholar : PubMed/NCBI
|
|
78
|
Huang Q, Li F, Liu X, Li W, Shi W, Liu FF,
O'Sullivan B, He Z, Peng Y, Tan AC, et al: Caspase 3-mediated
stimulation of tumor cell repopulation during cancer radiotherapy.
Nat Med. 17:860–866. 2011. View Article : Google Scholar : PubMed/NCBI
|
|
79
|
Li F, Huang Q, Chen J, Peng Y, Roop DR,
Bedford JS and Li CY: Apoptotic cells activate the 'phoenix rising'
pathway to promote wound healing and tissue regeneration. Sci
Signal. 3:ra132010. View Article : Google Scholar
|
|
80
|
Pietilä M, Lehtonen S, Närhi M, Hassinen
IE, Leskelä HV, Aranko K, Nordström K, Vepsäläinen A and Lehenkari
P: Mitochondrial function determines the viability and osteogenic
potency of human mesenchymal stem cells. Tissue Eng Part C Methods.
16:435–445. 2010. View Article : Google Scholar
|
|
81
|
Heerdt BG, Houston MA, Wilson AJ and
Augenlicht LH: The intrinsic mitochondrial membrane potential
(Deltapsim) is associated with steady-state mitochondrial activity
and the extent to which colonic epithelial cells undergo
butyrate-mediated growth arrest and apoptosis. Cancer Res.
63:6311–6319. 2003.PubMed/NCBI
|
|
82
|
Heerdt BG, Houston MA and Augenlicht LH:
The intrinsic mitochondrial membrane potential of colonic carcinoma
cells is linked to the probability of tumor progression. Cancer
Res. 65:9861–9867. 2005. View Article : Google Scholar : PubMed/NCBI
|
|
83
|
Heerdt BG, Houston MA and Augenlicht LH:
Growth properties of colonic tumor cells are a function of the
intrinsic mitochondrial membrane potential. Cancer Res.
66:1591–1596. 2006. View Article : Google Scholar : PubMed/NCBI
|
|
84
|
Ye XQ, Li Q, Wang GH, Sun FF, Huang GJ,
Bian XW, Yu SC and Qian GS: Mitochondrial and energy
metabolism-related properties as novel indicators of lung cancer
stem cells. Int J Cancer. 129:820–831. 2011. View Article : Google Scholar : PubMed/NCBI
|
|
85
|
Michelakis ED, Sutendra G, Dromparis P,
Webster L, Haromy A, Niven E, Maguire C, Gammer TL, Mackey JR,
Fulton D, et al: Metabolic modulation of glioblastoma with
dichloroacetate. Sci Transl Med. 2:31ra342010. View Article : Google Scholar : PubMed/NCBI
|
|
86
|
Pastò A, Bellio C, Pilotto G, Ciminale V,
Silic-Benussi M, Guzzo G, Rasola A, Frasson C, Nardo G, Zulato E,
et al: Cancer stem cells from epithelial ovarian cancer patients
privilege oxidative phosphorylation, and resist glucose
deprivation. Oncotarget. 5:4305–4319. 2014. View Article : Google Scholar : PubMed/NCBI
|
|
87
|
Sun T, Ming L, Yan Y, Zhang Y and Xue H:
Beclin 1 acetylation impairs the anticancer effect of aspirin in
colorectal cancer cells. Oncotarget. 8:74781–74790. 2017.PubMed/NCBI
|
|
88
|
Morselli E, Galluzzi L, Kepp O, Vicencio
JM, Criollo A, Maiuri MC and Kroemer G: Anti- and pro-tumor
functions of autophagy. Biochim Biophys Acta. 1793:1524–1532. 2009.
View Article : Google Scholar : PubMed/NCBI
|
|
89
|
Phi LT, Sari IN, Yang YG, Lee SH, Jun N,
Kim KS, Lee YK and Kwon HY: Cancer stem cells (CSCs) in drug
resistance and their therapeutic implications in cancer treatment.
Stem Cells Int. 2018:54169232018. View Article : Google Scholar : PubMed/NCBI
|