Introduction
The 2018 status report on the global cancer
statistics showed that breast cancer is the most common type of
cancer and leading cause of cancer-associated mortality affecting
women worldwide (1). If detected
in the early stages, breast cancer is curable; however, the
majority of patients with breast cancer are diagnosed at the first
instance with advanced stage breast cancer, which is associated
with a less favorable prognosis and decreased survival times
(2). Tumor metastasis, or the
spread of cancer cells throughout the body, accounts for a large
number of cancer-associated deaths, and it has been estimated to
account for ~90% of all cancer-associated mortalities worldwide
(3). Therefore, a considerable
body of research has been performed to determine the mechanisms
underlying the metastatic process and the complex interactions
between cancerous cells, surrounding healthy cells and the tumor
microenvironment. During malignant transformation, malignant tumors
at the primary site (primary cancer cells) penetrate through the
basement membranes and extracellular matrix to invade adjacent
tissues, metastasize and are then transported via the circulatory
system (circulating cancer cells). Finally, these metastatic cells
extravasate, attach to a distant tissue, proliferate and form a new
distant tumor (secondary cancer cells) (4). Nowadays, ongoing research has focused
on identifying and understanding the mechanisms of cancer
metastasis which may result in the more efficient treatment of
patients with metastatic cancer (5).
Altered metabolism is a hallmark of cancer cells, as
illustrated by the Warburg effect; a phenomenon that demonstrates
the increased rate of glucose consumption and utilization of the
glycolytic pathway in cancer cells, even in the presence of oxygen
(6). This metabolic shift can
alter glucose metabolism to produce the energy and biological
macromolecules required for cancer cell growth and proliferation.
One of the metabolic shifts includes the hexosamine biosynthesis
pathway (HBP), a minor branch of the glycolytic pathway. The end
product of HBP is uridine diphosphate N-acetylglucosamine
(UDP-GlcNAc), a sugar donor for post-translational protein
modifications, including classical glycosylation occurring in the
endoplasmic reticulum and golgi apparatus and O-linked
N-acetyl glucosaminylation (O-GlcNAcylation), which occurs
in the cytoplasm, nucleus and mitochondria (7). The latter glyco-sylation type is
dynamically regulated by two key enzymes, O-GlcNAc
transferase (OGT) (8) and
O-GlcNAcase (9), which are
responsible for the addition and removal of O-GlcNAc from
target proteins, respectively. Growing evidence has suggested that
abnormal O-GlcNAcylation status is associated with cancer
malignancy (10,11).
In our previous studies, it was demonstrated that
O-GlcNAcylation was increased in primary breast and
colorectal cancer tissues (12,13).
Moreover, O-GlcNAcylation is required for anoikis resistance
and anchorage-independent growth, which are vital steps in the
progression of breast cancer (14). However, the precise roles of this
modification regarding malignant transformation are yet to be
elucidated. Therefore, in the present study, the effects of
O-GlcNAc inhibition on the malignant transformation of MCF-7
breast cancer cells under different culture conditions were
determined, using monolayer (primary growth), anoikis resistance
(spheroid growth) and reseeding (secondary growth) to mimic the
metastatic processes. As O-GlcNAc-modified proteins have
been reported to influence breast cancer cell progression and
metastasis, several biological effects of O-GlcNAc reduction
in MCF-7 cells were investigated by assessing cell morphology,
viability and invasiveness under different culture conditions.
Furthermore, gel-free quantitative proteomics coupled with LC-MS/MS
analysis were used to identify proteins affected by O-GlcNAc
inhibition, which may serve important roles in cancer
metastasis.
Materials and methods
Breast cancer cell line
MCF-7 breast cancer cells were purchased from the
American Type Culture Collection and cultured in DMEM (Gibco;
Thermo Fisher Scientific, Inc.) containing 10% FBS (Hyclone
Laboratories; GE Healthcare Life Sciences), 100 U/ml penicillin and
100 mg/ml streptomycin (both Gibco; Thermo Fisher Scientific,
Inc.).
Transfection of siRNA
Stealth RNAi oligonucleotides against OGT (siOGT)
and scrambled negative control medium GC duplex (siSC; cat. no.
12935300), were purchased from Invitrogen (Thermo Fisher
Scientific, Inc.) and used according to the manufacturer's
protocol. The forward and reverse sequences of siOGT were 5′-UAA
UCA UUU CAA UAA CUG CUU CUG C-3′ and 5′-GCA GAA GCA GUU AUU GAA AUG
AUUA-3′, respectively. To silence OGT expression using RNA
interference, 2×10⁵ cells were suspended in 2 ml
antibiotic-free DMEM and added to 6-well plates (conventional plate
for monolayer condition and poly-HEMA coated plate for anoikis
induction). Subsequently, cells in all conditions were transfected
with 20 nM stealth siOGT or scramble negative control using
Lipofectamine® 2000 reagent (Invitrogen; Thermo Fisher
Scientific, Inc.), according to the manufacturer's instructions,
and cultured for 3 days in a humidified incubator with 5%
CO2 at 37°C.
In vitro model of metastasis
Metastasis was assessed in vitro by culturing
cells in three different conditions to determine the effect of
O-GlcNAcylation inhibition on MCF-7 breast cancer cells. The
first condition was as a monolayer culture (used to mimic breast
cancer cells at the primary site), where MCF-7 cells were plated in
conventional culture containers and transfected with small
interfering RNA (siRNA) against OGT or scrambled siRNA control for
3 days in a humidified incubator with 5% CO2 at 37°C.
The second condition was the anoikis resistant culture (spheroid
formation) which was used to mimic breast cancer cells which are
transported via the circulatory system. To induce anoikis, cells
were plated in 6 well-plates pre-coated at 37°C for 1 day with
poly-2-hydroxyethyl methacrylate (poly-HEMA; Sigma-Aldrich; Merck
KGaA) and cultured for 3 days in an incubator as mentioned above.
The poly-HEMA-coated plates were prepared as previously described
(15). Briefly, 2 ml of poly-HEMA
(30 mg/ml solution) was dissolved in 95% ethanol, added to the 6
well-plates and dried completely at 37°C in an incubator, followed
by UV sterilization before use in subsequent experiments. The final
condition was re-attachment or reseeding (used to mimic breast
cancer cells at the secondary site). Spheroid cells transfected
with siOGT or siSC for 3 days were harvested and washed with 1 ml
PBS and centrifuged at 1,000 x g at 4°C for 5 min. Cell pellets
were treated with trypsin at 37°C for 10 min and resuspended in 1
ml DMEM. Subsequently, 1x10⁶ cells were reseeded in T-25
flasks for the reseeding condition, and further incubated for
another 3 days in an incubator, in the aforementioned
conditions.
Cellular morphology, cytoplasmic
vacuolation and growth assay
MCF-7 breast cancer cells from all culture
conditions were observed after culturing using an inverted
microscope (Eclipse TS100; Nikon Corporation) and then imaged using
an attached D5100 camera (Nikon Corporation). Furthermore, the
accumulation of cytoplasmic vesicles in MCF-7 cells in the
reseeding culture condition were counted. At least 5 random fields
(magnification, x400) were imaged and the number of cytoplasmic
vacuoles were counted in each field. The vacuole sizes were
determined using ImageJ (version 1.42I; National Institutes of
Health). These were classified into two groups according to their
size; microvacuoles (≤50 μm) and macrovacuoles (≥50
μm). The average number of micro and macrovacuoles was
calculated in the siSC control and siOGT cells, and the assay was
repeated three times. Subsequently, the viability of transfected
cells was assessed using the trypan blue dye exclusion assay. The
number of viable and non-viable cells from 4 fields of view were
counted using a hemocy-tometer with 0.4% trypan blue (1:1
volume/volume) at room temperature within 10 min, and the assay was
repeated three times. Results are presented as the mean ± standard
deviation of viable cells in the OGT knockdown group, normalized to
those in the siSC group.
In vitro cell invasion assay
The invasion of transfected cells in monolayer,
anoikis resistant and reseeding conditions were assayed in modified
Boyden chambers as described previously, with certain modifications
(16). Briefly, for the invasion
assay, 8-μm pore membrane filters were placed in Transwell
chambers (Corning, Inc.) and the upper chamber was coated with 30
μg Matrigel (BD Biosciences) at 37°C in an incubator
overnight. A suspension of 2×10⁵ cells from each culture
condition was added to the upper chamber (200 μl/chamber),
and DMEM was added to the lower chamber (500 μl/chamber).
The chamber was incubated at 37°C for 24 h in a humidified
atmosphere of 5% CO2. Subsequently, the cells on the
upper surface were removed with a cotton swab, and the cells were
fixed with 30% methanol, followed by staining with 0.5% crystal
violet in 20% methanol, both steps were performed for 15 min at
room temperature. Finally, stained cells were counted in 5 randomly
selected fields, using an inverted microscope (Eclipse TS100; Nikon
Corporation) and then imaged using an attached D5100 camera (Nikon
Corporation) (magnification, x100).
In-solution trypsin digestion
Cultured cells were resuspended in a digestion
solution (50 mM ammonium bicarbonate) and sonicated until the
turbid suspensions became clear. Sonicated samples were centrifuged
at 10,000 × g, 4°C for 10 min and protein concentration was
determined using a Bio-Rad Protein assay (Bio-Rad Laboratories,
Inc.). A total of 10 μg of each sample was reduced with 10
mM DTT at 37°C for 1 h, followed by an alkylation step with 30 mM
iodoacetamide in the dark at room temperature for 30 min.
Subsequently, samples were digested in solution overnight with 0.2
μg trypsin (Promega Corporation) at 37°C. After digestion,
samples were acidified with formic acid and then desalted using C18
ZipTips (EMD Millipore) at room temperature for 10 min.
Liquid chromatography-mass spectrometry
(LC-MS) analysis
Digested peptides were identified using nanoflow
liquid chromatography coupled with amaZon speed ion trap mass
spectrometry (Bruker-Michrom, Inc.), as previously described
(17). The peptides were
concentrated and desalted on a 75-umid×200 mmC18 Easy-nLC™ column
(Thermo Fisher Scientific, Inc.). The mass spectrometer was
operated in positive ion mode with a CaptiveSpray ion source and a
spray voltage of 1,500 v, dry temperature of 150°C, without
nebulizer gas and a mass range between 400-1,400 m/z. The parameter
was optimized at 922 m/z with an ion charge count target of
400,000. To elute peptides, 0.1% formic acid in 3% acetonitrile
(solution A) and 0.1% formic acid in 97% acetonitrile (solution B)
were used with the following conditions: 10-70% B at 0-70 min, 90%
B at 70-75 min and 10% B at 75-90 min. The raw data were processed
using Bruker compass version 1.4 (Bruker-Michrom, Inc.).
DataAnalysisTM version 4.0 (Bruker-Michrom, Inc.)
created Mascot compatible files (mgf) to facilitate Mascot database
searches. Each sample was assessed three times.
Protein quantification and
identification
Progenesis QI (version 3.1; Nonlinear Dynamics), a
label-free quantitative LC-MS software, was used to identify and
quantify differential protein expression between siSC and siOGT
treated cells in each of the three culture conditions. In total, 6
samples were analyzed using LC-MS/MS each in triplicate: siOGT and
siSC MCF-7 cells of monolayer, anoikis resistant and reseeding
conditions. The chromatograms of all samples were aligned and the
sample with the smallest differences in retention times and MS
peaks among all the samples was selected as the reference. The ion
intensities of MS peaks of each sample were then normalized to
those of the established reference. Obtained MS/MS spectra from
Progenesis QI were used to perform peptide searches using the
Mascot search engine against the SwissProt database (http://www.matrixscience.com/) (18). Search parameters of MS/MS data
included trypsin protease specificity with the possibility of one
missed cleavage, peptide/fragment mass tolerances of 0.6 Da and
fixed modifications of carbamidomethylation at cysteine and
oxidation at methionine. Significant peptide identifications above
the identity or homology threshold were adjusted to ≤1% peptide
false discovery rate using the Mascot Percolator algorithm
(19).
Relative quantitation of the normalized abundance of
each peptide was performed by selecting only non-conflicting unique
peptides with a Mascot ion score >30 (P<0.05). Furthermore,
the identified peptides were further filtered using the following
criteria: Peptides exhibiting P≤0.01 between the triplicate runs
ANOVA and with spectral counts ≥2 across the three technical
replicates in all samples. Subsequently, MS ion intensities of each
individual confident peptide derived from the same protein were
combined and averaged. The normal-ized values of protein expression
levels (combined MS ion intensities of confident peptides) of each
sample were calculated by dividing by the lowest value of those
protein levels among the 6 samples. The expression levels of each
protein were calculated as the ratio (+/-) of the average MS ion
intensities between siSC and OGT knockdown of monolayer, anoikis
resistant and reseeding conditions. (+) signifies the intensity in
OGT knockdown is higher compared with the siSC, whereas (-)
indicates the band intensity in OGT knockdown is lower compared
with the siSC treated group.
Heat map analysis of protein expression
patterns in the mono- layer, anoikis resistant and reseeding
conditions
To obtain relative protein abundance measurements
from Progenesis QI, fold changes of protein expression levels
between siOGT and siSC treated cells of the three conditions were
compared. Subsequently, heat map analysis of protein expression
levels was performed using R-software (r-project.org; version
3.3.1) via the pheatmap package (https://cran.r-project.org/web/packages/pheatmap/index.html).
Proteins were clustered according to their expression levels using
the following parameters: Distance computational method, Minkowski
and agglomeration method, Complete.
Determining protein-protein
interactions
The online tool Search Tool for the Retrieval of
Interacting Genes/Proteins (STRING; string-db.org; version 11.0)
was used to construct interactome maps of differential proteins.
The indicated network properties included: Nodes, number of
proteins in the network; edges, number of interactions; node
degree, average number of interactions; and clustering coefficient,
tendency of the network to form clusters. The closer the local
clustering coefficient was to 1, the more likely it was for the
network to form clusters; PPI enrichment P-value, statistical
significance.
Western blotting
Cells were lysed in RIPA buffer containing 1%
protease inhibitor cocktail (both Sigma-Aldrich; Merck KGaA) and 20
μM Thiamet-G (Sigma-Aldrich; Merck KGaA), an
O-GlcNAcase inhibitor. Protein concentrations were measured
using a Bio-Rad Protein assay (Bio-Rad Laboratories, Inc.). Protein
samples (30 μg/lane) were loaded on a 10% SDS-gel, resolved
using SDS-PAGE and transferred to PVDF membranes (EMD Millipore).
The levels of O-GlcNAc, OGT and β-actin were determined
using western blotting with primary antibodies, including
antibodies against O-GlcNAc-modified proteins RL2 (1:1,000;
cat. no. ab2739; Abcam), OGT (1:1,000; cat. no. O6264;
Sigma-Aldrich; Merck KGaA) and β-actin (1:10,000; cat. no. mAb3700;
Cell Signaling Technology, Inc.), with overnight incubation at 4°C
in 1% PBS-casein blocking buffer (Bio-Rad Laboratories, Inc.) as
previously described (14). The
membranes were incubated with the corresponding secondary
antibodies, including swine anti-rabbit (1:5,000; cat. no. P-0217;
Dako; Agilent Technologies, Inc.) for OGT and rabbit anti-mouse
immunoglobulins (1:5,000; cat. no. P-0260; Dako; Agilent
Technologies, Inc.) for RL2 and β-actin, respectively. Western
blots were developed using WesternBright™ enhanced chemiluminescent
reagent (Advansta, Inc.) and visualized using ImageQuant LAS4000
(GE Healthcare). β-actin was used as the loading control.
The expression of epithelial-mesenchymal transition
(EMT) markers were also assessed using western blotting with
antibodies against β-catenin (cat. no. mAb9582), E-cadherin (cat.
no. mAb3195) and N-cadherin (cat. no. mAb4061) (all 1:1,000; Cell
Signaling Technology, Inc.). All membranes were incubated with goat
anti-rabbit immunoglobulins (1:5,000; cat. no. 7074; Cell Signaling
Technology, Inc.) secondary antibody and the detection was
performed, as described previously (14).
The expression levels of representative proteins
were validated by western blotting using the following antibodies;
monoclonal mouse anti-human nucleophosmin (NPM1; 1:1,000; cat. no.
ab55708; Abcam), monoclonal mouse anti-human heat shock protein 27
(HSP27; 1:2,000; cat. no. ab2790; Abcam), monoclonal rabbit
anti-human small nuclear ribonucleoprotein Sm D1 (SNRPD1; 1:5,000;
cat. no. ab50940; Abcam), monoclonal rabbit anti-human Histone H3
(1:1,000; cat. no. mAb9715; Cell Signaling Technology, Inc.),
monoclonal mouse anti-human cyto-keratin18 (1:10,000; cat. no.
MAB3236; Chemicon; Thermo Fisher Scientific, Inc.) and monoclonal
rabbit anti-human mTOR antibody (1:1,000; cat. no. mAb2972; Cell
Signaling Technology, Inc.). The membranes were incubated with the
appropriate secondary antibodies, including swine anti-rabbit
(1:5,000; cat. no. P-0217; Dako; Agilent Technologies, Inc.) for
SNRPD1, Histone H3 and mTOR and rabbit anti-mouse immunoglobulins
(1:5,000; cat. no. P-0260; Dako; Agilent Technologies, Inc.) for
NPM1, HSP27 and CK18, respectively. Then, the detection was
performed as described above. The results were reported as the
average band intensity ± standard deviation of proteins of interest
in the OGT knockdown cells normalized by to the intensity of the
siSC. In certain experiments, the protein expression ratios (+/−)
were calculated from band intensities of proteins of interest
between siSC and OGT knockdown. (+) means the intensity in OGT
knockdown is higher than that in siSC whereas (-) indicates the
band intensity in OGT knockdown is lower than that of the siSC,
respectively. At least three independent experiments were
performed.
Statistical analysis
Statistical comparisons between two groups were
performed using a one-sample paired Student's t-test and a one-way
ANOVA was used followed by a Bonferroni's multiple comparison test
to compare differences between multiple groups. All analyses were
performed using GraphPad Prism version 5.0 (GraphPad Software,
Inc.). P<0.05 was considered to indicate a statistically
significant difference.
Results
Transient knockdown of O-GlcNAc
transferase influences O-GlcNAc and OGT expression which alters
cell morphology, vacuole numbers and cell viability
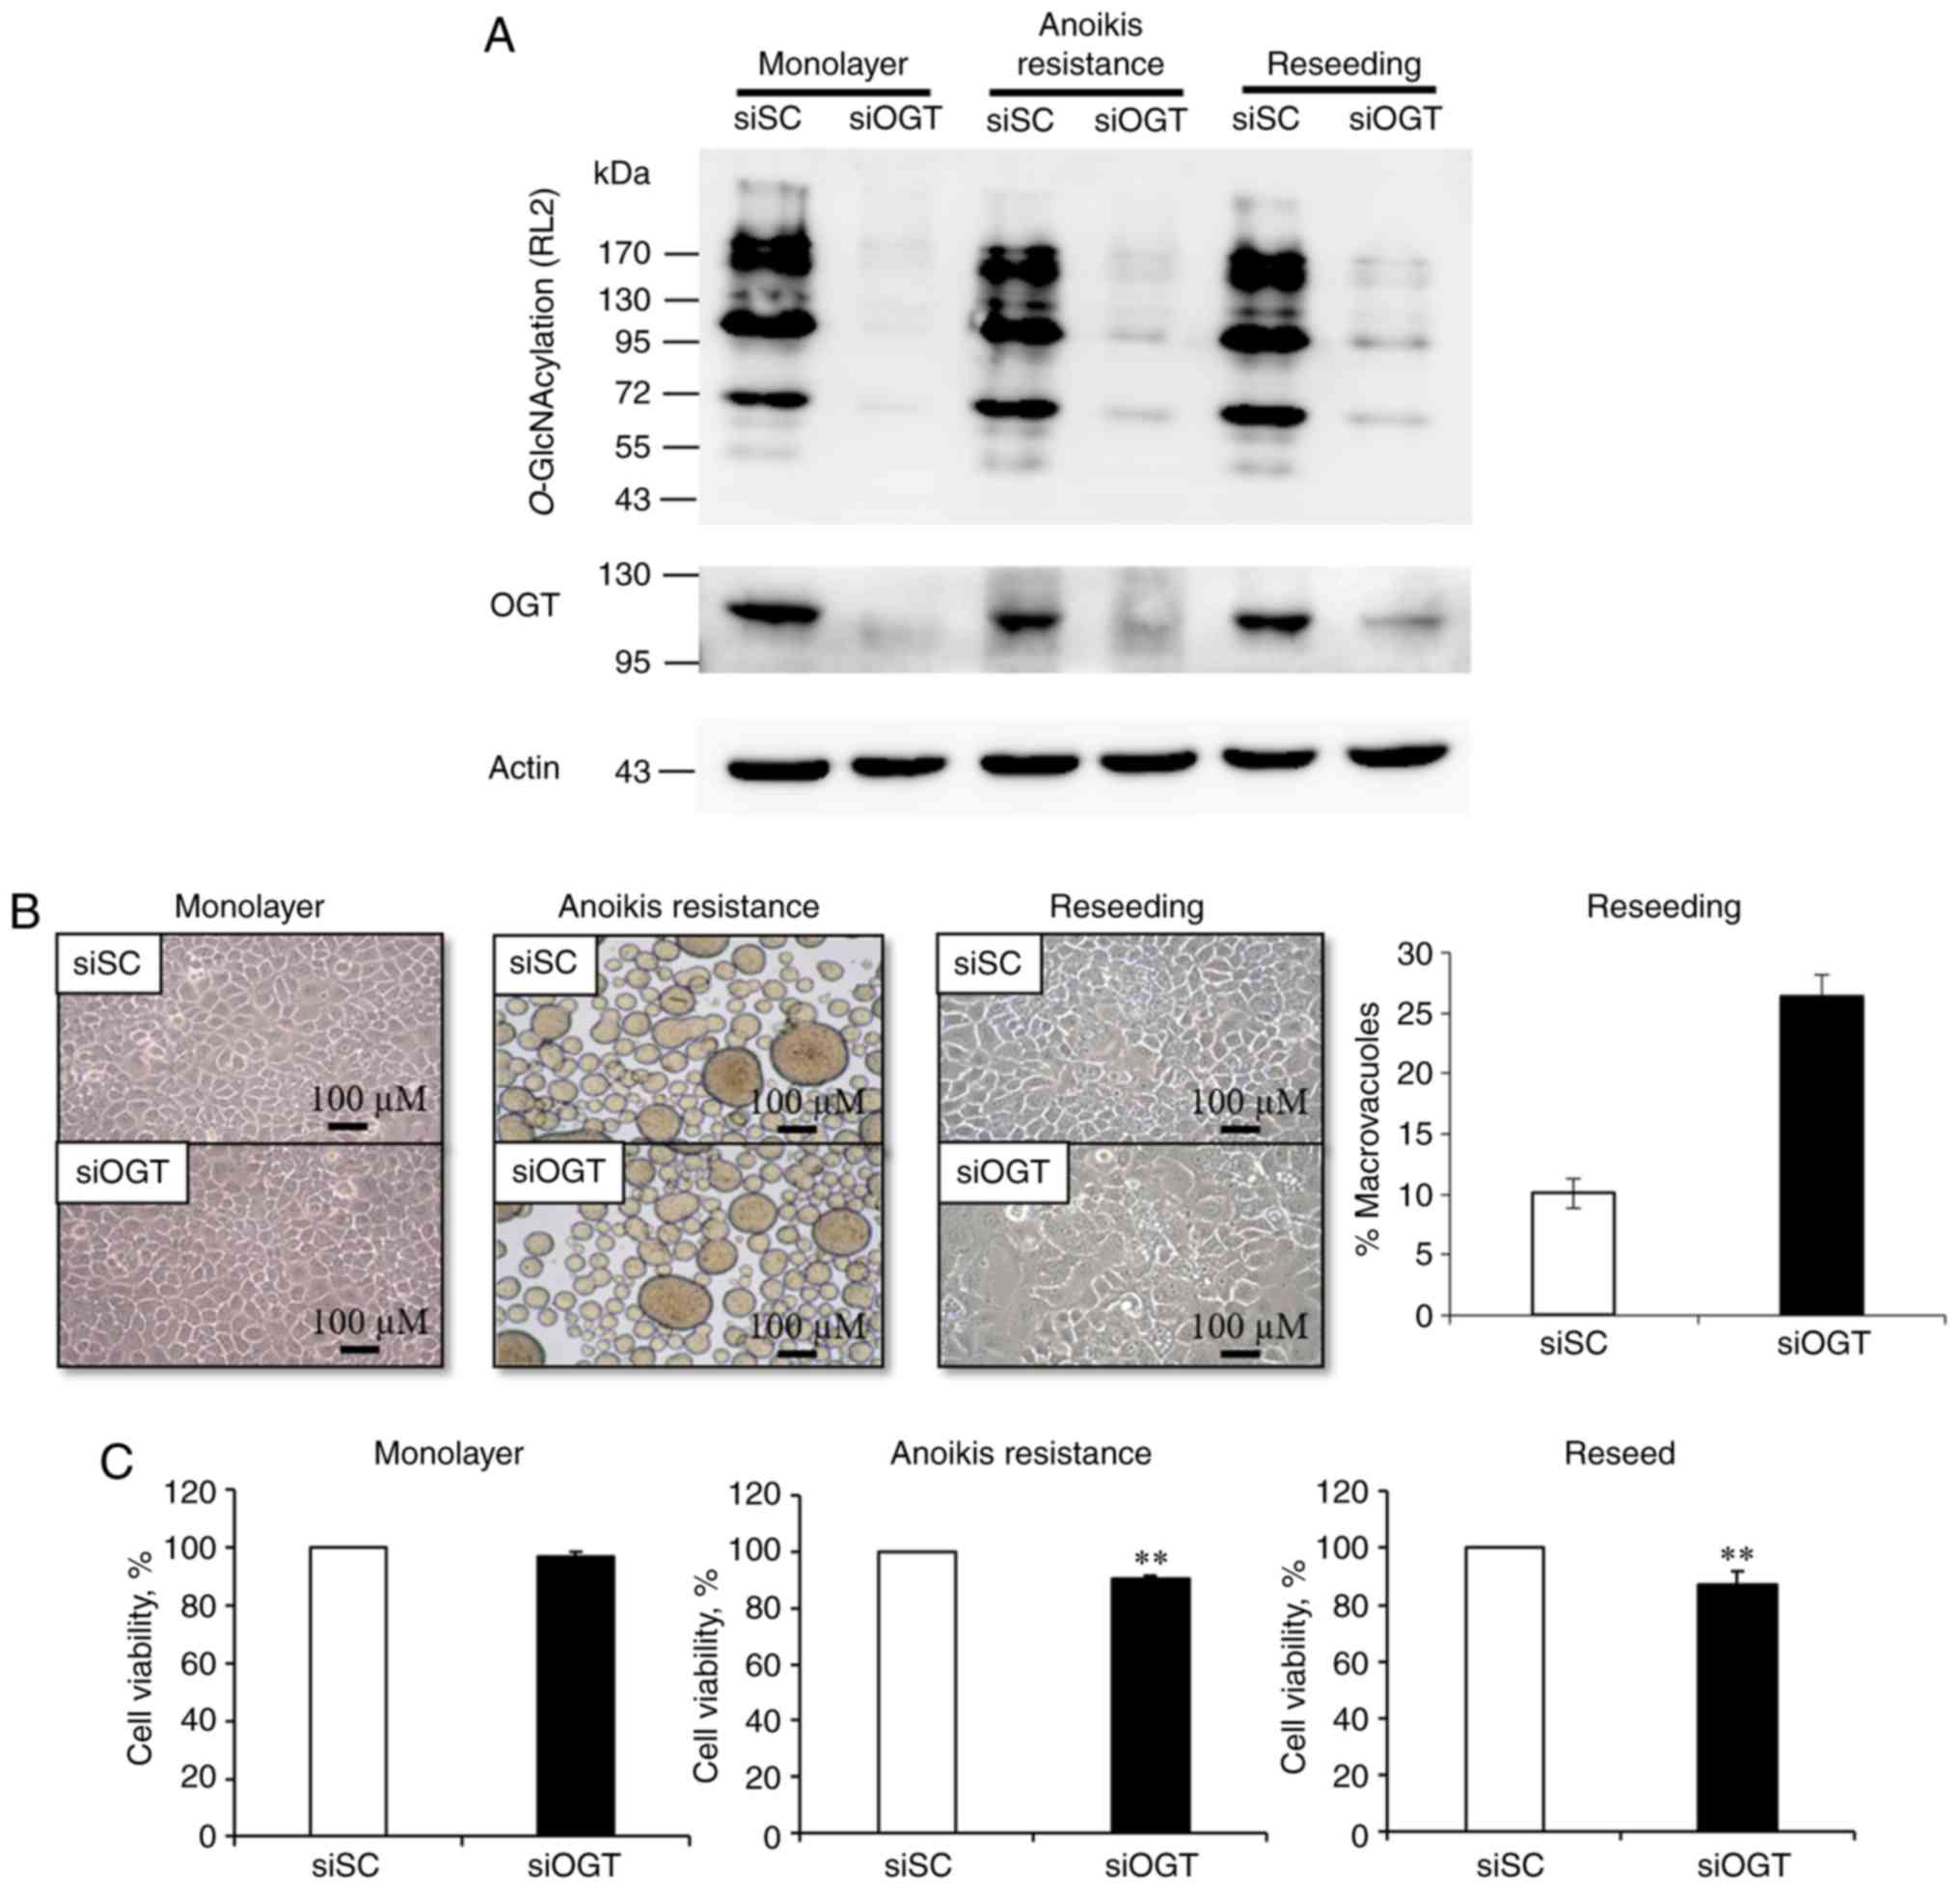
As O-GlcNAcylation and OGT levels were
upregulated in numerous cancer cell lines, transient knockdown of
O-GlcNAcylation by RNA interference against OGT was
performed under different culture conditions. siOGT transfection in
all conditions significantly decreased both OGT and
O-GlcNAcylation levels compared with the respective siSC
group (Fig. 1A).
After that, cellular morphology under different
culture conditions were examined. OGT knockdown and siSC cells
exhibited normal cellular morphology in the mono-layer conditions
(Fig. 1B). For the anoikis
resistant model, detached siSC and siOGT MCF-7 cells spontaneously
aggregated into spheroid bodies, but there was no difference in
morphology between the two groups (Fig. 1B). However, when these spheroid
cells were reseeded in the attachment culture, the siSC cells
adhered well, displaying a normal morphology. By contrast, the
siOGT treated cells demonstrated notable morphological changes with
an increase in the number of cytoplasmic vacuoles of varying sizes.
The cytoplasmic vacuolation was assessed and the total amount of
macrovacuoles in siSC cells was 10%; whereas in OGT silenced cells,
the total proportion of macrovacuoles was increased to 25%
(Fig. 1B). Therefore, OGT
knockdown may serve a pivotal role in cellular morphology,
particularly in the reseeding condition (Fig. 1B). Subsequently, it was determined
whether decreasing O-GlcNAcylation levels affected cell
viability of MCF-7 cells under different culture conditions. Using
a trypan blue exclusion assay, the results indicated a significant
reduction in cell viability in the siOGT transfected MCF-7 cells,
in both the anoikis resistant and reseeding conditions (P<0.01);
however, this phenomenon was not observed in the monolayer culture
(Fig. 1C). Therefore, OGT and
O-GlcNAc may serve a role in cell reseeding, which is
representative of cancer cells metastasizing to the secondary
sites.
OGT is required for cancer invasion
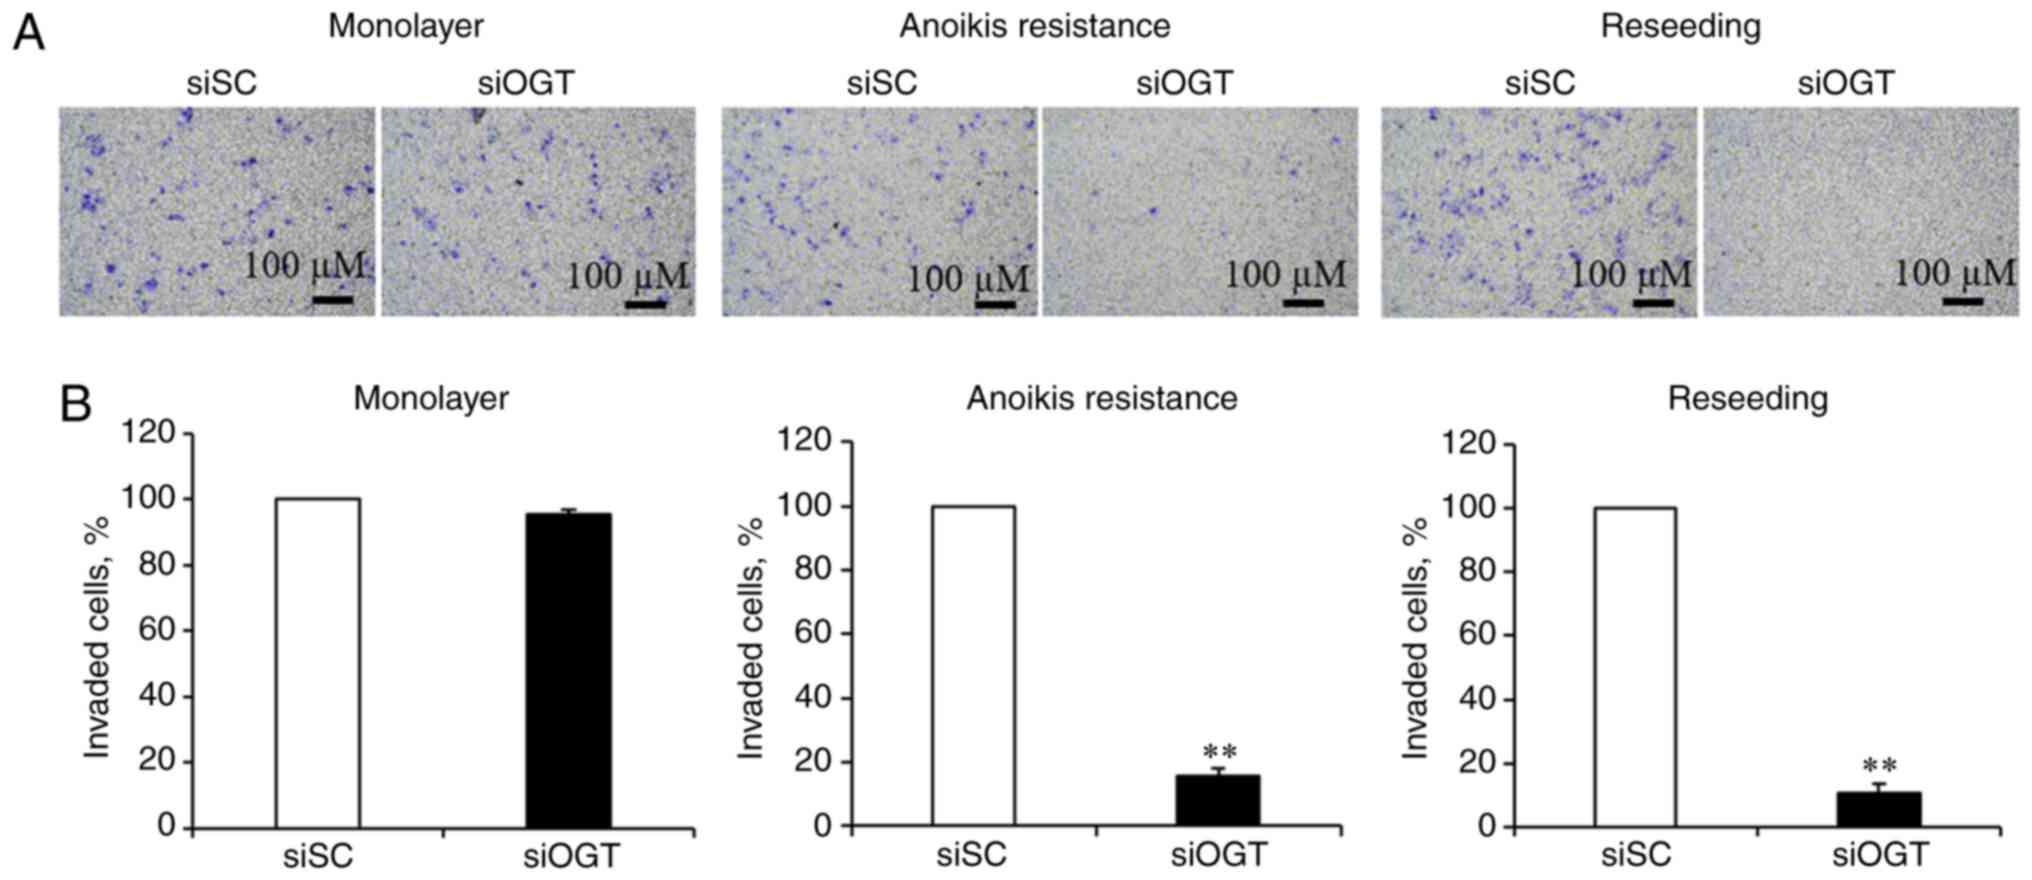
To determine whether decreasing
O-GlcNAcylation levels affected invasion of MCF-7 cells, an
in vitro cell invasion assay was performed using Boyden
chambers. As revealed in Fig. 2A,
reducing O-GlcNAcylation levels had no significant effect on
the invasiveness of cells in the cultured monolayer conditions, and
significantly inhibited invasion of the anoikis resistant and
reseeding conditions (Fig. 2A).
Transient OGT knockdown resulted in a significant decrease of
invasion in the anoikis resistant (>80%) and reseeding
conditions (>90%), respectively, compared with the siSC
(Fig. 2B). These data suggest that
aberrant OGT and O-GlcNAc levels may contribute to cancer
invasion, under anoikis resistant and reseeding conditions.
Furthermore, to clarify whether the effects of OGT and
O-GlcNAcylation on MCF-7 breast cancer cells was associated
with EMT, the expression of EMT markers including E-cadherin,
N-cadherin and β-catenin were assessed. However, there was no
significant difference in the expression of EMT-associated proteins
between the siSC and siOGT knockdown cells in all culture
conditions (Fig. S1). Therefore,
OGT does not appear to regulate EMT.
Knockdown of OGT alters global protein
expression in the anoikis resistant and reseeding conditions
To examine differential protein expression in
response to decreasing O-GlcNAcylation levels under
different culture conditions, label-free quantitative proteomics
coupled with LC-MS/MS analysis was used. A total of 317
differentially expressed proteins were identified and compared
between the 6 sample groups (siOGT vs. siSC treated cells in
monolayer, anoikis resistant and reseeding conditions), but only
162 proteins had a fold-change in expression >1.5 in the siOGT
compared with the siSC treated cells. The protein fold change of
each condition is represented by the ratio of protein levels in the
siOGT relative to siSC (upregulation, +) or siSC relative to siOGT
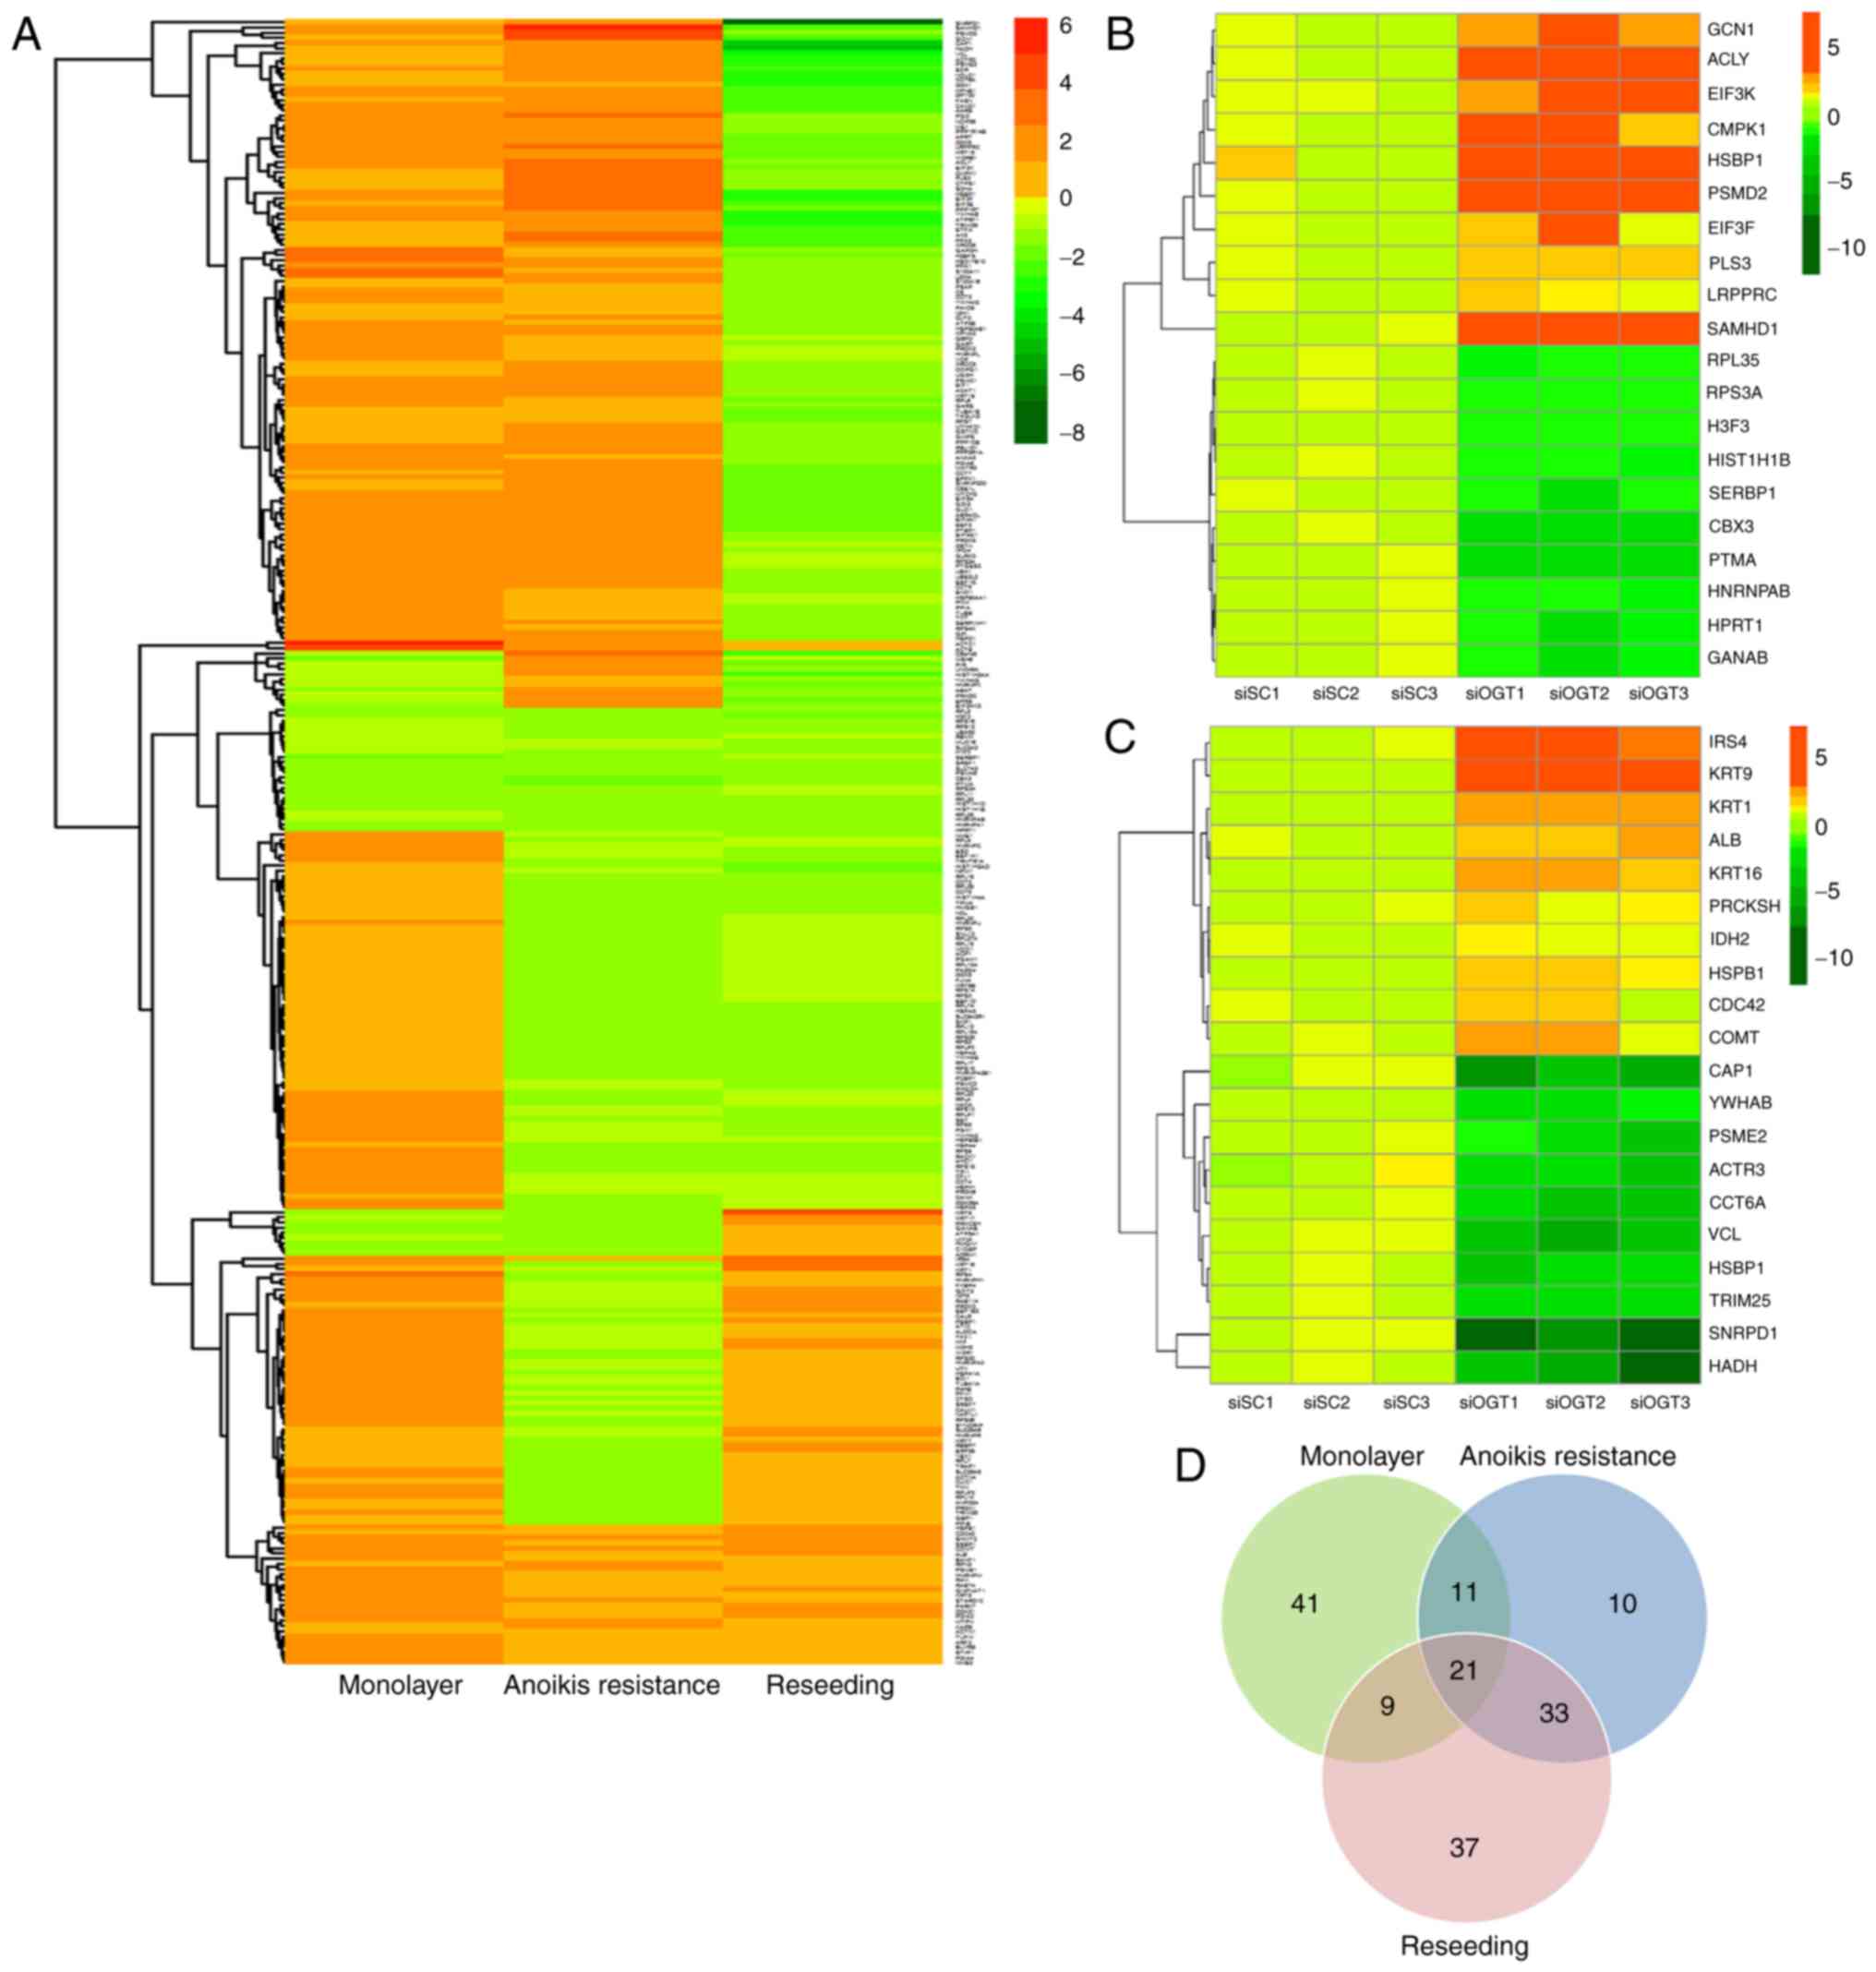
(downregulation, -). As indicated in Fig. 3A, heat map data revealed that there
was a trend in changes in protein expression reflecting the
particular culture conditions. The results revealed OGT silencing
markedly altered cell biological effects only in the anoikis
resistant and reseeding conditions. A heat map of the top 20
proteins (10 upregulated and 10 downregulated) differentially
expressed in anoikis resistant and reseeding conditions was
generated (Fig. 3B and C,
respectively). The two heat maps represent the protein expression
levels of individual samples (in triplicate) between the siSC and
siOGT cells. According to the heat map analysis, a notable decrease
in the expression of specific proteins in the reseeding condition
was observed. Using a threshold of >1.5-fold change in
expression levels between siOGT and siSC treated cells, there were
78 upregulated and 1 downregulated protein in the mono-layer
condition, 67 upregulated and 5 downregulated proteins in the
anoikis resistant condition and 13 upregulated and 85 downregulated
proteins in the reseeding condition. A total of 162 unique proteins
exhibited >1.5 fold difference in expression levels between
siOGT and siSC transfected cells in ≥1 culture condition (Table I). Notably, the changes in the
expression of certain proteins were consistent with regards to up-
or down-regulation, whereas other proteins exhibited
culture-specific expression changes. The data were re-analyzed and
presented in a Venn diagram in order to display the unique number
of proteins affected in each condition (Fig. 3D). As only anoikis resistant and
reseeding conditions exhibited significant changes in biological
effects following OGT knockdown, a focus was placed on
differentially expressed proteins in these two conditions. The Venn
diagram demonstrated 21 and 46 proteins expressed predominantly in
anoikis resistant and reseeding conditions, respectively, and 54
unique proteins were differentially expressed in ≥1 of the culture
conditions.
 | Table ILists of proteins that showed
increase or decrease their protein expression levels with the
changes of more than 1.5 fold between siOGT versus siSC treated
cells at least in one of three culture conditions. |
Table I
Lists of proteins that showed
increase or decrease their protein expression levels with the
changes of more than 1.5 fold between siOGT versus siSC treated
cells at least in one of three culture conditions.
| Protein name | Protein
accession | Relative protein
expression levels
| ANOVA P-value | Protein score | Identified
peptides |
|---|
| Monolayer | Anoikis
resistance | Reseeding |
|---|
| | si SC | si OGT | Ratio | si SC | si OGT | Ratio | si SC | si OGT | Ratio | | | |
| 14-3-3 protein
beta/alpha | 1433B_HUMAN | 2.50 | 3.64 | 1.5 | 1.08 | 2.31 | 2.2 | 2.90 | 1.00 | −2.9 |
1.52×10⁻⁵ | 573 | 8 |
| 14-3-3 protein
gamma | 1433G_HUMAN | 2.18 | 2.08 | −1.1 | 1.00 | 1.11 | 1.1 | 1.80 | 1.12 | −1.6 |
3.31×10⁻³ | 233 | 4 |
| 26S protease
regulatory subunit 4 | PRS4_HUMAN | 1.19 | 1.99 | 1.7 | 1.00 | 1.72 | 1.7 | 2.06 | 1.35 | −1.5 |
5.43×10⁻³ | 41 | 1 |
| 26S proteasome
non-ATPase regulatory subunit 2 | PSMD2_HUMAN | 1.87 | 3.61 | 1.9 | 1.00 | 4.19 | 4.2 | 2.95 | 2.34 | −1.3 |
1.73×10⁻⁵ | 42 | 1 |
| 3-hydroxyacyl-CoA
dehydrogenase type-2 | HCD2_HUMAN | 1.00 | 2.60 | 2.6 | 1.01 | 2.00 | 2.0 | 2.05 | 1.46 | −1.4 |
7.43×10⁻⁴ | 109 | 2 |
| 40S ribosomal
protein S24 | RS24_HUMAN | 1.00 | 1.61 | 1.6 | 1.30 | 1.64 | 1.3 | 1.57 | 1.44 | −1.1 |
3.35×10⁻⁴ | 78 | 1 |
| 40S ribosomal
protein S4, X isoform | RS4X_HUMAN | 1.00 | 1.95 | 1.9 | 1.51 | 1.79 | 1.2 | 1.71 | 1.31 | −1.3 |
9.53×10⁻⁸ | 181 | 3 |
| 40S ribosomal
protein S7 | RS7_HUMAN | 1.26 | 1.47 | 1.2 | 1.25 | 1.43 | 1.1 | 1.67 | 1.00 | −1.7 |
4.47×10⁻² | 197 | 3 |
| 40S ribosomal
protein SA | RSSA_HUMAN | 1.00 | 2.54 | 2.5 | 2.08 | 1.72 | −1.2 | 1.89 | 1.89 | 1.0 |
7.79×10⁻⁶ | 49 | 1 |
| 4-aminobutyrate
aminotransferase, mitochondrial | GABT_HUMAN | 3.56 | 2.65 | −1.3 | 1.00 | 1.63 | 1.6 | 2.62 | 1.84 | −1.4 |
1.05×10⁻² | 148 | 2 |
| 60 kDa heat shock
protein, mitochondrial | CH60_HUMAN | 1.89 | 3.23 | 1.7 | 1.00 | 2.65 | 2.6 | 2.12 | 1.32 | −1.6 |
1.71×10⁻⁹ | 1,439 | 18 |
| 60S ribosomal
protein L5 | RL5_HUMAN | 1.13 | 2.26 | 2.0 | 1.00 | 1.38 | 1.4 | 1.86 | 1.34 | −1.4 |
6.69×10⁻⁵ | 103 | 1 |
| 60S ribosomal
protein L6 | RL6_HUMAN | 1.00 | 1.65 | 1.7 | 2.34 | 1.97 | −1.2 | 2.05 | 2.02 | 1.0 |
3.02×10⁻³ | 220 | 3 |
| 60S ribosomal
protein L8 | RL8_HUMAN | 1.27 | 1.60 | 1.3 | 1.65 | 1.77 | 1.1 | 1.87 | 1.00 | −1.9 |
5.90×10⁻³ | 62 | 1 |
| 6-phosphogluconate
dehydrogenase, decarboxylating | 6PGD_HUMAN | 1.65 | 1.50 | −1.1 | 1.80 | 1.64 | −1.1 | 1.57 | 1.00 | −1.6 |
7.27×10⁻⁴ | 138 | 3 |
| Acetyl-CoA
acetyltransferase, mitochondrial | THIL_HUMAN | 1.21 | 1.62 | 1.3 | 1.00 | 1.58 | 1.6 | 1.77 | 1.15 | −1.5 |
2.29×10⁻² | 84 | 1 |
| Actin, alpha
cardiac muscle 1 | ACTC_HUMAN | 1.00 | 5.92 | 5.9 | 1.88 | 2.57 | 1.4 | 2.59 | 2.60 | 1.0 |
1.11×10⁻¹¹ | 711 | 9 |
| Actin, cytoplasmic
1 | ACTB_HUMAN | 1.00 | 4.89 | 4.9 | 1.44 | 1.99 | 1.4 | 2.09 | 2.30 | 1.1 |
1.76×10⁻⁵ | 1,290 | 15 |
| Actin-related
protein 3 | ARP3_HUMAN | 2.43 | 2.74 | 1.1 | 1.04 | 1.52 | 1.5 | 2.92 | 1.00 | −2.9 |
1.02×10⁻³ | 62 | 1 |
| Adenine
phosphoribosyltransferase | APT_HUMAN | 1.50 | 2.62 | 1.7 | 1.00 | 2.33 | 2.3 | 2.10 | 1.14 | −1.8 |
9.79×10⁻⁶ | 266 | 3 |
| Adenylate kinase 2,
mitochondrial | KAD2_HUMAN | 4.10 | 4.20 | 1.0 | 1.00 | 2.64 | 2.6 | 5.79 | 2.22 | −2.6 |
1.27×10⁻⁵ | 36 | 1 |
| Adenylyl
cyclase-associated protein 1 | CAP1_HUMAN | 3.30 | 4.26 | 1.3 | 1.96 | 3.87 | 2.0 | 4.73 | 1.00 | −4.7 |
2.97×10⁻⁴ | 61 | 1 |
| Alanine-tRNA
ligase, cytoplasmic | SYAC_HUMAN | 1.33 | 1.82 | 1.4 | 1.29 | 1.83 | 1.4 | 2.31 | 1.00 | −2.3 |
3.69×10⁻⁵ | 263 | 4 |
| Alpha-enolase | ENOA_HUMAN | 1.00 | 1.78 | 1.8 | 1.28 | 1.51 | 1.2 | 1.33 | 1.20 | −1.1 |
4.48×10⁻¹⁰ | 1,225 | 13 |
| Annexin A5 | ANXA5_HUMAN | 1.14 | 1.53 | 1.3 | 1.31 | 1.60 | 1.2 | 1.53 | 1.00 | −1.5 |
4.14×10⁻³ | 228 | 3 |
| Aspartate
aminotransferase, mitochondrial | AATM_HUMAN | 1.00 | 1.80 | 1.8 | 1.63 | 1.56 | 1.0 | 1.55 | 2.64 | 1.7 |
1.56×10⁻⁷ | 137 | 2 |
| ATP synthase F(0)
complex subunit B1, mitochondrial | AT5F1_HUMAN | 2.52 | 4.08 | 1.6 | 1.00 | 2.42 | 2.4 | 3.86 | 1.42 | −2.7 |
2.23×10⁻⁵ | 44 | 1 |
| ATP-citrate
synthase | ACLY_HUMAN | 2.07 | 3.19 | 1.5 | 1.00 | 3.28 | 3.3 | 2.75 | 2.15 | −1.3 |
5.46×10⁻³ | 110 | 2 |
| ATP-dependent RNA
helicase A | DHX9_HUMAN | 2.33 | 3.73 | 1.6 | 1.00 | 2.29 | 2.3 | 3.09 | 1.73 | −1.8 |
3.24×10⁻³ | 356 | 5 |
| ATP-dependent RNA
helicase DDX1 | DDX1_HUMAN | 2.28 | 2.34 | 1.0 | 1.33 | 1.44 | 1.1 | 2.80 | 1.00 | −2.8 |
7.68×10⁻³ | 45 | 1 |
|
Barrier-to-autointegration factor | BAF_HUMAN | 1.00 | 2.34 | 2.3 | 2.23 | 2.72 | 1.2 | 1.64 | 1.91 | 1.2 |
1.90×10⁻² | 78 | 1 |
| Bifunctional
glutamate/proline-RNA ligase | SYEP_HUMAN | 1.23 | 1.22 | 1.0 | 1.00 | 1.42 | 1.4 | 1.71 | 1.03 | −1.7 |
3.87×10⁻⁴ | 146 | 3 |
| Bifunctional purine
biosynthesis protein PURH | PUR9_HUMAN | 1.00 | 1.53 | 1.5 | 1.70 | 1.56 | −1.1 | 1.41 | 1.75 | 1.2 |
3.82×10⁻⁵ | 43 | 1 |
|
C-1-tetrahydrofolate synthase,
cytoplasmic | C1TC_HUMAN | 1.00 | 1.23 | 1.2 | 1.16 | 1.56 | 1.3 | 1.54 | 1.00 | −1.5 |
1.31×10⁻⁵ | 163 | 4 |
| Calmodulin | CALM_HUMAN | 1.00 | 1.59 | 1.6 | 2.11 | 1.77 | −1.2 | 1.60 | 1.63 | 1.0 |
1.36×10⁻⁴ | 43 | 1 |
| Calreticulin | CALX_HUMAN | 1.00 | 1.56 | 1.6 | 1.63 | 1.57 | 1.0 | 1.73 | 2.16 | 1.3 |
1.66×10⁻⁷ | 208 | 3 |
| Catechol
O-methyltransferase | COMT_HUMAN | 1.00 | 1.57 | 1.6 | 1.17 | 2.07 | 1.8 | 1.23 | 2.58 | 2.1 |
8.50×10⁻⁴ | 138 | 2 |
| Cathepsin D | CATD_HUMAN | 1.00 | 1.60 | 1.6 | 1.28 | 1.16 | −1.1 | 1.24 | 1.44 | 1.2 |
3.04×10⁻⁶ | 283 | 5 |
| Cell division
control protein 42 homolog | CDC42_HUMAN | 1.00 | 1.20 | 1.2 | 1.09 | 1.30 | 1.2 | 1.18 | 2.09 | 1.8 |
3.85×10⁻³ | 100 | 2 |
| Chromobox protein
homolog 3 | CBX3_HUMAN | 1.68 | 1.45 | −1.2 | 2.20 | 1.28 | −1.7 | 1.40 | 1.00 | −1.4 |
6.12×10⁻³ | 98 | 2 |
| Coatomer subunit
gamma-1 | COPG1_HUMAN | 1.89 | 2.24 | 1.2 | 1.00 | 1.94 | 1.9 | 2.37 | 1.48 | −1.6 |
1.91×10⁻³ | 185 | 3 |
| Costars family
protein ABRACL | ABRAL_HUMAN | 1.30 | 2.00 | 1.5 | 1.08 | 1.91 | 1.8 | 1.72 | 1.00 | −1.7 |
8.85×10⁻³ | 65 | 1 |
| CTP synthase 1 | PYRG1_HUMAN | 2.17 | 2.29 | 1.1 | 1.00 | 2.54 | 2.5 | 2.64 | 1.68 | −1.6 |
4.27×10⁻³ | 60 | 1 |
| Cullin-associated
NEDD8-dissociated protein 1 | CAND1_HUMAN | 1.31 | 1.66 | 1.3 | 1.06 | 1.63 | 1.5 | 2.27 | 1.00 | −2.3 |
1.48×10⁻³ | 207 | 4 |
| Deoxynucleoside
triphosphate triphosphohydrolase SAMHD1 | SAMH1_HUMAN | 8.52 | 11.90 | 1.4 | 1.00 | 6.12 | 6.1 | 14.69 | 5.63 | −2.6 |
1.34×10⁻⁶ | 41 | 1 |
| Destrin | DEST_HUMAN | 1.00 | 1.71 | 1.7 | 1.13 | 2.01 | 1.8 | 1.36 | 1.31 | 1.0 |
4.67×10⁻⁵ | 171 | 3 |
| DNA mismatch repair
protein Msh6 | MSH6_HUMAN | 2.87 | 1.71 | −1.7 | 1.00 | 1.80 | 1.8 | 1.96 | 1.92 | 1.0 |
1.10×10⁻³ | 41 | 1 |
| DNA-dependent
protein kinase catalytic subunit | PRKDC_HUMAN | 3.31 | 3.26 | 1.0 | 1.00 | 1.59 | 1.6 | 2.28 | 1.54 | −1.5 |
2.52×10⁻³ | 212 | 5 |
|
Dolichyl-diphosphooligosaccharide-protein
glycosyltransferase subunit 2 | RPN2_HUMAN | 1.37 | 1.64 | 1.2 | 1.00 | 1.79 | 1.8 | 1.70 | 1.76 | 1.0 |
1.12×10⁻³ | 71 | 1 |
| E3 ubiquitin/ISG15
ligase TRIM25 | TRI25_HUMAN | 2.83 | 2.91 | 1.0 | 1.00 | 2.37 | 2.4 | 3.70 | 1.28 | −2.9 |
1.39×10⁻⁷ | 62 | 1 |
| eIF-2-alpha kinase
activator GCN1 | GCN1_HUMAN | 3.37 | 3.90 | 1.2 | 1.00 | 4.02 | 4.0 | 4.42 | 1.92 | −2.3 |
1.17×10⁻⁴ | 109 | 3 |
| Electron transfer
flavoprotein | | | | | | | | | | | | | |
| subunit alpha,
mitochondrial | ETFA_HUMAN | 2.32 | 2.75 | 1.2 | 1.00 | 2.18 | 2.2 | 3.72 | 1.41 | −2.6 |
1.93×10⁻³ | 237 | 4 |
| Elongation factor
1-alpha 1 | EF1A1_HUMAN | 1.00 | 1.70 | 1.7 | 1.67 | 1.61 | 1.0 | 1.52 | 1.08 | −1.4 |
1.18×10⁻⁸ | 1,010 | 13 |
| Elongation factor
2 | EF2_HUMAN | 1.24 | 2.26 | 1.8 | 1.22 | 1.90 | 1.6 | 1.93 | 1.00 | −1.9 |
1.80×10⁻⁹ | 1,447 | 23 |
| Epiplakin | EPIPL_HUMAN | 1.87 | 2.56 | 1.4 | 1.00 | 1.67 | 1.7 | 2.78 | 1.41 | −2.0 |
4.01×10⁻⁴ | 444 | 9 |
| Ezrin | EZRI_HUMAN | 2.21 | 2.88 | 1.3 | 1.00 | 1.77 | 1.8 | 3.38 | 1.27 | −2.7 |
5.41×10⁻³ | 283 | 4 |
| Eukaryotic
initiation factor 4A-I | IF4A1_HUMAN | 1.40 | 2.36 | 1.7 | 1.00 | 1.83 | 1.8 | 1.80 | 1.06 | −1.7 |
2.85×10⁻⁴ | 148 | 2 |
| Eukaryotic
translation initiation factor 1 | EIF1_HUMAN | 1.20 | 1.72 | 1.4 | 1.00 | 1.67 | 1.7 | 1.84 | 1.19 | −1.5 |
1.48×10⁻³ | 90 | 1 |
| Eukaryotic
translation initiation factor 3 subunit E | EIF3E_HUMAN | 2.79 | 3.25 | 1.2 | 1.00 | 2.61 | 2.6 | 3.05 | 1.38 | −2.2 |
3.06×10⁻⁵ | 44 | 1 |
| Eukaryotic
translation initiation factor 3 subunit F | EIF3F_HUMAN | 2.29 | 3.32 | 1.5 | 1.00 | 2.82 | 2.8 | 2.91 | 1.07 | −2.7 |
3.97×10⁻³ | 122 | 1 |
| Eukaryotic
translation initiation factor 3 subunit K | EIF3K_HUMAN | 2.50 | 4.31 | 1.7 | 1.00 | 3.23 | 3.2 | 4.43 | 2.45 | −1.8 |
1.05×10⁻⁶ | 48 | 1 |
| Eukaryotic
translation initiation factor 4 gamma 1 | IF4G1_HUMAN | 1.00 | 2.09 | 2.1 | 1.18 | 2.19 | 1.9 | 1.78 | 1.34 | −1.3 |
1.84×10⁻³ | 129 | 3 |
| Eukaryotic
translation initiation factor 5A-1 | IF5A1_HUMAN | 1.12 | 2.32 | 2.1 | 1.51 | 1.94 | 1.3 | 1.69 | 1.00 | −1.7 |
1.85×10⁻⁴ | 240 | 4 |
| Exportin-2 | XPO2_HUMAN | 1.80 | 2.06 | 1.1 | 1.00 | 1.79 | 1.8 | 1.90 | 1.01 | −1.9 |
1.60×10⁻³ | 111 | 2 |
| Fatty acid
synthase | FAS_HUMAN | 1.96 | 2.39 | 1.2 | 1.89 | 2.50 | 1.3 | 2.57 | 1.00 | −2.6 |
2.03×10⁻⁷ | 1,031 | 16 |
|
Fructose-bisphosphate aldolase A | ALDOA_HUMAN | 1.00 | 1.52 | 1.5 | 1.78 | 1.62 | −1.1 | 1.30 | 1.58 | 1.2 |
3.38×10⁻⁸ | 1,003 | 16 |
| Glucosamine
6-phosphate N-acetyltransferase | GNA1_HUMAN | 1.00 | 1.75 | 1.7 | 1.55 | 1.66 | 1.1 | 1.40 | 1.85 | 1.3 |
7.32×10⁻³ | 53 | 1 |
| Glucose-6-phosphate
isomerase | G6PI_HUMAN | 1.06 | 2.04 | 1.9 | 1.21 | 1.55 | 1.3 | 1.51 | 1.00 | −1.5 |
4.33×10⁻⁵ | 400 | 4 |
| Glucosidase 2
subunit beta | GLU2B_HUMAN | 1.73 | 1.20 | −1.4 | 1.35 | 1.00 | −1.4 | 1.35 | 2.08 | 1.5 |
1.70×10⁻³ | 51 | 1 |
| Glutaredoxin-3 | GLRX3_HUMAN | 1.00 | 1.51 | 1.5 | 1.08 | 1.53 | 1.4 | 1.40 | 1.33 | −1.1 |
1.16×10⁻³ | 46 | 1 |
| Glutathione
S-transferase Mu 3 | GSTM3_HUMAN | 1.30 | 1.58 | 1.2 | 1.35 | 1.80 | 1.3 | 1.60 | 1.00 | −1.6 |
3.53×10⁻⁴ | 213 | 4 |
|
Glyceraldehyde-3-phosphate
dehydrogenase | G3P_HUMAN | 1.00 | 3.15 | 3.1 | 1.64 | 2.02 | 1.2 | 1.81 | 1.46 | −1.2 |
4.81×10⁻¹⁰ | 771 | 7 |
| Glycine--tRNA
ligase | SYG_HUMAN | 1.10 | 1.42 | 1.3 | 1.20 | 1.23 | 1.0 | 1.55 | 1.00 | −1.6 |
1.08×10⁻³ | 48 | 1 |
| GMP synthase
[glutamine-hydrolyzing] | GUAA_HUMAN | 1.00 | 1.11 | 1.1 | 1.07 | 1.51 | 1.4 | 1.80 | 1.13 | −1.6 |
2.83×10⁻³ | 45 | 1 |
| GTP-binding nuclear
protein Ran | RAN_HUMAN | 1.00 | 1.67 | 1.7 | 1.88 | 1.89 | 1.0 | 1.50 | 1.66 | 1.1 |
1.57×10⁻³ | 57 | 1 |
| Heat shock
factor-binding protein 1 | HSBP1_HUMAN | 3.19 | 6.79 | 2.1 | 1.00 | 3.58 | 3.6 | 4.54 | 1.48 | −3.1 |
1.07×10⁻⁶ | 59 | 1 |
| Heat shock protein
beta-1 | HSPB1_HUMAN | 1.00 | 1.83 | 1.8 | 1.81 | 2.18 | 1.2 | 1.52 | 2.51 | 1.6 |
1.82×10⁻¹⁰ | 370 | 6 |
| Heat shock protein
HSP 90-alpha | HS90A_HUMAN | 1.00 | 1.85 | 1.9 | 1.42 | 1.63 | 1.1 | 1.32 | 1.25 | −1.1 |
2.10×10⁻⁹ | 1,505 | 22 |
| Heterogeneous
nuclear ribonucleoproteins C1/C2 | HNRPC_HUMAN | 1.00 | 1.55 | 1.5 | 1.72 | 1.69 | 1.0 | 1.72 | 1.70 | 1.0 |
3.08×10⁻⁹ | 249 | 3 |
| Heterogeneous
nuclear ribonucleoprotein H | HNRH1_HUMAN | 1.00 | 1.77 | 1.8 | 1.84 | 1.60 | −1.2 | 1.79 | 1.93 | 1.1 |
7.75×10⁻⁶ | 195 | 3 |
| Heterogeneous
nuclear ribonucleoprotein K | HNRPK_HUMAN | 1.48 | 1.44 | 1.0 | 1.17 | 1.39 | 1.2 | 1.83 | 1.00 | −1.8 |
3.86×10⁻⁵ | 454 | 6 |
| Histone H2A type
1-A | H2A1A_HUMAN | 1.79 | 1.76 | 1.0 | 1.29 | 1.79 | 1.4 | 2.49 | 1.00 | −2.5 |
1.36×10⁻³ | 272 | 3 |
| Histone H2A type
1-D | H2A1D_HUMAN | 1.24 | 1.26 | 1.0 | 1.85 | 1.42 | −1.3 | 2.12 | 1.00 | −2.1 |
1.05×10⁻³ | 285 | 3 |
| Histone H2B type
F-S | H2BFS_HUMAN | 1.00 | 3.42 | 3.4 | 1.29 | 1.49 | 1.2 | 1.81 | 1.07 | −1.7 |
1.20×10⁻⁶ | 305 | 5 |
| Histone H3 | H3_HUMAN | 1.52 | 1.23 | −1.2 | 1.94 | 1.35 | −1.4 | 1.78 | 1.00 | −1.8 |
7.41×10⁻⁷ | 226 | 12 |
| Histone H4 | H4_HUMAN | 1.00 | 1.22 | 1.2 | 1.42 | 1.16 | −1.2 | 1.53 | 1.02 | −1.5 |
6.19×10⁻⁸ | 473 | 6 |
|
Hydroxyacyl-coenzyme A dehydrogenase,
mitochondrial | HCDH_HUMAN | 4.44 | 5.04 | 1.1 | 1.00 | 2.45 | 2.4 | 5.43 | 1.10 | −4.9 |
1.09×10⁻³ | 175.8 | 1 |
|
Hypoxanthine-guanine
phosphoribosyltransferase | HPRT_HUMAN | 1.00 | 1.20 | 1.2 | 1.56 | 1.39 | −1.1 | 1.31 | 1.68 | 1.3 |
5.20×10⁻⁵ | 70.8 | 3 |
| Importin-4 | IPO4_HUMAN | 1.30 | 1.00 | −1.3 | 1.99 | 1.29 | −1.5 | 1.72 | 1.27 | −1.4 |
7.64×10⁻⁴ | 98 | 2 |
| Importin subunit
beta-1 | IMB1_HUMAN | 1.72 | 2.49 | 1.4 | 1.50 | 2.04 | 1.4 | 2.65 | 1.00 | −2.7 |
1.35×10⁻³ | 40 | 3 |
| Inorganic
pyrophosphatase | IPYR_HUMAN | 1.00 | 2.48 | 2.5 | 1.46 | 2.21 | 1.5 | 1.94 | 1.47 | −1.3 |
2.62×10⁻⁴ | 106 | 2 |
| Insulin receptor
substrate 4 | IRS4_HUMAN | 1.00 | 1.85 | 1.8 | 2.49 | 2.91 | 1.2 | 1.76 | 5.76 | 3.3 |
1.11×10⁻¹¹ | 41 | 1 |
| Interferon-induced,
double-stranded RNA-activated protein kinase | E2AK2_HUMAN | 1.56 | 1.39 | −1.1 | 1.03 | 1.48 | 1.4 | 1.63 | 1.00 | −1.6 |
2.64×10⁻³ | 52 | 1 |
| Isocitrate
dehydrogenase [NADP], mitochondrial | IDHC_HUMAN | 1.00 | 1.37 | 1.4 | 1.50 | 1.40 | −1.1 | 1.52 | 2.46 | 1.6 |
4.05×10⁻¹⁰ | 851 | 3 |
| Keratin, type I
cytoskeletal 16 | K1C16_HUMAN | 1.00 | 1.46 | 1.5 | 1.58 | 1.38 | −1.2 | 1.50 | 4.81 | 3.2 |
9.90×10⁻⁸ | 483 | 8 |
| Keratin, type I
cytoskeletal 18 | K1C18_HUMAN | 1.68 | 3.65 | 2.2 | 1.00 | 2.15 | 2.1 | 3.47 | 1.94 | −1.8 |
2.95×10⁻⁹ | 1,518 | 20 |
| Keratin, type I
cytoskeletal 19 | K1C19_HUMAN | 1.48 | 1.94 | 1.3 | 1.00 | 1.67 | 1.7 | 2.11 | 1.39 | −1.5 |
1.34×10⁻⁵ | 1,250 | 18 |
| Keratin, type I
cytoskeletal 9 | K1C9_HUMAN | 1.27 | 1.00 | −1.3 | 1.33 | 1.07 | −1.3 | 1.15 | 4.79 | 4.2 |
1.41×10⁻⁹ | 388 | 3 |
| Keratin, type II
cytoskeletal 1 | K2C1_HUMAN | 1.00 | 1.06 | 1.1 | 1.25 | 1.18 | −1.1 | 1.07 | 3.17 | 3.0 |
3.37×10⁻¹¹ | 1,031 | 14 |
| Keratin, type II
cytoskeletal 8 | K2C8_HUMAN | 1.00 | 1.90 | 1.9 | 1.10 | 1.16 | 1.1 | 1.83 | 1.92 | 1.0 |
3.85×10⁻¹³ | 2,284 | 28 |
| Lactoylglutathione
lyase | LGUL_HUMAN | 1.30 | 2.13 | 1.6 | 1.26 | 2.41 | 1.9 | 1.86 | 1.00 | −1.9 |
7.22×10⁻³ | 65 | 1 |
| Leucine-rich PPR
motif-containing protein, mitochondrial | LPPRC_HUMAN | 1.98 | 3.96 | 2.0 | 1.00 | 2.75 | 2.7 | 2.69 | 1.47 | −1.8 |
6.38×10⁻³ | 339 | 6 |
| L-lactate
dehydrogenase A chain | LDHA_HUMAN | 1.00 | 2.73 | 2.7 | 1.38 | 1.73 | 1.3 | 1.44 | 1.18 | −1.2 |
5.11×10⁻⁹ | 684 | 10 |
| Matrin-3 | MATR3_HUMAN | 1.32 | 1.70 | 1.3 | 1.17 | 1.60 | 1.4 | 2.11 | 1.00 | −2.1 |
1.85×10⁻³ | 85 | 2 |
| Mitochondrial
carrier homolog 2 | MTCH2_HUMAN | 2.45 | 3.09 | 1.3 | 1.00 | 1.77 | 1.8 | 2.96 | 1.55 | −1.9 |
2.27×10⁻³ | 42 | 1 |
| NADP-dependent
malic enzyme | MAOX_HUMAN | 3.16 | 4.83 | 1.5 | 1.00 | 2.20 | 2.2 | 2.33 | 1.54 | −1.5 |
6.65×10⁻⁴ | 133 | 3 |
| Neutral
alpha-glucosidase AB | GANAB_HUMAN | 1.47 | 1.18 | −1.2 | 1.61 | 1.00 | −1.6 | 1.51 | 1.58 | 1.0 |
2.56×10⁻³ | 130 | 1 |
| Nucleolar and
coiled-body phosphoprotein 1 | NOLC1_HUMAN | 2.25 | 2.70 | 1.2 | 1.00 | 1.91 | 1.9 | 3.49 | 1.21 | −2.9 |
1.70×10⁻⁵ | 255 | 1 |
| Nucleolar protein
58 | NOP58_HUMAN | 1.66 | 2.93 | 1.8 | 1.00 | 2.47 | 2.5 | 2.66 | 1.95 | −1.4 |
1.69×10⁻³ | 56 | 1 |
| Nucleophosmin | NPM_HUMAN | 1.01 | 1.20 | 1.2 | 1.19 | 1.12 | −1.1 | 1.70 | 1.00 | −1.7 |
3.97×10⁻⁵ | 450 | 4 |
| Nucleoside
diphosphate kinase A | NP1L1_HUMAN | 1.00 | 2.18 | 2.2 | 1.68 | 1.58 | −1.1 | 1.78 | 1.44 | −1.2 |
8.69×10⁻⁵ | 313 | 2 |
| PCTP-like
protein | PCTL_HUMAN | 1.00 | 1.89 | 1.9 | 1.53 | 1.97 | 1.3 | 1.55 | 1.85 | 1.2 |
7.96×10⁻¹¹ | 48 | 6 |
| Peptidyl-prolyl
cis-trans isomerase A | PPIA_HUMAN | 1.00 | 1.83 | 1.8 | 1.70 | 1.71 | 1.0 | 1.56 | 1.31 | −1.2 |
8.94×10⁻¹¹ | 321 | 5 |
| Peptidyl-prolyl
cis-trans isomerase FKBP4 | FKBP4_HUMAN | 1.00 | 1.99 | 2.0 | 1.95 | 1.78 | −1.1 | 1.86 | 2.05 | 1.1 |
3.23×10⁻⁵ | 218 | 10 |
| Peroxiredoxin-5,
mitochondrial | PRDX5_HUMAN | 1.07 | 2.04 | 1.9 | 1.00 | 1.79 | 1.8 | 1.91 | 1.45 | −1.3 |
1.29×10⁻³ | 240 | 2 |
|
Phosphatidylethanolamine-binding protein
1 | PEBP1_HUMAN | 1.00 | 1.54 | 1.5 | 1.96 | 1.78 | −1.1 | 1.36 | 1.72 | 1.3 |
3.38×10⁻⁷ | 49 | 4 |
| Pirin | PIR_HUMAN | 2.58 | 2.46 | −1.1 | 1.00 | 2.30 | 2.3 | 2.38 | 1.44 | −1.7 |
4.75×10⁻⁵ | 34 | 1 |
| Plasminogen
activator inhibitor 1 RNA-binding protein | PAIRB_HUMAN | 2.27 | 1.37 | −1.7 | 1.70 | 1.21 | −1.4 | 1.09 | 1.00 | −1.1 |
7.51×10⁻³ | 42 | 3 |
| Plastin-3 | PLST_HUMAN | 2.17 | 2.65 | 1.2 | 1.00 | 2.76 | 2.8 | 2.80 | 1.71 | −1.6 |
5.86×10⁻⁴ | 270 | 2 |
| Polypyrimidine
tract-binding protein 1 | PTBP1_HUMAN | 1.40 | 2.63 | 1.9 | 1.02 | 1.86 | 1.8 | 2.11 | 1.00 | −2.1 |
6.25×10⁻⁵ | 142 | 4 |
| Profilin-1 | PROF1_HUMAN | 1.00 | 1.50 | 1.5 | 1.84 | 1.69 | −1.1 | 1.48 | 1.67 | 1.1 |
2.68×10⁻⁵ | 70 | 1 |
| Prostaglandin E
synthase 3 | TEBP_HUMAN | 1.00 | 1.66 | 1.7 | 1.48 | 1.99 | 1.3 | 1.60 | 1.48 | −1.1 |
4.15×10⁻⁶ | 130 | 1 |
| Proteasome
activator complex subunit 2 | PSME2_HUMAN | 1.39 | 1.64 | 1.2 | 1.06 | 1.71 | 1.6 | 2.94 | 1.00 | −2.9 |
4.14×10⁻³ | 41 | 4 |
| Proteasome subunit
beta type-1 | PSB1_HUMAN | 4.02 | 6.17 | 1.5 | 1.00 | 1.57 | 1.6 | 2.54 | 2.57 | 1.0 |
2.00×10⁻³ | 43 | 1 |
| Protein
disulfide-isomerase | PDIA1_HUMAN | 1.00 | 1.52 | 1.5 | 1.61 | 1.47 | −1.1 | 1.76 | 2.00 | 1.1 |
9.31×10⁻⁴ | 334 | 4 |
| Protein dpy-30
homolog | DPY30_HUMAN | 2.72 | 4.32 | 1.6 | 1.33 | 1.95 | 1.5 | 2.66 | 1.00 | −2.7 |
3.92×10⁻³ | 160 | 1 |
| Protein phosphatase
1 regulatory subunit 14B | PP14B_HUMAN | 3.32 | 4.94 | 1.5 | 1.00 | 2.22 | 2.2 | 2.54 | 1.63 | −1.6 |
6.38×10⁻⁵ | 67 | 1 |
| Protein phosphatase
1 regulatory subunit 7 | PP1R7_HUMAN | 2.03 | 2.87 | 1.4 | 1.00 | 2.70 | 2.7 | 2.99 | 1.39 | −2.1 |
1.92×10⁻⁴ | 47 | 1 |
| Protein
S100-A11 | S10AB_HUMAN | 1.00 | 2.58 | 2.6 | 1.76 | 2.19 | 1.2 | 2.24 | 1.64 | −1.4 |
9.21×10⁻⁷ | 60 | 4 |
| Protein unc-45
homolog A | UN45A_HUMAN | 4.98 | 4.88 | 1.0 | 1.00 | 2.03 | 2.0 | 3.41 | 2.44 | −1.4 |
7.43×10⁻⁵ | 200 | 1 |
| Prothymosin
alpha | PTMA_HUMAN | 1.24 | 1.00 | −1.2 | 1.81 | 1.03 | −1.8 | 1.47 | 1.32 | −1.1 |
2.79×10⁻³ | 113 | 2 |
| Pyruvate kinase
PKM | KPYM_HUMAN | 1.00 | 1.88 | 1.9 | 1.46 | 1.71 | 1.2 | 1.45 | 1.41 | 1.0 |
2.51×10⁻¹¹ | 111 | 24 |
| Rab GDP
dissociation inhibitor beta | GDIB_HUMAN | 1.10 | 2.34 | 2.1 | 1.09 | 1.62 | 1.5 | 1.73 | 1.00 | −1.7 |
2.92×10⁻⁶ | 1,781 | 4 |
| Ras-related protein
Rab-7a | RAB7A_HUMAN | 1.00 | 1.84 | 1.8 | 1.45 | 1.64 | 1.1 | 1.59 | 2.00 | 1.3 |
2.99×10⁻³ | 46 | 2 |
| Ribosomal L1
domain-containing protein 1 | RL1D1_HUMAN | 1.11 | 1.58 | 1.4 | 1.00 | 1.44 | 1.4 | 1.93 | 1.25 | −1.5 |
6.82×10⁻³ | 151 | 2 |
| Small nuclear
ribonucleoprotein Sm D1 | SMD1_HUMAN | 7.94 | 8.86 | 1.1 | 2.45 | 4.59 | 1.9 | 8.44 | 1.00 | −8.4 |
6.44×10⁻⁸ | 57 | 1 |
| Serine
hydroxymethyltransferase, mitochondrial | GLYM_HUMAN | 1.00 | 1.60 | 1.6 | 1.68 | 1.66 | −1.0 | 1.53 | 1.36 | −1.1 |
2.48×10⁻⁴ | 31 | 1 |
|
Serine/arginine-rich splicing factor
7 | SRSF7_HUMAN | 1.00 | 1.39 | 1.4 | 1.43 | 1.89 | 1.3 | 1.81 | 2.76 | 1.5 |
8.72×10⁻⁴ | 67 | 1 |
|
Serine/threonine-protein phosphatase | 2AAA_HUMAN | 1.00 | 1.59 | 1.6 | 1.54 | 1.51 | 1.0 | 1.53 | 1.75 | 1.1 |
8.57×10⁻³ | 290 | 6 |
| 2A 65 kDa
regulatory subunit A alpha isoform | | | | | | | | | | | | | |
|
Serine/threonine-protein phosphatase
PP1-beta catalytic subunit | PP1B_HUMAN | 1.14 | 1.53 | 1.3 | 1.04 | 1.48 | 1.4 | 1.57 | 1.00 | −1.6 |
1.09×10⁻⁸ | 187 | 3 |
| Serpin H1 | SERPH_HUMAN | 1.28 | 1.41 | 1.1 | 1.00 | 1.37 | 1.4 | 1.66 | 1.10 | −1.5 |
6.96×10⁻⁹ | 290 | 4 |
| Serum albumin | ALBU_HUMAN | 1.11 | 1.90 | 1.7 | 1.00 | 1.28 | 1.3 | 1.53 | 1.08 | −1.4 |
1.26×10⁻³ | 37 | 2 |
| Single-stranded
DNA-binding protein, mitochondrial | SSBP_HUMAN | 1.00 | 1.38 | 1.4 | 1.06 | 1.21 | 1.1 | 1.46 | 2.24 | 1.5 |
2.48×10⁻⁴ | 69 | 2 |
| S-formylglutathione
hydrolase | ESTD_HUMAN | 1.00 | 1.34 | 1.3 | 1.60 | 1.79 | 1.1 | 1.19 | 2.89 | 2.4 |
2.74×10⁻⁷ | 111 | 1 |
| Succinate
dehydrogenase [ubiquinone] flavoprotein subunit, mitochondrial | SDHA_HUMAN | 2.11 | 2.55 | 1.2 | 1.00 | 2.55 | 2.5 | 2.67 | 1.85 | −1.4 |
1.34×10⁻³ | 66 | 1 |
| T-complex protein 1
subunit epsilon | TCPE_HUMAN | 1.41 | 1.75 | 1.2 | 1.15 | 1.58 | 1.4 | 1.90 | 1.00 | −1.9 |
1.88×10⁻³ | 207 | 3 |
| T-complex protein 1
subunit eta | TCPH_HUMAN | 1.05 | 1.51 | 1.4 | 1.00 | 1.52 | 1.5 | 1.34 | 1.00 | −1.3 |
6.04×10⁻³ | 232 | 3 |
| T-complex protein 1
subunit zeta | TCPZ_HUMAN | 2.44 | 2.98 | 1.2 | 1.30 | 2.31 | 1.8 | 2.89 | 1.00 | −2.9 |
4.95×10⁻⁵ | 98 | 2 |
| Transgelin-2 | TAGL2_HUMAN | 1.21 | 1.46 | 1.2 | 1.39 | 1.63 | 1.2 | 1.67 | 1.00 | −1.7 |
3.13×10⁻³ | 167 | 4 |
| Transketolase | TKT_HUMAN | 1.00 | 1.64 | 1.6 | 1.33 | 1.52 | 1.1 | 1.42 | 1.01 | −1.4 |
4.56×10⁻⁸ | 333 | 7 |
| tRNA
(adenine(58)-N(1))-methyltransferase catalytic subunit
TRMT61A | TRM61_HUMAN | 1.00 | 1.47 | 1.5 | 1.99 | 1.69 | −1.2 | 1.70 | 1.11 | −1.5 |
2.80×10⁻⁶ | 725 | 1 |
| Tubulin alpha-1B
chain | TBA1B_HUMAN | 1.12 | 1.31 | 1.2 | 1.35 | 1.46 | 1.1 | 1.66 | 1.00 | −1.7 |
3.73×10⁻³ | 873 | 12 |
| Tubulin beta
chain | TBB5_HUMAN | 1.00 | 1.80 | 1.8 | 1.71 | 1.90 | 1.1 | 1.70 | 1.36 | −1.3 |
1.00×10⁻⁴ | 999 | 16 |
| U5 small nuclear
ribonucleoprotein 200 kDa helicase | U520_HUMAN | 1.73 | 1.93 | 1.1 | 1.00 | 1.69 | 1.7 | 2.17 | 1.26 | −1.7 |
6.34×10⁻³ | 265 | 1 |
| Ubiquitin-like
modifier-activating enzyme 1 | UBA1_HUMAN | 1.06 | 1.77 | 1.7 | 1.00 | 1.50 | 1.5 | 1.39 | 1.03 | −1.3 |
1.26×10⁻⁶ | 50 | 6 |
| UDP-glucose
6-dehydrogenase | UGDH_HUMAN | 1.67 | 1.99 | 1.2 | 1.00 | 2.00 | 2.0 | 1.72 | 1.13 | −1.5 |
1.69×10⁻³ | 341 | 2 |
| UMP-CMP kinase | KCY_HUMAN | 3.36 | 3.42 | 1.0 | 1.00 | 3.09 | 3.1 | 3.57 | 2.38 | −1.5 |
1.18×10⁻³ | 97 | 1 |
| Uncharacterized
protein C8orf48 | CH048_HUMAN | 2.33 | 2.15 | −1.1 | 1.00 | 2.60 | 2.6 | 3.01 | 1.26 | −2.4 |
4.13×10⁻⁴ | 45 | 1 |
| Vinculin | VINC_HUMAN | 2.67 | 2.96 | 1.1 | 1.50 | 2.09 | 1.4 | 3.62 | 1.00 | −3.6 |
5.01×10⁻³ | 88 | 2 |
| WD
repeat-containing protein 61 | WDR61_HUMAN | 2.94 | 5.61 | 1.9 | 1.00 | 2.37 | 2.4 | 3.42 | 1.60 | −2.1 |
9.95×10⁻³ | 42 | 1 |
| X-ray repair
cross-complementing protein 5 | XRCC5_HUMAN | 2.22 | 2.73 | 1.2 | 1.00 | 2.10 | 2.1 | 1.76 | 1.22 | −1.4 |
6.63×10⁻³ | 44 | 2 |
| X-ray repair
cross-complementing protein 6 | XRCC6_HUMAN | 1.85 | 2.27 | 1.2 | 1.00 | 2.36 | 2.4 | 2.94 | 1.22 | −2.4 |
1.10×10⁻³ | 133 | 2 |
Prediction of protein-protein
interactions and roles of potential proteins in breast cancer
metastasis
The results of the present study indicate that OGT
serves pivotal roles in cell viability and invasion in MCF-7 cells
only in anoikis resistant and reseeding conditions. Thus, the
potential protein interactions were predicted using STRING. STRING
analysis was performed on the 121 proteins derived from the Venn
diagram which were only expressed in anoikis resistant and
reseeding conditions, and the proteins that were differentially
expressed only in the monolayer condition were excluded. The
protein-protein interaction networks were separated into three
groups according to their expression conditions: Proteins
differentially expressed only in the anoikis resistant condition
(21 proteins); proteins differentially expressed only in the
reseeding conditions (46 proteins); and unique proteins
differentially expressed in either anoikis resistant or reseeding
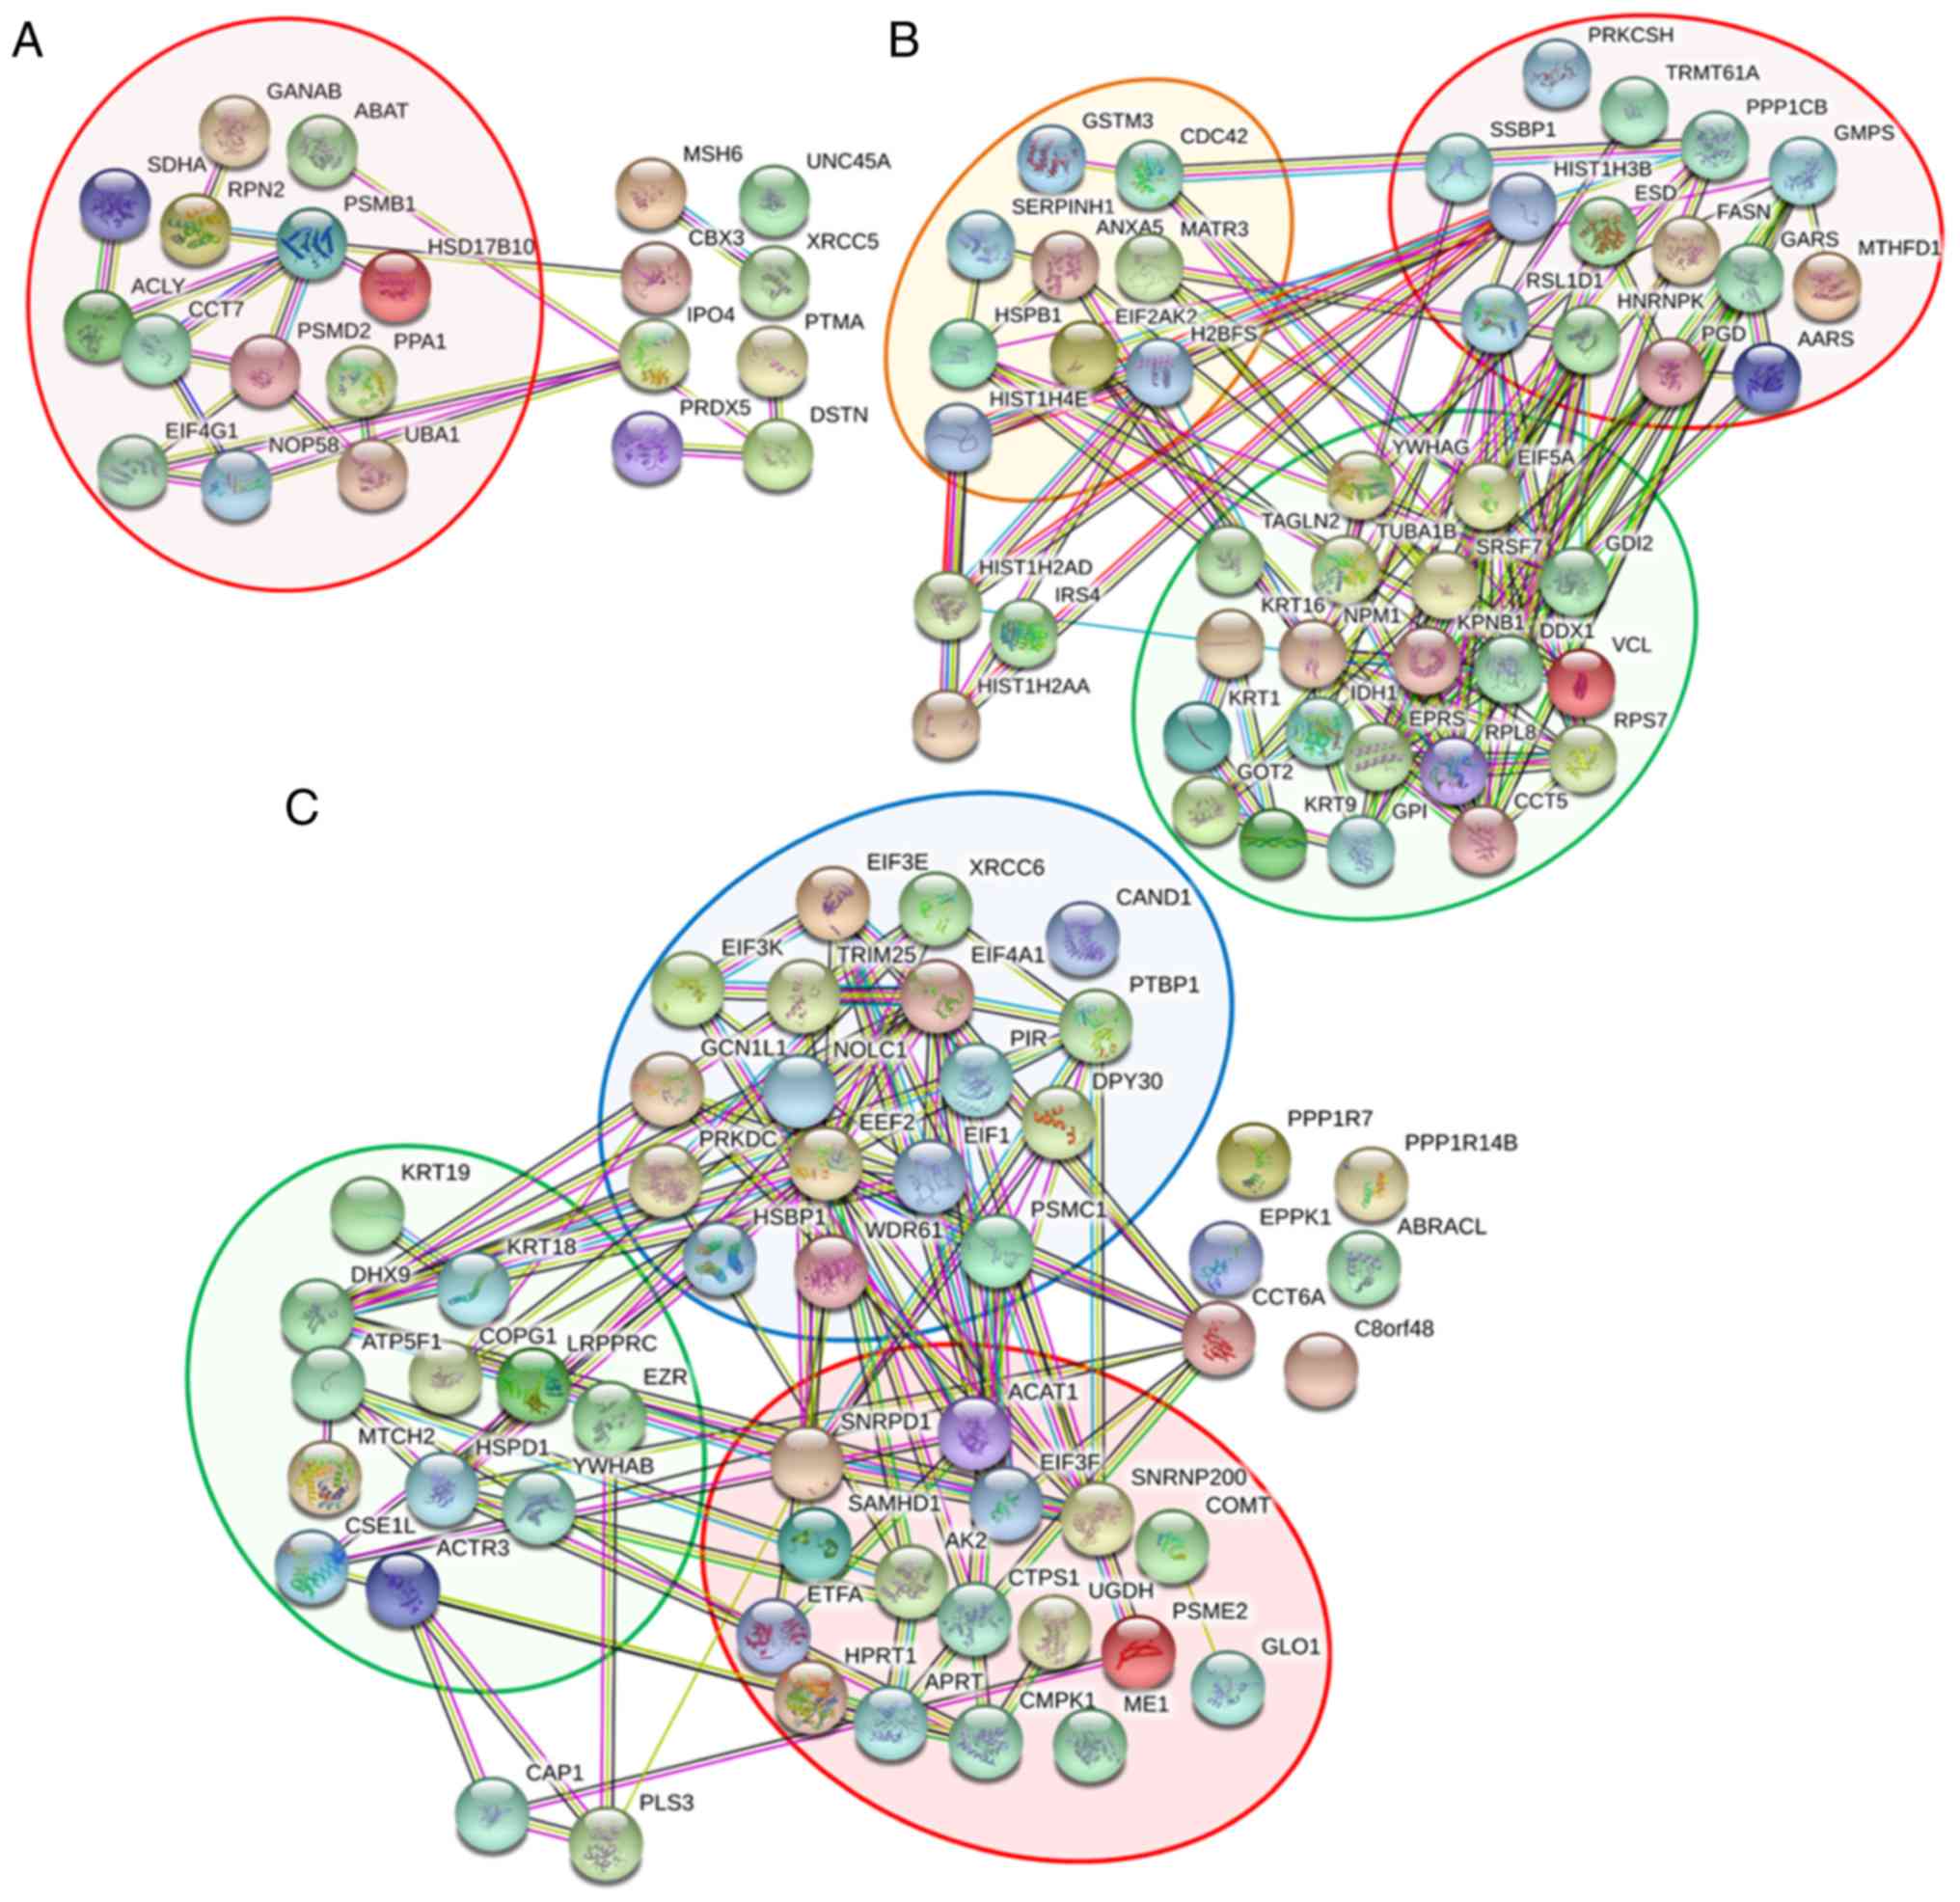
conditions (54 proteins). The results from STRING were analyzed
according to the biological functions of proteins. The analysis
indicated that the majority of proteins derived from the anoikis
resistant group were clustered into one major group which was
involved in cellular metabolism (red background) as indicated in
Fig. 4A. Examples of proteins in
this group included 3-hydroxyacyl-CoA dehydrogenase type-2,
ATP-citrate synthase and 4-aminobutyrate aminotransferase. In
addition, the differentially expressed proteins in the reseeding
group were predominantly clustered into one of three groups
(Fig. 4B). The first group (red
background) was involved in cellular metabolism, and included as
histone H3, glucosidase 2 subunit β and fatty acid synthase. The
second group (green background) was associated with cellular
localization and included nuclear matrix protein 1, 14-3-3 protein
γ and tubulin α-1B chain. The final group (orange background) was
involved with stress responses and included HSP-β1, HSP27, annexin
A5 and Serpin H1. The differentially expressed proteins observed in
both anoikis resistant and reseeding conditions were clustered into
three main groups, as displayed in Fig. 4C. The first group (red background)
was primarily involved in cellular metabolism, and included SNRPD1,
acetyl-CoA acetyltransferase and catechol
O-methyltransferase. The second group (green background) was
associated with cellular localization and included keratin, type I
cytoskeletal (CK)18, CK19 and ezrin. The final group (blue
background) was associated with gene expression regulation, and
included elongation factor 2, eukaryotic initiation factor 4A-I and
eukaryotic translation initiation factor 1.
Validation of proteins of interest
associated with cancer metastasis
A total of 121 proteins exhibited >1.5-fold
differential expression between siSC and siOGT treated cells under
anoikis resistant and reseeding conditions, representative proteins
from each group were selected for validation using western blot
analysis. The assessed proteins included proteins involved in
cellular metabolism (histone H3 and SNRPD1), cellular localization
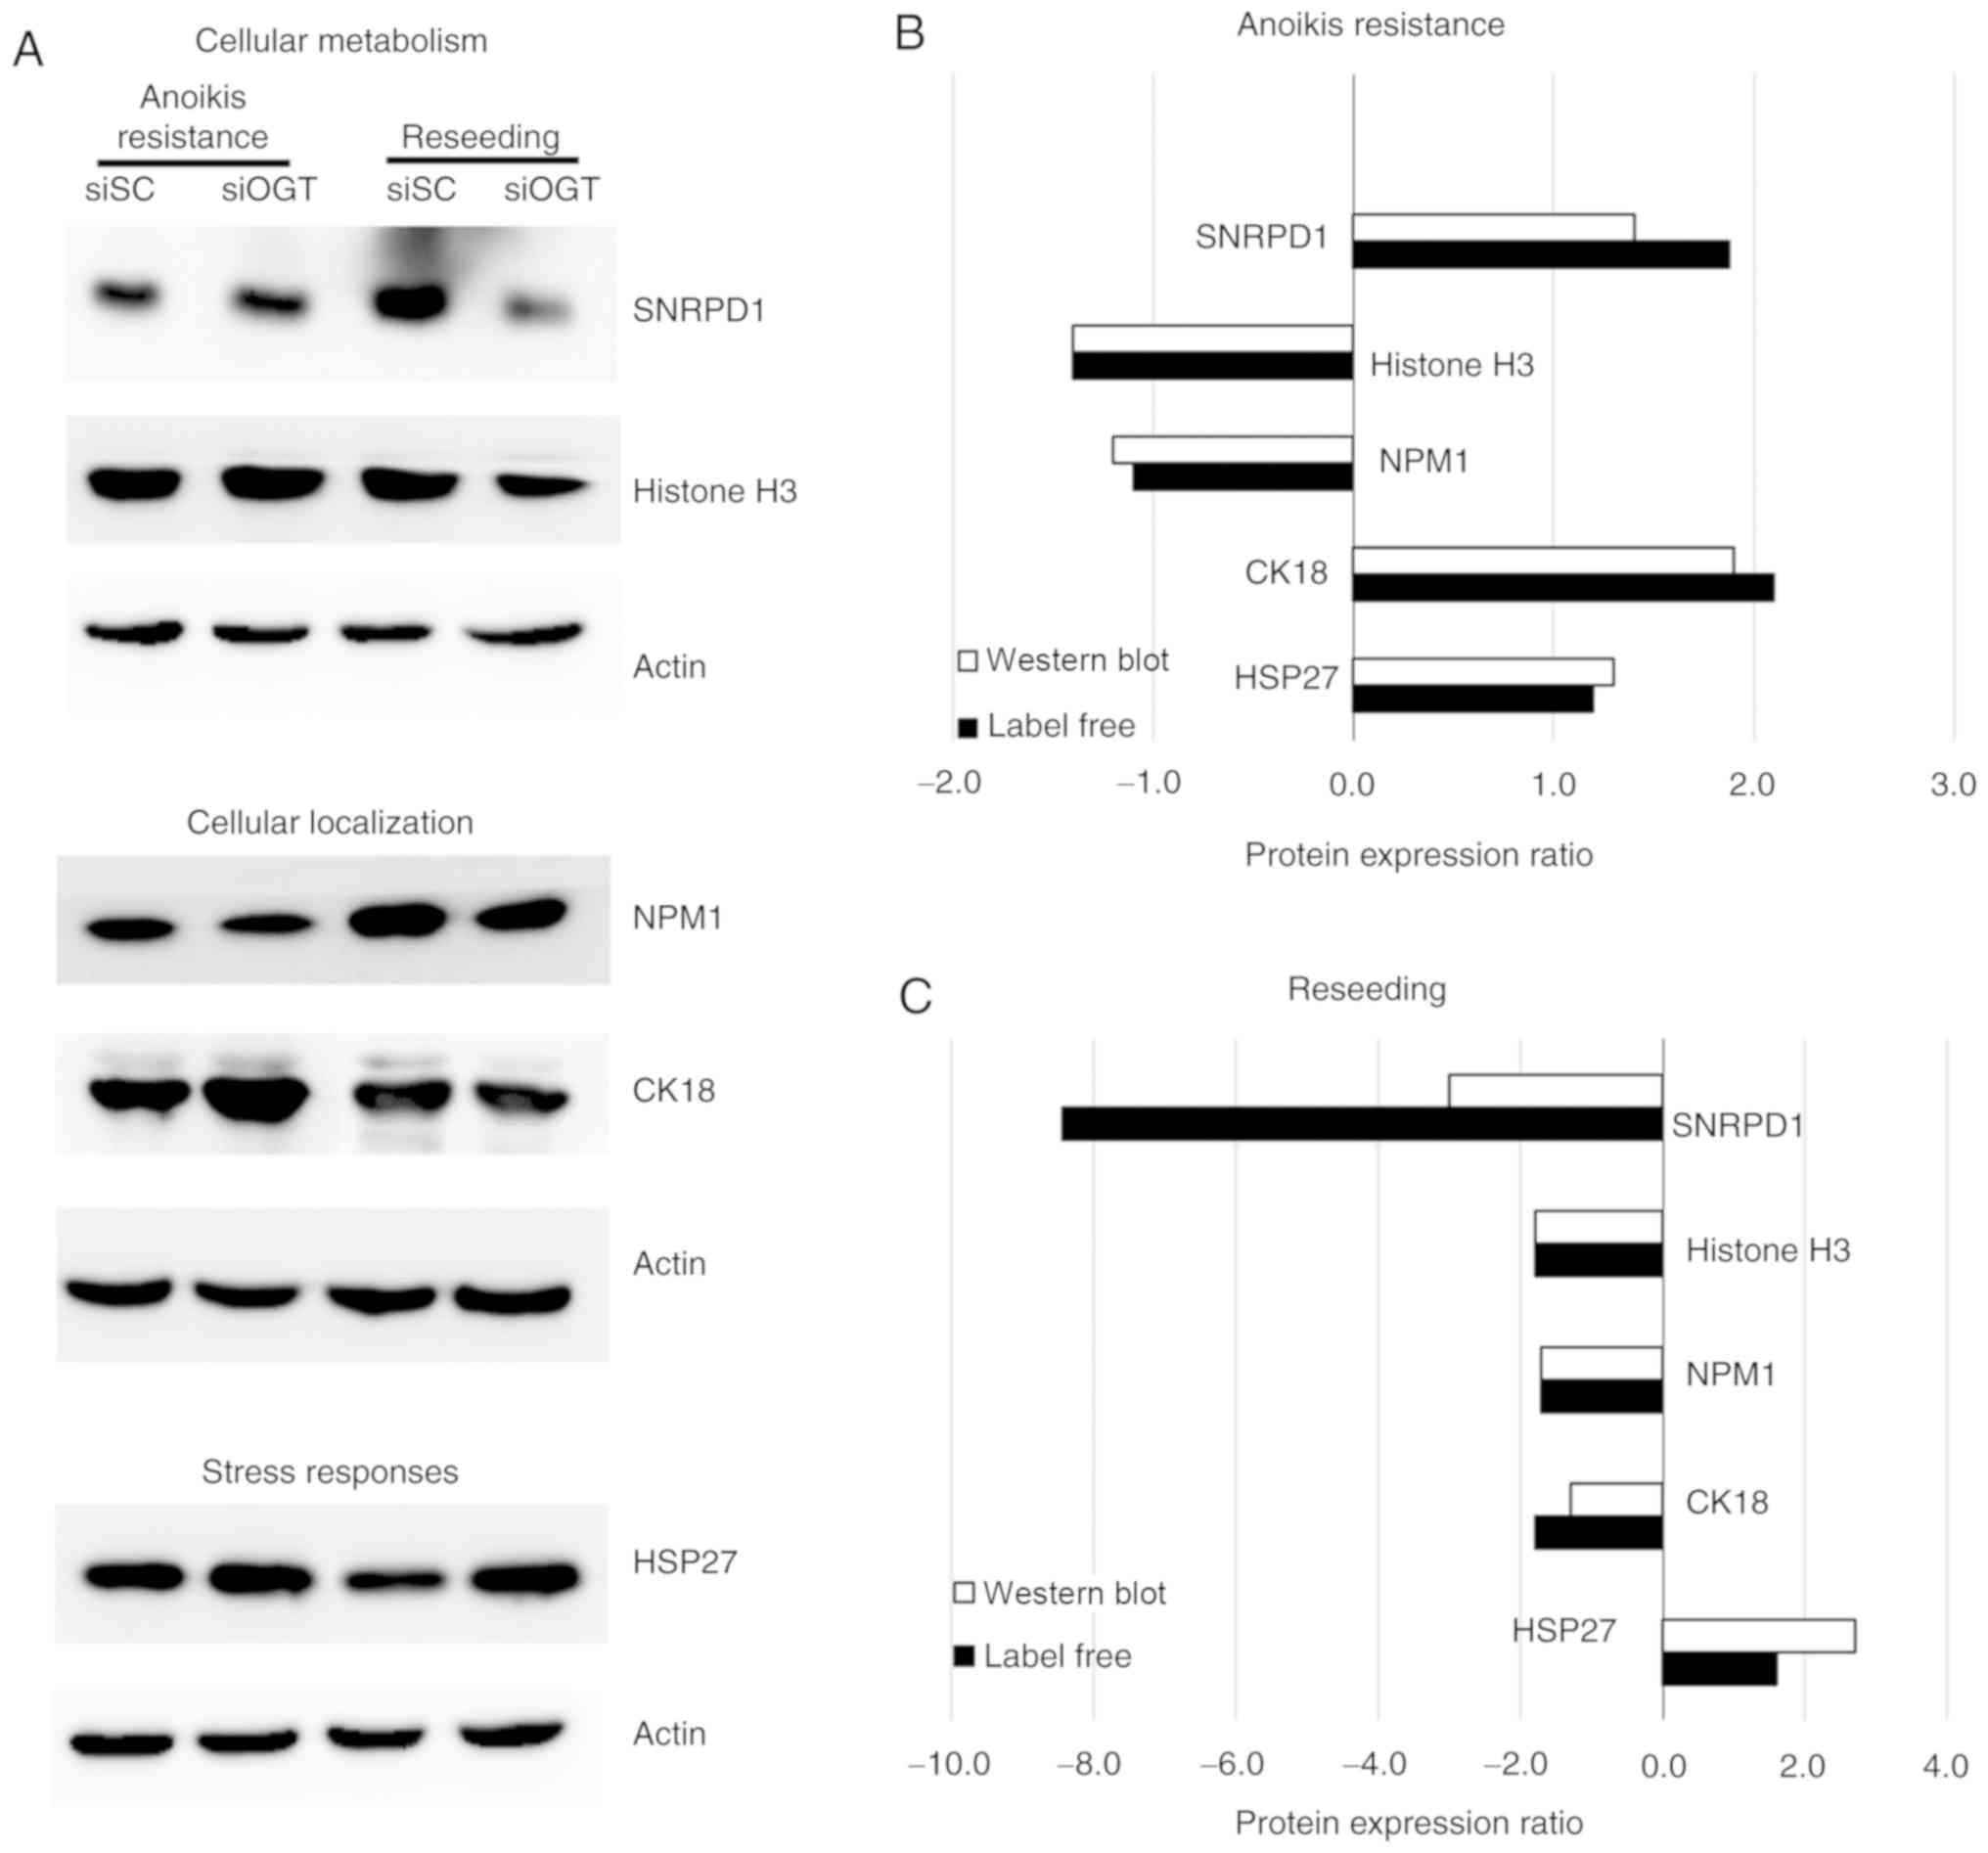
(NMP1 and CK18) and stress response (HSP27) (Fig. 5A). The results from western
blotting showed that expression of the proteins associated with
cellular metabolism and localization (SNRPD1, histone H3, NMP1 and
CK18) were significantly decreased following OGT knockdown compared
with the siSC in the reseeding condition, however, expression of
HSP27, a protein associated with the stress response, was increased
following OGT silencing.
Furthermore, the expression levels of each protein
identified using label-free quantitative proteomics and western
blot analysis were compared and the trends of protein expressions
are presented. The results demonstrated that in the
anoikis-resistant condition, histone H3 and NMP1 were downregulated
following OGT knockdown, whereas CK18, HSP27 and SNRPD1 were
upregulated (Fig. 5B). In
addition, under the reseeding conditions, the majority of the
validated proteins including histone H3, SNRPD1, NMP1 and CK18
expression was downregulated following OGT silencing, whereas HSP27
expression was upregulated (Fig.
5C). Collectively, the protein expression patterns of all
validated proteins obtained from the label-free and western blot
analysis identified similar changes in protein expression.
Knockdown of O-GlcNAcylation and SNRPD1
expression results in downregulation of mTOR, particularly in the
reseeding condition
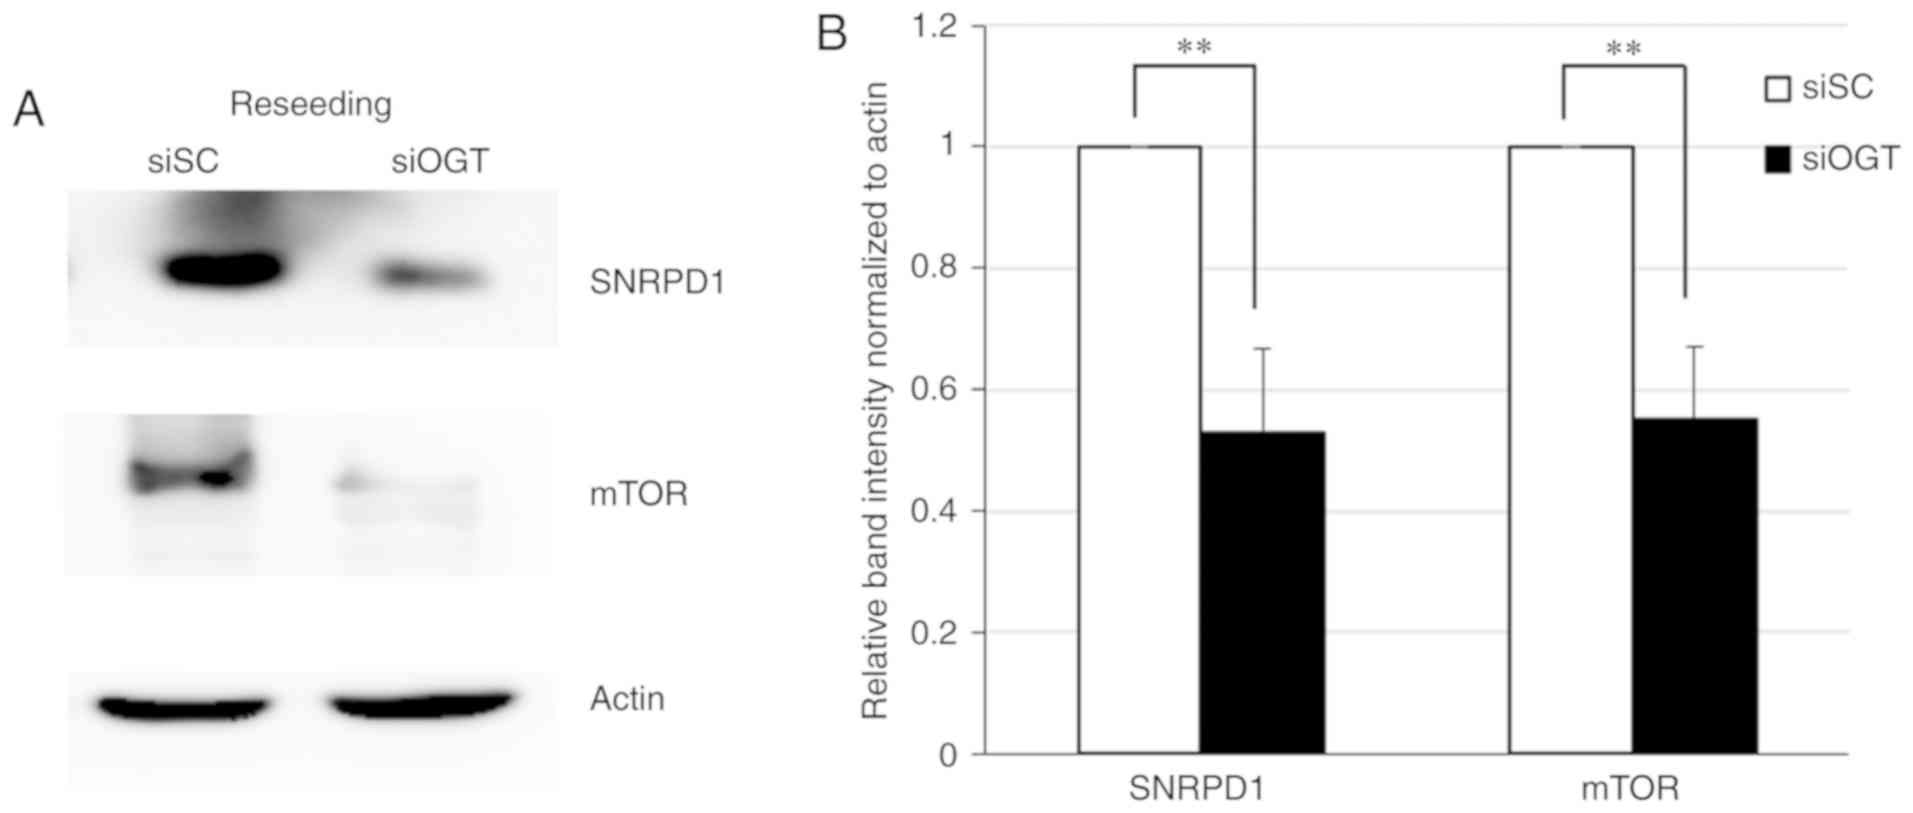
Western blot analysis and label-free quantitative
LC-MS revealed that the expression level of SNRPD1 was most
significantly decreased following OGT knockdown under the reseeding
condition. Furthermore, a decrease in mTOR protein levels was
observed in the SNRPD1 depleted cells (P<0.01; Fig. 6); suggesting an association between
SNRPD1 and mTOR expression levels via O-GlcNAcylation
reduction under the reseeding condition.
Discussion
Altered metabolism is one of the most important
factors in the progression of various diseases, and particularly in
cancer. The major characteristic of metabolic alteration in cancer
cells is an increase in glucose consumption to facilitate rapid
growth and cell proliferation (6).
Fairly small amounts of glucose can enter the HBP, which is a minor
branch of the glycolytic pathway. The HBP end product is
UDP-GlcNAc, a sugar donor for post-translational protein
modification of O-GlcNAcylation (7), and increasing evidence has suggested
that aberrant O-GlcNAcylation is associated with malignant
tumors (10,11). Therefore, in the present study, the
effects of O-GlcNAc alteration on the malignant
transformation of MCF-7 breast cancer cells were examined under
different culture conditions used to mimic specific stages of the
metastatic process. OGT silencing was used to reduce the levels of
O-GlcNAcylated proteins in the cells. The current results
revealed that efficient knockdown of OGT gene expression was
achieved in all culture conditions, and that it resulted in notably
altered cellular morphology in the reseeding condition only, where
the cells resembled the morphology and growth of cancer cells at
distant sites.
OGT is essential for cell viability and OGT
depletion results in embryonic lethality (20). Moreover, our previous study
revealed that OGT knockdown caused a marked decrease in cell
viability under the anoikis resistant conditions (14). Furthermore, OGT silencing reduces
the migratory and invasive capacities in a number of different
types of cancer including breast (21), prostate (22), ovarian (23) and colon cancer (24). In the present study, it was
revealed that, although OGT knockdown using RNA interference did
not significantly influence cell growth and proliferation in the
monolayer condition, it decreased the cell viability and
invasiveness of MCF-7 cells under the anoikis resistant and
reseeding culture conditions, which are hypothesized to be crucial
steps in cancer metastasis (25,26).
Since siOGT treatment affected cell viability and
invasive protrusion under the anoikis resistant and reseeding
conditions, label-free quantitative proteomics and LC-MS/MS were
used to determine protein expression changes affected by
O-GlcNAc knockdown. The heat map data demonstrated
significant alterations in the expression of 317 proteins affected
by siOGT treatment in all culture conditions. Notably,
O-GlcNAc reduction significantly resulted in downregulation
of 85 proteins under the reseeding condition, which may be
associated with the altered cell morphology and a decrease in cell
viability and invasiveness. Therefore, this may suggest that in the
reseeding condition used to mimic the growth and proliferation of
metastatic cancer cells at secondary sites, O-GlcNAcylation
may serve an important role in the metastatic cancer cascade of
breast cancer. The differentially expressed proteins (>1.5 fold)
were used to develop a protein-protein interaction network. STRING
analysis of proteins expressed in the anoikis resistant and
reseeding conditions revealed that the majority of differentially
expressed proteins were involved in a number cellular processes,
including cellular metabolism (SNRNPD1 and Histone H3), cellular
localization (NPM1 and CK18) and the stress responses (HSP27).
Histone H3 is reported to be modified by
O-GlcNAc, which regulates various biological processes in
cells (27); moreover, decreasing
expression of histone H3 by stable knockdown resulted in decreased
neoplastic cell transformation (28). NPM1 is also an
O-GlcNAcylated protein and its modification is associated
with the progression of cholangiocarcinoma (29). Reducing NPM1 expression using siRNA
resulted in a significant decrease in cell proliferation and
induced cell cycle arrest in leukemia, colon and breast cancer
(30-32). Moreover, the present study supports
the results of previous studies which have demonstrated that
O-GlcNAc regulates the cellular stress responses via the
expression of numerous HSPs, including HSP27 (14,33).
HSP27 expression levels affect cell proliferation, migration and
invasion abilities in several types of cancer, such as liver,
prostate and breast cancer (34-36).
Subsequently, representative proteins were selected
for validation and the protein expression ratio (siSC vs. siOGT)
from western blots and label-free quantitative analysis were
analyzed. SNRPD1, Histone H3, NPM1 and CK18 expression was
significantly downregulated, whereas HSP27 expression was
upregulated following OGT knockdown. Hsp27 has been implicated in
the stress response mechanism in cancer cells (14). Furthermore, Hsp27 exerts tumor
suppressor functions to inhibit cancer progression and metastasis.
As transient OGT knockdown resulted in a significant decrease in
invasion, in the anoikis resistant and reseeding conditions; it is
possible that a decrease in O-GlcNAcylation via OGT
knockdown may increase cellular stress, resulting in the
upregulation of Hsp27 which serves to limit and alleviate these
conditions.
Changes in protein expression observed from
immunoblots and label-free quantitative analysis revealed similar
trends. OGT silencing in MCF-7 cells cultured under the reseeding
condition revealed significant changes in the expression of certain
proteins, which may influence cell viability and invasion (Fig. 2). This indicates that aberrant
O-GlcNAcylation may serve a pivotal role under certain
conditions to regulate the metastatic potential of malignant breast
cancer cells.
Among the validated proteins, SNRPD1 exhibited the
most significant decrease in expression levels following OGT
knockdown under the reseeding condition. Therefore, a focus was
placed on this protein and its interacting partners. SNRPD1 serves
a key role in pre-mRNA splicing (37) and exerts an inhibitory effect on
cell growth and colony formation via cell cycle regulation in lung
cancer (38). In addition, SNRPD1
depletion results in a notable loss of pluripotency and
significantly prevents the reprogramming of human pluripotent stem
cells (39). Moreover, gene
microarray analysis demonstrated that SNRPD1 expression is
upregulated in lung and breast cancer tissues (40). Furthermore, siRNA-mediated
knockdown of SNRPD1 resulted in a marked reduction of cell
viability and mTOR expression in malignant breast cancer cells
(40). In the present study, MCF-7
cells transfected with siOGT exhibited significantly decreased
SNRPD1 and mTOR expression levels, under the reseeding condition
(Fig. 6). Notably, mTOR belongs to
the serine/threonine protein kinase family and its signaling is
usually activated in multiple types of cancer including breast
cancer (41). Numerous studies
have reported that activated mTOR signaling results in increased
tumor progression and a decrease in patient survival (42-44).
Furthermore, activation of the mTOR pathway promotes tumor growth
and progression in 70% of all breast cancer cases (45). Therefore, blocking this pathway by
inhibiting mTOR activation or decreasing its expression may serve
as a promising strategy for cancer therapy. However, mTOR
activation is dependent on various protein partners to form a
complex, resulting in specific cellular signaling transduction
(46-48). The present data revealed that OGT
knockdown resulted in a decrease in mTOR protein expression level;
however, the complexity of mTOR signalling means that further
studies are needed to clarify which mTOR complex is implicated in
OGT downregulation.
In conclusion, the results of the present study
demonstrate the impact of a decrease O-GlcNAcylation on
MCF-7 cells in terms of its biological effects as well as protein
expression in in vitro models of primary, spheroid and
secondary growth. Decreasing O-GlcNAcylation significantly
altered cancer cell morphology, and reduced cell viability and
invasiveness under the reseeding condition. Moreover, a number of
proteins were downregulated following OGT knockdown under the
reseeding condition, and these proteins may be potential candidates
for targeted therapy. Notably, there was a significant decrease in
SNRPD1 and mTOR expression levels following a decrease in
O-GlcNAc in the reseeding condition. Therefore, the
development of a novel strategy to inhibit SNRPD1 expression and
downregulate the mTOR pathway may represent a novel therapeutic
approach for treating patients with malignant breast cancer.
Collectively, the current findings indicate that
O-GlcNAcylation serves a pivotal role in specific steps of
the metastatic processes in MCF-7 breast cancer cells.
Supplementary Data
Acknowledgments
Not applicable.
Funding
The research was supported by funding from the
Chulabhorn Research Institute (grant no. BC-2008-02).
Availability of data and materials
The datasets used during the present study are
available from the corresponding author upon reasonable
request.
Authors' contributions
PN and VC conceived, designed the study, wrote and
drafted the manuscript. PN performed the experiments in cell
cultures, proteomics, immunoblotting and data analysis. DC prepared
and ran samples for the LC-MS/MS. KS constructed and analyzed heat
map data. CS interpreted the results and reviewed the manuscript.
JS reviewed and edited the manuscript and was involved in the
conception of the study. All authors read and approved the final
version of the manuscript and agree to be accountable for all
aspects of the research in ensuring that the accuracy or integrity
of any part of the work are appropriately investigated and
resolved.
Ethics approval and consent to
participate
Not applicable.
Patient consent for publication
Not applicable.
Competing interests
The authors declare that they have no competing
interests.
References
|
1
|
Bray F, Ferlay J, Soerjomataram I, Siegel
RL, Torre LA and Jemal A: Global cancer statistics 2018: GLOBOCAN
estimates of incidence and mortality worldwide for 36 cancers in
185 countries. CA Cancer J Clin. 68:394–424. 2018. View Article : Google Scholar : PubMed/NCBI
|
|
2
|
Caplan L: Delay in breast cancer:
Implications for stage at diagnosis and survival. Front Public
Health. 2:872014. View Article : Google Scholar : PubMed/NCBI
|
|
3
|
Chaffer CL and Weinberg RA: A perspective
on cancer cell metastasis. Science. 331:1559–1564. 2011. View Article : Google Scholar : PubMed/NCBI
|
|
4
|
Valastyan S and Weinberg RA: Tumor
metastasis: Molecular insights and evolving paradigms. Cell.
147:275–292. 2011. View Article : Google Scholar : PubMed/NCBI
|
|
5
|
Redig AJ and McAllister SS: Breast cancer
as a systemic disease: A view of metastasis. J Intern Med.
274:113–126. 2013. View Article : Google Scholar : PubMed/NCBI
|
|
6
|
Vander Heiden MG, Cantley LC and Thompson
CB: Understanding the Warburg effect: The metabolic requirements of
cell proliferation. Science. 324:1029–1033. 2009. View Article : Google Scholar : PubMed/NCBI
|
|
7
|
Hart GW, Housley MP and Slawson C: Cycling
of O-linked beta-N-acetylglucosamine on nucleocytoplasmic proteins.
Nature. 446:1017–1022. 2007. View Article : Google Scholar : PubMed/NCBI
|
|
8
|
Kreppel LK, Blomberg MA and Hart GW:
Dynamic glycosylation of nuclear and cytosolic proteins. Cloning
and characterization of a unique O-GlcNAc transferase with multiple
tetratricopeptide repeats. J Biol Chem. 272:9308–9315. 1997.
View Article : Google Scholar : PubMed/NCBI
|
|
9
|
Gao Y, Wells L, Comer FI, Parker GJ and
Hart GW: Dynamic O-glycosylation of nuclear and cytosolic proteins:
Cloning and characterization of a neutral, cytosolic
beta-N-acetylglucosa-minidase from human brain. J Biol Chem.
276:9838–9845. 2001. View Article : Google Scholar : PubMed/NCBI
|
|
10
|
Hanover JA, Chen W and Bond MR: O-GlcNAc
in cancer: An Oncometabolism-fueled vicious cycle. J Bioenerg
Biomembr. 50:155–173. 2018. View Article : Google Scholar : PubMed/NCBI
|
|
11
|
Chaiyawat P, Netsirisawan P, Svasti J and
Champattanachai V: Aberrant O-GIcNAcylated proteins: New
perspectives in breast and colorectal cancer. Front Endocrinol
(Lausanne). 5:1932014. View Article : Google Scholar
|
|
12
|
Champattanachai V, Netsirisawan P,
Chaiyawat P, Phueaouan T, Charoenwattanasatien R,
Chokchaichamnankit D, Punyarit P, Srisomsap C and Svasti J:
Proteomic analysis and abrogated expression of O-GlcNAcylated
proteins associated with primary breast cancer. Proteomics.
13:2088–2099. 2013. View Article : Google Scholar : PubMed/NCBI
|
|
13
|
Phueaouan T, Chaiyawat P, Netsirisawan P,
Chokchaichamnankit D, Punyarit P, Srisomsap C, Svasti J and
Champattanachai V: Aberrant O-GlcNAc-modified proteins expressed in
primary colorectal cancer. Oncol Rep. 30:2929–2936. 2013.
View Article : Google Scholar : PubMed/NCBI
|
|
14
|
Netsirisawan P, Chaiyawat P,
Chokchaichamnankit D, Lirdprapamongkol K, Srisomsap C, Svasti J and
Champattanachai V: Decreasing O-GlcNAcylation affects the malignant
transformation of MCF-7 cells via Hsp27 expression and its O-GlcNAc
modification. Oncol Rep. 40:2193–2205. 2018.PubMed/NCBI
|
|
15
|
Khongmanee A, Lirdprapamongkol K, Tit-oon
P, Chokchaichamnankit D, Svasti J and Srisomsap C: Proteomic
analysis reveals important role of 14-3-3sigma in anoikis
resistance of cholangiocarcinoma cells. Proteomics. 13:3157–3166.
2013. View Article : Google Scholar : PubMed/NCBI
|
|
16
|
Lirdprapamongkol K, Sakurai H, Kawasaki N,
Choo MK, Saitoh Y, Aozuka Y, Singhirunnusorn P, Ruchirawat S,
Svasti J and Saiki I: Vanillin suppresses in vitro invasion and in
vivo metastasis of mouse breast cancer cells. Eur J Pharm Sci.
25:57–65. 2005. View Article : Google Scholar : PubMed/NCBI
|
|
17
|
Tit-Oon P, Chokchaichamnankit D,
Khongmanee A, Sawangareetrakul P, Svasti J and Srisomsap C:
Comparative secretome analysis of cholangiocarcinoma cell line in
three-dimensional culture. Int J Oncol. 45:2108–2116. 2014.
View Article : Google Scholar : PubMed/NCBI
|
|
18
|
Gasteiger E, Gattiker A, Hoogland C,
Ivanyi I, Appel RD and Bairoch A: ExPASy: The proteomics server for
in-depth protein knowledge and analysis. Nucleic Acids Res.
31:3784–3788. 2003. View Article : Google Scholar : PubMed/NCBI
|
|
19
|
Kall L, Canterbury JD, Weston J, Noble WS
and MacCoss MJ: Semi-supervised learning for peptide identification
from shotgun proteomics datasets. Nat Methods. 4:923–925. 2007.
View Article : Google Scholar : PubMed/NCBI
|
|
20
|
O'Donnell N, Zachara NE, Hart GW and Marth
JD: Ogt-dependent X-chromosome-linked protein glycosylation is a
requisite modification in somatic cell function and embryo
viability. Mol Cell Biol. 24:1680–1690. 2004. View Article : Google Scholar : PubMed/NCBI
|
|
21
|
Gu Y, Mi W, Ge Y, Liu H, Fan Q, Han C,
Yang J, Han F, Lu X and Yu W: GlcNAcylation plays an essential role
in breast cancer metastasis. Cancer Res. 70:6344–6351. 2010.
View Article : Google Scholar : PubMed/NCBI
|
|
22
|
Lynch TP, Ferrer CM, Jackson SR, Shahriari
KS, Vosseller K and Reginato MJ: Critical role of O-Linked
beta-N-acetylglu-cosamine transferase in prostate cancer invasion,
angiogenesis, and metastasis. J Biol Chem. 287:11070–11081. 2012.
View Article : Google Scholar : PubMed/NCBI
|
|
23
|
Niu Y, Xia Y, Wang J and Shi X:
O-GlcNAcylation promotes migration and invasion in human ovarian
cancer cells via the RhoA/ROCK/MLC pathway. Mol Med Rep.
15:2083–2089. 2017. View Article : Google Scholar : PubMed/NCBI
|
|
24
|
Jiang M, Xu B, Li X, Shang Y, Chu Y, Wang
W, Chen D, Wu N, Hu S, Zhang S, et al: O-GlcNAcylation promotes
colorectal cancer metastasis via the miR-101-O-GlcNAc/EZH2
regulatory feedback circuit. Oncogene. 38:301–316. 2019. View Article : Google Scholar :
|
|
25
|
Liu Q, Zhang H, Jiang X, Qian C, Liu Z and
Luo D: Factors involved in cancer metastasis: A better
understanding to 'seed and soil' hypothesis. Mol Cancer.
16:1762017. View Article : Google Scholar
|
|
26
|
Kim YN, Koo KH, Sung JY, Yun UJ and Kim H:
Anoikis resistance: An essential prerequisite for tumor metastasis.
Int J Cell Biol. 2012:3068792012. View Article : Google Scholar : PubMed/NCBI
|
|
27
|
Choi HS, Choi BY, Cho YY, Mizuno H, Kang
BS, Bode AM and Dong Z: Phosphorylation of histone H3 at serine 10
is indispensable for neoplastic cell transformation. Cancer Res.
65:5818–5827. 2005. View Article : Google Scholar : PubMed/NCBI
|
|
28
|
Fong JJ, Nguyen BL, Bridger R, Medrano EE,
Wells L, Pan S and Sifers RN: β-N-Acetylglucosamine (O-GlcNAc) is a
novel regulator of mitosis-specific phosphorylations on histone H3.
J Biol Chem. 287:12195–12203. 2012. View Article : Google Scholar : PubMed/NCBI
|
|
29
|
Phoomak C, Park D, Silsirivanit A,
Sawanyawisuth K, Vaeteewoottacharn K, Detarya M, Wongkham C,
Lebrilla CB and Wongkham S: O-GlcNAc-induced nuclear translocation
of hnRNP-K is associated with progression and metastasis of
chol-angiocarcinoma. Mol Oncol. 13:338–357. 2019. View Article : Google Scholar :
|
|
30
|
Wong JCT, Hasan MR, Rahman M, Yu AC, Chan
SK, Schaeffer DF, Kennecke HF, Lim HJ, Owen D and Tai IT:
Nucleophosmin 1, upregulated in adenomas and cancers of the colon,
inhibits p53-mediated cellular senescence. Int J Cancer.
133:1567–1577. 2013. View Article : Google Scholar : PubMed/NCBI
|
|
31
|
Zeng D, Xiao YS, Zhu JL, Peng CY, Liang W
and Lin HY: Knockdown of nucleophosmin 1 suppresses proliferation
of triple-negative breast cancer cells through activating
CDH1/Skp2/p27kip1 pathway. Cancer Manag Res. 11:143–156. 2019.
View Article : Google Scholar : PubMed/NCBI
|
|
32
|
Qin FX, Shao HY, Chen XC, Tan S, Zhang HJ,
Miao ZY, Wang L, Hui-Chen and Zhang L: Knockdown of NPM1 by RNA
interference inhibits cells proliferation and induces apoptosis in
leukemic cell line. Int J Med Sci. 8:287–294. 2011. View Article : Google Scholar : PubMed/NCBI
|
|
33
|
Kazemi Z, Chang HN, Haserodt S, McKen C
and Zachara NE: O-linked beta-N-acetylglucosamine (O-GlcNAc)
regulates stress-induced heat shock protein expression in a
GSK-3beta-dependent manner. J Biol Chem. 285:39096–39107. 2010.
View Article : Google Scholar : PubMed/NCBI
|
|
34
|
Hung CS, Huang CY, Lee CH, Chen WY, Huang
MT, Wei PL and Chang YJ: IGFBP2 plays an important role in heat
shock protein 27-mediated cancer progression and metastasis.
Oncotarget. 8:54978–54992. 2017. View Article : Google Scholar : PubMed/NCBI
|
|
35
|
Cordonnier T, Bishop JL, Shiota M, Nip KM,
Thaper D, Vahid S, Heroux D, Gleave M and Zoubeidi A: Hsp27
regulates EGF/β-catenin mediated epithelial to mesenchymal
transition in prostate cancer. Int J Cancer. 136:E496–E507. 2015.
View Article : Google Scholar
|
|
36
|
Gibert B, Eckel B, Gonin V, Goldschneider
D, Fombonne J, Deux B, Mehlen P, Arrigo AP, Clézardin P and
Diaz-Latoud C: Targeting heat shock protein 27 (HspB1) interferes
with bone metastasis and tumour formation in vivo. Brit J Cancer.
107:63–70. 2012. View Article : Google Scholar : PubMed/NCBI
|
|
37
|
Xiong XP, Vogler G, Kurthkoti K, Samsonova
A and Zhou R: SmD1 modulates the miRNA pathway independently of its
pre-mrna splicing function. PLoS Genet. 11:e10054752015. View Article : Google Scholar : PubMed/NCBI
|
|
38
|
Li Z and Pützer BM: Spliceosomal protein E
regulates neoplastic cell growth by modulating expression of cyclin
E/CDK2 and G2/M checkpoint proteins. J Cell Mol Med. 12:2427–2438.
2008. View Article : Google Scholar : PubMed/NCBI
|
|
39
|
Kim YD, Lee J, Kim HS, Lee MO, Son MY, Yoo
CH, Choi JK, Lee SC and Cho YS: The unique spliceosome signature of
human pluripotent stem cells is mediated by SNRPA1, SNRPD1, and
PNN. Stem Cell Res. 22:43–53. 2017. View Article : Google Scholar : PubMed/NCBI
|
|
40
|
Quidville V, Alsafadi S, Goubar A, Commo
F, Scott V, Pioche-Durieu C, Girault I, Baconnais S, Le Cam E,
Lazar V, et al: Targeting the deregulated spliceosome core
machinery in cancer cells triggers mTOR blockade and autophagy.
Cancer Res. 73:2247–2258. 2013. View Article : Google Scholar : PubMed/NCBI
|
|
41
|
Hare SH and Harvey AJ: mTOR function and
therapeutic targeting in breast cancer. Am J Cancer Res. 7:383–404.
2017.PubMed/NCBI
|
|
42
|
Xu K, Liu P and Wei W: mTOR signaling in
tumorigenesis. Biochim Biophys Acta. 1846:638–654. 2014.PubMed/NCBI
|
|
43
|
Tian T, Li X and Zhang J: mTOR signaling
in cancer and mTOR inhibitors in solid tumor targeting therapy. Int
J Mol Sci. 20:E7552019. View Article : Google Scholar : PubMed/NCBI
|
|
44
|
Malaguti P, Vari S, Cognetti F and Fabi A:
The Mammalian target of rapamycin inhibitors in breast cancer:
Current evidence and future directions. Anticancer Res. 33:21–28.
2013.
|
|
45
|
Liu J, Li HQ, Zhou FX, Yu JW, Sun L and
Han ZH: Targeting the mTOR pathway in breast cancer. Tumour Biol.
39:10104283177108252017. View Article : Google Scholar : PubMed/NCBI
|
|
46
|
Zaytseva YY, Valentino JD, Gulhati P and
Evers BM: mTOR inhibitors in cancer therapy. Cancer Lett. 319:1–7.
2012. View Article : Google Scholar : PubMed/NCBI
|
|
47
|
Gomez-Pinillos A and Ferrari AC: mTOR
signaling pathway and mTOR inhibitors in cancer therapy. Hematol
Oncol Clin North Am. 26:483–505. vii2012. View Article : Google Scholar : PubMed/NCBI
|
|
48
|
Pópulo H, Lopes JM and Soares P: The mTOR
signalling pathway in human cancer. Int J Mol Sci. 13:1886–1918.
2012. View Article : Google Scholar : PubMed/NCBI
|