Introduction
Epithelial ovarian cancer (EOC) is one of the most
common forms of ovarian cancer, and the overall 5-year survival
rate has been reported as 15–30% (1,2).
Patients with EOC commonly exhibit a satisfactory initial clinical
response to optimal cytoreductive surgery followed by systemic
paclitaxel- and platinum-based chemotherapy (3); however the majority of patients
develop recurrences, with latency periods that range from years to
decades. This time period (4) can
be explained by tumor dormancy, which represents a subclinical
equilibrium between the host’s immune system and quiescent residual
tumor cells, and also represents the minimal residual disease, a
stage that remains a major obstacle in achieving complete
remission. Tumor dormancy, associated with cancer stem cells
(CSCs), has been previously extensively studied (5). Although it is unclear whether CSCs
harbor the genetic alterations that are causative of cancer,
primeval traits of adult stem cells may potentially explain tumor
cell dormancy, such as their quiescence within a niche that is
critical in tissue proliferation and protection of tissue
homeostasis (6). It has therefore
been hypothesized (7–11) that disease relapse is the
consequence of CSCs, and following a period of quiescence, they
subsequently resume growth.
The current isolation and identification methods of
CSCs are based on their functional and phenotypic properties. CSCs
are defined as a small population of undifferentiated cells and are
responsible for tumor initiation, metastasis and recurrence
following therapy (12). EOC
originates from the normal ovarian surface epithelium (OSE)
(13); however, the isolation and
identification of stem cells in the OSE has yet to be achieved.
Therefore, markers of CSCs associated with normal stem cells remain
unknown for EOC. Therefore, markers of CSCs associated with normal
stem cells remain unknown for EOC. In a previous study of EOC
(14), screening and evaluation of
other stem cell markers was applied to isolate the stem cell clones
from ovarian tumors. It has been demonstrated that Nestin and
Oct3/4 are expressed in ovarian CSCs and are associated with an
immature stem-like and dormant cell population. In a previous study
of EOC (13), it has been
demonstrated that Nestin and Oct3/4 are the markers for ovarian
CSCs and are associated with an immature stem-like and dormant cell
population. Nestin is an intermediate filament protein that is a
neuronal stem/progenitor cell marker that is expressed during the
development of the central nervous system (15). Nestin has been associated with
aggressive growth, metastasis and poor prognosis in certain types
of tumor and is highly expressed in diverse types of cancer cell
and proliferating tumor vasculature (16). Oct3/4, a member of the POU
transcription factor family, is a marker of embryonic stem cells,
and is expressed in embryonic stem cells, germline stem cells and
undifferentiated embryonal carcinoma, whilst it is not expressed in
differentiated cells (17,18). The stem cell factor CD117 belongs
to the tyrosine kinase receptor family with five
immunoglobulin-like extracellular domains (19–22).
CD117 serves an essential function in maintaining embryonic stem
cells in an undifferentiated state, and is involved in the
self-renewal of progenitor cells (23). The hyaluronic acid receptor CD44
antigen is expressed in numerous types of tumor and is also a
marker for CSC subsets from several types of solid tumor (24).
Long-term label retention is extensively used for
the identification of quiescent stem cells (25,26);
in particular, the fluorescent dye PKH26, which can irreversibly
bind to the lipid bilayer of cell membranes and produce a stable,
clear and precise fluorescent signal. Subsequent to each cell
division, the label is equally partitioned among daughter cells.
Furthermore, the PKH26 fluorescent dye has a low cytotoxicity and
is not passed between dyed and undyed cells.
In the present study, mouse xenograft models were
developed and the expression of stem cell markers (stemness) and
tumorigenicity of label-retaining PKH26hi cells
(dormant/slow-cycling ovarian cancer cells) was analyzed.
Additionally, tumor growth and side effects were monitored
following chemotherapy on xenograft tumors generated in mice by
injection of ovarian cancer cells. When the growth of the mouse
xenograft tumors ceased in the presence of chemotherapy, and were
stable in size, the stem-like characteristics of the
dormant/slow-cycling PKH26hi cells were analyzed.
Materials and methods
Cell line, cell culture and PKH26
labeling of cells
The SKOV3 ovarian cancer cell line (American Type
Culture Collection, Manassas, VA, USA) was maintained in McCoy’s
medium (Sigma-Aldrich, St. Louis, MO, USA) supplemented with 10%
fetal bovine serum. The cells were incubated at 37°C in a
humidified atmosphere containing 5% CO2. PKH26 labeling
was performed according to the manufacturer’s instructions
(Sigma-Aldrich).
Animal housing, generation of tumors and
cisplatin treatment
Female nude mice were bred and maintained at the
Experimental Animal Center, Bethune International Peace Hospital
(Shijiazhuang, China). All procedures were performed in accordance
with the National Institute of Health Guide for Care and Use of
Laboratory Animals (NIH publication no. 80–23). The current study
was approved by the Animal Ethics Committee of Bethune
International Peace Hospital (Shijiazhuang, China). The mice were
maintained under sterile airflow conditions throughout the
experiments. In order to induce subcutaneous (s.c.) tumor
formation, PKH26-labeled SKOV3 cells (1×10⁷) were
suspended in 0.5 ml phosphate-buffered saline (PBS) and injected
subcutaneously into the left thigh of each mouse (5–6 weeks old,
18–20 g). Approximately 14 days following the injection (average
tumor volume, 100 mm3), the mice were randomly separated
into two groups (n=35 per group) as follows: The control group
(SKOV3-P xenograft tumors) and the cisplatin treatment group
(SKOV3-R xenograft tumors; intraperitoneal injection of 4 mg/kg
cisplatin twice a week for 3 weeks). The experiments were
terminated if the tumor size of the control group reached 1,500
mm3, or if the tumors of the treatment group coexisted
with their host at a stable size subsequent to the end of the
treatment for ≥1 week. All surgical procedures were performed under
sodium pentobarbital anesthesia, and all efforts were made to
minimize the suffering of the animals. At the end of the
experiment, the mice were sacrificed and the tumors were excised
for PKH26-based sorting by flow cytometry.
Tumor growth and side effects
The mice were closely monitored every day and the
body weights and tumor volumes were measured every 6 days. The
tumor volume (TV) was evaluated using the following formula: TV
(mm3) = (width2 × length)/2. Blood samples
were collected from the caudal vein once a week to count white
blood cells (WBCs). All of the observed side effects of the
chemotherapy were recorded during the experimental period,
including weight loss, changes in behavior and feeding, reaction to
stimulation and ruffing of fur. The grading criteria of the side
effects were as follows: 0; WBC ≥6×10⁹/l, weight loss
≤5%, no skin discoloration or drowsiness and a diet decline ≤25%.
I; WBC 5–6×10⁹/l, weight loss ≤10%, mild skin
discoloration, short-term drowsiness and diet decline ≤50%. II; WBC
≤5×10⁹/l, weight loss ≥10%, severe skin discoloration,
long-term drowsiness or coma and diet decline ≥50%). Therefore,
grade 0 indicated mild, I indicated moderate and II indicated
severe side effects.
Tumor digestion for PKH26-based sorting
and analysis by flow cytometry
The dissected tumors were finely minced and
subjected to collagenase digestion (10 mg/ml collagenase IV in
McCoy’s medium) to obtain single-cell suspensions. PKH26-labeled
tumors yielded a continuous gradient of cells with fluorochrome
PKH26 retention ranging from high (PKH26hi, equivalent
to pre-injected cells), low (PKH26low, fluorescence
intensity lower than pre-injected level), to total label quenching
(PKH26neg cells). PKH26hi,
PKH26low and PKH26neg cells were identified,
gated and sorted based on the fluorescence intensity of this
continuous gradient for subsequent experiments. PKH26-based sorting
was performed on a BD FACSAria Cell Sorter (BD Biosciences,
Franklin Lakes, NJ, USA) and data were analyzed with BD FACSDiva
software (BD Biosciences).
Cell cycle analysis
The freshly sorted PKH26hi,
PKH26low and PKH26neg cells from SKOV3-P and
SKOV3-R tumors were plated in 60-mm dishes. Following 72-h culture,
the supernatant was gently removed, to avoid detachment of the
poorly adherent cells. The cells were detached by digestion with
Trypsin-EDTA (Gibco-BRL, Carlsbad, CA, USA), pelleted by
centrifugation at 1,700 × g for 4 min, and washed twice with
ice-cold PBS. A total of 1×10⁶ cells were resuspended in
5 μg/ml DAPI buffer (100 mM Tris, pH 7.4, 150 mM NaCl, 1 mM CaCl,
0.5 mM MgCl2, 0.1% Nonidet P-40; Invitrogen Life
Technologies, Carlsbad, CA, USA) and incubated in the dark for 30
min at room temperature. The DNA content was analyzed by flow
cytometry using a cell sorter, and the proportion of cells in a
particular phase of the cell cycle was determined with ModFit LT
software for Windows version 3.2 (Verity Software House, Inc.,
Topsham, ME, USA).
Quantitative polymerase chain reaction
(qPCR) analysis
qPCR analysis was used to measure the expression
levels of the stem cell markers Nestin, Oct3/4, CD117 and CD44 in
the three groups of PKH26 cells (~1×10⁶ cells from each
group were harvested for PCR) from SKOV3-P and SKOV3-R tumors. The
total RNA was isolated using TRIzol™ reagent (Invitrogen Life
Technologies) and the cDNA was synthesized by reverse transcription
according to the manufacturer’s instructions of an RT-kit (BioTeke
Corporation, Beijing, China). The qPCR was conducted using
SYBR-Green (Beijing TransGen Biotech Co., Ltd., Beijing, China)
with a Rotor Gene 6000 Real-time PCR Detection system (Biolabo
Scientific Instruments SA, Châtel-St-Denis, Switzerland) according
to the manufacturer’s instructions. The reactions were performed in
a 25 μl volume. All qPCR was performed with the following cycling
conditions: Initial denaturation at 95°C for 5 min, followed by 40
cycles at 95°C for 30 sec, 60°C for 30 sec and 72°C for 3 min. The
results were analyzed by the 2−ΔΔC method based on the
cycle threshold (Ct) values using GAPDH as an internal control.
The primers used for the qPCR were as follows:
Nestin forward, 5′-AGC GTT GGA ACA GAG GTT GGA and reverse, 5′-TGT
TTC CTC CCA CCC TGT GTC T, Oct3/4 forward, 5′-CAA TTT GCC AAG CTC
CTG AAG and reverse, 5′-AGG GCC GCA GCT TAC ACA TG, CD117 forward,
5′-CAA GGA AGG TTT CCG AAT GC and reverse, 5′-CCC AGC AGG TCT TCA
TGA TGT, CD44 forward, 5′-GAC ACA TAT TGT TTC AAT GCT TCA GC and
reverse, 5′-GAT GCC AAG ATG ATC AGC CAT TCT GGA AT, GAPDH forward,
5′-ATT TGC AGG GGG GAG CCA; and reverse, 5′-CAT GAG TCC TTC CAC GAT
ACC AAA. The experiments were repeated a minimum of three
times.
Detection of protein expression by flow
cytometry
Flow cytometric analysis was used to detect the
protein expression of the stem cell markers Nestin (vol. per test,
5 μl); Oct3/4 (vol. per test, 20 μl); CD117 (vol. per test, 5 μl);
CD44 (vol. per test, 20 μl) in the three groups of PKH26 cells from
the SKOV3-P and SKOV3-R tumors. PKH26hi,
PKH26low and PKH26neg cells were sorted from
SKOV3-P and SKOV3-R tumors, pelleted by centrifugation at 1,700 × g
for 4 min, and washed twice with ice-cold PBS. The
PKH26hi, PKH26low and PKH26neg
cells (~1×10⁶) from the SKOV3-P and SKOV3-R tumors were
resuspended in 100 μl ice-cold PBS, stained with Nestin, Oct3/4,
CD117 and CD44 mouse monoclonal fluorescein
isothiocyanate-conjugated antibodies (BD Biosciences) and incubated
in the dark for 30 min at room temperature. The stained cells were
analyzed using an FACSAria flow cytometer. The mean fluorescence
intensity represented the protein expression levels of the stem
cell markers. The protein expression was evaluated using the
following formula: Protein expression = lgX-Mode ×340. The
experiments were repeated a minimum of three times.
Clonogenicity assays
Clonogenicity assays were performed to determine the
initiating tumor capacity of the three fractions of PKH26-retaining
cells (PKH26hi, PKH26low and
PKH26neg) from the SKOV3-P and SKOV3-R tumors.
PKH26hi, PKH26low and PKH26neg
cells were freshly sorted, counted and plated in triplicate at a
density of 500 cells/well in 24-well plates. Once the majority of
cell clones had expanded to >30 cells, they were washed twice
with PBS, fixed in ice-cold methanol for 15 min and stained with
Giemsa (Applichem GmbH, Darmstadt, Germany) for 15 min at room
temperature. Subsequent to washing out the dye with distilled
water, the clone numbers were counted. Colony formation efficiency
was calculated as follows: Colony formation efficiency =
colonies/input cells ×100. The clone formation assays were
performed in triplicate.
Tumorigenicity assays
All the animal studies adhered to the protocols
approved by the Animal Care and Use Committee of the Bethune
International Peace Hospital (Shijiazhuang, China).
In the pre-experiment, PKH26hi,
PKH26low and PKH26neg cells from SKOV3-P
tumors were resuspended in 0.5 ml PBS and were administered by s.c.
injection into the six groups of nude mice at different cell
densities (5,000, 10,000, 20,000, 40,000, 80,000 and
1×10⁶ cells/ml). The results indicated that the minimal
cell densities for tumor initiation in the PKH26hi and
PKH26low cells were 10,000 and 40,000 cells/ml,
respectively, whereas PKH26neg cells failed to display
tumor-initiating capacity at any of the tested cell densities. In
the present study, two relatively small cell densities were
selected in order to compare the tumorigenicity between SKOV3-P and
SKOV3-R tumor-derived PKH26 cells.
PKH26hi, PKH26low and
PKH26neg cells derived from SKOV3-P and SKOV3-R tumors
were respectively resuspended in 0.5 ml PBS, and administered via
s.c. injection into the four groups of 5–6-week-old female nude
mice at either 10,000 or 20,000 cells/ml. The 10,000 cells/ml
SKOV3-P tumor group (n=18, three groups of six each) was injected
with 10,000 cells/ml PKH26hi, PKH26low or
PKH26neg cells derived from the SKOV3-P tumors. The
20,000 cells/ml SKOV3-P tumor group (n=18, three groups of six
each) was injected with 20,000 cells/ml PKH26hi,
PKH26low and PKH26neg cells derived from the
SKOV3-P tumors. The 10,000 cells/ml SKOV3-R tumor group (n=18,
three groups of six each) was injected with 10,000 cells/ml
PKH26hi, PKH26low and PKH26neg
cells derived from the SKOV3-R tumors. The 20,000 cells/ml SKOV3-R
tumor group (n=18, three groups of six each) was injected with
20,000 cells/ml PKH26hi, PKH26low and
PKH26neg cells derived from SKOV3-R tumors. The
engrafted mice were inspected every other day for tumor development
by visual observation and palpation. The tumor formation was
evaluated in the four groups of mice, 4 weeks subsequent to
transplantation. The present study defined tumor formation as a
xenograft tumor volume ≥100 mm3.
Statistical analysis
Values are expressed as the mean ± standard
deviation. The Student’s t-test, χ2 test, exact
probabilities in a 2×2 table and one-way analysis of variance was
performed for the statistical evaluation of the data. The data were
analyzed using SPSS statistical software (version 17.0 for Windows;
SPSS, Inc., Chicago, IL, USA). A P<0.05 was considered to
indicate a statistically significant difference.
Results
Tumor growth and mouse condition
assessment
For tumor formation, 1×10⁷ PKH26-labeled
SKOV3 cells were administered by s.c. injection into the thighs of
mice (n=70). The engrafted mice (average tumor volume 100
mm3) were randomly assigned into two groups, 14 days
following injection: The control (n=35) and treatment (n=35)
groups. There were no significant differences in the xenograft
tumor volumes between the two groups (102.9±16.69 mm3
vs. 104.7±13.43 mm3, P=0.793) prior to treatment.
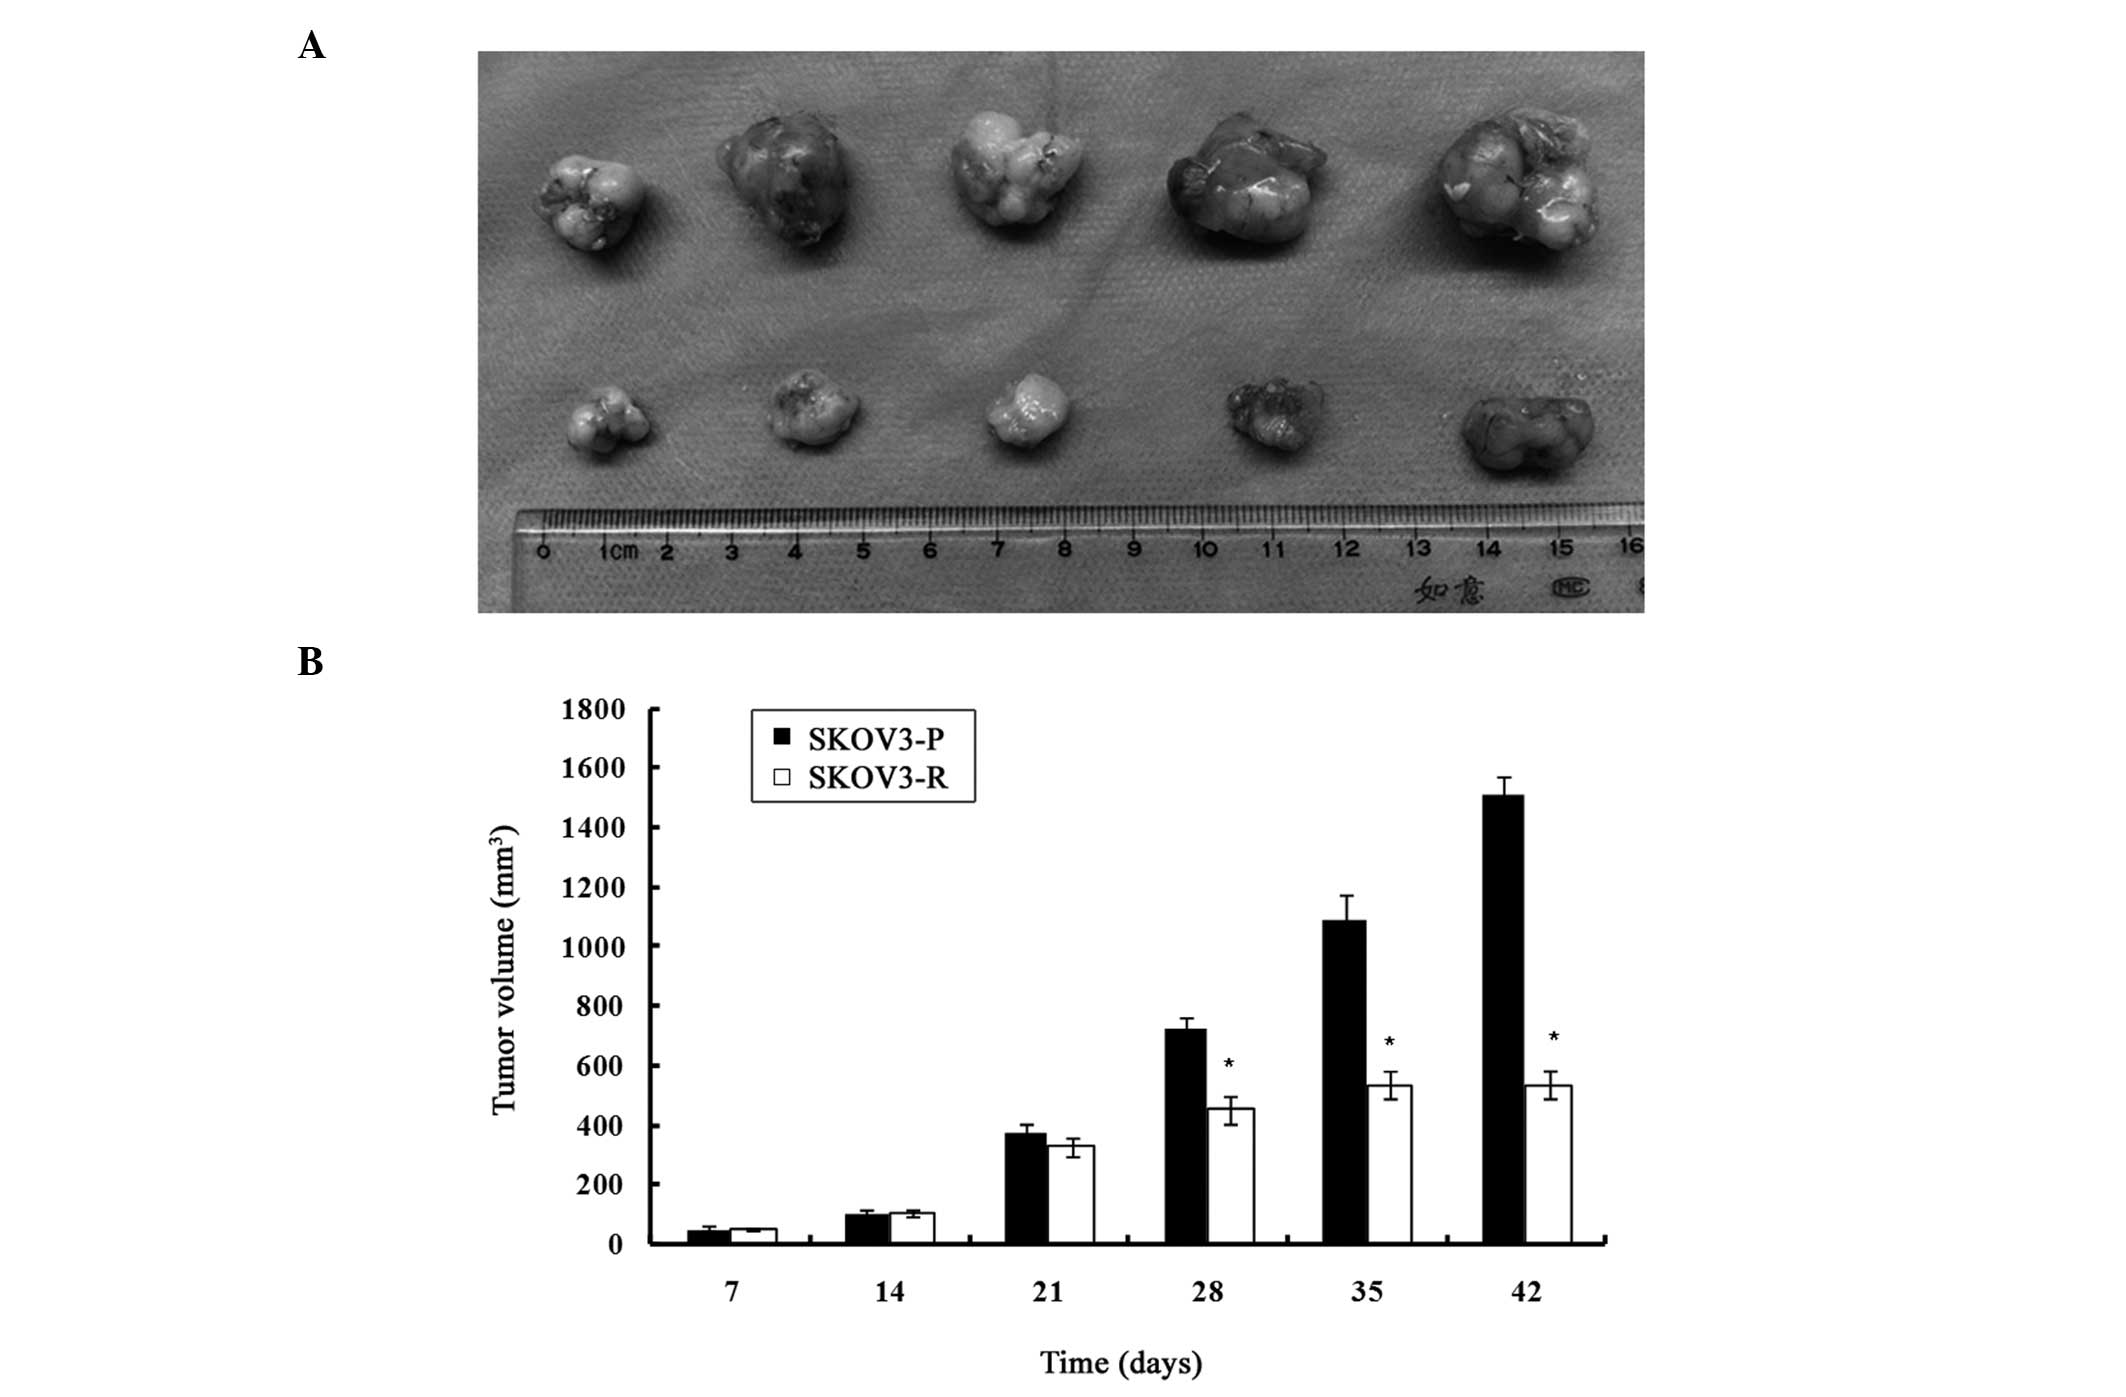
As indicated in Fig.
1, on day 35 (upon completion of cisplatin treatment), all the
mice of the control group had larger xenograft tumors. The
engrafted mice treated with cisplatin exhibited a significantly
reduced tumor volume, as compared with the control group
(1089.95±82.37 mm3 vs. 535.7±44.69 mm3,
P<0.05). An assessment of the growth rate revealed no
significant difference from day 14 to 21, but growth rate of the
cisplatin-treated tumors, from day 21 to 28, was significantly
lower than the control group (17.82±3.24 mm3/day vs.
50.14±2.92 mm3/day, P<0.05). From day 28 to 35, the
growth rate of the treated tumors was further reduced as compared
with the untreated tumors (11.72±3.52 mm3/day vs.
51.67±15.59 mm3/day, P<0.05). One week after the end
of the treatment (day 42), the mean tumor volume in the treatment
group had not significantly increased, as compared with the tumor
volume on day 35 (P>0.05); however, there was a significant
difference between the control and the treatment group
(1511.76±61.53 mm3 vs. 535.03±47.29 mm3,
P<0.05). The two groups of mice reached the breeding termination
standard on day 42, and the mice were sacrificed by cervical
dislocation under sodium pentobarbital anesthesia. Following
sacrifice of the mice and dissection of the tumors, a significant
difference in the weight of the tumors was observed between the two
groups (4.72±0.46 g, SKOV3-P tumors vs. 1.03±0.11 g, SKOV3-R
tumors, P<0.05).
At the end of cisplatin treatment (day 35), the mice
treated with cisplatin exhibited various side effects, including
weight loss (21.41±0.74 g, control group vs. 19.32±0.67 g,
cisplatin group, P<0.05), short-term drowsiness, mild skin
discoloration, diet decline (3.63±0.22 g/day, control group vs.
1.96±0.15 g/day, cisplatin group, P<0.05) and leucopenia
(7.41±0.15×10⁹/l, control group vs.
6.86±0.31×10⁹/l, cisplatin group, P<0.05). Although
the chemotherapy treatment was causative of some of these side
effects, the mice developed an extent of tolerance to the
chemotherapy, based on the grading criteria of the side
effects.
Dormant and quiescent PKH26hi
cells exist in xenograft tumors, which are enriched following
cisplatin treatment
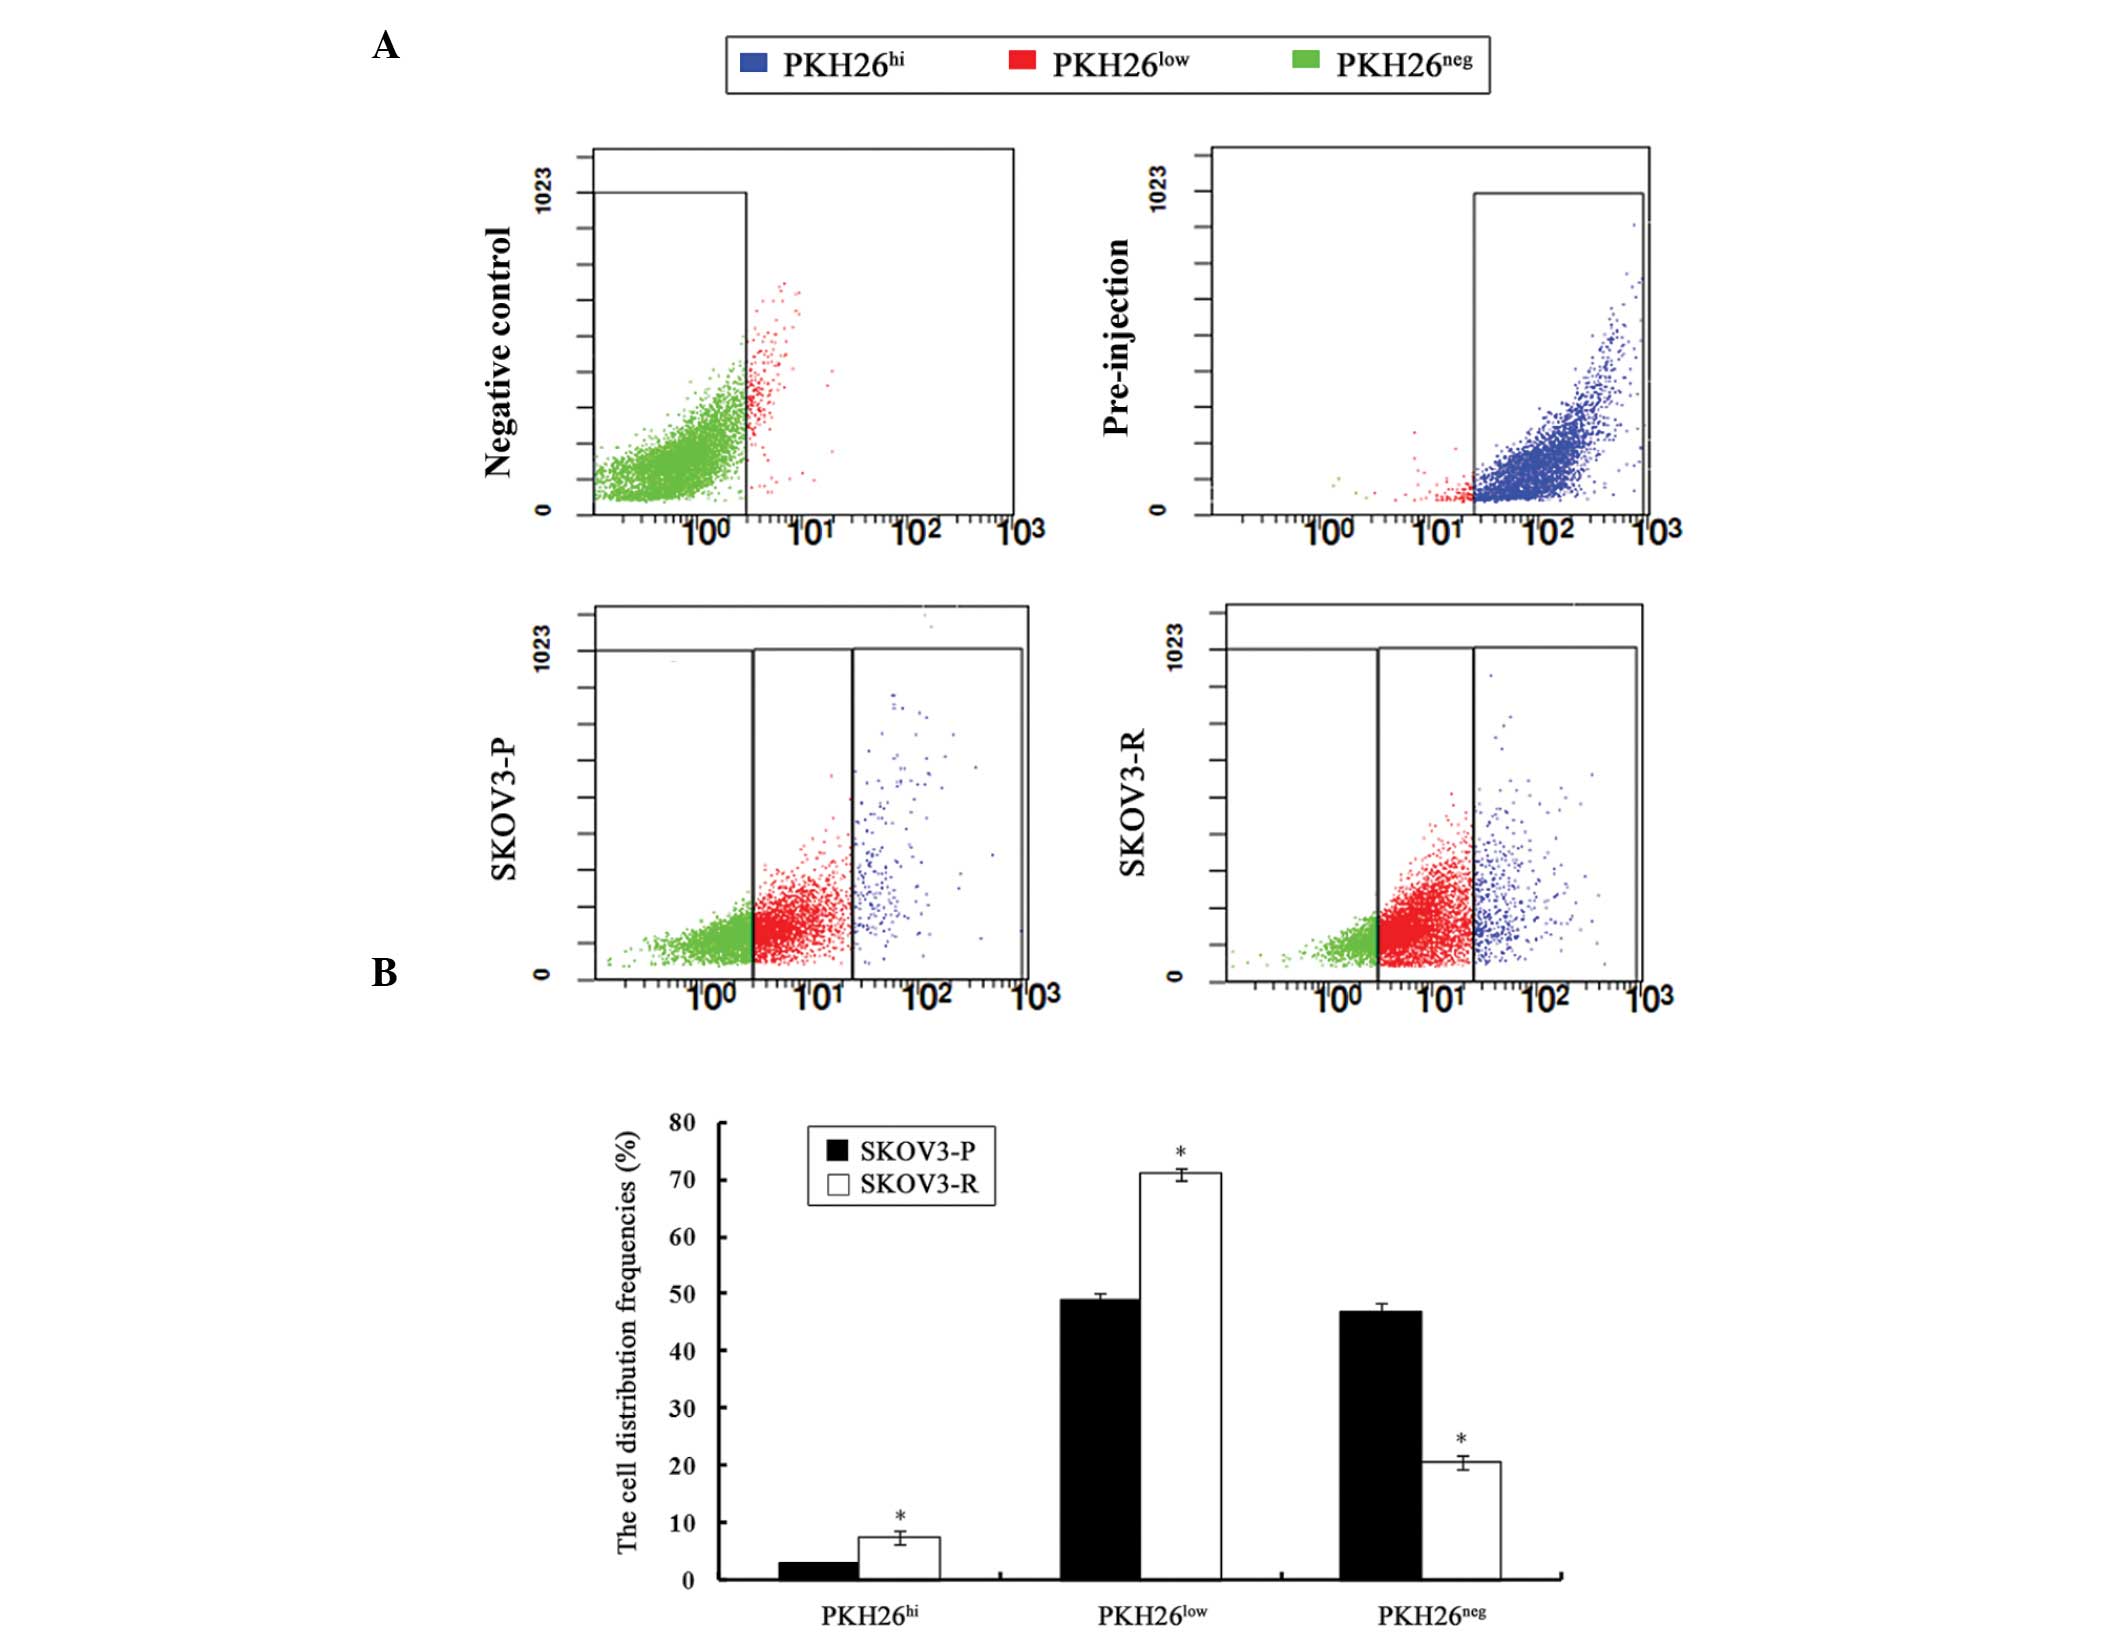
Analysis of SKOV3-P tumors for the distribution of
PKH26 intensity revealed a continuous gradient of cells, with PKH26
retention ranging from PKH26hi, to PKH26low,
to PKH26neg. The presence of PKH26hi cells
suggested a dormant or slow-cycling state, PKH26low
cells indicated a partial label dilution representative of limited
division, and presence of PKH26neg cells implied a rapid
division. Such profiles were also identified in SKOV3-R tumors
(Fig. 2A).
The percentage of each PKH26 retention fraction
varied between SKOV3-P and SKOV3-R tumors (Fig. 2B). The percentage of sorted
PKH26hi cells was significantly higher in SKOV3-R tumors
(7.57%) as compared with that of SKOV3-P cells (2.89%) (P=0.003).
Accordingly, the proportion of PKH26low cells from
SKOV3-R tumors (70.94%) was significantly higher than that of the
SKOV3-P tumors (48.87%) (P=0.002), whereas the percentage of
PKH26neg cells from SKOV3-R tumors (20.58%) was
significantly lower than that of SKOV3-P tumors (46.97%) (P=0.002).
The elevated numbers of PKH26hi cells derived from
SKOV3-R tumors supported the hypothesis that the administration of
cisplatin led to the survival of dormant cells.
Effects of cisplatin on the cell cycle
distribution of ovarian cancer cells
Cell cycle control is an important aspect of CSC
biology, and deregulated cell cycle control is one of the
fundamentally intrinsic steps contributing to CSC-derived
tumorigenesis (27). To analyze
the differences in the proliferation rate of PKH26-labeled ovarian
cancer cells in SKOV3-P and SKOV3-R tumors, the cell cycle
distribution of each PKH26 intensity group was evaluated by flow
cytometry.
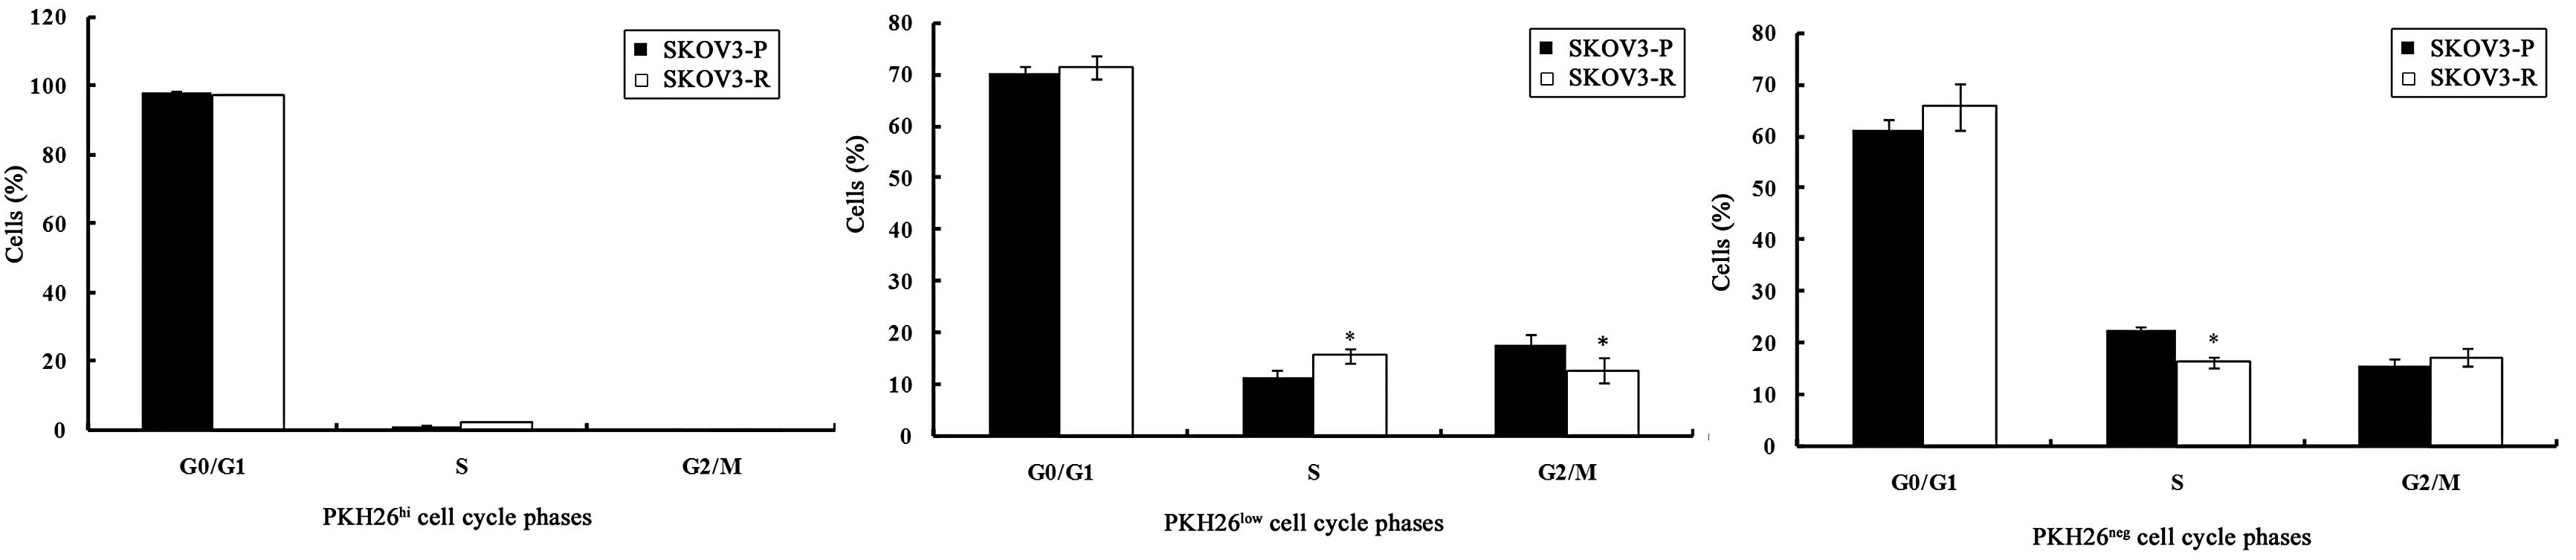
It was demonstrated that PKH26hi cells in
the SKOV3-P and SKOV3-R tumors were arrested in the
G0/G1 phase, which further supports the
theory that PKH26hi cells represent label-retaining,
dormant or slow-cycling cells.
As presented in Fig.
3, PKH26 low cells in SKOV3-P tumors exhibited a
slightly higher proportion of cells in the
G0/G1 phase. Of the PKH26low cells
in SKOV3-R tumors, the S phase fraction was increased and the
G2/M phase fraction was reduced significantly (P=0.014
and P=0.04, respectively) as compared with the SKOV3-P tumors.
These data suggest that PKH26low cells in SKOV3-R tumors
re-enter the cell cycle and develop chemotherapeutic
resistance.
PKH26neg populations from SKOV3-P and
SKOV3-R tumors were more enriched in the S phase as compared with
the PKH26low population (P=0.004 and P=0.001,
respectively), which is in agreement with the characteristics of
PKH26neg cells, which exhibited rapid cell division.
PKH26neg cells in SKOV3-R tumors displayed an increase
in the number of cells in the G0/G1 and
G2/M phase and a reduction in the number of cells in the
S phase (P=0.2, P=0.47 and P=0.001, respectively), as compared with
cells from SKOV3-P tumors. Chemotherapy treatment resulted in a
non-significant increase (P>0.05) in the
G0/G1 and G2/M phase fraction of
PKH26neg cells from SKOV3-R tumors in comparison with
those in SKOV3-P tumors.
Label-retaining PKH26hi cells
preferentially express stem cell markers, which are enhanced by
cisplatin
To explore whether PKH26hi cells had
intrinsic properties conferring stem-like characteristics, the
expression of three markers that are important in specific
signaling pathways and are crucial in establishing and maintaining
stem-like characteristics, were investigated.
qPCR was employed to analyze the expression of stem
cell markers in PKH26-labeled ovarian cancer cells from SKOV3-P and
SKOV3-R tumors (Fig. 4).
PKH26hi cells expressed higher levels of Nestin, Oct3/4,
CD117 and CD44 as compared with PKH26low cells
(P<0.05), while PKH26neg cells did not express these
stem cell markers.
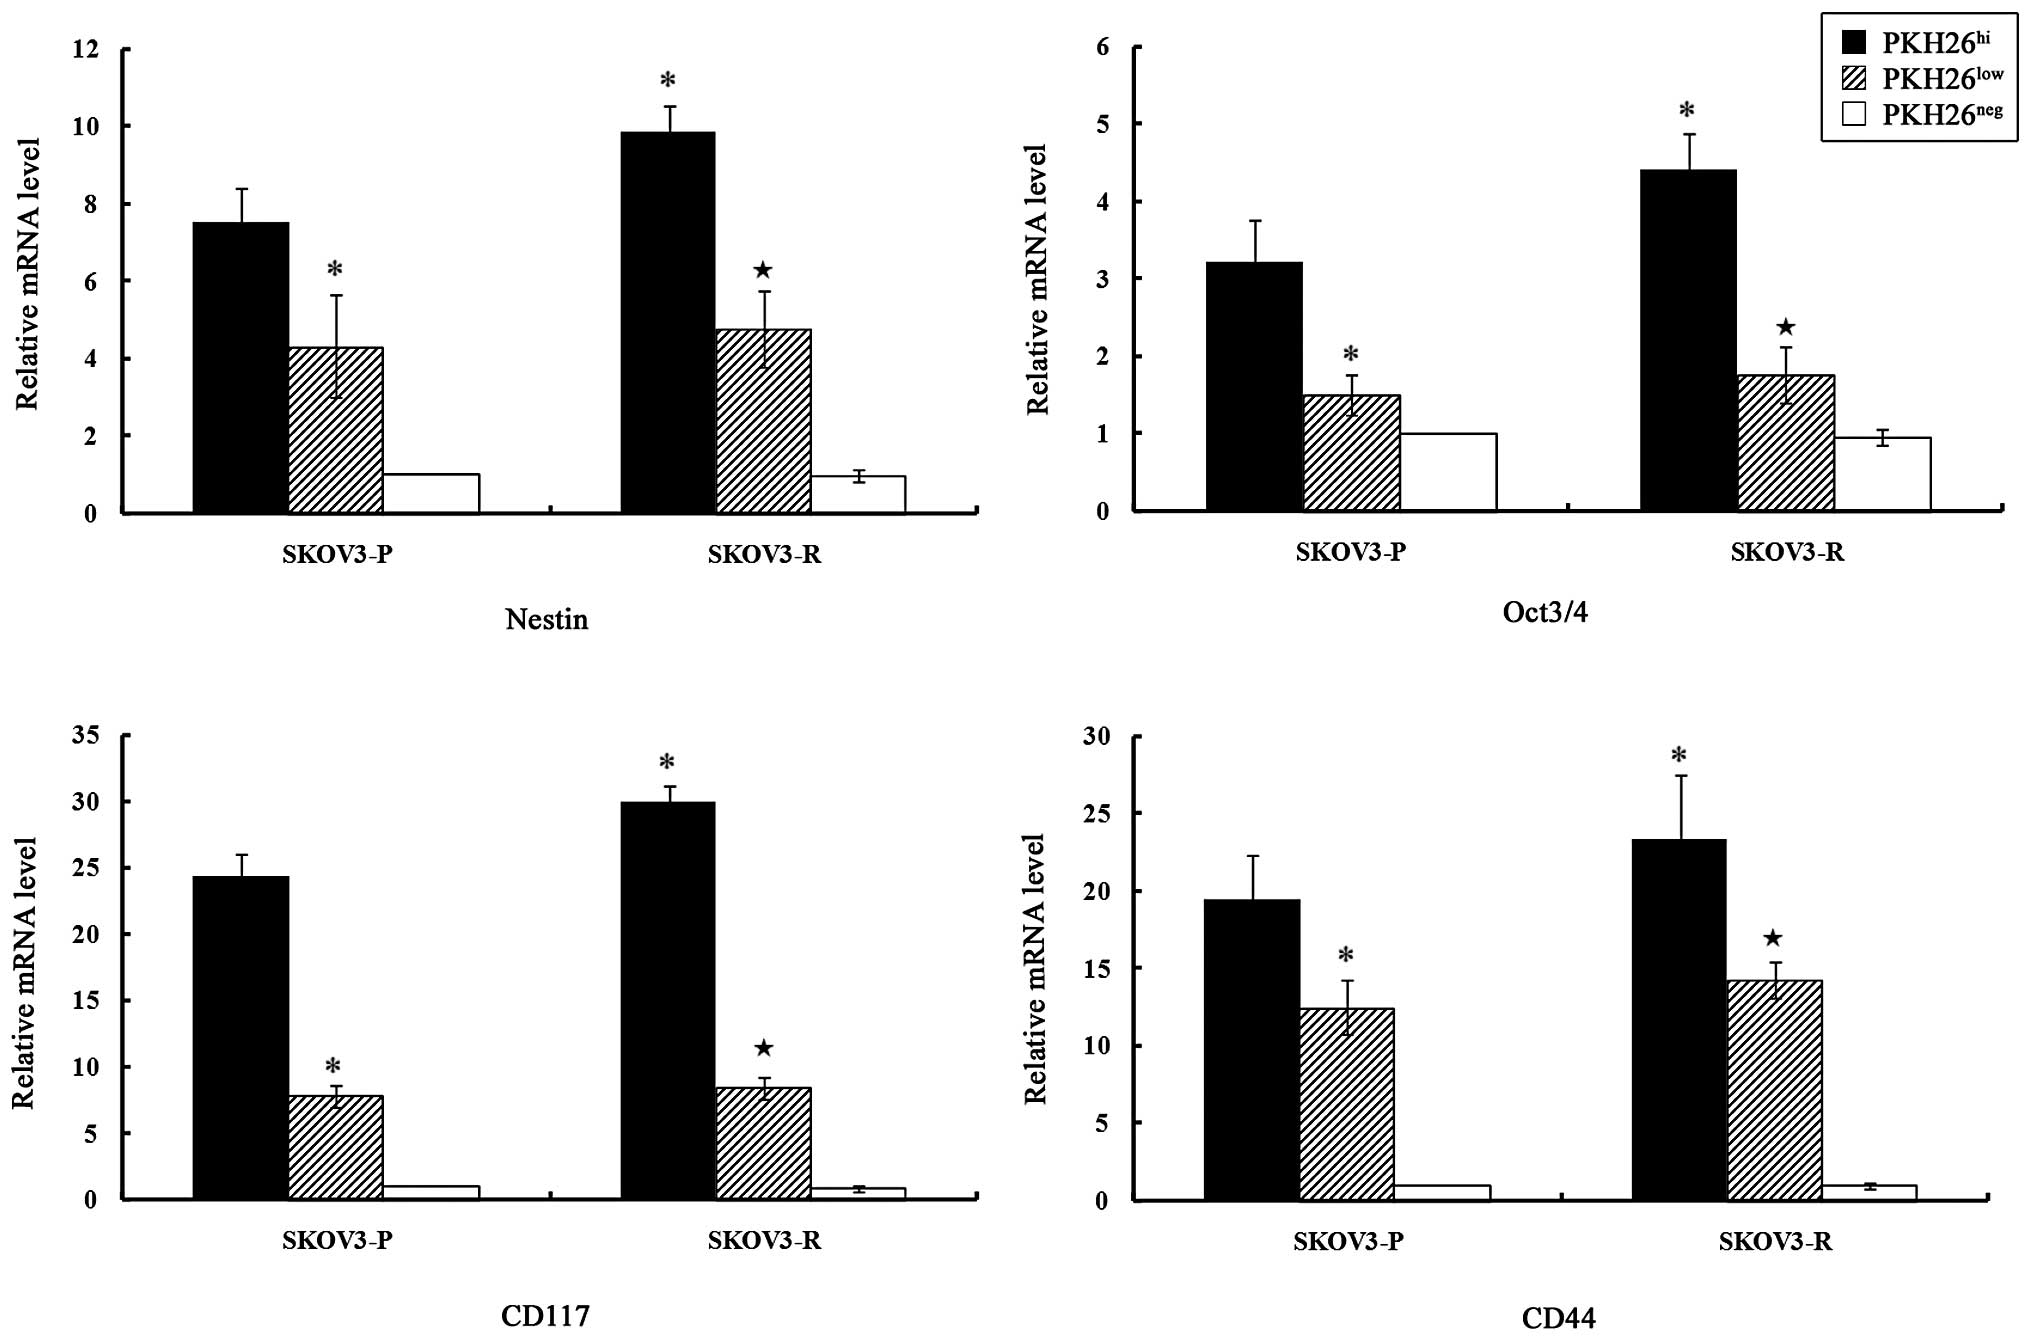 | Figure 4Expression levels of stem cell
markers in different subclones from SKOV3-P and SKOV3-R tumors.
Total RNA was prepared and the relative gene expression levels were
evaluated by quantitative polymerase chain reaction, using GAPDH as
an internal control. The bar graphs indicate the relative levels of
expression of Nestin, Oct3/4, CD117 and CD44 mRNA in
PKH26hi, PKH26low and PKH26neg
subclones from SKOV3-P and SKOV3-R tumors, as determined by
relative quantitative analysis using the 2−ΔΔCt method.
The data are presented as the means ± standard error,
*P<0.05 vs. SKOV3-P-PKH26hi and
★P<0.05 vs. SKOV3-R-PKH26hi.
PKH26hi, high PKH26 retention, equivalent to
pre-injected cells; PKH26low, fluorescence intensity
lower than pre-injected level; PKH26neg, total label
quenching; SKOV3-P, xenograft control tumors; SKOV3-R xenograft
cisplatin treated tumors. |
A significant difference in the expression levels of
the stem cell markers existed between SKOV3-P and SKOV3-R
PKH26hi cells. Nestin, Oct3/4, CD117 and CD44 mRNA were
significantly upregulated in PKH26hi cells from SKOV3-R
tumors, as compared with SKOV3-P tumors (P=0.024, P=0.045, P=0.022
and P=0.047, respectively).
Flow cytometry was used to detect the protein
expression levels of stem cell markers in the PKH26-labeled ovarian
cancer cells from SKOV3-P and SKOV3-R tumors (Table I). PKH26hi cells in
SKOV3-P and SKOV3-R tumors expressed significantly higher levels of
all four stem cell markers as compared with PKH26low
cells (P<0.05). PKH26neg cells did not express the
stem cell markers. PKH26hi cells from SKOV3-R tumors
expressed significantly higher Nestin, Oct3/4, CD117 and CD44
protein (P=0.04, P=0.037, P=0.001, and P=0.04, respectively), as
compared with SKOV3-P-PKH26hi cells.
 | Table IProtein expression of stem cell
markers in the three sorted PKH26 cell clones from SKOV3-P and
SKOV3-R tumors. |
Table I
Protein expression of stem cell
markers in the three sorted PKH26 cell clones from SKOV3-P and
SKOV3-R tumors.
| Cell type | Nestin | Oct3/4 | CD117 | CD44 |
|---|
|
SKOV3-P-PKH26hi | 102.3±07.4 | 65.8±14.7 | 277.9±13.4 | 191.6±08.3 |
|
SKOV3-P-PKH26low | 18.4±08.4a | −16.1±16.5a | 111.6±10.4a | 66.2±05.5a |
|
SKOV3-P-PKH26neg | −70.2±34.9a | −104.4±30.2a | −16.3±16.5a | −28.5±26.6a |
|
SKOV3-R-PKH26hi | 142.5±14.0a | 120.4±13.3a | 321.1±09.4a | 228.4±06.3a |
|
SKOV3-R-PKH26low | 21.87±19.8b | 3.8±21.5b | 127.4±13.4b | 68.6±18.6b |
|
SKOV3-R-PKH26neg | −69.23±28.6b | −129.6±51.4b | −5.6±17.1b | −18.0±33.5b |
Label-retaining PKH26hi cells
exhibited colony formation capability and tumorigenicity and
cisplatin increased stem-like features
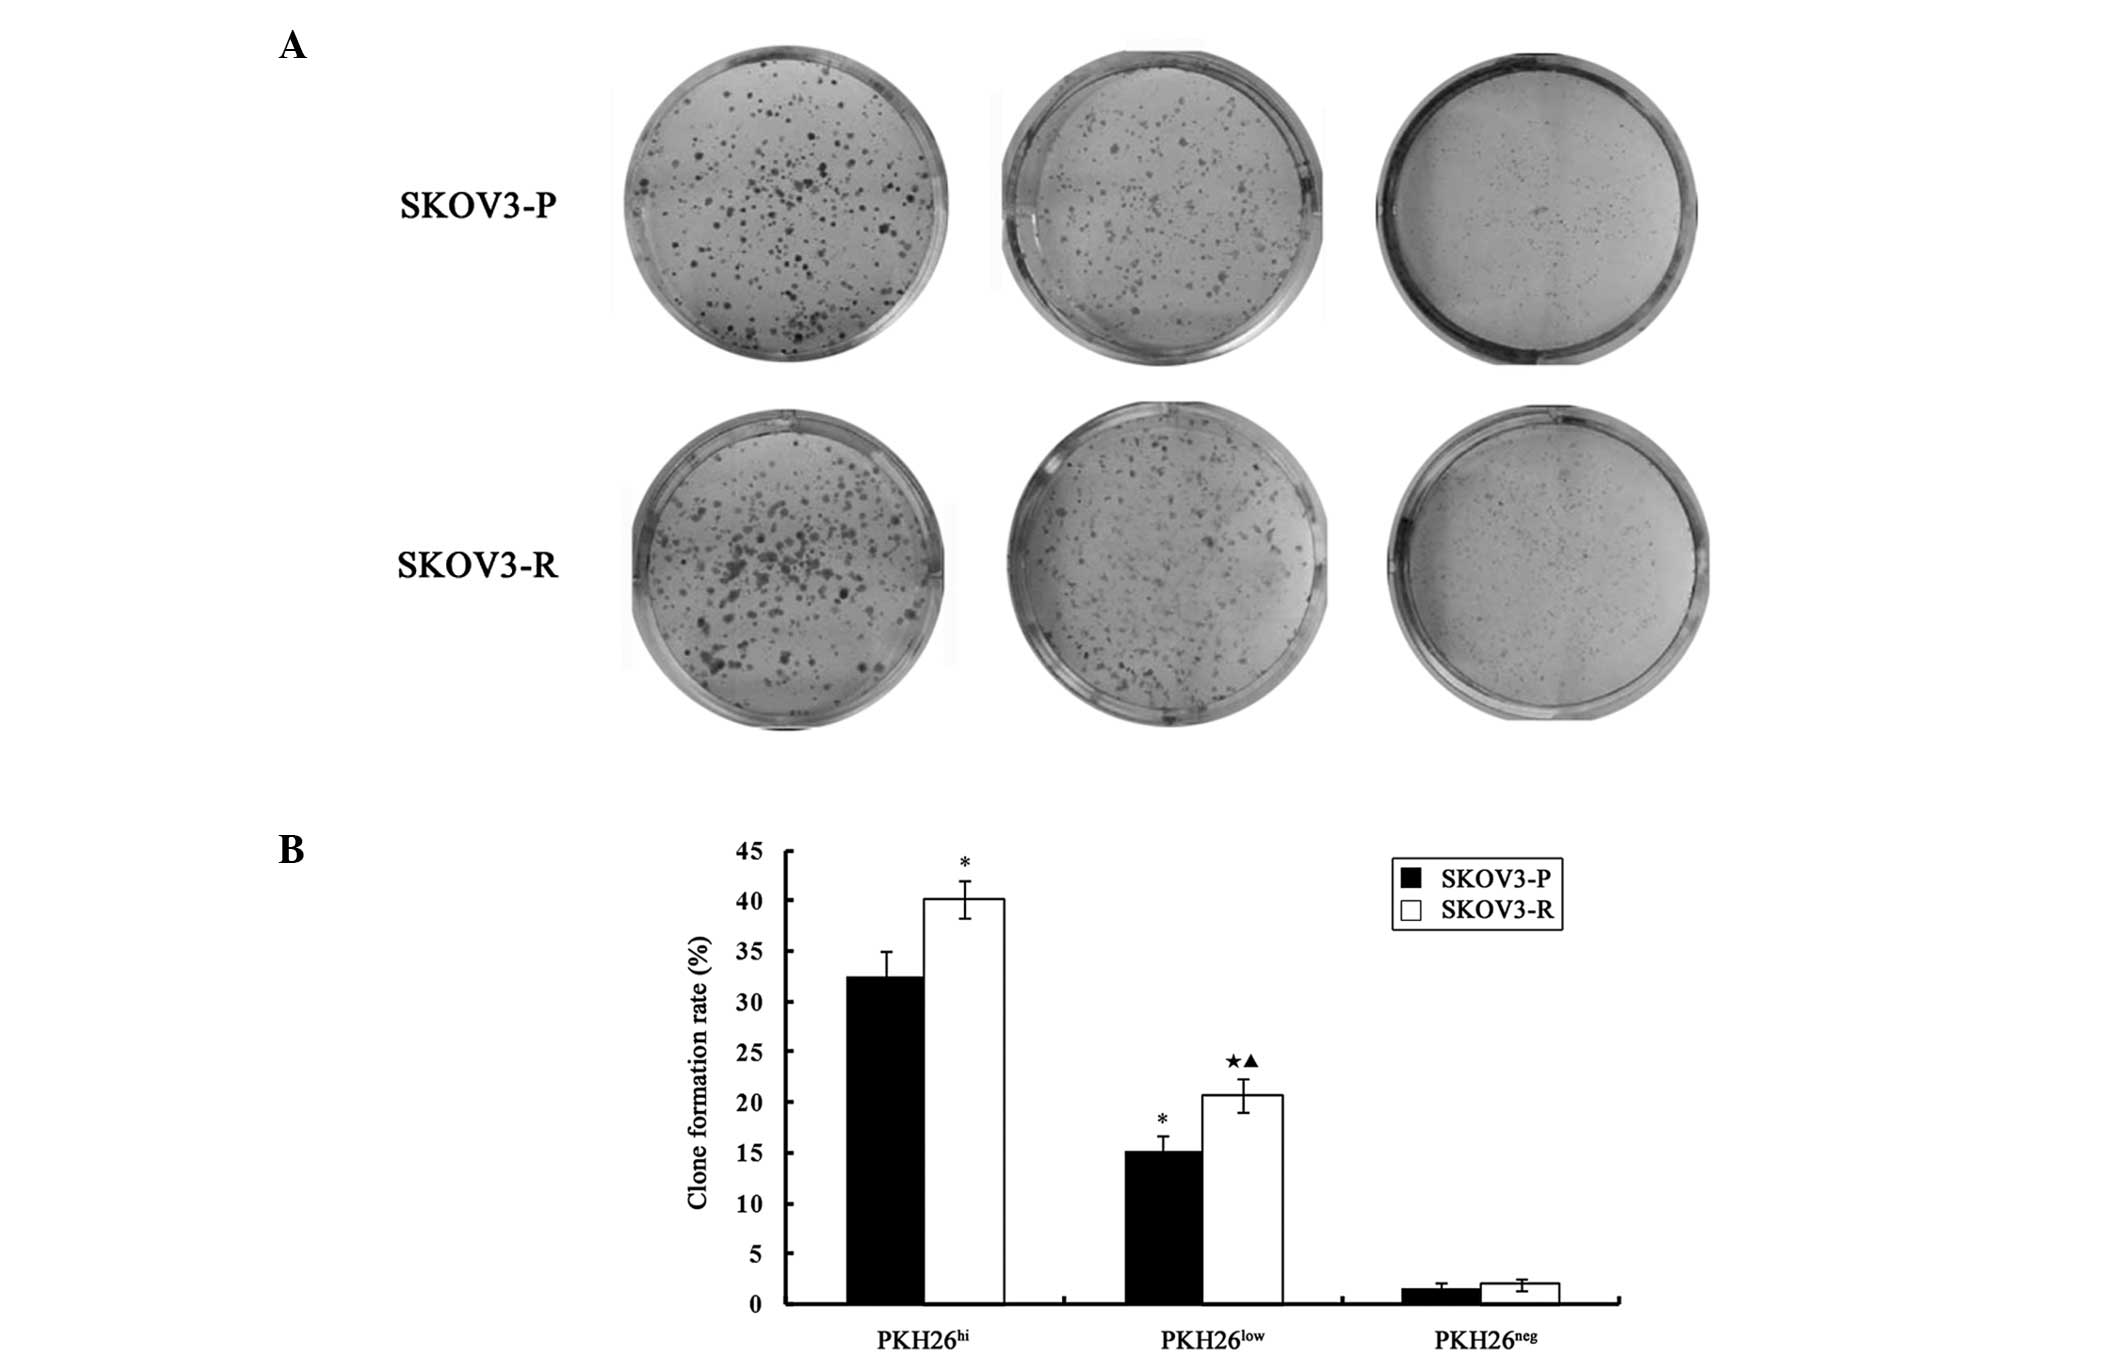
PKH26hi and PKH26low cells
demonstrated in vitro clonogenic capability, and the colony
formation rate of PKH26hi cells was significantly higher
as compared with PKH26low cells in SKOV3-P tumors
(t=11.029, P=0.001) and SKOV3-R tumors (t=13.81, P=0.000).
The colony formation capability was almost absent in
PKH26neg cells derived from SKOV3-P and SKOV3-R
cells.
As presented in Fig.
5, a significant difference was identified between the
clonogenic capability of SKOV3-P and SKOV3-R tumor cells. The rate
of colony formation was significantly higher in SKOV-R cells as
compared with SKOV3-P cells in PKH26hi (t=4.467,
P=0.011) and PKH26low (t=4.35, P=0.012)
cells.
The tumorigenicity of the three groups of screened
PKH26-retaining cells from SKOV3-P and SKOV3-R tumors was analyzed
in vivo (Table II). The
PKH26hi, PKH26low and PKH26neg
cells from SKOV3-P and SKOV3-R tumors were transplanted into
5–6-week-old female nude mice at densities of 10,000 or 20,000
cells/ml.
| Table IIIn vivo tumorigenicity of the
three screened groups of PKH26 retaining cells from SKOV3-P and
SKOV3-R cells. |
Table II
In vivo tumorigenicity of the
three screened groups of PKH26 retaining cells from SKOV3-P and
SKOV3-R cells.
| Cell type | Cell density | Tumor formation n
(%) |
|---|
|
SKOV3-P-PKH26hi | 10,000 | 3/6 (50) |
| 20,000 | 5/6 (83) |
|
SKOV3-P-PKH26low | 10,000 | 0/6 (0)a |
| 20,000 | 0/6 (0)a |
|
SKOV3-P-PKH26neg | 10,000 | 0/6 (0) |
| 20,000 | 0/6 (0) |
|
SKOV3-R-PKH26hi | 10,000 | 5/6 (83) |
| 20,000 | 6/6 (100) |
|
SKOV3-R-PKH26low | 10,000 | 0/6 (0)b |
| 20,000 | 2/6 (33)b |
|
SKOV3-R-PKH26neg | 10,000 | 0/6 (0) |
| 20,000 | 0/6 (0) |
In SKOV3-P tumors, PKH26hi cells
exhibited tumorigenicity at the two cell densities; the tumorigenic
rates were 50% (3/6) and 83% (5/6) in the 10,000 and 20,000
cells/ml groups, respectively. PKH26low and
PKH26neg cells did not exhibit tumorigenicity.
In SKOV3-R tumors, the highly tumorigenic nature of
the PKH26hi cells was clearly demonstrated at the two
cell densities, which were capable of developing tumors. The
tumorigenic rates were 83% (5/6) and 100% (6/6) in the 10,000 and
20,000 cells/ml groups, respectively. The minimum cell density of
tumor initiation for the PKH26hi cells was 20,000
cells/ml and the tumorigenic rate was 33% (2/6), whereas
tumorigenicity was absent in the PKH26neg cells at the
two cell densities.
Although there was no statistically significant
difference in the tumorigenic rate between
SKOV3-P-PKH26hi cells and SKOV3-R-PKH26hi
cells, SKOV3-R-PKH26hi cells exhibited slightly higher
tumorigenicity. A similar situation was observed in the
PKH26low cells at a cell density of 20,000 cells/ml
(P>0.05).
Discussion
Tumor dormancy is a stage of tumor progression in
which residual disease remains asymptomatic for an extended period
of time (28). The presence of
dormant tumor cells is an indicator of one of the earliest stages
in tumor development, or as minimal residual disease remaining
following the successful treatment of the primary tumor by surgical
resection and adjuvant treatment (29). Therefore, tumor dormancy is not
only a biological property of malignant tumor cells but also a
cause of treatment failure, metastasis and recurrence of
tumors.
In the current mouse xenograft models,
administration of cisplatin led to the inhibition of tumor growth,
and xenograft tumors (SKOV3-R tumors) coexisted with their host at
a stable size in contrast to the continuously growing SKOV3-P
tumors. Additionally, the toxic effects of cisplatin administration
in the treatment groups were observed. Although cisplatin induced
weight loss, leucopenia, short-time drowsiness, mild skin
discoloration and diet decline during the treatment period, the
mice exhibited a certain level of tolerance to the chemotherapy.
Accordingly, SKOV3-R tumors became drug-resistant following longer
periods of cisplatin administration.
Cisplatin is one of the most potent antitumor
agents, and has been used clinically for numerous years to treat a
wide variety of solid tumors, including head and neck, testicular,
ovarian, cervical and lung tumors (30). The cytotoxic mode of action of
cisplatin is mediated by its interaction with DNA to form DNA
adducts. Platinum-DNA adducts, which are formed following the
uptake of cisplatin into the nucleus of cells, activate several
cellular processes that mediate the cytotoxicity of
chemotherapeutic agents (31).
Cisplatin, like many other chemotherapeutic agents, targets rapidly
proliferating tumor cells because these cells can absorb more drug
into the nucleus, while reduced drug uptake may protect the
slow-proliferating tumor cells from chemotherapy. Therefore, it has
been predicted that subsequent to intensive and continuous
chemotherapy, residual tumor cells may be slow-proliferating cell
clones (32).
It is well established that tumors present genetic
complexity and heterogeneity; there are multiple subpopulations
(also known as subclones) of tumor cells in primary tumors and
these subsets have different proliferative capacities and
phenotypes (33–36). In the current study, a series of
cancer cell clones were successfully isolated from ovarian tumor
cells according to PKH26 intensity. These cell clones,
PKH26hi, PKH26low and PKH26neg
cells from SKOV3-P and SKOV3-R tumors, differed in their growth
rates and cell cycle distributions, indicating that ovarian cancer
cells within xenograft tumors were hierarchically organized,
composed of different proliferative subclones. PKH26hi
cells existed in SKOV3-P and SKOV3-R tumors and the majority of
these cells were arrested in the G0/G1 phase.
This result further confirmed that PKH26hi cells
represent dormant or slow-cycling cells. The findings of the
current study indicated that cisplatin administration augmented the
fraction of PKH26hi cells and reduced the fraction of
PKH26neg cells in SKOV3-R tumors, as compared with the
proportion of cells in SKOV3-P tumors. The majority of
chemotherapeutic agents have the ability to abolish proliferative
tumor cells and lead to tumor shrinkage. Thus, drug exposure
results in two possibilities: Proliferating cell remission reflects
an initial high therapeutic efficacy, or dormant cells may persist
within the host as minimal residual disease. It is reasonable that
drug exposure should lead to the enrichment of PKH26hi
cells, as cells undergoing quiescence or proliferation arrest
operate as a safeguard by limiting the extent of DNA damage against
chemotherapy.
Thus far, based on stem cell behavior in the normal
epithelium, at least four separate criteria have been established
for CSCs, including: (i) Self-renewal capacity (37), (ii) the capacity to remain
quiescent (38), (iii) resistance
to chemotherapy (39) and (iv)
enhanced tumorigenicity in mouse models (40). In the present study, the results
demonstrated that PKH26hi cells possessed stem-like
characteristics. PKH26hi cells proliferated slowly,
expressed higher levels of stem cell markers and possessed enhanced
clonogenic capability and tumorigenicity as compared with
PKH26low and PKH26neg cells. Most notably,
the results demonstrated that chemotherapy led to the enrichment of
PKH26hi cells, and that PKH26hi cells
exhibited significantly higher expression levels of stem cell
markers, clonogenic capability and higher tumorigenicity tendencies
in SKOV3-R tumors as compared with those in SKOV3-P tumors. CSCs in
primary tumors may avoid the first round of chemotherapy and/or
radiotherapy and gradually lead to tumor recurrence. The current
study indicated that cisplatin altered the proportion and stemness
of dormant stem-like SKOV3 PKH26hi cell clones. Cancer
cells are organized hierarchically within tumors and not all cells
are equal (38). Chemotherapy
and/or radiotherapy may alter this hierarchy. In the present study,
SKOV3-R-PKH26hi cells with enhanced stem-like features
suggested that chemotherapy may activate this pathway of subclone
transition. In the clinical practice, intensive and continuous
chemotherapy is also attributed to increased chemoresistance and
the formation of aggressive cancer cell clones in patients. A novel
challenge is the maintenance of the equilibrium between longer
high-quality survival and the optimal chemotherapy model. This new
optimal chemotherapy model should kill sensitive cancer cells and
enable patients to be asymptomatic, and would allow sensitive
cancer cells to be the dominant clone in residual tumor cell
clones.
In conclusion, the present study identified that
there were multiple cell clones (PKH26hi,
PKH26low and PKH26neg cells) in single cell
line-generated xenograft tumors, and these cell clones exhibited
various growth rates, cell cycle distributions and expression
profiles of stem cell markers. PKH26hi cells were
dormant or slow-cycling cells and exhibited stem-like properties.
To the best of our knowledge, the findings of the present study are
the first to demonstrate that chemotherapy leads to the enrichment
of PKH26hi cell clones, and seemly enhances the stemness
of SKOV3-R-PKH26hi cells. These dormant or slow-cycling
cell clones bearing stem cell properties may facilitate the
adaptation of cells to the foreign microenvironment and eventually
lead to drug resistance. Future studies are required to explore the
effects of different chemotherapeutic models on the equilibrium
between maintaining the chemotherapeutic sensitivity of residual
tumor cells and providing a longer survival and higher quality of
life for patients.
Acknowledgements
The present study was supported by the Natural
Science Foundation of Hebei Province, China (no. c2010002011).
References
|
1
|
Cannistra SA: Cancer of the ovary. N Engl
J Med. 351:2519–2529. 2004. View Article : Google Scholar : PubMed/NCBI
|
|
2
|
Levanon K, Crum C and Drapkin R: New
insights into the pathogenesis of serous ovarian cancer and its
clinical impact. J Clin Oncol. 26:5284–5293. 2008. View Article : Google Scholar : PubMed/NCBI
|
|
3
|
Thigpen JT, Aghajanian CA, Alberts DS, et
al: Role of pegylated liposomal doxorubicin in ovarian cancer.
Gynecol Oncol. 96:10–18. 2005. View Article : Google Scholar : PubMed/NCBI
|
|
4
|
Aguirre-Ghiso JA: Models, mechanisms and
clinical evidence for cancer dormancy. Nat Rev Cancer. 7:834–846.
2007. View Article : Google Scholar : PubMed/NCBI
|
|
5
|
Bhattacharyya S and Khanduja KL: New hope
in the horizon: cancer stems cells. Acta Biochim Biophys Sin
(Shanghai). 42:237–242. 2010. View Article : Google Scholar : PubMed/NCBI
|
|
6
|
Pelayo R, Miyazaki K, Huang J, et al: Cell
cycle quiescence of early lymphoid progenitors in adult bone
marrow. Stem Cells. 24:2703–2713. 2006. View Article : Google Scholar : PubMed/NCBI
|
|
7
|
Yahata T, Muguruma Y, Yumino S, et al:
Quiescent human hematopoietic stem cells in the bone marrow niches
organize the hierarchical structure of hematopoiesis. Stem Cells.
26:3228–3236. 2008. View Article : Google Scholar : PubMed/NCBI
|
|
8
|
Visvader JE and Lindeman GJ: Cancer stem
cells in solid tumours: accumulating evidence and unresolved
questions. Nat Rev Cancer. 8:755–768. 2008. View Article : Google Scholar
|
|
9
|
Morel AP, Lièvre M, Thomas C, et al:
Generation of breast cancer stem cells through
epithelial-mesenchymal transition. PLoS One. 3:e28882008.
View Article : Google Scholar : PubMed/NCBI
|
|
10
|
Hellsten R, Johansson M, Dahlman A,
Sterner O and Bjartell A: Galiellalactone inhibits stem cell-like
ALDH-positive prostate cancer cells. PLoS One. 6:e221182011.
View Article : Google Scholar : PubMed/NCBI
|
|
11
|
Belton A, Gabrovsky A, Bae YK, et al:
HMGA1 induces intestinal polyposis in transgenic mice and drives
tumor progression and stem cell properties in colon cancer cells.
PLoS One. 7:e300342012. View Article : Google Scholar : PubMed/NCBI
|
|
12
|
Rosen JM and Jordan CT: The increasing
complexity of the cancer stem cell paradigm. Science.
324:1670–1673. 2009. View Article : Google Scholar : PubMed/NCBI
|
|
13
|
Dubeau L: The cell of origin of ovarian
epithelial tumours. Lancet Oncol. 9:1191–1197. 2008. View Article : Google Scholar : PubMed/NCBI
|
|
14
|
Bapat SA: Human ovarian cancer stem cells.
Reproduction. 140:33–41. 2010. View Article : Google Scholar : PubMed/NCBI
|
|
15
|
Lendahl U, Zimmerman LB and McKay RD: CNS
stem cells express a new class of intermediate filament protein.
Cell. 60:585–595. 1990. View Article : Google Scholar : PubMed/NCBI
|
|
16
|
Ishiwata T, Matsuda Y and Naito Z: Nestin
in gastrointestinal and other cancers: effects on cells and tumor
angiogenesis. World J Gastroenterol. 17:409–418. 2011. View Article : Google Scholar : PubMed/NCBI
|
|
17
|
de Jong J and Looijenga LH: Stem cell
marker OCT3/4 in tumor biology and germ cell tumor diagnostics:
history and future. Crit Rev Oncog. 12:171–203. 2006.PubMed/NCBI
|
|
18
|
Hombach-Klonisch S, Paranjothy T, Wiechec
E, et al: Cancer stem cells as targets for cancer therapy: selected
cancers as examples. Arch Immunol Ther Exp (Warsz). 56:165–180.
2008. View Article : Google Scholar : PubMed/NCBI
|
|
19
|
Bapat SA, Mali AM, Koppikar CB and Kurrey
NK: Stem and progenitor-like cells contribute to the aggressive
behavior of human epithelial ovarian cancer. Cancer Res.
65:3025–3029. 2005.PubMed/NCBI
|
|
20
|
Sayed SI, Dwivedi RC, Katna R, et al:
Implications of understanding cancer stem cell (CSC) biology in
head and neck squamous cell cancer. Oral Oncol. 47:237–243. 2011.
View Article : Google Scholar : PubMed/NCBI
|
|
21
|
Yasui W, Sentani K, Sakamoto N, et al:
Molecular pathology of gastric cancer: research and practice.
Pathol Res Pract. 207:608–612. 2011. View Article : Google Scholar : PubMed/NCBI
|
|
22
|
Matsuda Y, Kure S and Ishiwata T: Nestin
and other putative cancer stem cell markers in pancreatic cancer.
Med Mol Morphol. 45:59–65. 2012. View Article : Google Scholar : PubMed/NCBI
|
|
23
|
Ma L, Lai D, Liu T, et al: Cancer
stem-like cells can be isolated with drug selection in human
ovarian cancer cell line SKOV3. Acta Biochim Biophys Sin
(Shanghai). 42:593–602. 2010. View Article : Google Scholar : PubMed/NCBI
|
|
24
|
Reber L, Da Silva CA and Frossard N: Stem
cell factor and its receptor c-Kit as targets for inflammatory
diseases. Eur J Pharmacol. 533:327–340. 2006. View Article : Google Scholar : PubMed/NCBI
|
|
25
|
Yue Z, Jiang TX, Widelitz RB and Chuong
CM: Mapping stem cell activities in the feather follicle. Nature.
438:1026–1029. 2005. View Article : Google Scholar : PubMed/NCBI
|
|
26
|
Martin-Padura I, Marighetti P, Agliano A,
et al: Residual dormant cancer stem-cell foci are responsible for
tumor relapse after antiangiogenic metronomic therapy in
hepatocellular carcinoma xenografts. Lab Invest. 92:952–966. 2012.
View Article : Google Scholar
|
|
27
|
Gao MQ, Choi YP, Kang S, Youn JH and Cho
NH: CD24+ cells from hierarchically organized ovarian
cancer are enriched in cancer stem cells. Oncogene. 29:2672–2680.
2010.PubMed/NCBI
|
|
28
|
Patel P and Chen EI: Cancer stem cells,
tumor dormancy, and metastasis. Front Endocrinol (Lausanne).
3:1252012.PubMed/NCBI
|
|
29
|
Páez D, Labonte MJ, Bohanes P, et al:
Cancer dormancy: a model of early dissemination and late cancer
recurrence. Clin Cancer Res. 18:645–653. 2012.PubMed/NCBI
|
|
30
|
Rabik CA and Dolan ME: Molecular
mechanisms of resistance and toxicity associated with platinating
agents. Cancer Treat Rev. 33:9–23. 2007. View Article : Google Scholar : PubMed/NCBI
|
|
31
|
Martin LP, Hamition TC and Schilder RJ:
Platinum resistance: the role of DNA repair pathways. Clin Cancer
Res. 14:1291–1295. 2008. View Article : Google Scholar : PubMed/NCBI
|
|
32
|
Kusumbe AP and Bapat SA: Cancer stem cells
and aneuploid populations within developing tumors are the major
determinants of tumor dormancy. Cancer Res. 69:9245–9253. 2009.
View Article : Google Scholar
|
|
33
|
Fleuren GJ, Gorter A, Kuppen PJ, Litvinov
S and Warnaar SO: Tumor heterogeneity and immunotherapy of cancer.
Immunol Rev. 145:91–122. 1995. View Article : Google Scholar : PubMed/NCBI
|
|
34
|
Reya T, Morrison SJ, Clarke MF and
Weissman IL: Stem cells, cancer, and cancer stem cells. Nature.
414:105–111. 2001. View Article : Google Scholar : PubMed/NCBI
|
|
35
|
Yaqui-Beltrán A, He B and Jablons DM: The
role of cancer stem cells in neoplasia of the lung: past, present
and future. Clin Transl Oncol. 10:719–725. 2008.PubMed/NCBI
|
|
36
|
Shackleton M: Normal stem cells and cancer
stem cells: similar and different. Semin Cancer Biol. 20:85–92.
2010. View Article : Google Scholar : PubMed/NCBI
|
|
37
|
Dalerba P, Cho RW and Clarke MF: Cancer
stem cells: models and concepts. Annu Rev Med. 58:267–284. 2007.
View Article : Google Scholar : PubMed/NCBI
|
|
38
|
Friel AM, Sergent PA, Patnaude C, et al:
Functional analyses of the cancer stem cell-like properties of
human endometrial tumor initiating cells. Cell Cycle. 7:242–249.
2008. View Article : Google Scholar : PubMed/NCBI
|
|
39
|
Hermann PC, Huber SL, Herrler T, et al:
Distinct populations of cancer stem cells determine tumor growth
and metastatic activity in human pancreatic cancer. Cell Stem Cell.
1:313–323. 2007. View Article : Google Scholar : PubMed/NCBI
|
|
40
|
Li C, Heidt DG, Dalerba P, et al:
Identification of pancreatic cancer stem cells. Cancer Res.
67:1030–1037. 2007. View Article : Google Scholar : PubMed/NCBI
|
|
41
|
Gilbertson RJ and Graham TA: Cancer:
Resolving the stem-cell debate. Nature. 488:462–463. 2012.
View Article : Google Scholar : PubMed/NCBI
|