Introduction
Colorectal cancer (CRC) is the most common
malignancy of the digestive tract worldwide (1), and the incidence is steadily
increasing, partly as a result of recent changes in lifestyle and
dietary habits (2). Survival rates
in CRC depend on early diagnosis and treatment. However, the lack
of a reliable biomarkers of CRC remains a significant obstacle to a
timely diagnosis.
Recent studies have suggested that dysregulation of
microRNAs (miRNAs) is an important step in the development of a
number of types of cancer, including CRC. miRNAs may function as
potent regulators of gene expression and altered miRNA levels may
result in the aberrant expression of gene products that are
involved in tumorigenesis (3).
miR-133b was initially hypothesized to be a muscle-enriched miRNA.
Through targeting of genes involved in cardiac development and
cardiac channel expression, miR-133b has been implicated in the
regulation of cardiac myogenesis and cardiac ion channel expression
(4). It has recently been reported
that the expression of miR-133b is downregulated in gastric and
esophageal adenocarcinomas as well as colorectal tumors (5,6).
However, its role and relevance in colorectal cancer remains
largely unknown.
Connective tissue growth factor (CTGF) is a member
of the CCN cysteine-rich family of proteins. These proteins are
known to stimulate mitosis, adhesion, apoptosis, extracellular
matrix production, growth arrest and migration in numerous cell
types (7). CTGF is known to be
important in the prevention of hypoxia-induced apoptosis and the
promotion of epithelial-mesenchymal transistion (EMT) in
tumor-reactive stroma; in addition, CTGF has been shown to be
involved in the development of malignancy in a number of organs
(8). A series of studies have
suggested that a high level of CTGF expression is associated with
tumor progression and clinical stage (9–14).
CTGF expression is induced by transforming growth factor (TGF)-β as
well as other prohypertrophic stimuli, such as endothelin. In
addition, studies have reported that the regulation of CTGF
expression may be correlated with that of miR-145 and miR-30
(4,15). Of note, a bioinformatics targetscan
analysis indicated putative miR-133b binding sites within the
3′-untranslated region (UTR) of CTGF.
In the present study, the expression pattern of
miR-133b and CTGF was examined in human CRC tissues and CRC cell
lines. In addition, the possible target genes of miR-133b were
identified. Furthermore, the association between the expression of
miR-133b and CTGF and various clinicopathological parameters was
investigated.
Materials and methods
Cell culture and reagents
Human HT-29 and SW-620 CRC cell lines were obtained
from the Cell Center of Xiangya School of Medicine, Central South
University (Hunan, China). The human CCD-18Co healthy colon cell
line was obtained from the American Type Culture Collection
(Manassas, VA, USA). RPMI-1640 was obtained from Invitrogen Life
Technologies (Carlsbad, CA, USA). Fetal bovine serum (FBS) was
purchased from Sijiqing Biological Engineering Materials Co., Ltd.
(Hangzhou, China). Cells were cultured at 37°C in a humidified
incubator with 5% CO2 and maintained in RPMI-1640
supplemented with heat-inactivated 10% FBS (Invitrogen, Carlsbad,
CA, USA), 100 U/ml penicillin and 100 μg/ml streptomycin (Sijiqing
Biological Engineering Materials Co., Ltd). Serum-free
Opti-MEM® medium was obtained from Invitrogen Life
Technologies. Protease inhibitor was obtained from AppliChem
(Gatersleben, Germany). miR-133b mimics and the miR-133b inhibitor
were synthesized by Shanghai GenePharma Co., Ltd (Shanghai, China).
The transfection reagent Lipofectamine 2000 was obtained from
Invitrogen Life Technologies. Primers for CTGF, miR-133b and
U6-snRNA were synthesized by Changsha YRBIO Co., Ltd (Changsha,
China). CTGF goat polyclonal antibody was obtained from Santa Cruz
Biotechnology (Dallas, TX, USA). GAPDH rabbit polyclonal antibody
was obtained from Proteintech Group, Inc. (Chicago, IL, USA). The
horseradish peroxidase (HRP)-goat anti-rabbit antibody and the
HRP-rabbit anti-goat antibody used for western blot analysis were
obtained from Zhong Shan Goldenbridge Biotechnology Co., Ltd
(Beijing, China). The PCR 2.1 vector was purchased from Invitrogen
Life Technologies.
Plasmid construction and
transfection
The miR expression vector pYr-pri-miRNA (YRBIO Co.
Ltd) was used to construct a pYr-pri-Homo sapiens
(hsa)-mir-133b plasmid. Human genome DNA was used as the template.
A fragment of ~600 bp containing pri-miR-133b was cloned into the
pYr vector. HT-29 and SW-620 cells were seeded at 3×10⁴
cells per well in 12-well plates and transfected the following day
in Opti-MEM medium with pYr-pri-hsa-mir-133b plasmid (80 nmol/l;
Shanghai GenePharma Co., Ltd.) using Lipofectamine 2000. Cells were
harvested three days prior to transfection.
RNA labeling and microarray
hybridization
The CRC cell lines and transfected cell lines were
sent to CapitalBio (Beijing, China) for microarray hybridization.
Cells were centrifuged in RNase-free tubes treated with
TRIzol® reagent (Invitrogen Life Technologies) and
stored at −80°C prior to RNA extraction, which was performed
according to the manufacturer’s instructions (Invitrogen Life
Technologies). The RNA was purified using the NucleoSpinH RNA clean
up kit (Macherey-Nagel, Düren, Germany). RNA concentration was
assessed by Nanodrop 2000 spectrophotometry (Thermo Fisher
Scientific, Waltham, MA, USA). RNA quality was determined by
formaldehyde denaturation electrophoresis, and only those samples
showing no degradation (ratios approaching 2:1 for the 28S and 18S
bands) were used to generate labeled targets. Each RNA sample was
hybridized to one Roche NimbleGen Porcine Genome Expression Array
(Roche, Basel, Switzerland). Briefly, double-stranded cDNA was
synthesized from 6 mg total RNA using a T7-oligo (dT) primer. The
cDNA was further purified and converted into cRNA using an in
vitro transcription reaction. 5 mg cRNA was reverse transcribed
to cDNA, fragmented and then labeled with Cy5-dCTP and Cy3-dCTP (GE
Healthcare, Little Chalfont, UK) using Taq DNA enzyme (Carolina
Biosystems, Beijing, China). These labeled cDNA fragments were
hybridized for 16 h at 45°C using the 2X GE Hybridization Buffer
(Roche Genome Expression Array kit; Roche). The GeneChips were then
washed, stained and scanned with an Agilent G2565CA Microarray
Scanner (Agilent Technologies, Santa Clara, CA, USA).
Data analysis
Agilent Feature Extraction software (version
11.0.1.1; Agilent Technologies) was used to analyze the acquired
array images. Quantile normalization and subsequent data processing
were conducted using the GeneSpring GX v12.0 software package
(Agilent Technologies). Following quantile normalization of the raw
data, genes with ≥1 out of 2 samples with raw data in the
microarray were selected for further data analysis. Differential
expression of genes was considered significant if the false
discovery rate (FDR) was calculated to the correct P-value
(controlling the expected FDR to no more than 5%) and the fold
change >|1.5|. Hierarchical clustering was performed using the
Agilent GeneSpring GX software (version 12.0; Agilent
Technologies).
RNA extraction and reverse
transcription-quantitative polymerase chain reaction (RT-qPCR)
Total RNA was isolated using E.Z.N.A.®
Total RNA kit II (Omega Bio-Tek Inc., Norcross, GA, USA). miRNA was
isolated using E.Z.N.A. PF miRNA Isolation kit (Omega Bio-Tek
Inc.). Large RNA reverse transcription was performed using the
RevertAid first-strand cDNA synthesis kit (Thermo Fisher Scientific
Inc., Vilnius, Lithuania). miRNA reverse transcription was
performed using an All-in-One™ miRNA qRT-PCR Detection kit
(GeneCopoeia, Inc., Rockville, MD, USA). qPCR was performed using
Real-Time Quantitative PCR SYBR Green detection reagent (Cowin
Biotech Co., Ltd., Beijing, China). miRNA qRT-PCR was performed
using All-in-One™ miRNA qRT-PCR Detection kit (GeneCopoeia, Inc.).
Primers utilized for cDNA amplification are summarized in Table I. The following reaction conditions
were used: An initial 10 min at 95°C; then 40 cycles of 20 sec at
94°C, 15 sec at 59°C and 30 sec at 72°C. The standard PCR reaction
mixture then underwent a final extension for 5 min at 72°C, while
the quantitative PCR mixture was subjected to melting curve
analysis to validate the reaction product specificity. The relative
expression of CTGF was normalized to that of GAPDH using the
2−ΔΔCT-method. The relative expression of miR-133b was
normalized to that of U6-snRNA using the 2−ΔΔCT-method.
Each sample was amplified in triplicate.
 | Table IPrimers for reverse
transcription-quantitative polymerase chain reaction. |
Table I
Primers for reverse
transcription-quantitative polymerase chain reaction.
| Gene detected | Primer | Sequence | Product size |
|---|
| CTGF | Forward |
TGGCAGGCTGATTTCTAGGT | 191 bp |
| Reverse |
GGTGCAAACATGAACTTTTGG | |
| miR-133b | Forward |
CTTTGGTCCCCTTCAACCA | 72 bp |
| Reverse | GTGCAGGGTCCGAGGT | |
| U6 | Forward |
CTCGCTTCGGCAGCACA | 94 bp |
| Reverse |
AACGCTTCACGAATTTGCGT | |
| GAPDH | Forward |
GAAGGTGAAGGTCGGAGT | 155 bp |
| Reverse |
CATGGGTGGAATCATATTGGAA | |
Dual-luciferase reporter gene
analyses
SW-620 and HT-29 cells were seeded in a 96-well
plate at 2×10⁴ cells per well and incubated overnight.
miR-133b was transfected into SW-620 and HT-29 cells using
Lipofectamine 2000. At 24 h after transfection, cells were
transfected with the pYr-MirTarget Renilla luciferase plasmid in
combination with the CTGF 3′-UTR expression plasmid (Cignal
Reporter Assay kit; Qiagen, Hilden, Germany). Cells were harvested
at 48 h following transfection and assayed for luciferase activity
using the Dual-Luciferase Reporter Assay System (Promega Corp.,
Madison, WI, USA). Luciferase activity was normalized against that
of Renilla luciferase. Luminescence was quantified with a
luminometer (Sirius single tube luminometer, Belthold, Wildbad,
Germany). All experiments were performed in triplicate.
Tissue specimens
The human CRC tissues (histologically confirmed as
adenocarcinoma of the colon) and adjacent non-cancerous tissue
counterparts used for RT-qPCR and western blotting were obtained
from patients who underwent surgical resection of CRC at the Third
Affiliated Hospital of Central South University (Hunan, China) once
written informed consent had been obtained. All specimens were snap
frozen in liquid nitrogen for 24 h and then stored at −80°C prior
to further processing. The study was approved by the ethics
committee of the Third XiangYa Hospital of Central South University
(Hunan, China). Patient consent was obtained from the patient as
well as the patient’s family.
Western blot analysis
Total protein from tissues samples and the cultured
cell lines was harvested in a radioimmunoprecipitation assay lysis
buffer (Sigma-Aldrich Co, St. Louis, MO, USA). A volume of extract
equivalent to 100 μg total protein was separated by 7.5% SDS-PAGE
(Well Biological Co., Ltd, Changsha, China) and transferred onto
polyvinylidene difluoride membranes (Invitrogen Life Technologies).
The membranes were incubated with Tris-buffered saline and Tween-20
(TBST) (Well Biological Co., Ltd) containing 5% skimmed milk at 4°C
overnight. Membranes were then incubated with the following primary
antibodies: goat anti-CTGF polyclonal antibody (1:500) and GAPDH
rabbit polyclonal antibody (1:2,000), at room temperature for 2 h.
The membranes were then washed three times with TBST and incubated
with HRP-conjugated rabbit anti-goat antibody (1:10,000) and
HRP-conjugated goat anti-rabbit antibody (1:2,000) for 1 h.
Membranes were then washed three times with TBST and treated with
western blotting luminal reagent (Pierce ECL Western Blotting kit;
Thermo Fisher Scientific Inc., Vilnius, Lithuania) for band
visualization, the results were obtained using an ImageQuant LAS
350 (GE Healthcare) and quantified by densitometry. Blots were
performed in triplicate.
Statistical analysis
All statistical analyses were conducted using the
SPSS version 16.0 software package (SPSS, Inc., Chicago, IL, USA).
Data are expressed as the mean ± standard deviation. Differences
between groups were compared using analysis of variance and
two-tailed t-tests. The χ2 test was used to analyze the
significance of the association between miR-133b expression and
clinicopathological characteristics. Each experiment was performed
independently at least twice and obtained similar results.
P<0.05 was considered to indicate a statistically significant
difference.
Results
Microarray analysis of CRC cell
lines
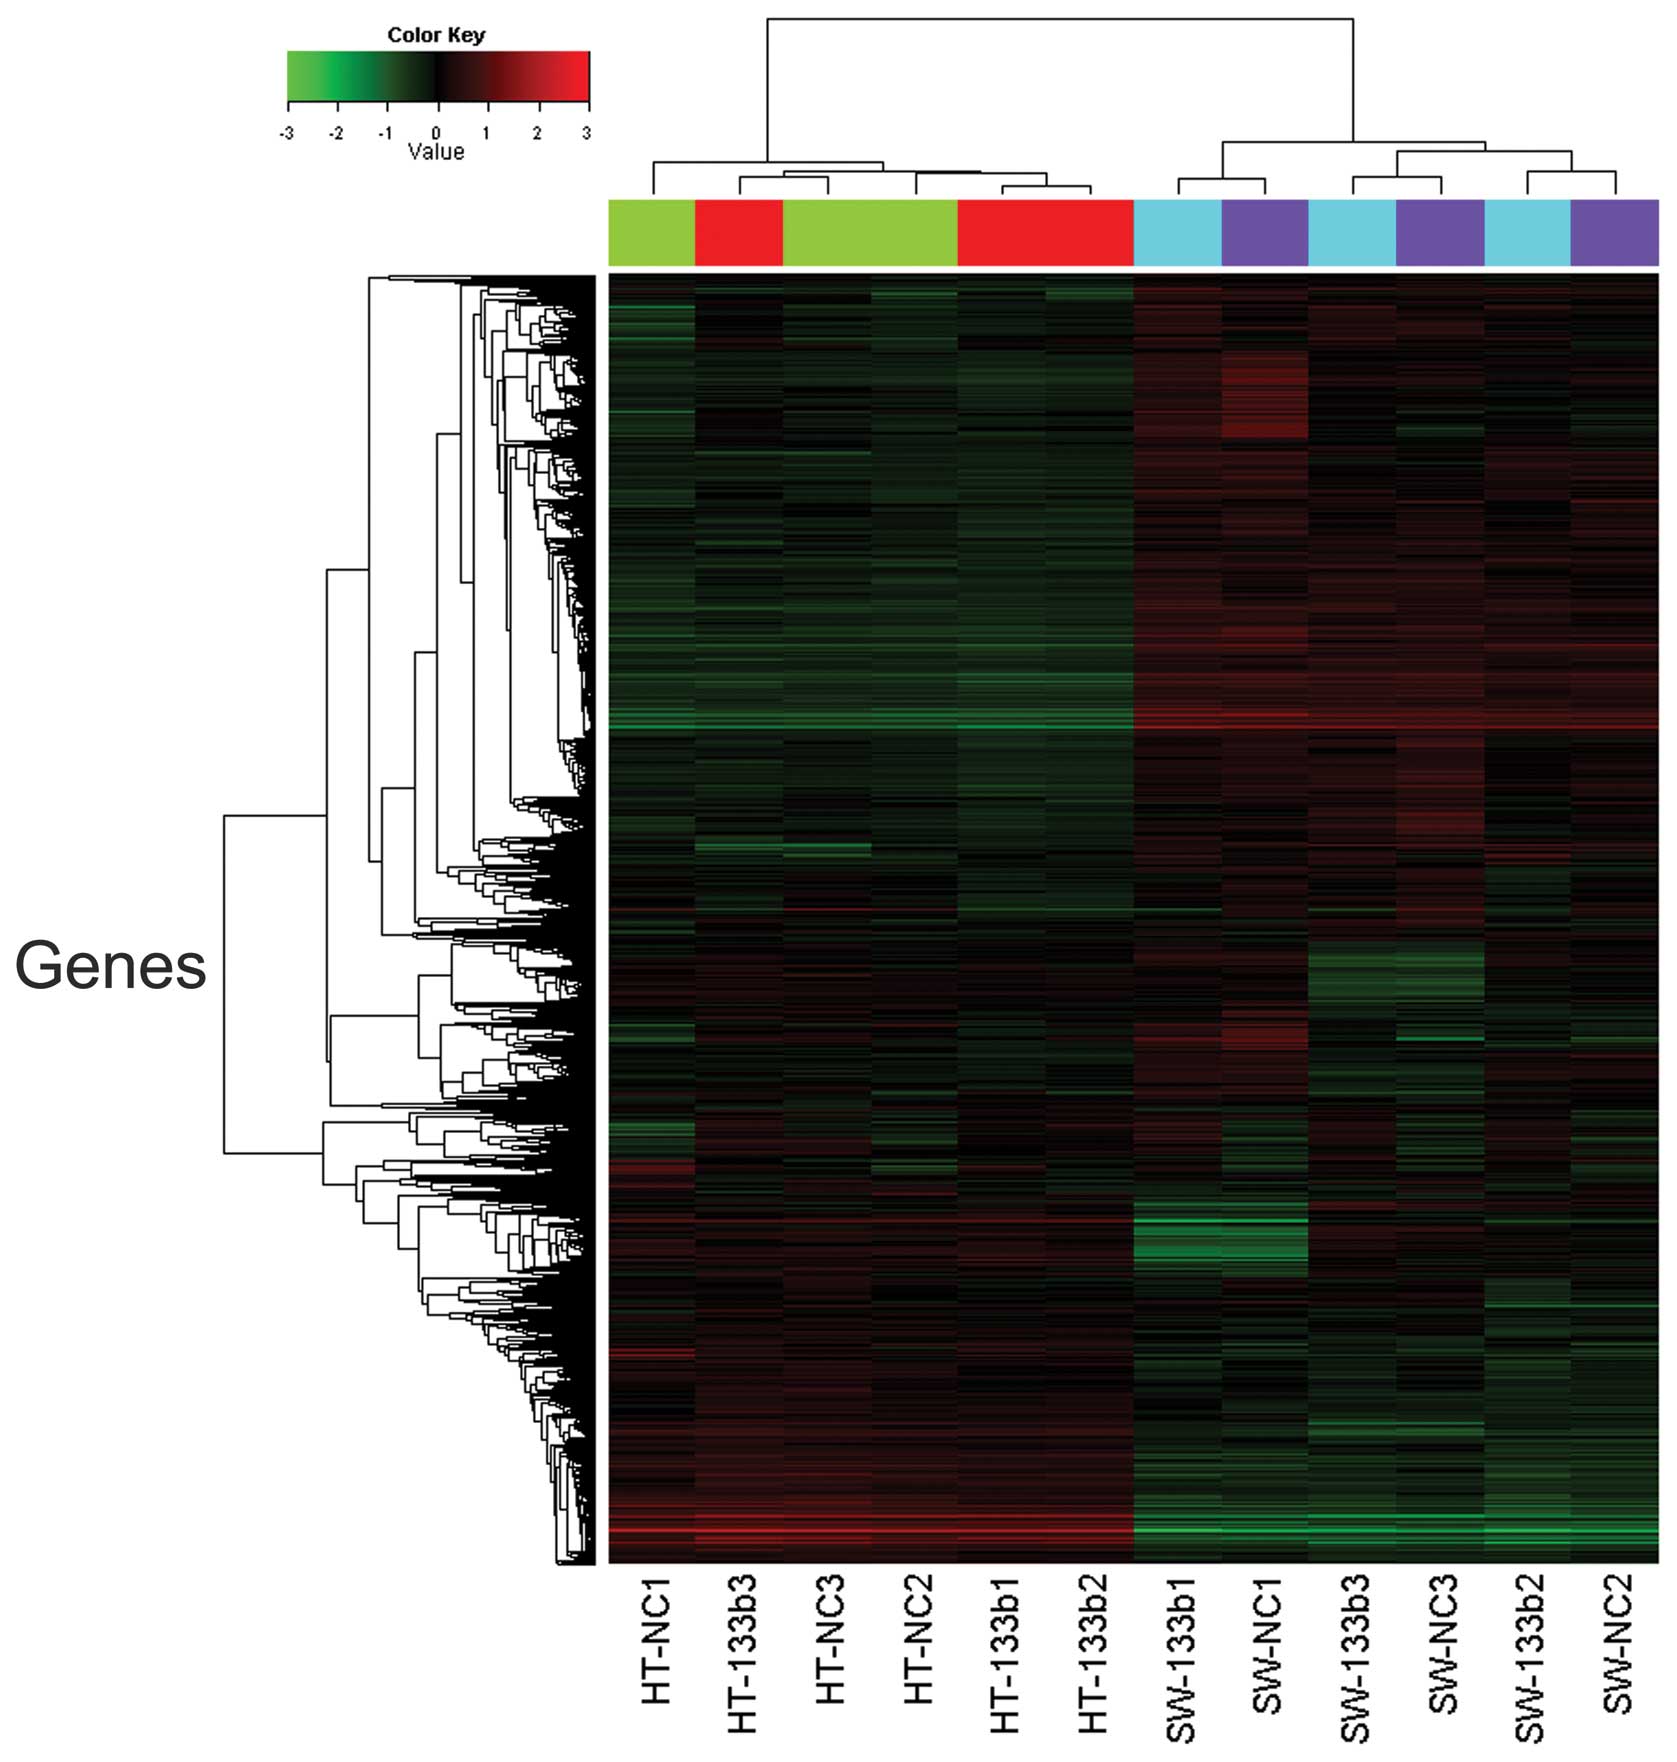
In order to investigate whether there was an effect
of miR-133b on the expression of individual genes, cluster analysis
was performed to organize genes into clusters based on the
similarities of their expression levels. Statistical analysis using
an unpaired t-test demonstrated that a total of 103 genes were
differentially expressed (72 upregulated and 31 downregulated)
between HT-29 and SW-620 cells (Fig.
1). The 20 genes downregulated to the greatest extent were
differentially expressed in miR-133b-transfected HT-29 and SW-620
cells, compared with the corresponding type of untransfected cells,
with the fold change calculated based on the mean value of the two
cell groups (Table II). CTGF was
identified by microarray analysis as a potential target candidate
of miR-133b interaction (log FC=−4.41, FDR<0.05) and was
selected for further study.
| Table IIList of top 20 differentially
expressed genes in miR-133b-transfected HT-29 and SW-620 cells. |
Table II
List of top 20 differentially
expressed genes in miR-133b-transfected HT-29 and SW-620 cells.
| Accession number | Gene symbol | Fold change | Regulation |
|---|
| NM_019899 | ABCC1 | 6.0329833 | Downregulated |
| NM_012244 | SLC7A8 | 4.2845231 | Downregulated |
| NM_004156 | PPP2CB | 4.0159174 | Downregulated |
| NM_001664 | RhoA | 3.6389074 | Downregulated |
| NM_004994 | MMP9 | 3.3274931 | Downregulated |
| NM_022075 | CERS2 | 3.2985491 | Downregulated |
| NM_144649 | TMEM71 | 2.8322382 | Downregulated |
| NM_000627 | LTBP1 | 2.7411814 | Downregulated |
| NM_022068 | PIEZO2 | 2.7360535 | Downregulated |
| NM_001901 | CTGF | 2.6958947 | Downregulated |
| NM_182485 | CPEB2 | 2.5642369 | Downregulated |
| NM_003706 | PLA2G4C | 2.5298514 | Downregulated |
| NM_030762 | BHLHE41 | 2.4895813 | Downregulated |
| NM_001771 | CD22 | 2.3959713 | Downregulated |
| NM_001430 | EPAS1 | 2.3748767 | Downregulated |
| NM_003948 | CDKL2 | 2.3225446 | Downregulated |
| NM_007129 | ZIC2 | 2.3078060 | Downregulated |
| NM_006398 | UBD | 2.2501510 | Downregulated |
| NM_001018077 | NR3C1 | 2.1797345 | Downregulated |
| NM_001266 | CES1 | 2.1734946 | Downregulated |
CTGF is a direct target of miR-133b
As miRNAs have been implicated in the repression of
gene expression, it was hypothesized that miR-133b may target a
negative regulator of the expression of CTGF. Using computational
screening (TargetScan; Whitehead institute for Biomedical Research,
www.targetscan.org), it was shown that the 3′UTR of
CTGF contains a potential binding site for miR-133b (Fig. 2A). The transfection efficiency of
synthetic miR-133b was evaluated in the human HT-29 and SW-620 CRC
cell lines. As shown in Fig. 2B,
RT-qPCR analysis demonstrated that miR-133b levels in
miR-133b-transfected cells were significantly higher than those in
untransfected or control-transfected cells (HT-29 cells, P<0.01;
SW-620 cells, P<0.01).
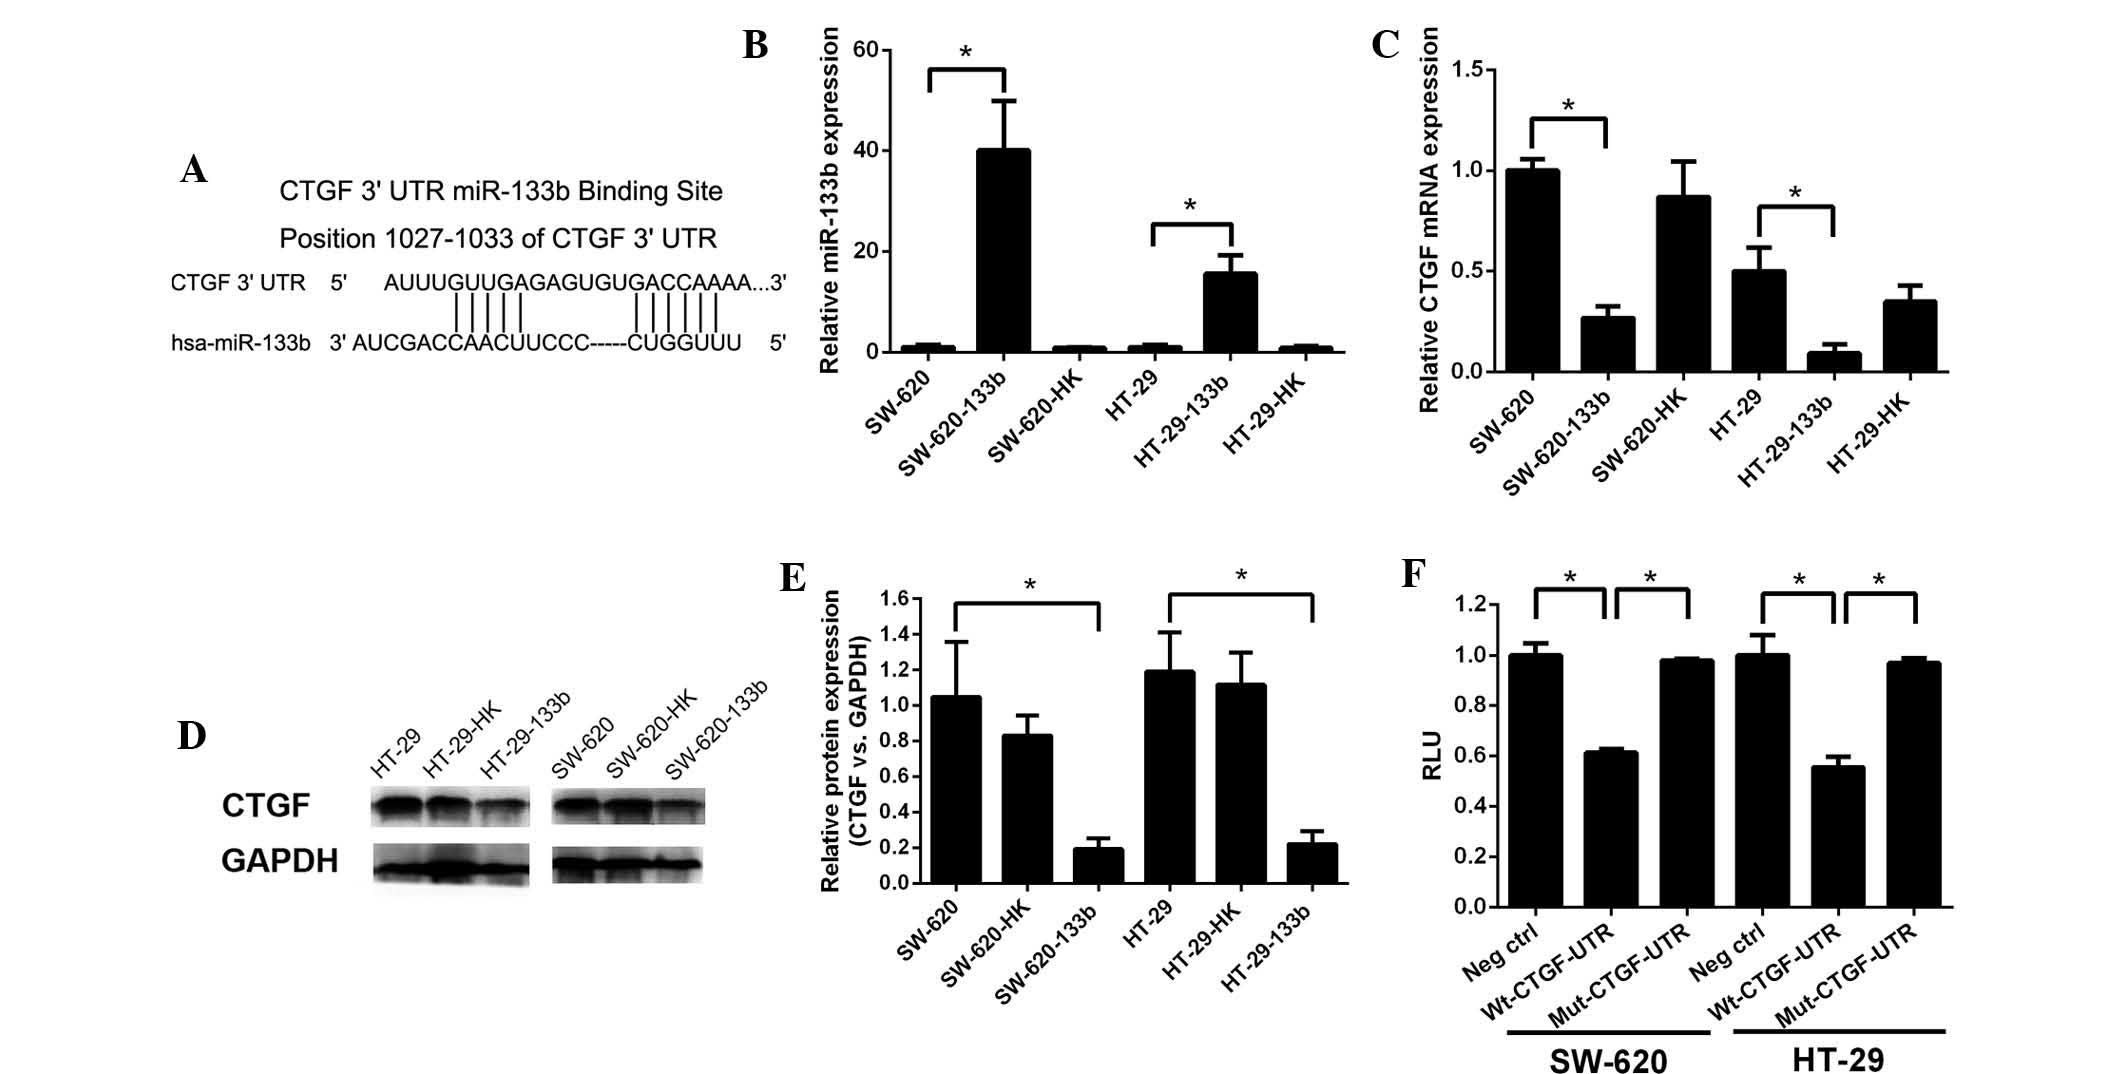 | Figure 2Posttranscriptional repression of CTGF
expression by miR-133b. (A) Position of the miR-133b target site
along the 3′-UTR of CTGF predicted by miRBase targets. (B)
Endogenous miR-133b levels were assessed by RT-qPCR. (C) Endogenous
CTGF levels were confirmed by RT-qPCR. (D) Protein expression of
CTGF was determined by western blot analysis. (E) CTGF protein
levels are expressed as a percentage relative to GAPDH in HT-29 and
SW-620 cells. Following transfection with the miR-133b expressing
vector, HT-29 and SW-620 cells exhibited a significant decrease in
CTGF expression. (F) Luciferase assay. SW-620 and HT-29 cells were
cotransfected with miR-133b vectors together with a firefly
luciferase vector, containing CTGF 3′-UTR or mutant CTGF 3′-UTR,
and a Renilla luciferase control. Histogram indicates the RLU in
different transfected cells. All experiments were repeated three
times. Columns and bars represent the mean and standard deviation,
respectively. *P<0.05. CTGF, connective tissue growth
factor; miR-133b, microRNA-133b; RT-qPCR, reverse
transcription-quantitative polymerase chain reaction; RLU, relative
luciferase unit; Wt, wild-type; Mut, mutated; hsa, Homo
sapiens. |
In order to investigate whether miR-133b expression
influenced CTGF expression, mRNA and protein levels of CTGF were
examined in miR-133b-transfected cell lines (Fig. 2C–E). miR-133b transfection
significantly reduced the levels of CTGF mRNA compared with those
in untransfected or control-transfected cells (SW-620 cells,
P<0.01; HT-29 cells, P<0.05; Fig. 2C). Western blot analysis showed
that the protein levels of CTGF were also downregulated following
overexpression of miR-133b in SW-620 and HT-29 cells, compared with
those in the controls (Fig. 2D).
Quantification of protein bands revealed a four-fold decrease in
CTGF protein following overexpression of miR-133b (P<0.05;
Fig. 2E).
In order to determine whether the observed reduction
in CTGF expression is directly driven by miR-133b, reporter gene
assays were conducted in HT-29 and SW-620 cells. The entire 3′UTR
of CTGF was cloned into the pYr-MirTarget-control vector, creating
a luciferase reporter gene containing the seed match for miR-133b.
In addition, a mutated reporter construct was generated, in which
the miR-133b seed match sequence was deleted from the 3′UTR of
CTGF. Co-transfection with the CTGF wild-type-3′UTR construct and
miR-133b yielded a significantly reduced relative luciferase
activity (SW-620 cells, P<0.05; HT-29 cells, P<0.05; Fig. 2F). However, the luciferase activity
of the reporter construct that had been mutated at the specific
miR-133b target site was not reduced in comparison with that in
untransfected cells, when simultaneously transfected with miR-133b
(SW-620 cells, P<0.05; HT-29 cells, P<0.05; Fig. 2F). This suggested that the 3′-UTR
of CTGF is a functional target site for miR-133b in HT-29 and
SW-620 cancer cells.
Verification that CTGF expression is
inversely correlated with miR-133b expression in human CRC
specimens
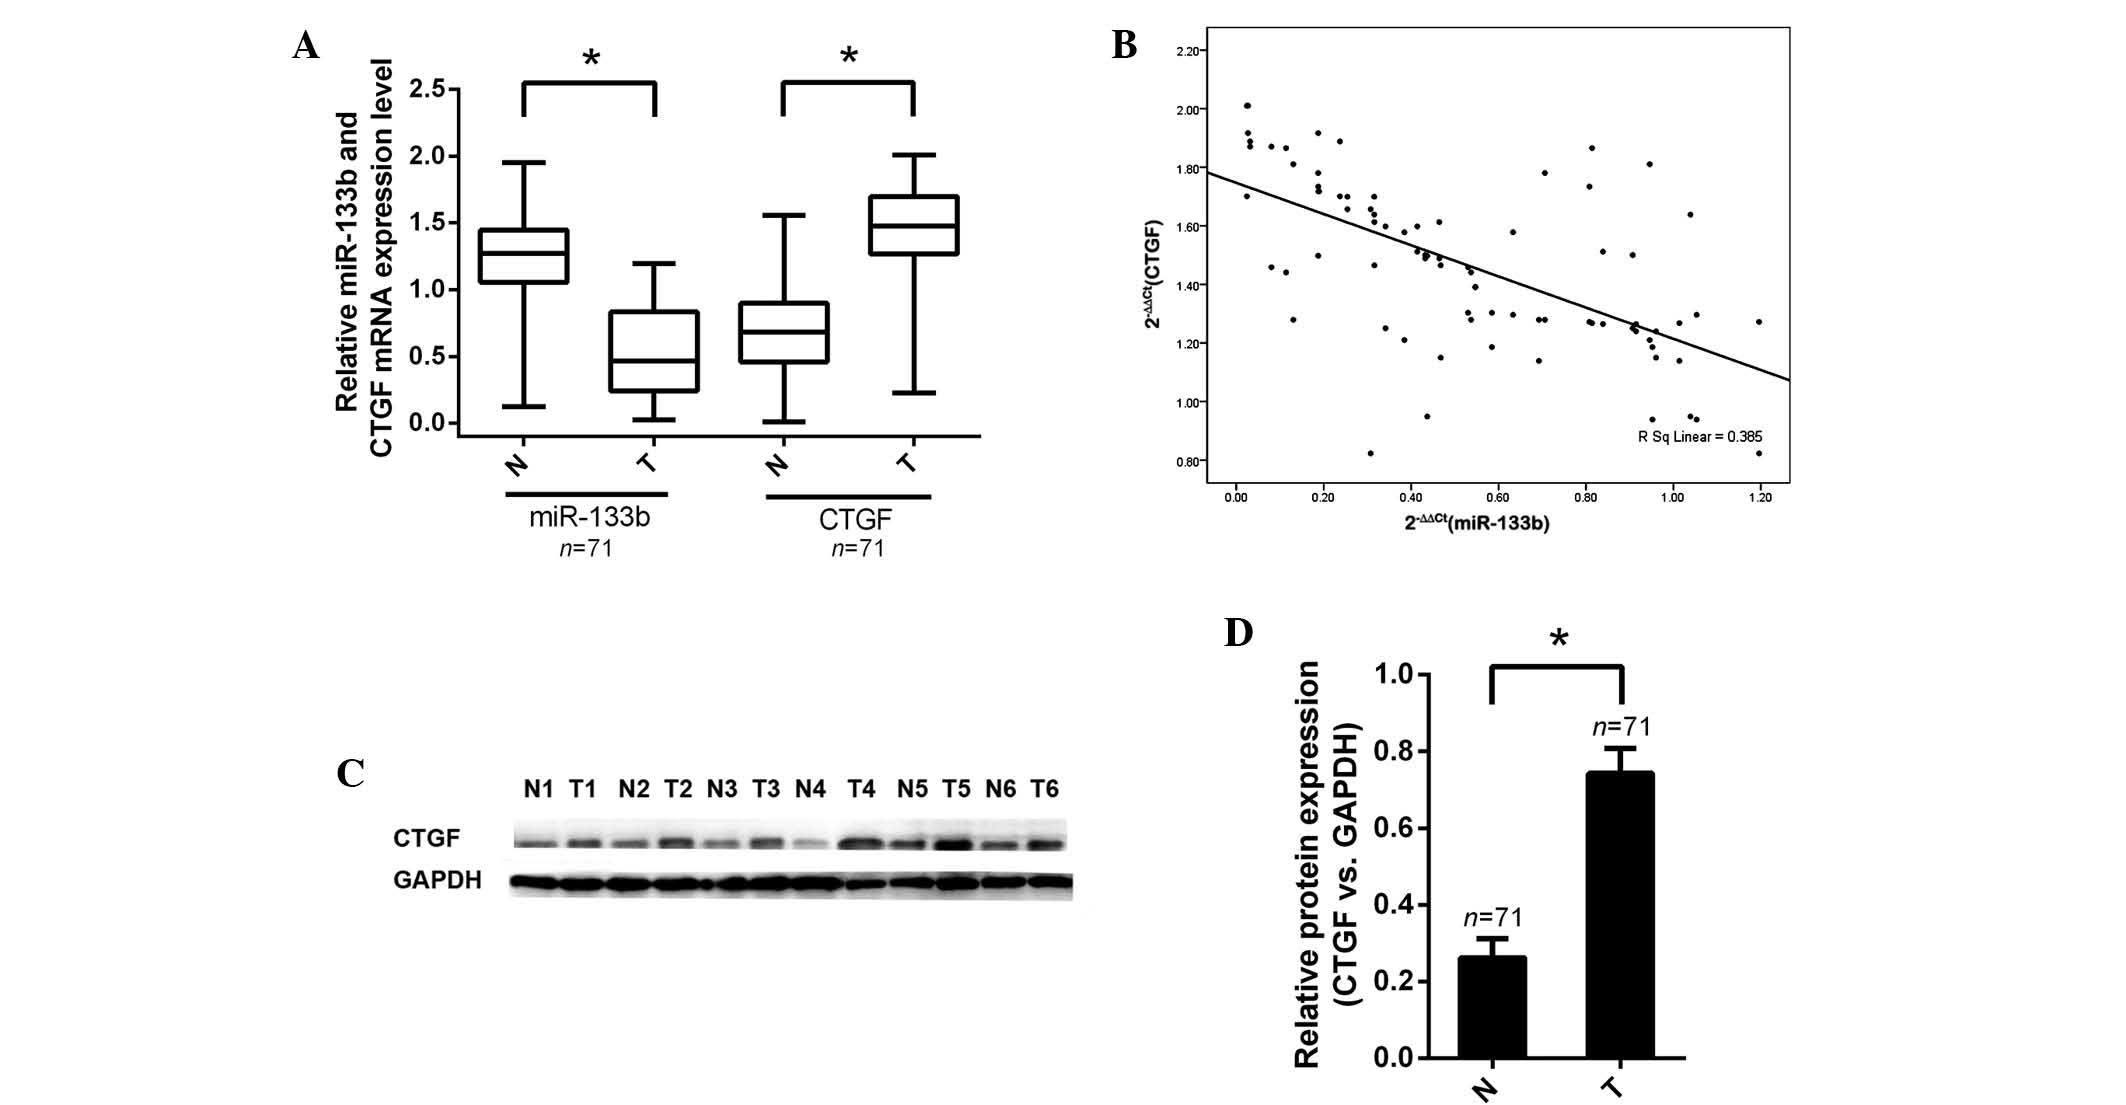
In order to gain insight into the biological
functions of miR-133b and CTGF in human colorectal carcinogenesis,
the expression of miR-133b in human CRC tissues and paired healthy
counterparts was analyzed using RT-qPCR. Following this, the
expression levels of miR-133b and CTGF mRNA were measured using
comparisons with the human CCD-18Co healthy colon cell line as a
reference. The relative expression levels of miR-133b in tumor
specimens compared with those in the CCD-18Co cells (0.55±0.41)
were significantly lower than the relative expression levels in
non-tumor specimens compared with those in CCD-18Co cells
(1.32±0.24; P<0.001). The relative expression levels of CTGF
mRNA in tumor specimens (1.46±0.36) were significantly higher than
those (0.57±0.32) in the corresponding non-tumor specimens
(P<0.001; Fig. 3A).
The effect of miR-133b expression on that of CTGF
was assessed using data obtained from RT-qPCR. A significant
negative correlation was observed between CTGF mRNA and miR-133b
expression (n=71, r=−0.385, P<0.01, Pearson’s correlation;
Fig. 3B). These data demonstrated
a reciprocal regulation of miR-133b and CTGF, suggesting that
downregulation of miR-133b may lead to CTGF overexpression in CRC
tissues.
Furthermore, western blot analysis was conducted in
order to determine whether protein expression of CTGF was
consistent with mRNA expression. As hypothesized, the alterations
in CTGF protein levels in tumor samples compared with those in
non-tumor samples were in accordance with changes in mRNA levels in
these groups. Protein levels of CTGF were verified in CRC tissues
(P<0.05; Fig. 3C and D).
Correlations between miR-133b, CTGF and
clinicopathological features
In order to evaluate the correlation between
miR-133b and CTGF mRNA expression as well as clinicopathological
factors relevant to CRC, the samples were divided into groups
according to whether they exhibited low or high expression using
the median values of miR-133b and CTGF mRNA levels. Patients with
expression levels of miR-133b in tumor tissues below the median
value of 0.47 were assigned to the low expression group (n=36),
while patients with miR-133b expression levels in tumor tissue
≥0.47 were assigned to the high expression group (n=35). In
addition, patients with tumor CTGF mRNA expression levels below the
median value of 1.49 were assigned to the low expression group
(n=36) and patients with tumor CTGF mRNA expression levels ≥1.49
were assigned to the high expression group (n=35). Current staging
for colorectal cancer is based on the 7th edition of AJCC Cancer
Staging Manual (16). There was a
significant difference between the groups with low and high
expression of miR-133b in terms of cell differentiation, lymph node
metastasis and clinical stage, with a low expression being
associated with poor differentiation, lymph node metastasis and a
more advanced stage (P<0.05; Table III). However, no significant
difference was found between the groups with low and high
expression of miR-133b in terms of patient age, gender, tumor site
or extramural vascular invasion status (P>0.05).
| Table IIIAssociation of clinical and
pathological characteristics with high or low miR-133b and CTGF
mRNA expression. |
Table III
Association of clinical and
pathological characteristics with high or low miR-133b and CTGF
mRNA expression.
| | miR-133b | CTGF |
|---|
| |
|
|
|---|
| Clinicopathological
features | Number | Lowa (n=36) | Higha (n=35) | P-value | Lowa (n=36) | Higha (n=35) | P-value |
|---|
| Age (years) | 71 | 58.8 | 61.2 | 0.687 | 60.1 | 59.9 | 0.733 |
| Gender
(male:female) | (38:33) | (21:15) | (17:18) | 0.410 | (16:20) | (22:13) | 0.120 |
| Tumor siteb |
| Right | 23 | 12 | 11 | 0.347 | 10 | 13 | 0.677 |
| Left | 23 | 14 | 9 | | 12 | 11 | |
| Rectum | 25 | 10 | 15 | | 14 | 11 | |
| Tumor
differentiation |
| Well | 2 | 0 | 2 | 0.011c | 1 | 1 | 0.943 |
| Moderate | 48 | 20 | 28 | | 25 | 23 | |
| Poor | 21 | 16 | 5 | | 10 | 11 | |
| Staging |
| I | 6 | 1 | 5 | 0.263 | 4 | 2 | 0.084 |
| II | 18 | 7 | 11 | | 13 | 5 | |
| III | 33 | 18 | 15 | | 12 | 21 | |
| IV | 14 | 10 | 4 | | 7 | 7 | |
| (III, IV: I,
II) | (47:24) | (28:8) | (19:16) | 0.036c | (19:17) | (28:7) | 0.015c |
| Lymph node |
| N0 | 29 | 8 | 21 | 0.037c | 20 | 9 | 0.034c |
| N1 | 23 | 13 | 10 | | 8 | 15 | |
| N2 | 19 | 15 | 4 | | 8 | 11 | |
| Extramural vascular
invasion |
| Present | 14 | 10 | 4 | 0.083 | 8 | 6 | 0.591 |
| Absent | 57 | 26 | 31 | | 28 | 29 | |
Furthermore, a high expression of CTGF was
associated with advanced clinical stage (stage III or IV vs. I or
II) and lymph node metastasis (P<0.05; Table III). No significant difference
was detected between the groups with low or high expression of CTGF
mRNA in terms of patient age, gender, tumor site, tumor
differentiation or extramural vascular invasion status (P>0.05).
The association between the levels of miR-133b and CTGF mRNA
expression and the clinicopathological characteristics is
summarized in Table III. In
brief, the data suggest that miR-133b and CTGF may be candidate
therapeutic targets in colorectal cancer, in particular in stage
III and stage IV tumors.
Discussion
Previous studies have indicated that miR-133b is
differentially expressed in CRC tissue samples and cell lines
compared with healthy tissues (6,17,18).
The present study demonstrated that CTGF is a potential functional
target of miR-133b. The expression levels of miR-133b and CTGF were
shown to be correlated with the clinical stage and lymph node
metastasis in colorectal cancer tissues, indicating that levels of
miR-133b and CTGF may be useful as clinical biomarkers of tumor
malignancy and thus prognosis.
Downregulation of miR-133b has been reported in a
number of cancer types, including gastric, lung and bladder cancers
(19–21). The high frequency of miR-133b
downregulation in various types of cancer suggests that miR-133b
may be involved in oncogenesis. In the present study, data analysis
confirmed that specimens with a low miR-133b were more likely to
exhibit poor cell differentiation, lymph node metastasis and
advanced clinical stage. No significant association was detected
between the expression levels of miR-133b and the patient age or
gender, the tumor site or the extramural vascular invasion status
in 71 patients with CRC.
The CTGF protein is a 38 kDa extracellular matrix
protein, which is a member of the CCN cysteine-rich family of
proteins. CTGF has multiple functions. It interacts with integrin
receptors and numerous growth factors. In addition, it serves as a
biostore for angiogenic factors such as the vascular endothelial
growth factor (22). CTGF
modulates certain cellular processes under normal or pathological
conditions, including cell adhesion, migration, proliferation,
chemotaxis, apoptosis, extracellular matrix (ECM) deposition and
angiogenesis (23). TGF-β and its
downstream mediators, including CTGF, are initiators of invasion
and migration processes in cancer progression (24). These processes may be independent
from each other, since the TGF-β and CTGF-dependent induction of
epithelial to mesenchymal transition was shown to be independent of
the profibrotic effects of TGF-β in proximal tubular cells
(25). CTGF has been implicated in
other processes necessitating cell migration, such as the
re-epithelialization of the cornea, which is mediated through TGF-β
and CTGF signaling, leading to downstream extracellular
signal-regulated kinase 1/2 and p38 mitogen-activated protein
kinase activation (25). CTGF
stimulates integrin expression and has been shown to bind directly
to endothelial cell surface integrins (27,28),
thereby mediating ECM interaction and prolonging cell survival.
CTGF is known to mediate anchorage-independent cancer cell growth.
Evidence for this is based on findings in which anti-CTGF treatment
has been shown to inhibit anchorage-independent growth in
vitro, primary tumor growth in vivo and the development
of macroscopic lymph node metastases (29).
The present study demonstrated that miR-133b targets
CTGF, indicating a potential mechanism associated with colorectal
tumorigenesis. In the luciferase reporter assay, wild-type CTGF was
shown to be specifically responsive to miR-133b overexpression. By
contrast, the mutated CTGF, which contained a mutation in the
miR-133b binding sites within the CTGF 3′UTR, successfully
abolished the effect of miR-133b transfection on luciferase
activity. This was confirmed using RT-qPCR in CRC specimens, which
showed that miR-133b expression was negatively correlated with CTGF
expression. RT-qPCR and western blot analyses demonstrated that
CTGF was highly expressed in human CRC cell lines, as well as in
primary tumors from patients with CRC. Furthermore, a significant
correlation was observed between increased levels of CTGF and
advanced tumor, nodes and metastasis stage. These findings
indicated that miR-133b may lead to lymph node metastasis and
advanced clinical stage via regulation of CTGF.
In conclusion, the present study demonstrated that
CTGF was a target gene of miR-133b in the human colorectum. The
role of miR-133b in CRC was further highlighted by the
demonstration of a correlation between its expression and certain
clinicopathological characteristics. These results suggested that
CTGF may be used to establish a possible link between the
biological function of miR-133b and the pathogenesis of CRC.
Furthermore, miR-133b and CTGF may be candidate therapeutic targets
in colorectal cancer.
Acknowledgements
This study was supported by the Planned Science and
Technology Project of Hunan Province, China (grant no. 2008FJ3160)
and the Chinese National Science Foundation (grant no.
81172298).
References
|
1
|
Rossi S, Di Narzo AF, Mestdagh P, et al:
microRNAs in colon cancer: a roadmap for discovery. FEBS Lett.
586:3000–3007. 2012. View Article : Google Scholar : PubMed/NCBI
|
|
2
|
Gansler T, Ganz PA, Grant M, et al: Sixty
years of CA: a cancer journal for clinicians. CA Cancer J Clin.
60:345–350. 2010. View Article : Google Scholar : PubMed/NCBI
|
|
3
|
Lamy P, Andersen CL, Dyrskjøt L, Tørring
N, Ørntoft T and Wiuf C: Are microRNAs located in genomic regions
associated with cancer? Br J Cancer. 95:1415–1418. 2006. View Article : Google Scholar : PubMed/NCBI
|
|
4
|
Duisters RF, Tijsen AJ, Schroen B, et al:
miR-133 and miR-30 regulate connective tissue growth factor:
implications for a role of microRNAs in myocardial matrix
remodeling. Circ Res. 104:170–178. 6p2009. View Article : Google Scholar
|
|
5
|
Wen D, Li S, Ji F, et al: miR-133b acts as
a tumor suppressor and negatively regulates FGFR1 in gastric
cancer. Tumour Biol. 34:793–803. 2013. View Article : Google Scholar : PubMed/NCBI
|
|
6
|
Hu G, Chen D, Li X, Yang K, Wang H and Wu
W: miR-133b regulates the MET proto-oncogene and inhibits the
growth of colorectal cancer cells in vitro and in vivo. Cancer Biol
Ther. 10:190–197. 2010. View Article : Google Scholar : PubMed/NCBI
|
|
7
|
Chen CC and Lau LF: Functions and
mechanisms of action of CCN matricellular proteins. Int J Biochem
Cell Biol. 41:771–783. 2009. View Article : Google Scholar :
|
|
8
|
Chu CY, Chang CC, Prakash E and Kuo ML:
Connective tissue growth factor (CTGF) and cancer progression. J
Biomed Sci. 15:675–685. 2008. View Article : Google Scholar : PubMed/NCBI
|
|
9
|
Garcia P, Leal P, Ili C, Brebi P, Alvarez
H and Roa JC: Inhibition of connective tissue growth factor
(CTGF/CCN2) in gallbladder cancer cells leads to decreased growth
in vitro. Int J Exp Pathol. 94:195–202. 2013.PubMed/NCBI
|
|
10
|
Kang Y, Siegel PM, Shu W, et al: A
multigenic program mediating breast cancer metastasis to bone.
Cancer Cell. 3:537–549. 2003. View Article : Google Scholar : PubMed/NCBI
|
|
11
|
Deng YZ, Chen PP, Wang Y, et al:
Connective tissue growth factor is overexpressed in esophageal
squamous cell carcinoma and promotes tumorigenicity through
beta-catenin-T-cell factor/Lef signaling. J Biol Chem.
282:36571–36581. 2007. View Article : Google Scholar : PubMed/NCBI
|
|
12
|
Wenger C, Ellenrieder V, Alber B, et al:
Expression and differential regulation of connective tissue growth
factor in pancreatic cancer cells. Oncogene. 18:1073–1080. 1999.
View Article : Google Scholar : PubMed/NCBI
|
|
13
|
Kubo M, Kikuchi K, Nashiro K, et al:
Expression of fibrogenic cytokines in desmoplastic malignant
melanoma. Br J Dermatol. 139:192–197. 1998. View Article : Google Scholar : PubMed/NCBI
|
|
14
|
Shakunaga T, Ozaki T, Ohara N, et al:
Expression of connective tissue growth factor in cartilaginous
tumors. Cancer. 89:1466–1473. 2000. View Article : Google Scholar : PubMed/NCBI
|
|
15
|
Lee HK, Bier A, Cazacu S, et al:
MicroRNA-145 is downregulated in glial tumors and regulates glioma
cell migration by targeting connective tissue growth factor. PLoS
One. 8:e546522013. View Article : Google Scholar : PubMed/NCBI
|
|
16
|
Edge S, Byrd DR, Compton CC, Fritz AG,
Greene FL and Trotti A: AJCC Cancer Staging Manual. 7th edition.
Springer; New York, NY: 2010
|
|
17
|
Xiang KM and Li XR: MiR-133b acts as a
tumor suppressor and negatively regulates TBPL1 in colorectal
cancer cells. Asian Pac J Cancer Prev. 15:3767–3772. 2014.
View Article : Google Scholar : PubMed/NCBI
|
|
18
|
Lin CW, Li XR, Zhang Y, et al: TAp63
suppress metastasis via miR-133b in colon cancer cells. Br J
Cancer. 110:2310–2320. 2014. View Article : Google Scholar : PubMed/NCBI
|
|
19
|
Wen D, Li S, Ji F, Cao H, Jiang W, Zhu J
and Fang X: Mir-133b acts as a tumor suppressor and negatively
regulates FGFR1 in gastric cancer. Tumour Biol. 34:793–803. 2013.
View Article : Google Scholar : PubMed/NCBI
|
|
20
|
Crawford M, Batte K, Yu L, Wu X, Nuovo GJ,
Marsh CB, Otterson GA and Nana-Sinkam SP: MicroRNA-133b targets
pro-survival molecules MCL-1 and BCL2L2 in lung cancer. Biochem
Biophys Res Commun. 388:483–489. 2009. View Article : Google Scholar : PubMed/NCBI
|
|
21
|
Ichimi T, Enokida H, Okuno Y, Kunimoto R,
Chiyomaru T, Kawamoto K, Kawahara K, Toki K, Kawakami K, Nishiyama
K, et al: Identification of novel microRNA targets based on
microRNA signatures in bladder cancer. Int J Cancer. 125:345–352.
2009. View Article : Google Scholar : PubMed/NCBI
|
|
22
|
Duisters RF, Tijsen AJ, Schroen B, et al:
miR-133 and miR-30 regulate connective tissue growth factor:
implications for a role of microRNAs in myocardial matrix
remodeling. Circ Res. 104:170–178. 2009. View Article : Google Scholar
|
|
23
|
Hofmeister V, Schrama D and Becker JC:
Anti-cancer therapies targeting the tumor stroma. Cancer Immunol
Immunother. 57:1–17. 2008. View Article : Google Scholar
|
|
24
|
Wendt MK, Smith JA and Schiemann WP:
Transforming growth factor-β-induced epithelial-mesenchymal
transition facilitates epidermal growth factor-dependent breast
cancer progression. Oncogene. 29:6485–6498. 2010. View Article : Google Scholar : PubMed/NCBI
|
|
25
|
Wang B, Herman-Edelstein M, Koh P, Burns
W, Jandeleit-Dahm K, Watson A, Saleem M, Goodall GJ, Twigg SM,
Cooper ME and Kantharidis P: E-cadherin expression is regulated by
miR-192/215 by a mechanism that is independent of the profibrotic
effects of transforming growth factor-beta. Diabetes. 59:1794–1802.
2010. View Article : Google Scholar : PubMed/NCBI
|
|
26
|
Secker GA, Shortt AJ, Sampson E, Schwarz
QP, Schultz GS and Daniels JT: TGFbeta stimulated
re-epithelialisation is regulated by CTGF and Ras/MEK/ERK
signalling. Exp Cell Res. 314:131–142. 2008. View Article : Google Scholar
|
|
27
|
Babic AM, Chen CC and Lau LF: Fisp12/mouse
connective tissue growth factor mediates endothelial cell adhesion
and migration through integrin alphavbeta3, promotes endothelial
cell survival, and induces angiogenesis in vivo. Mol Cell Bio.
19:2958–2966. 1999.
|
|
28
|
Lau LF and Lam SC: The CCN family of
angiogenic regulators: the integrin connection. Exp Cell Res.
248:44–57. 1999. View Article : Google Scholar : PubMed/NCBI
|
|
29
|
Dornhöfer N, Spong S, Bennewith K, Salim
A, Klaus S, Kambham N, Wong C, Kaper F, Sutphin P, Nacamuli R, et
al: Connective tissue growth factor-specific monoclonal antibody
therapy inhibits pancreatic tumor growth and metastasis. Cancer
Res. 66:5816–5827. 2006. View Article : Google Scholar : PubMed/NCBI
|