Introduction
Tyrosine kinase inhibitors (TKI) have become a
widely used class of drugs for the treatment of a range of solid
tumors and hematological malignancies. In 2001, imatinib was the
first TKI to be registered for the targeted therapy of chronic
myelogenous leukemia (CML) (1).
Imatinib is an ATP competitive inhibitor of the tyrosine kinase
activity of abelson (ABL) kinase and the breakpoint cluster
region-abelson fusion oncoprotein (BCR-ABL). Whereas ABL is found
in the majority of cells, the fusion protein is only expressed in
leukemic cells. Imatinib arrests proliferation and induces the
apoptosis of CML cells. During long-term imatinib therapy,
clinicians observed that a number of patients became resistant to
the treatment. Therefore, a more selective and potent BCR-ABL
inhibitor molecule, nilotinib, was developed, which was able to
overcome resistance in numerous cases (2,3).
A number of TKIs have demonstrated marked effects on
bone homeostasis and the remodeling balance. Imatinib directly
inhibits osteoclastogenesis and the bone resorption activity of
osteoclasts, and also reduces the survival of osteoclast precursors
and mature osteoclasts (4–8). Based on in vitro studies,
imatinib reduces osteoblast proliferation (3–7,9) and
survival, but increases osteoblast cell differentiation (3,8).
Similarly, nilotinib also effectively inhibits the proliferation
rate of osteoblasts (3,10). However, nilotinib increases the
secretion of osteoprotegerin (OPG) and decreases the expression of
receptor activator of nuclear factor κ-B ligand (RANKL) (3). Other studies have shown increased
osteoblast-specific gene expression, cell activity and
mineralization induced by imatinib (3–9). It
should be noted that the examined TKIs have differing effects on
osteoblast function. The described differences may be dependent
upon the concentration of the utilized TKI, the maturation stage of
the osteoblasts and the distribution of various TKI-targeted
receptors on cells (8,10,11).
The direct influence of imatinib on osteoclasts and osteoblasts
results from off-target effects on cell surface receptor tyrosine
kinases [such as colony-stimulating factor 1 receptor, stem cell
growth factor receptor (c-KIT), and platelet-derived growth factor
receptor (PDGFR)] and carbonic anhydrase II (3,10).
Nilotinib is a second-generation TKI with greater selectivity
towards ABL/BCR-ABL over other tyrosine kinases (such as PDGFR,
c-KIT and discoidin domain receptor kinases).
The clinical effects of TKI administration also show
differences in bone metabolism. Changes in trabecular bone volume
(TBV) were observed in patients with CML after imatinib therapy
(7,10,12).
TBV was measured in 17 patients with CML prior to treatment and 2-
and 4-years after imatinib treatment. In 8 patients, there was a
significant increase in TBV, although, serum phosphate and calcium
levels of 9 participants were reduced (7). According to numerous clinical
studies, hypophosphataemia (3,7,13–16),
hypocalcemia (13–16) and hyperparathyroidism (13–16)
have been documented during TKI administration. Vandyke et
al (12) reported elevated
bone mineral density (BMD) and bone volume:trabecular volume ratio
at the femoral neck in imatinib-treated CML patients. During the
48-month observation period, trabecular bone area (TBA%) was
decreased in 10 patients and increased in 24 patients (17). In other studies, diminished serum
osteocalcin and N-telopeptide of type I collagen levels, as well as
lower bone mineral content and impaired bone remodeling have also
been reported (12–14,18).
Currently, there are numerous contradictory results
regarding the effects of imatinib and nilotinib on bone metabolism,
and there is no clear evidence to explain the results, either at
the cellular level or in clinical observations. Furthermore, there
is limited comprehensive transcription data available in relation
to bone cell and/or tissue function and TKI treatment. Only
targeted bone-specific gene expression [e.g. osteocalcin, alkaline
phosphatase, OPG, RANKL and bone morphogenetic protein 2 (BMP2)]
changes have been examined. Therefore, the aim of the present study
was to analyze the whole transcriptome of cultured murine
osteoblasts following imatinib and nilotinib treatment using
Sequencing by Oligonucleotide Ligation and Detection (SOLiD) next
generation RNA sequencing. This study aimed to identify candidate
signaling pathways and network regulators by multivariate Ingenuity
Pathway Analysis (IPA).
Materials and methods
In vitro cell culture
The MC3T3-E1 murine preosteoblast cell line was
obtained from the American Type Culture Collection (Rockville, MD,
USA). The cells were cultured in Minimum Essential Medium Eagle
α-Modification (α-MEME, Sigma-Aldrich, St. Louis, MO, USA)
supplemented with 0.292 g/l L-glutamin (Sigma-Aldrich), 5% fetal
calf serum (FCS, Sigma-Aldrich) and 1% antibiotic solution
(penicillin-streptomycin sulfate-amphotericin B) (Sigma-Aldrich).
Cells were incubated at 37°C in a 5% CO2 atmosphere and
78% humidity. The cultured medium was changed twice a week. Cells
were passaged when grown to 70% confluence using 0.25% Trypsin EDTA
solution (Sigma-Aldrich). All experiments were conducted with
MC3T3-E1 cells between passages 8 and 15. All used reagents were of
analytical quality.
Effects of imatinib and nilotinib on cell
viability
In the in vitro system, the following three
sample groups were examined: Imatinib-treated, nilotinib-treated
and untreated (control) osteoblast cell cultures.
The adequate incubation time and drug concentration
were defined using a cell viability assay. Different imatinib
(Glivec/Gleevec, STI571, CGP 57148B; Novartis, Basel Switzerland)
and nilotinib (Tasigna; Novartis) concentrations (30 nM-20
µM) were administered to 40% confluent MC3T3-E1 cells for
various incubation times (1–6 days) in 96-well plates. After
removal of culture medium, cells were fixed with 100 µl/well
trichloroacetic acid (Sigma-Aldrich) for 30 min. Then, cells were
stained with 0.4% sulforhodamine-B (SRB, Sigma-Aldrich) protein dye
solution for 30 min. After the excess dye solution removal, cell
culture plates were rinsed with 1% acetic acid solution four times
and dried at room temperature. The bound SRB was dissolved in 100
µl of 10 mM Trisma-Sol (Sigma-Aldrich) and the cell culture
plates were shaken for 5 min. The measurements were performed by
Multiskan Spectrum V1.2 1500-636 device (Thermo Fisher Scientific
Inc, Waltham MA USA) at 520 nm. Three parallel measurements on
24-well cell culture plates were performed twice in all
experiments.
RNA isolation
RNA isolation was performed using the High Pure
Total RNA Isolation kit (Roche Diagnostics, Indianapolis, IN, USA)
from the treated and untreated osteoblastic cells. The quality and
quantity of isolated RNA were measured by Bioanalyzer (Agilent
Technologies, Santa Clara, CA, USA) and Qubit fluorometer (Thermo
Fisher Scientific, Inc.). After pooling the parallel biological
samples, the whole transcriptome analysis was performed by the
Applied Biosystems SOLiD V4 device (Thermo Fisher Scientific,
Inc.).
SOLiD next generation RNA sequencing
The whole transcriptome analysis of the purified,
DNA-free total RNA molecules (>5 mg/sample, RIN >8.0, cc
>400 ng/ml) were performed by SeqOmics Biotechnology Ltd.
(SeqOmics Biotechnology Ltd., Szeged, Hungary; http://www.seqomics.hu/) with SOLiD next generation
50+20 bp reads paired-end technologies.
Statistical analysis
For the data analysis, Benjamini and Hochberg False
Discovery Rate test was applied (19,20).
P≤0.05 was considered to indicate a statistically significant
difference. Genes showing significantly changed mRNA expression
levels were evaluated by IPA 7.6 software (QIAGEN, Redwood City,
CA, USA; www.ingenuity.com). Canonical pathway
analysis utilizing the IPA library of canonical pathways identified
the signaling routes that contained the differentially expressed
genes in the input data set. The significance of the association
between the data set and the canonical pathway was determined based
on two parameters: i) A ratio of the number of genes from the data
set that map to the pathway divided by the total number of genes
that map to the canonical pathway and ii) a P-value calculated
using Fischer's exact test determining the probability that the
association between the genes in the data set and the canonical
pathway is due to chance alone. The upstream regulator analysis
identifies the cascade of upstream transcriptional regulators based
on prior knowledge of expected effects between transcriptional
regulators and their target genes stored in the Ingenuity Knowledge
Base. The analysis examines the number of known targets of each
transcription regulator present in the dataset, and also compares
their direction of change (expression in the experimental sample
relative to control) to what is expected from the literature in
order to predict likely relevant transcriptional regulators. The
aim of the overlap P-value is to identify transcriptional
regulators that are able to explain observed gene expression
changes. The overlap P-value measures whether there is a
statistically significant overlap between the dataset genes and the
genes that are regulated by a transcriptional regulator. It is
calculated using Fisher's exact test, and significance is
attributed to P<0.01. The most upregulated molecules were
selected based on logarithmic fold change (logFC) values, which
describe the rate of expression changes in the treated groups
compared with the untreated control group.
Results
Differentially expressed genes in the
treated groups
Based on the cell viability test, the 1 µM
drug concentration and 6-day incubation period had the greatest
effects on the expression profile of osteoblastic cells.
Altogether, 16,383 (imatinib-treated group), 16,951
(nilotinib-treated group) and 17,290 (control group) annotated RNAs
were found in the samples, respectively. Altered expression of 358
genes in the imatinib compared with the control and 21 genes in the
nilotinib group compared with control were identified using the
Benjamini and Hochberg statistical test. There were three common
differentially expressed genes [C11orf87, chromosome 11 open
reading frame 87 (AI593442), 3-hydroxyisobutyrate dehydrogenase
pseudogene (Gm11225) and zinc finger protein 184 (Zfp184)] in the
two treated groups compared with control. logFC values were as
follows: logFC (AI593442)=2.95, logFC (Gm11225)=2.09 and logFC
(Zfp184)=1.45 in the imatinib group, and logFC (AI593442)=2.82,
logFC (Gm11225)=2.79 and logFC (Zfp184)=3.43 in the nilotinib
group. These three genes had almost the same expression activity in
the two groups. In the imatinib-treated group, all of the
identified differentially expressed genes were upregulated. This
was also observed in the nilotinib treatment, with one exception
[logFC (RP23-390C13.1)=−2.95] based on logFC values.
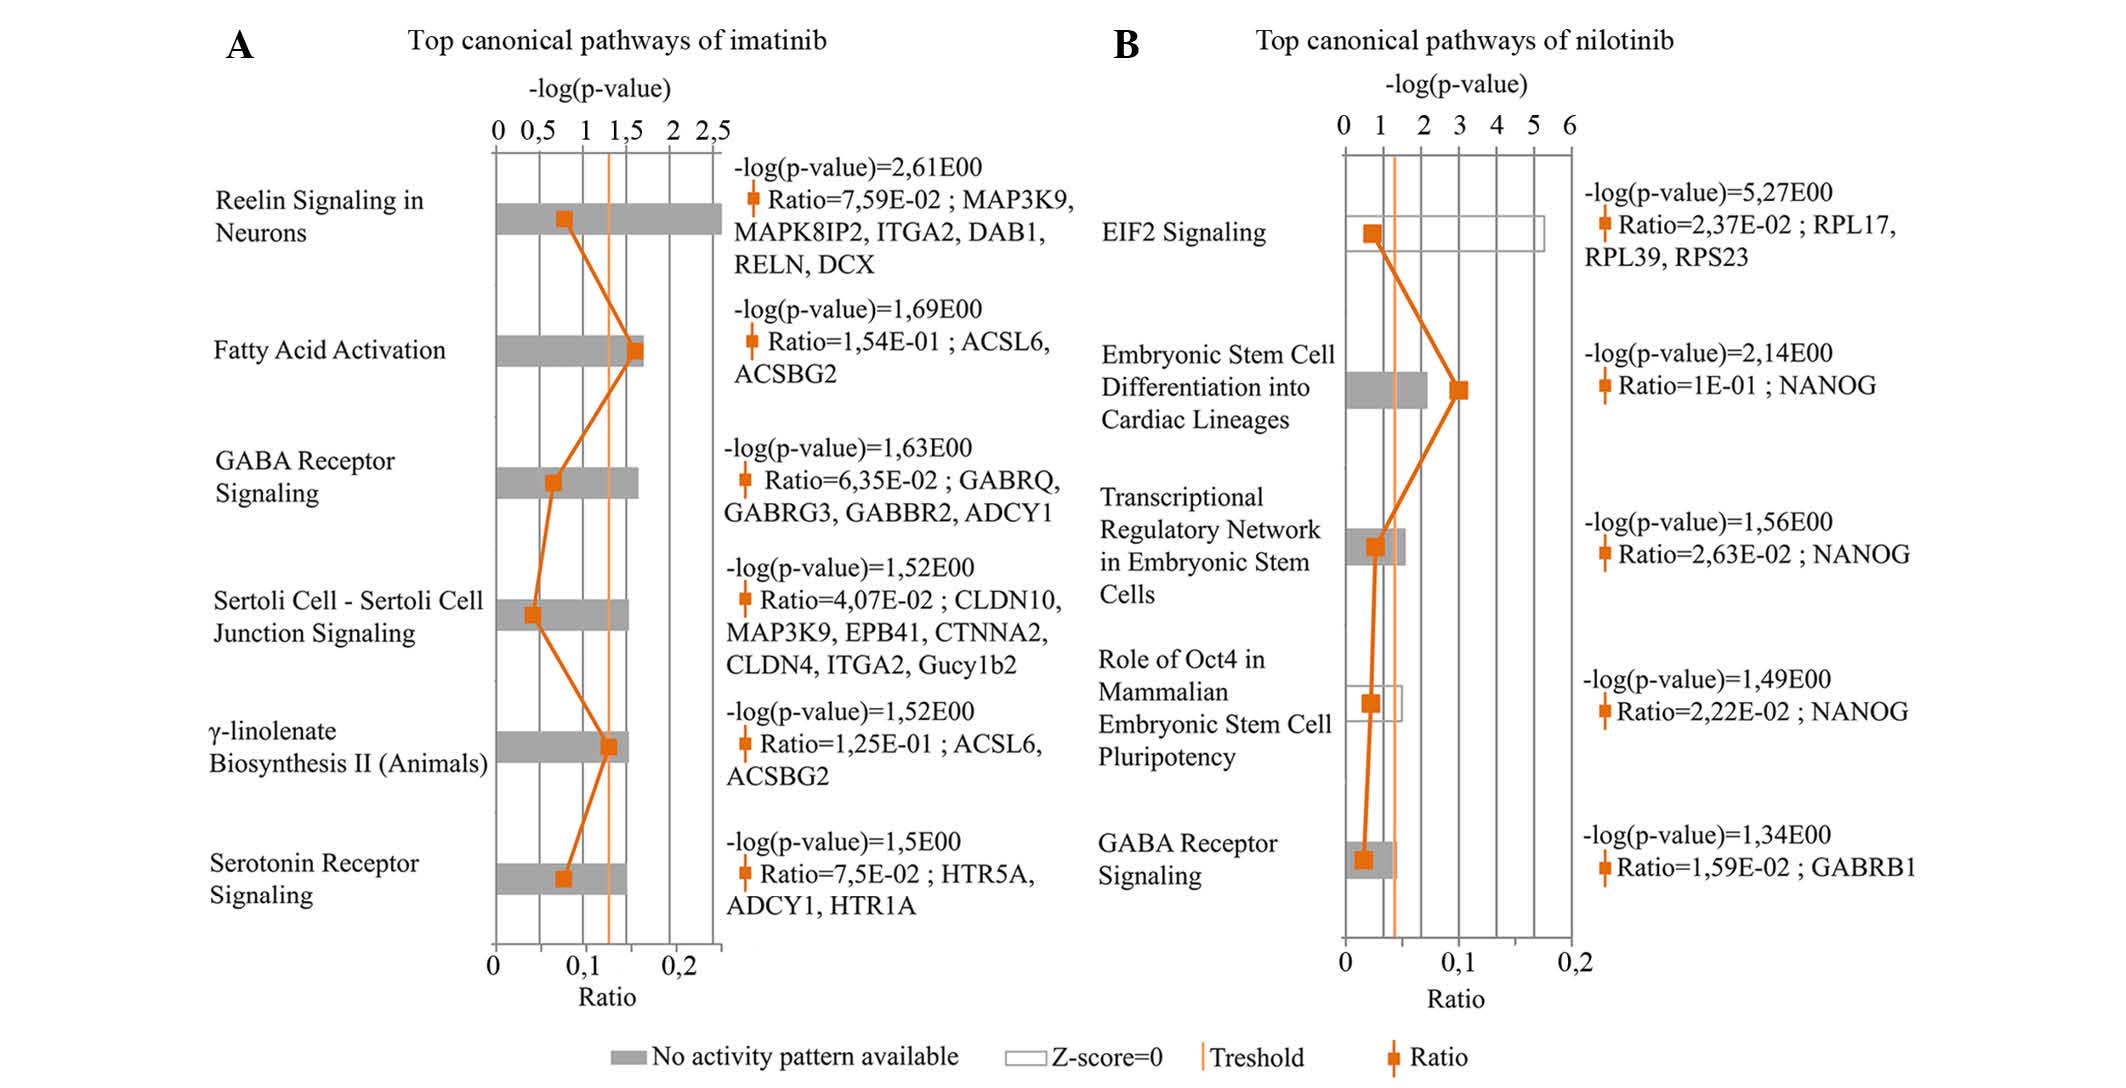
Canonical pathway analysis
Genes showing significantly altered expression rates
in response to the two drugs compared with control were evaluated
by IPA canonical pathways analysis. Six most upregulated canonical
pathways were identified in the imatinib-treated osteoblast cells
(Fig. 1A). Reelin signaling in
neurons pathway which participates in the formation of neuronal
architectonic patterns had the lowest P-value. This pathway was
represented by six genes, namely Mitogen-Activated Protein Kinase
Kinase Kinase 9 MAP3K9, C-jun-amino-terminal kinase-interacting
protein 2 (MAPK8IP2), Integrin subunit α2 (ITGA2), cytoplasmic
adaptor disabled-1 (DAB1), Reelin gene (RELN) and doublecortin
(DCX). The logFC values were: logFC (MAP3K9)=3.41, logFC
(MAPK8IP2)=2.10, logFC (ITGA2)=2.35, logFC (DAB1)=2.24, logFC
(RELN)=3.71 and logFC (DCX)=1,86. The fatty acid activation pathway
supports adequate fatty acid and lipid biosynthesis. ACSL6 and
ACSBG2 genes characterize this pathway. The logFC values of these
genes were 3.39 and 2.42, respectively. Based on these two genes,
IPA software indicated another signaling pathway, γ-linolenate
biosynthesis II cascade, which is also responsible for lipid
metabolism. The γ-aminobutyric acid (GABA) receptor signaling
pathway primarily regulates signal transduction in the nervous
system. In these results, two ion-channel (GABRQ and GABRG3), one G
protein-coupled receptor B (GABBR2) and the adenylate cyclase type
1 genes (ADCY1) were shown to be associated with this pathway. The
logFC values were as follows: 2.69, 1.95, 2.74 and 3.16,
respectively. Sertolisertoli cell junction signaling pathway is
involved in testicular cell growth, proliferation and development.
This pathway was represented by seven differentially expressed
genes. The logFC values were as follows: logFC (CLDN10)=1.94, logFC
(MAP3K9)=3.41, logFC (EPB4.1)=2.51, logFC (CTNNA2)=2.76, logFC
(CLDN4)=2.21, logFC (ITGA2)=2.35 and logFC (Gucy1b2)=2.86. Finally,
the Serotonin receptor signaling pathway, which had been
demonstrated to show a strong positive effect on bone mass was also
identified. The logFC values of the three connected genes were:
logFC (HTR5A)=2.06, logFC (ADCY1)=1.45 and logFC (HTR1A)=2.88.
These pathways were shown to be significantly altered following
treatment (P<0.05); however, the software could not predict the
activity pattern of the most upregulated pathways. The most
upregulated pathway is a relevant (significant) signaling pathway,
where genes of the uploaded dataset were significantly enriched.
The evaluation criteria of most upregulated pathways are the ratio
and the P-value.
Five most upregulated canonical pathways were
identified in the transcriptome of the nilotinib-treated group
(Fig. 1B). The Eukaryotic
Initiation Factor 2 (EIF2) signaling pathway had the highest
P-value, although the activation z-score was almost 0. EIF2
signaling has an important role in the initiation of translation.
The logFC values of the three differentially expressed genes
involved in this pathway were: logFC (RPL17)=2.41, logFC
(RPL39)=1.99 and logFC (ribosomal protein S23; RPS23)=3.45.
Embryonic stem cell differentiation into cardiac lineages,
Transcriptional regulatory network in embryonic stem cells and Role
of Oct4 in mammalian embryonic stem cell pluripotency pathways were
denoted by the NANOG gene, which encodes a critical transcription
factor for cell self-renewal. The GABA receptor signaling pathway
is characterized with GABRB1 (γ-aminobutyric acid receptor A,
subunit β1) gene, logFC=2.83. The GABA receptor signaling network
was determined to be one of the most upregulated canonical pathway
associated with the differentially expressed genes following
treatment with imatinib and nilotinib compared with control.
Upstream regulator analysis
The IPA software defines the most upregulated
upstream regulators on the basis of quality of expression changes.
Five upstream regulators were identified in the imatinib group,
namely: GLDN, FREM2, NRCAM, GRIP1 and very low density lipoprotein
receptor (VLDLR). A summary of the identified upstream regulators,
including their biological function associated with bone metabolism
is shown in Table I (21–23).
 | Table IMost upregulated upstream regulators
of imatinib using the ingenuity pathway analysis system. |
Table I
Most upregulated upstream regulators
of imatinib using the ingenuity pathway analysis system.
| Gene symbol | Gene name | P-value of
overlap | Regulates | General
functions | Function related to
bone biology |
|---|
| GLDN | Gliomedin | 7,54E-04 | Voltage-gated
sodium channel, SPTBN4, ANK3, NFASC | Involved in the
formation of the nodes of Ranvier along myelinated axons. | N/A |
| FREM2 | FRAS1 related
extracellular matrix protein 2 | 7,54E-04 | FREM1, FRAS1,
FREM2 | Extracellular
matrix protein required for maintenance of the integrity of skin
and renal epithelium. Also required for epidermal adhesion. | N/A |
| NRCAM | Neuronal cell
adhesion molecule | 7,54E-04 | Voltage-gated
sodium channel, NFASC, SPTBN4, ANK3, NRCAM, GLDN, neurotrophin | Ankyrin-binding
protein involved in neuron-neuron cell adhesion. Role in the
molecular assembly of the nodes of Ranvier. | N/A |
| GRIP1 | Glutamate receptor
interacting protein 1 | 7,54E-04 | FRAS1, GRIA2,
NR1I3, GRIP1, FREM2, FREM1, ESRRA, TFF1, HNF4A, ESR1, MEF2C,
kinesin, ampa receptor | May be a localized
scaffold for the assembly of a multiprotein signaling complex and
as mediator of the trafficking of its binding partners at specific
subcellular location in neurons. | N/A |
| VLDLR | Very low density
lipoprotein receptor | 7,54E-04 | Cholesterol,
triacylglycerol, DAB1, Ptk, DNA endogenous promoter, phospholipid,
fatty acid, RAC1, LPL, SERPINE1, glycoprotein, RNA polymerase II,
very low density lipoprotein | Binds VLDL and
transport it into the cells by receptor-mediated endocytosis. In
order to be internalized, the receptor-ligand complexes must first
cluster into clathrin-coated pits. Important in VLDL-triglyceride
metabolism and the reelin signaling pathway. | Support osteoblast
differentiation and proliferation (21,22).
Indirectly regulates bone mineral density and remodeling through
cholesterol level (23). |
In the nilotinib-treated osteoblast culture, five
most upregulated upstream regulators were also found: FAAH, MARCH7,
ACVR1B, RAD23B and ACVR1C. Details of these upstream regulators are
listed in Table II (24).
| Table IIMost upregulated upstream regulators
of nilotinib using the IPA system. |
Table II
Most upregulated upstream regulators
of nilotinib using the IPA system.
| Gene symbol | Gene name | P-value of
overlap | Regulates | General
functions | Function related to
bone biology |
|---|
| FAAH | Fatty acid
amide | 1.30E-04 | Anandamide, fatty
acid, MAEL, FNDC3A, SEPT4, 2-arachidonoylglycerol, endocannabinoid,
Prl3d1, oleoylethanolamide, MAP6D1, RPL7L1, RPL5, RPS18,
acylethanolamide | Integral membrane
protein that hydrolyzes a number of bioactive primary and secondary
fatty acid amides, including the neuromodulatory compounds
anandamide and oleamide to free fatty acid and ethanolamine. | Affects osteoblasts
and osteoclasts, stimulates bone formation and inhibits bone
resorption. |
| MARCH7 | Membrane-
associated ring finger (C3HC4) 7, E3 ubiquitin protein ligase | 6.61E-04 | NANOG | Adds ubiquitin to
target lysines in substrate proteins, thereby signaling for their
vesicular transport between membrane compartments. E3 ubiquitin
ligases accept ubiquitin from an E2 ubiquitin-conjugating enzyme in
the form of a thioester and then directly transfer the ubiquitin to
targeted substrates. | N/A |
| ACVR1B | Activin receptor
type-1B | 6.61E-04 | SMAD2, SMAD3, Xnr1,
NODAL, L-threonine, DNA endogenous promoter, HP, activin, MAPK,
Akt, LEFTY1, CYP19A1, LEFTY2, FSHR | Transmembrane
serine/threonine kinase activin receptor type-1 forming receptor
complex with receptor type-2. Activin signal regulates numerous
physiological and pathological processes including neuronal
differentiation and survival, hair follicle development and
cycling, FSH production, wound healing, extracellular matrix
production, immunosuppression and carcinogenesis. | Involved is bone
homeostasis, bone cell proliferation and differentiation, skeletal
development, bone turnover, bone mass and fracture risk (24). |
| RAD23B | RAD23 homolog B
(S. cerevisiae) | 1.32E-03 | TDG, Lys48-linked
polyubiquitin, 26s proteasome, PSMC1, TP53, NGLY1, XPC, MPG, DNA
promoter | Multiubiquitin
chain receptor involved in modulation of proteasomal degradation.
Binds to polyubiquitin chains. Proposed to be capable to bind
simultaneously to the 26S proteasome and to polyubiquitinated
substrates and to deliver ubiquitinated proteins to the
proteasome. | N/A |
| ACVR1C | Activin receptor
type-1C | 1.32E-03 | SMAD2, SMAD3, FOS
MAPK8, NODAL, Erk, LEFTY2, SERPINE1, Jnk, caspase, CASP9, JINK1/2,
P38 MAPK, CASP3, LEFTY1 | Receptor for
activin AB, activin B and NODAL. Involved in cell differentiation,
growth arrest and apoptosis. | N/A |
Upregulated molecules
The most sensitive genes in response to imatinib and
nilotinib treatment were determined based on fold changes using IPA
core analysis. In the two groups, based on the degree of expression
changes, the lists of the most sensitive genes with the most marked
expression differences are shown in Tables III and IV (25–30).
Following imatinib administration, the syntaxin binding protein
5-like (STXBP5L) gene showed the strongest upregulation (21-fold),
while the RPS23 gene was most strongly upregulated following
nilotinib treatment (11-fold) compared with control.
| Table IIIMost upregulated molecules of
imatinib treated cells in IPA analysis. |
Table III
Most upregulated molecules of
imatinib treated cells in IPA analysis.
| Gene symbol | Gene name | LogFC | Regulates | General
function | Function related to
bone biology |
|---|
| STXBP5L | Syntaxin binding
protein 5-like | 4.40 | Insulin,
D-glucose | Involved in vesicle
transport and exocytosis, as well as the regulation of protein
secretion and protein transport. | Takes part in
glucose homeostasis and negative regulation of insulin
secretion. |
| GDF10 | Growth
differentiation factor 10 | 4.33 | SMAD2,
SERPINE1 | GDF10 (also known
as bone morphogenetic protein 3B) is a member of transforming
growth factor β superfamily. Involved in skeletal morphogenesis,
apoptosis, cell development and fat cell differentiation. | Regulates
osteoblast differentiation and ossification. Respond to
transforming growth factor beta stimulus, supports skeletal system
development. |
| HYDIN | HYDIN, axonemal
central pair apparatus protein | 3.97 | N/A | Involved in cilia
motility, brain development and axoneme assembly. | N/A |
| NYAP2 | Neuronal tyrosine-
phosphorylated phosphoinositide- 3-kinase adaptor2 | 3.94 | N/A | Activates PI3K and
concomitantly recruits the WAVE1 complex to the close vicinity of
PI3K and regulates neuronal morphogenesis. Participates in protein
binding and neuron projection morphogenesis. | N/A |
| AQP9 | Aquaporin 9 | 3.93 | Glycerol, water,
D-glucose, urea, triacylglycerol, Gyk, Ins1, proinsulin, arsenite,
PRKCB, MYC, BAX, CASP3 | Aquaporins are a
family of water-selective membrane channels that allow the passage
of a wide variety of non-charged solutes, including carbamides,
polyols, purines and pyrimidines in a phloretin- and
mercury-sensitive manner. Whereas amino acids, cyclic sugars,
Na+, K+, Cl−, and deprotonated
monocarboxylates are excluded. Also permeable to urea and
glycerol. | Regulates bone
resorption (25),
osteoclastogenesis, (26)
osteoclast differentiation(25-27)
and bone mineral density (25). |
| CSMD1 | CUB and Sushi
multiple domains 1 | 3.79 | D-glucose,
complement protein | Takes part in
glucose homeostasis and startle response. | Takes part in bone
formation (28). |
| MYO3B | Myosin IIIB | 3.74 | L-threonin,
peptide | Encodes one of the
class III myosins. Myosins are activated by actins that move along
actin filaments in the cell. Alternative splicing results in
multiple transcript variants encoding different isoforms. | N/A |
| RELN | Reelin | 3.71 | DAB1, RELN, GSK3B,
GRIN2B, NTRK2, AKT1, VLDLR, APP, SRC, FN1, NOTCH1, MAPT,
L-tyrosine, CRK, FABP7 | Encodes a large
secreted extracellular matrix protein that controls cell-cell
interactions, and is critical for cell positioning and neuronal
migration during brain development. Regulates microtubule function
in neurons. Binds very-low-density lipoprotein particle
receptor. | Thyroid hormone
metabolic process, which regulates the bone remodeling. |
| EDA |
Ectodysplasin-A | 3.69 | NFkB, WNT10B,
WNT10A, PTHLH, AREG, EPGN, FGF20 | Transmembrane
protein of the tumor necrosis factor (TNF) family which is
important in the development of ectodermal tissues. Involved in
epithelial-mesenchymal signaling during morphogenesis of ectodermal
organs. Takes part in immune response. | Positively
regulates canonical Wingless receptor signaling pathway. Wnt
signaling pathway takes part in regulation of bone homeostasis.
Positively regulates I-κB kinase/nuclear factor-κB cascade as well
as NF-κB activity and import into nucleus. NF-κB has well known
crucial role in osteoblast and osteoclast activities. |
| SLITRK5 | SLIT and NTRK- like
family, member 5 | 3.69 | N/A | SLITRKs are
expressed predominantly in neural tissues and have
neurite-modulating activity. Suppresses neurite outgrowth. Involved
in axonogenesis, dendrite morphogenesis, skin development and
response to xenobiotic stimulus. | N/A |
| Table IVMost upregulated molecules of
nilotinib treated cells in ingenuity pathway analysis. |
Table IV
Most upregulated molecules of
nilotinib treated cells in ingenuity pathway analysis.
| Gene symbol | Gene name | logFC | Regulates | General
function | Function related to
bone biology |
|---|
| RPS23 | Ribosomal protein
S23 | 3.45 | rnr | Encodes a ribosomal
protein which is a component of the 40S subunit. | N/A |
| ZFP184 | Zinc finger protein
184 | 3.43 | N/A | Takes part in
sequence-specific DNA binding and in the regulation of
transcription. | N/A |
| EDNRB | Endothelin receptor
type B | 3.04 | Cyclooxygenase,
SLC9A3, nitric oxide, VEGFA, EDN1, Nos, HIF1A, TYR, DNS promoter,
Adcy, Ca2+, GNAI1, GNAO1, RNA polymerase II | Non-specific, G
protein-coupled receptor for endothelin 1, 2, and 3. Located
primarily in the vascular endothelial cells. Involved in
vasoconstriction, vasodilation, bronchoconstriction and cell
proliferation. | N/A |
| DKK4 | Dickkopf homolog
4 | 2.99 | N/A | A member of the
dickkopf family. The secreted protein involved in embryonic
development through interactions with the Wingless (WNT) signaling
pathway. DKKs are important in vertebrate development. They locally
inhibit Wnt regulated processes, such as antero-posterior axial
patterning, limb development, somitogenesis and eye formation. DKKs
are implicated in bone formation and bone disease. | Positively
regulates osteoblast apoptosis, and negatively regulates osteoblast
proliferation, differentiation and the Wnt/β catenin signaling
pathway (29). |
| GABRB1 | γ-aminobutyric acid
(GABA) A receptor, subunit β1 | 2.83 | Ion, chloride | A multisubunit
chloride channel that mediates inhibitory synaptic transmission in
the central nervous system. | N/A |
| RPL17 | Ribosomal protein
L17 | 2.41 | N/A | Encodes a ribosomal
protein that is a component of the 60S subunit. There are multiple
processed pseudogenes of this gene dispersed through the genome,
which is typical for genes encoding ribosomal proteins. Alternative
splicing results in multiple transcript variants. | N/A |
| KLHL41 | Kelch-like 41 | 2.37 | N/A | Member of the
kelch-like family. Thought to function in skeletal muscle
development and differentiation. Regulates proliferation and
differentiation of myoblasts and is involved in myofibril assembly.
Required for pseudopod elongation in transformed cells. | N/A |
| NANOG | Nanog homeobox | 2.06 | GATA4, FAK, NANOG,
FOXD3, POU5F1, PDCD4, CDK6, AHR, GATA6, ZFP42, DNA promoter, DNA
endogenous promoter, RNA polymerase II, SEC22B, PCDHA2 | Transcription
regulator involved in inner cell mass and ES cells proliferation
and self-renewal. Prevents ES cell differentiation towards
extraembryonic endoderm and trophectoderm lineages. Blocks bone
morphogenetic protein-induced mesoderm differentiation of ES cells
by physically interacting with SMAD1 and interfering with the
recruitment of coactivators to the active SMAD transcriptional
complexes. Acts as a transcriptional activator or repressor. | Involved in bone
healing (30), negatively
regulates bone morphogenetic cascade and Wingless signaling
pathway. |
| RPL39 | Ribosomal protein
L39 | 1.99 | N/A | Encodes a ribosomal
protein that is a component of the 60S subunit. | N/A |
Discussion
In the present study, the effects of selective TKI
imatinib and nilotinib on the global gene expression pattern of a
murine osteoblastic cell line culture in vitro was observed.
Previous studies have reported expression data in response to TKI
only of strictly bone-related genes (RANKL, OPG, bone sialoprotein,
osteocalcin, osterix, BMP2 and RUNX2) (2,3,7,8). To
the best of our knowledge, this is the first study to observe the
complete mRNA pattern of osteoblasts by whole transcriptome
analysis. Thus, it was possible to demonstrate the most upregulated
canonical pathways and upstream regulators that were affected in
osteoblast cells by these compounds.
TKIs are widely used drugs for the treatment of
certain oncohematological diseases, the treatment may continue for
decades or the rest of the patient's lives. Therefore, there is a
limitation in the present study as the results reflect the rapid
primary drug effect on gene activities rather than the extended
secondary expression changes. Thus future studies will aim to model
the long-term effects of imatinib and nilotinib in an in
vitro system.
Generally, imatinib and nilotinib inhibit the
proliferation, growth and survival of BCR-ABL-positive cells.
However, several studies have demonstrated contradicting drug
effects on bone remodeling. These TKIs have been shown to attenuate
osteoclastic bone resorption, reduce site-specific bone volume
(7,12,13),
change histomorphometric features of bone, support extracellular
matrix mineralization (7) and
cause concentration-dependent mixed effects on bone turnover
markers and osteoblast activity (31). The results indicate different
effects of imatinib and nilotinib on osteoblast function, which is
reflected in altered gene expression patterns caused by the two
drugs. This may be explained by the different chemical profiles,
different target spectrums and the bound non-kinase molecules of
the examined TKIs (32). Among the
significantly altered genes in the two treatment groups, there were
only three common genes. Zfp184, which participates in
transcription regulation processes and may be important in
osteoblast differentiation through chloride intracellular channel 1
interaction (https://reports.ingenuity.com, http://innatedb.com) (33). Biological roles of Gm11225 and
AI593442 in bone metabolism have not yet been established.
GABA receptor signaling was found among the most
upregulated canonical pathways in the imatinib and nilotinib
groups. GABA receptors mediate signals of the neurotransmitter
GABA. Osteoblasts constitutively express GABA (B) receptor subunits
(34). The overexpression of
several other GABA receptor family members (GABBR2, GABRQ, GABRG3
and GABRB1) was observed following after TKI treatment. Mentink
et al (35) demonstrated
that GABBR2 inhibits alkaline phosphatase activity and calcium
accumulation in mesenchymal stromal cells. Signals via the GABA
pathway can stimulate osteoblastogenesis, and the activation of
GABA (B) receptors upregulates the key osteoblast differentiation
markers: BMP2, secreted protein acidic and rich in
cysteine/osteonectin (SPARC) and osteocalcin (36). During the bone remodeling process,
this signal transduction network may be involved in bone cell
proliferation, differentiation and development. Functional GABA (B)
receptors appear to be predominantly expressed by osteoblasts
rather than osteoclasts during remodeling and skeletogenesis
(34,37).
The most significantly altered pathway in
imatinib-treated osteoblasts was Reelin signaling in neurons, which
is closely associated with nervous system function and development,
as well as synaptogenesis and neurodegeneration. A genome-wide
association study confirmed that genetic variants in the RELN gene
have a crucial role in the development of otosclerosis, a complex
bone remodeling disorder of the otic capsule (38). The extracellular reelin binds to
VLDLR, which was shown to be one of the most upregulated upstream
regulator molecules in the present study as well as
apolipoprotein-E receptor 2 (ApoER2). This interaction indicates
the involvement of tyrosine phosphorylation of DAB1 in the Reelin
pathway (39). Reelin signals
generated following binding to the lipoprotein receptors are also
known to be involved in neuronal migration. The possible role of
the Reelin signaling complex (Reelin/VLDLR/ApoER2/Dab1) in
osteoblasts remains to be revealed.
The present study demonstrated that imatinib
treatment elicited a significant change in the mRNA expression of
genes involved in serotonin receptor signaling. Several types of
serotonin (5-hydroxytryptamine, 5-HT) receptors can be found on
major bone cells (osteoblasts, osteocytes and osteoclasts),
including 5-HT1 and 5-HT2 (40–43).
Expressional changes in another class of serotonin receptors
(HTR5A, 5-HT5A receptor) was also identified. Serotonin may exhibit
regulatory effects on bone and recent data suggested that
gut-derived serotonin may mediate skeletal effects (44). Several in vitro studies have
confirmed the functionality of serotonin signaling in bone cells,
with mixed effects reported (44).
Some suggest a direct stimulatory effect of serotonin on bone
formation pathways, while others have found inhibitory effects.
Serotonin produced in the periphery appears to act as a hormone and
inhibits bone formation. Conversely, serotonin produced in the
brain acts as a neurotransmitter and has a strong positive effect
on bone mass by supporting bone formation and reducing bone
resorption (45). The effect of
serotonin signaling on bone resorption pathways also depends on the
concentration present (46).
However, the specific biochemical nature of serotonergic pathways
influencing bone and their direct and/or indirect effects on bone
metabolism remain unclear.
The EIF2 signaling pathway showed the greatest
expression changes among pathways affected by nilotinib.
Phosphorylated eIF2α and its downstream regulators are involved in
the endoplasmic reticulum stress response of osteoblasts. Stress to
the endoplasmic reticulum (e.g. protein misfolding, viral infection
and nutritional deprivation) modifies transcriptional activation of
bone remodeling and osteogenesis markers (47-49).
In the present study, NANOG was significantly upregulated following
nilotinib usage. This transcription factor is involved in three
different pathways (Embryonic stem cell differentiation into
cardiac lineages, Transcriptional regulatory network in embryonic
stem cells and Role of Oct4 in mammalian embryonic stem cell
pluripotency), which principally control cell pluripotency and
self-renewal mechanisms. NANOG regulates the proliferation and
differentiation of primary bone mesenchymal stem cells (MSCs), as
well as skeletal tissue regeneration. NANOG in MSCs leads to
increased proliferative capacity but expression is downregulated as
MSCs undergo osteogenic differentiation (50). Another study revealed crosstalk
between NANOG and the bone morphogenic protein cascade via direct
binding to SMAD1 (51).
Using IPA analysis, the most upregulated upstream
regulators in imatinib- and nilotinib-treated cells were
identified, which are involved in a wide variety of biological
processes. A number of these genes have been shown to influence
bone metabolism. Nilotinib markedly increased the expression of
Activin A receptors (ACVRs). ACVR1B and ACVR1C are transmembrane
serine/threonine kinases that are members of the transforming
growth factor β (TGF-β) pathway. The type-1 and type-2 receptors
form a heteromeric complex. Within the complex, the type 1
receptors act as downstream transducers of activin signals and
phosphory-late SMAD proteins. The activin signaling has well-known
role in bone homeostasis (24).
Activins affect proliferation, differentiation and activity of bone
cells. Furthermore, they can influence bone turnover, bone mass and
fracture risks (24). One of the
most upregulated molecules following imatinib application was
growth differentiation factor 10 (GDF10), also termed bone
morphogenetic protein 3B, which is a member of the TGFβ
superfamily. GDF10 is involved in skeletal morphogenesis, regulates
osteoblast differentiation and supports skeletal system development
(https://reports.ingenuity.com,
http://www.genecards.org). Unlike the known
bone-forming BMPs, GDF10 is a negative regulator of BMD (52). According to in vitro and
in vivo observations, GDF10 inhibits osteogen-esis and bone
formation (53).
STXBP5L and RPS23 genes were the most sensitive with
the greatest fold changes following imatinib and nilotinib
treatment. STXBP5L participates in vesicle transport and exocytosis
(http://www.genecards.org). It is also involved in
the regulation of protein secretion, protein transport, glucose
homeostasis and regulation of insulin secretion (https://reports.ingenuity.com, http://www.ncbi.nlm.nih.gov/gene). RPS23 gene encodes
a cytoplasm-located ribosomal protein that is a component of the
40S subunit (https://reports.ingenuity.com, http://www.genecards.org). However, the direct role of
these two most upregulated molecules in bone metabolism is
presently unknown.
The limitations of this preliminary study are that
the experiments were only performed on MC3T3-E1 osteoblastic cells.
Further investigation is required to confirm changes in a number of
the reported genes by reverse transcription-quantitative polymerase
chain reaction or functional tests, and parallel treatment of other
cell lines in order to validate the biologically significant
targets.
In conclusion, the specifically altered gene
expression patterns in response to imatinib and nilotinib observed
in the osteoblast cultures may explain the previously observed
in vivo clinical changes in bone metabolism. Further studies
to assess the biological significance of these observations are
required.
Acknowledgments
The authors would like to thank Dr Paul Manley and
Mrs. Andrea Khoshdel (Novartis, Budapest, Hungary) for providing
imatinib and nilotinib compounds and Dr István Nagy, director of
SeqOmics Biotechnology Ltd. (Szeged, Hungary) for high-throughput
RNA sequencing. They would also like to acknowledge Dr Attila
Patócs, Dr István Marczell and Dr Zsolt Nagy from the MTA-SE
Molecular Genetic Research Group at the 2nd Department of Internal
Medicine, Semmelweis University (Budapest, Hungary) for their
professional assistance with Ingenuity Pathway Analyses.
Abbreviations:
|
TKI
|
tyrosine kinase inhibitors
|
|
CML
|
chronic myelogenous leukemia
|
|
ABL
|
abelson kinase
|
|
BCR-ABL
|
breakpoint cluster region-abelson
fusion oncoprotein
|
|
OPG
|
osteoprotegerin
|
|
RANKL
|
receptor activator of nuclear factor
κ-B ligand
|
|
c-KIT
|
stem cell growth factor receptor
|
|
PDGFR
|
platelet-derived growth factor
receptor
|
|
TBV
|
trabecular bone volume
|
|
BMD
|
bone mineral density
|
|
SOLiD
|
Sequencing by Oligonucleotide Ligation
and Detection
|
|
IPA
|
ingenuity pathway analysis
|
|
logFC
|
logarithmic fold change
|
References
|
1
|
Cohen MH, Moses ML and Pazdur R: Gleeve™
for the treatment of chronic myelogenous leukemia: U.S. food and
drug administration regulatory mechanisms, accelerated approval,
and orphan drug status. Oncologist. 7:390–392. 2002. View Article : Google Scholar
|
|
2
|
Tibullo D, Barbagallo I, Giallongo C, La
Cava P, Branca A, Conticello C, Stagno F, Chiarenza A, Palumbo GA
and Di Raimondo F: Effects of second-generation tyrosine kinase
inhibitors towards osteogenic differentiation of human mesenchymal
cells of healthy donors. Hematol Oncol. 30:27–33. 2012. View Article : Google Scholar
|
|
3
|
O'Sullivan S, Lin JM, Watson M, Callon K,
Tong PC, Naot D, Horne A, Aati O, Porteous F, Gamble G, et al: The
skeletal effects of the tyrosine kinase inhibitor nilotinib. Bone.
49:281–289. 2011. View Article : Google Scholar : PubMed/NCBI
|
|
4
|
Wihlidal P, Karlic H, Pfeilstöcker M,
Klaushofer K and Varga F: Imatinib mesylate (IM)-induced growth
inhibition is associated with production of spliced
osteocalcin-mRNA in cell lines. Leuk Res. 32:437–443. 2008.
View Article : Google Scholar
|
|
5
|
Tibullo D, Giallongo C, La Cava P,
Berretta S, Stagno F, Chiarenza A, Conticello C, Palumbo GA and Di
Raimondo F: Effects of imatinib mesylate in osteoblastogenesis. Exp
Hematol. 37:461–468. 2009. View Article : Google Scholar : PubMed/NCBI
|
|
6
|
O'Sullivan S, Naot D, Callon K, Porteous
F, Horne A, Wattie D, Watson M, Cornish J, Browett P and Grey A:
Imatinib promotes osteoblast differentiation by inhibiting PDGFR
signaling and inhibits osteoclastogenesis by both direct and
stromal cell-dependent mechanisms. J Bone Miner Res. 22:1679–1689.
2007. View Article : Google Scholar : PubMed/NCBI
|
|
7
|
Fitter S, Dewar AL, Kostakis P, To LB,
Hughes TP, Roberts MM, Lynch K, Vernon-Roberts B and Zannettino AC:
Long-term imatinib therapy promotes bone formation in CML patients.
Blood. 111:2538–2547. 2008. View Article : Google Scholar
|
|
8
|
Jönsson S, Hjorth-Hansen H, Olsson B,
Wadenvik H, Sundan A and Standal T: Imatinib inhibits proliferation
of human mesenchymal stem cells and promotes early but not late
osteoblast differentiation in vitro. J Bone Miner Metab.
30:119–123. 2012. View Article : Google Scholar
|
|
9
|
Fierro F, Illmer T, Jing D, Schleyer E,
Ehninger G, Boxberger S and Bornhauser M: Inhibition of
platelet-derived growth factor receptorbeta by imatinib mesylate
suppresses proliferation and alters differentiation of human
mesenchymal stem cells in vitro. Cell Prolif. 40:355–366. 2007.
View Article : Google Scholar : PubMed/NCBI
|
|
10
|
Vandyke K, Fitter S, Dewar AL, Hughes TP
and Zannettino AC: Dysregulation of bone remodeling by imatinib
mesylate. Blood. 115:766–774. 2010. View Article : Google Scholar
|
|
11
|
Benito R, Lumbreras E, Abáigar M,
Gutiérrez NC, Delgado M, Robledo C, García JL, Rodríguez-Vicente
AE, Cañizo MC and Rivas JM: Imatinib therapy of chronic myeloid
leukemia restores the expression levels of key genes for DNA damage
and cell-cycle progression. Pharmacogenet Genomics. 22:381–388.
2012.PubMed/NCBI
|
|
12
|
Vandyke K, Fitter S, Drew J, Fukumoto S,
Schultz CG, Sims NA, Yeung DT, Hughes TP and Zannettino AC:
Prospective histomorphometric and DXA evaluation of bone remodeling
in imatinib-treated CML patients: Evidence for site-specific
skeletal effects. J Clin Endocrinol Metab. 98:67–76. 2013.
View Article : Google Scholar
|
|
13
|
Berman E, Nicolaides M, Maki RG, Fleisher
M, Chanel S, Scheu K, Wilson BA, Heller G and Sauter NP: Altered
bone and mineral metabolism in patients receiving imatinib
mesylate. N Engl J Med. 354:2006–2013. 2006. View Article : Google Scholar : PubMed/NCBI
|
|
14
|
Berman E, Girotra M, Cheng C, Chanel S,
Maki R, Shelat M, Strauss HW, Fleisher M, Heller G and Farooki A:
Effect of long term imatinib on bone in adults with chronic
myelogenous leukemia and gastrointestinal stromal tumors. Leuk Res.
37:790–794. 2013. View Article : Google Scholar : PubMed/NCBI
|
|
15
|
Jonsson S, Olsson B, Ohlsson C, Lorentzon
M, Mellström D and Wadenvik H: Increased cortical bone
mineralization in imatinib treated patients with chronic
myelogenous leukemia. Haematologica. 93:1101–1103. 2008. View Article : Google Scholar : PubMed/NCBI
|
|
16
|
O'Sullivan S, Horne A, Wattie D, Porteous
F, Callon K, Gamble G, Ebeling P, Browett P and Grey A: Decreased
bone turnover despite persistent secondary hyperparathyroidism
during prolonged treatment with imatinib. J Clin Endocrinol Metab.
94:1131–1136. 2009. View Article : Google Scholar : PubMed/NCBI
|
|
17
|
Hoehn D, Medeiros LJ, Kantarjian HM,
Cortes JE, Wang XM and Bueso-Ramos CE: Digital image analysis as a
tool to assess the effects of imatinib on trabecular bone in
patients with chronic myelogenous leukemia. Hum Pathol.
43:2354–2359. 2012. View Article : Google Scholar : PubMed/NCBI
|
|
18
|
Lawrence L: Long-term treatment with
imatinib affected bone mineral density. Cancer Network; 2013
|
|
19
|
Reiner A, Yekutieli D and Benjamini Y:
Identifying differentially expressed genes using false discovery
rate controlling procedures. Bioinformatics. 19:368–375. 2003.
View Article : Google Scholar : PubMed/NCBI
|
|
20
|
Yoav Benjamini YH: Controlling the false
discovery rate: A practical and powerful approach to multiple
testing. J R Stat Soc Series B Stat Methodol. 57:289–300. 1995.
|
|
21
|
Onishi M, Fujita Y, Yoshikawa H and
Yamashita T: Inhibition of Rac1 promotes BMP-2-induced osteoblastic
differentiation. Cell Death Dis. 4:e6982013. View Article : Google Scholar : PubMed/NCBI
|
|
22
|
Ma Z, Thomas KS, Webb DJ, Moravec R,
Salicioni AM, Mars WM and Gonias SL: Regulation of Rac1 activation
by the low density lipoprotein receptor-related protein. J Cell
Biol. 159:1061–1070. 2002. View Article : Google Scholar : PubMed/NCBI
|
|
23
|
Li S, Guo HB, Liu YS, Wu F, Zhang H, Zhang
Z, Xie Z, Sheng Z and Liao E: Relationships of serum lipid profiles
and bone mineral density in postmenopausal Chinese women. Clin
Endocrinol (Oxf). 82:53–58. 2015. View Article : Google Scholar
|
|
24
|
Lotinun S, Scott Pearsall R, Horne WC and
Baron R: Activin receptor signaling: A potential therapeutic target
for osteoporosis. Curr Mol Pharmacol. 5:S195–S204. 2012. View Article : Google Scholar
|
|
25
|
Chanprasertyothin S, Saetung S,
Rajatanavin R and Ongphiphadhanakul B: Genetic variant in the
aquaporin 9 gene is associated with bone mineral density in
postmenopausal women. Endocrine. 38:83–86. 2010. View Article : Google Scholar : PubMed/NCBI
|
|
26
|
Aharon R and Bar-Shavit Z: Involvement of
aquaporin 9 in osteoclast differentiation. J Biol Chem.
281:19305–19309. 2006. View Article : Google Scholar : PubMed/NCBI
|
|
27
|
Liu Y, Song L, Wang Y, Rojek A, Nielsen S,
Agre P and Carbrey JM: Osteoclast differentiation and function in
aquaglyceroporin AQP9-null mice. Biol Cell. 101:133–140. 2009.
View Article : Google Scholar
|
|
28
|
Kraus DM, Elliott GS, Chute H, Horan T,
Pfenninger KH, Sanford SD, Foster S, Scully S, Welcher AA and
Holers VM: CSMD1 is a novel multiple domain complement-regulatory
protein highly expressed in the central nervous system and
epithelial tissues. J Immunol. 176:4419–4430. 2006. View Article : Google Scholar : PubMed/NCBI
|
|
29
|
Hiramitsu S, Terauchi M and Kubota T: The
effects of Dickkopf-4 on the proliferation, differentiation, and
apoptosis of osteoblasts. Endocrinology. 154:4618–4626. 2013.
View Article : Google Scholar : PubMed/NCBI
|
|
30
|
Bais M, McLean J, Sebastiani P, Young M,
Wigner N, Smith T, Kotton DN, Einhorn TA and Gerstenfeld LC:
Transcriptional analysis of fracture healing and the induction of
embryonic stem cell-related genes. PLoS One. 4:e53932009.
View Article : Google Scholar : PubMed/NCBI
|
|
31
|
Aleman JO, Farooki A and Girotra M:
Effects of tyrosine kinase inhibition on bone metabolism:
Untargeted consequences of targeted therapies. Endocr Relat Cancer.
21:R247–R259. 2014. View Article : Google Scholar : PubMed/NCBI
|
|
32
|
Rix U, Hantschel O, Düernberger G, Remsing
Rix LL, Planyavsky M, Fernbach NV, Kaupe I, Bennett KL, Valent P,
Colinge J, et al: Chemical proteomic profiles of the BCR-ABL
inhibitors imatinib, nilotinib and dasatinib, reveal novel kinase
and nonkinase targets. Blood. 110:4055–4063. 2007. View Article : Google Scholar : PubMed/NCBI
|
|
33
|
Yang JY, Jung JY, Cho SW, Choi HJ, Kim SW,
Kim SY, Kim HJ, Jang CH, Lee MG, Han J and Shin CS: Chloride
intracellular channel 1 regulates osteoblast differentiation. Bone.
45:1175–1185. 2009. View Article : Google Scholar : PubMed/NCBI
|
|
34
|
Fujimori S, Hinoi E and Yoneda Y:
Functional GABA (B) receptors expressed in cultured calvarial
osteoblasts. Biochem Biophys Res Commun. 293:1445–1452. 2002.
View Article : Google Scholar : PubMed/NCBI
|
|
35
|
Mentink A, Hulsman M, Groen N, Licht R,
Dechering KJ, van der Stok J, Alves HA, Dhert WJ, van Someren EP,
Reinders MJ, et al: Predicting the therapeutic efficacy of MSC in
bone tissue engineering using the molecular marker CADM1.
Biomaterials. 34:4592–4601. 2013. View Article : Google Scholar : PubMed/NCBI
|
|
36
|
Muhammad SI, Maznah I, Mahmud R, Zuki AB
and Imam MU: Upregulation of genes related to bone formation by
γ-amino butyric acid and gamma-oryzanol in germinated brown rice is
via the activation of GABA (B)-receptors and reduction of serum
IL-6 in rats. Clin Interv Aging. 8:1259–1271. 2013. View Article : Google Scholar :
|
|
37
|
Takahata Y, Takarada T, Hinoi E, Nakamura
Y, Fujita H and Yoneda Y: Osteoblastic γ-aminobutyric acid, type B
receptors negatively regulate osteoblastogenesis toward disturbance
of osteoclastogenesis mediated by receptor activator of nuclear
factor κB ligand in mouse bone. J Biol Chem. 286:32906–32917. 2011.
View Article : Google Scholar : PubMed/NCBI
|
|
38
|
Schrauwen I, Ealy M, Huentelman MJ, Thys
M, Homer N, Vanderstraeten K, Fransen E, Corneveaux JJ, Craig DW,
Claustres M, et al: A genome-wide analysis identifies genetic
variants in the RELN gene associated with otosclerosis. Am J Hum
Genet. 84:328–338. 2009. View Article : Google Scholar : PubMed/NCBI
|
|
39
|
May P, Herz J and Bock HH: Molecular
mechanisms of lipo-protein receptor signalling. Cell Mol Life Sci.
62:2325–2338. 2005. View Article : Google Scholar : PubMed/NCBI
|
|
40
|
Westbroek I, van der Plas A, de Rooij KE,
Klein-Nulend J and Nijweide PJ: Expression of serotonin receptors
in bone. J Biol Chem. 276:28961–28968. 2001. View Article : Google Scholar : PubMed/NCBI
|
|
41
|
Bliziotes MM, Eshleman AJ, Zhang XW and
Wiren KM: Neurotransmitter action in osteoblasts: Expression of a
functional system for serotonin receptor activation and reuptake.
Bone. 29:477–486. 2001. View Article : Google Scholar : PubMed/NCBI
|
|
42
|
Dai SQ, Yu LP, Shi X, Wu H, Shao P, Yin GY
and Wei YZ: Serotonin regulates osteoblast proliferation and
function in vitro. Braz J Med Biol Res. 47:759–765. 2014.
View Article : Google Scholar : PubMed/NCBI
|
|
43
|
Yadav VK and Karsenty G: Serotonin: A new
player in the regulation of bone remodeling. Medicographia.
32:357–363. 2010.
|
|
44
|
Bliziotes M: Update in serotonin and bone.
J Clin Endocrinol Metab. 95:4124–4132. 2010. View Article : Google Scholar : PubMed/NCBI
|
|
45
|
Ducy P and Karsenty G: The two faces of
serotonin in bone biology. J Cell Biol. 191:7–13. 2010. View Article : Google Scholar : PubMed/NCBI
|
|
46
|
Battaglino R, Fu J, Späte U, Ersoy U, Joe
M, Sedaghat L and Stashenko P: Serotonin regulates osteoclast
differentiation through its transporter. J Bone Miner Res.
19:1420–1431. 2004. View Article : Google Scholar : PubMed/NCBI
|
|
47
|
Saito A, Ochiai K, Kondo S, Tsumagari K,
Murakami T, Cavener DR and Imaizumi K: Endoplasmic reticulum stress
response mediated by the PERK-eIF2 alpha-ATF4 pathway is involved
in osteoblast differentiation induced by BMP2. J Biol Chem.
286:4809–4818. 2011. View Article : Google Scholar
|
|
48
|
Hamamura K and Yokota H: Stress to
endoplasmic reticulum of mouse osteoblasts induces apoptosis and
transcriptional activation for bone remodeling. FEBS Lett.
581:1769–1774. 2007. View Article : Google Scholar : PubMed/NCBI
|
|
49
|
Hirasawa H, Jiang C, Zhang P, Yang FC and
Yokota H: Mechanical stimulation suppresses phosphorylation of
eIF2alpha and PERK-mediated responses to stress to the endoplasmic
reticulum. FEBS Lett. 584:745–752. 2010. View Article : Google Scholar
|
|
50
|
Bais MV, Shabin ZM, Young M, Einhorn TA,
Kotton DN and Gerstnefeld LC: Role of Nanog in the maintenance of
marrow stromal stem cells during post natal bone regeneration.
Biochem Biophys Res Commun. 417:211–216. 2012. View Article : Google Scholar :
|
|
51
|
Suzuki A, Raya A, Kawakami Y, Morita M,
Matsui T, Nakashima K, Gaget FH, Rodríguez-Esteban C and Izpisúa
Belmonte JC: Nanog binds to Smad1 and blocks bone morphogenetic
protein-induced differentiation of embryonic stem cells. Proc Natl
Acad Sci USA. 103:10294–10299. 2006. View Article : Google Scholar : PubMed/NCBI
|
|
52
|
Daluiski A, Engstrand T, Bahamonde ME,
Gamer LW, Agius E, Stevenson SL, Cox K, Rosen V and Lyons KM: Bone
morphogenetic protein-3 is a negative regulator of bone density.
Nat Genet. 27:84–88. 2001. View
Article : Google Scholar : PubMed/NCBI
|
|
53
|
Bahamonde ME and Lyons KM: BMP3: To be or
not to be a BMP. J Bone Joint Surg. 83-A(Suppl 1): S56–S62.
2001.PubMed/NCBI
|