Introduction
Alcoholic liver disease (ALD) is a complex disease
with multifaceted metabolic abnormalities and has become a major
life-threatening disease (1). The
developmental progression of ALD ranges from fatty liver to hepatic
inflammation, necrosis, progressive fibrosis and hepatocellular
carcinoma, and the advanced-stage disease is difficult to treat
successfully (2–4).
The underlying mechanisms of disease progression
remain to be fully elucidated, which hinders the development of
treatment therapies for ALD. Thus, there is remains no Food and
Drug Administration-approved or widely accepted therapeutic agent
for any of the stages of ALD. Traditional Chinese medicine (TCM)
formulas have multiple targets, few toxic side effects and exert
holistic therapeutic effects. TCM agents have been used for
centuries to treat alcohol liver injury, with efficacy validated in
a series of clinical experiments (5). Zhi-Zi-Da-Huang Decoction (ZZDHD), a
classic TCM formula, which was first described in Jin-Kui-Yao-Lue,
the classic clinical book of TCM (6). ZZDHD is a combination of four crude
herbs, Gardenia jasminoides Ellis (Zhi-Zi), Rheum
officinale Baill. (Da-Huang), Citrus aurantium L.
(Zhi-Shi) and Semen Sojae Preparatum (Dan-Dou-Chi). ZZDHD has been
commonly used to treat or alleviate the symptoms of alcoholic
jaundice and ALD (6–8). However, the potential mechanisms that
mediate the effects have not been fully elucidated.
Metabolomics, a powerful tool of systems biology, is
defined as “quantitative measurement of time-related
multiparametric metabolic response of living systems to
pathophysiological stimuli or genetic modification” (9). It has been widely used for the
assessment of disease models, early diagnosis and research on the
mechanisms of therapeutic agents (9–14).
Nuclear magnetic resonance (NMR)-based metabolomics, which is a
highly sensitive, specific and useful tool to provide a rapid,
non-destructive and relatively simple sample preparation (1,15–17),
has been used for disease diagnosis, the identification of
metabolic pathways associated with disease or drug treatment, and
to elucidate biomarkers from biofluids (18–20).
NMR-based metabolomics may also provide molecular insights into
pathophysiology and therapeutic effects by tracking the dynamic
changes of identified potential endogenous biomarkers, which makes
it a useful method for the evaluation of the holistic and
systematic effects of the TCM formula on ALD.
The present study used an NMR-based metabolomic
approach to identify potential characteristic urinary biomarkers in
rats with alcohol-induced liver damage following administration of
ZZDHD, and subsequently determined the dynamic profiling of
potential characteristic biomarkers identified in the alcohol or
ZZDHD group rats compared with the control group rats in order to
investigate specific changes to endogenous metabolites and the
underlying mechanisms.
Materials and methods
Chemicals and reagents
Analytical grade sodium chloride, methanol, ethanol,
acetic acid, K2HPO4·3H2O and
NaH2PO4·2H2O were purchased from
Nanjing Chemical Reagent Co., Ltd. (Nanjing, China).
NaN3 was obtained from Sinopharm Chemical Reagent Co.,
Ltd. (Shanghai, China). D2O (99.9% D) and trimethylsilyl
propionate (TSP) were obtained from Sigma-Aldrich (St. Louis, MO,
USA). Phosphate buffer
(K2HPO4/NaH2PO4, 1.5 M,
pH 7.4) prepared in D2O containing 0.1% (w/v) TSP and
0.1% NaN3 (w/v) was used for NMR sample preparation.
Preparation of the ZZDHD extract
All crude herbs were authenticated by Prof. Ping Li
(Department of Medicinal Plants, China Pharmaceutical University,
Nanjing, China). A mixture of 9 g Gardenia jasminoides
Ellis, 3 g Rheum officinale Baill., 12 g Citrus
aurantium L. and 24 g Semen Sojae Preparatum were extracted in
480 ml of distilled water and boiled for 30 min. The mixture was
strained through a five-layer bandage. This procedure was repeated
twice and the filtrate was freeze-dried for experimental usage.
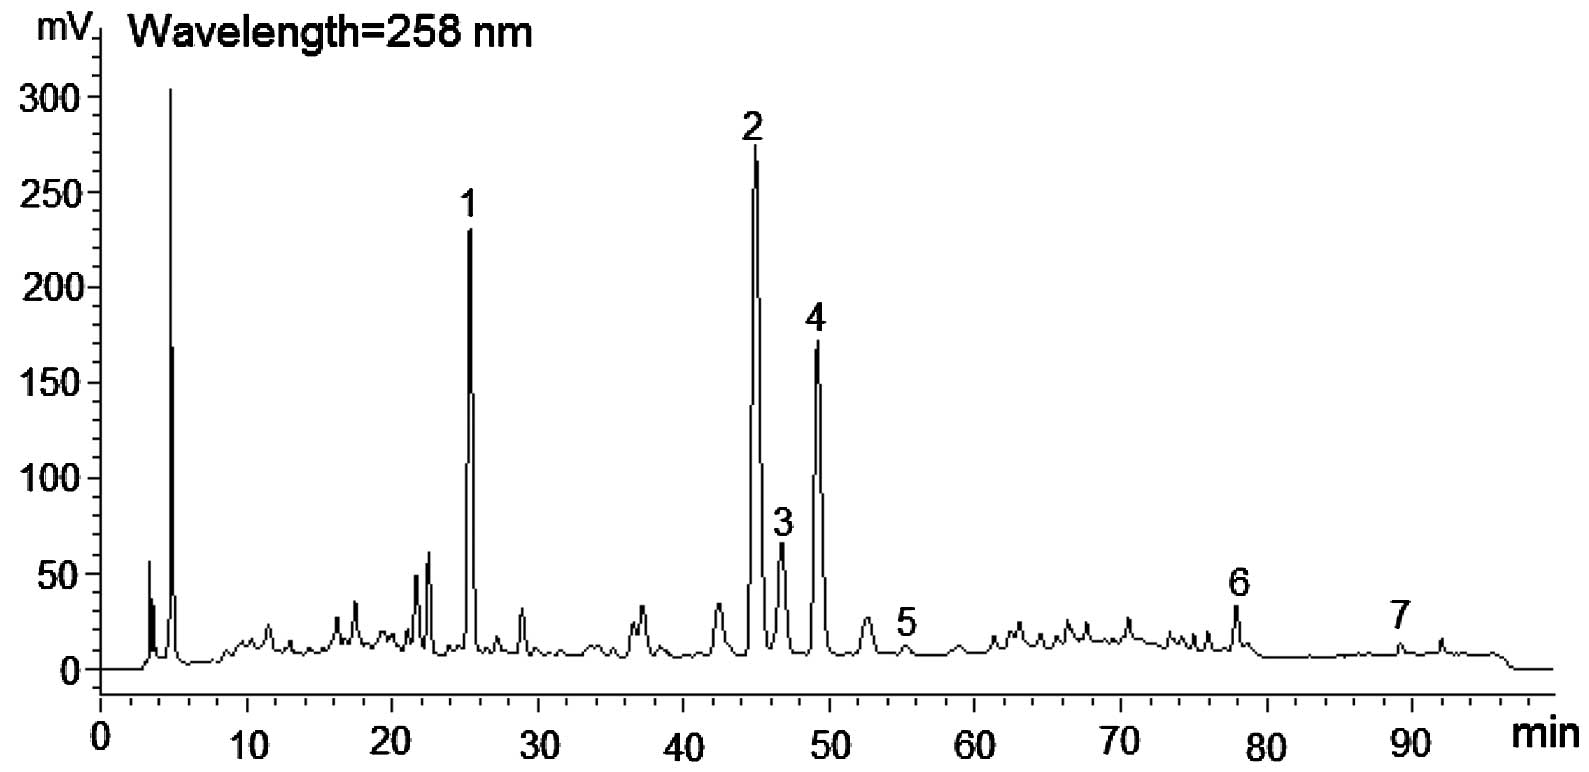
High-performance liquid chromatography analysis of freeze-dried
ZZDHD powder is presented in Fig.
1.
Animal handling and sample
collection
A total of 24 clean-grade, male Sprague-Dawley rats
(age, 6 weeks; weight, 200±20 g) were obtained from the Animal
Multiplication Centre of Qinglong Mountain (Nanjing, China). All
animal experiments were implemented strictly in accordance with the
guidance for Experimental Animal Welfare of the National Guidelines
at the Centre for SPF-grade Animal Experiments at the Jiangsu
Institute for Food and Drug Control (Nanjing, China). The animals
were housed in an animal facility with the following parameters:
Temperature, 25±2°C; humidity, 60±5% and artificial 12-h light/dark
cycle. The animals were acclimatized for 7 days prior to
experiments with access to the certified standard chow and water.
Subsequently, the rats were randomly divided into three groups
(n=8), the control group (CG), the alcohol group (AG) and the ZZDHD
group (ZG). Water was orally administered to the control rats
between 5:00 pm and 6:00 pm from day 1–8. The AG rats received
water orally between 5:00 pm and 6:00 pm from day 1–2 and then 50%
alcohol at a dose of 5 g/kg/day from day 3–8. The ZG rats were
orally treated with freeze-dried ZZDHD powder at a dose of 12
g/kg/day between 3:00 pm and 4:00 pm from day 1–8. Simultaneously,
the ZG rats were also orally administered with 50% alcohol at a
dose of 5 g/kg/day between 5:00 pm and 6:00 pm from day 3–8. All
overnight urine samples for each rat were collected (from 8:00 pm
to 8:00 am) manually to prevent contamination on days 0, 3, 4, 5,
6, 7 and 8. Urine collection tubes were stored at low temperatures
(0–4°C) using a cooling bath and NaN3 solution (0.1%
w/v) was added to inhibit bacterial growth. The urine samples were
stored at −80°C prior to 1H NMR analysis. At 8:00 pm on
day 8, all animals were fasted and then euthanized after 12 h using
4% isoflurane anesthesia (Shandong Keyuan Pharmaceutical Co., Ltd.,
Jinan, China). The liver and serum samples from all groups were
collected immediately on day 9 (8:00 am). The experimental
procedures were approved by the Animal Care and Ethics Committee at
the Jiangsu Institute for Food and Drug Control. All surgeries were
performed under isoflurane anesthesia and all efforts were made to
ameliorate the suffering of the animals.
Biochemical analysis and histology
assay
Alanine aminotransferase (ALT) and aspartate
aminotransferase (AST) activities, liver superoxide dismutase (SOD)
activity, and glutathione (GSH) and malondialdehyde (MDA)
concentration in the liver homogenate were analyzed with commercial
kits according to the manufacturer's protocol in the Experiment
Centre at the Jiangsu Institute for Food and Drug Control (Jiangsu,
China). The assay kits for AST (cat. no. 20121007), ALT (cat. no.
20121010), SOD (cat. no. 20121209), GSH (cat. no. 20121208) and MDA
(cat. no. 20121211) were purchased from the Nanjing Jiancheng
Bioengineering Institute (Nanjing, China). The biochemical
parameters were calculated and expressed as the mean ± standard
deviation and P<0.05 was considered to indicate a statistically
significant difference. For hematoxylin and eosin staining, a
portion of the same liver lobe in each rat was immediately fixed
via immersion in 10% neutral-buffered formalin, embedded in
paraffin and sectioned into slices of 4–5 μm. For the
remaining liver tissue, Oil red O staining was performed on 10–15
μm frozen liver sections.
NMR spectroscopy and statistical
analysis
Frozen urine samples were thawed at room
temperature. A total of 500 μl urine was analyzed following
the addition of 50 μl D2O solution, this addition
provided a lock signal containing 5 mM TSP as a reference for the
chemical shift. The mixture was centrifuged at 16,099 × g for 10
min at 4°C. These solutions were then transferred to 5 mm NMR
tubes. For each sample, a 1H NMR spectrum was acquired
on a Bruker AV 500 MHz spectrometer at 300 K and recorded using a
standard NOESYPR1D pulse sequence (recycle
delay-90°-t1-90°-tm-90°-acquisition). The
1H NMR spectra were determined using 160 scans spectra
and a Fourier transform was used, following an exponential
line-broadening function of 0.25 Hz. All urinary spectra were then
manually phased, baseline corrected and referenced to TSP
(CH3, δ 0.0) using TOPSPIN software (version 2.1, Bruker
Biospin GmbH, Rheinstetten, Germany).
All 1H NMR spectra were processed using
the AMIX software package (Bruker Biospin GmbH). Regions from
0.5–4.5 and 5.98–9.5 ppm were included in the integration, as
regions ≤0.5 and ≥9.5 ppm contained only noise, and the spectral
region 4.50–5.98 ppm contained the suppression of water resonances
and cross-relaxation effects. To account for the presence of
ethanol and ethyl glucuronide (EtG) in the samples from the AG, the
spectra were integrated into bins with a width of 0.04 ppm,
following the removal of the bins that contained the ethanol and
EtG peaks (21) and then
normalized via probabilistic quotient normalization. A multivariate
data analysis was performed using the software package SIMCA-P
(version 13.0, Umetrics, Malmö, Sweden). Orthogonal projection to
latent structure discriminant analysis (OPLS-DA), a supervised
multivariate data analysis tool, was used with 7-fold
cross-validation and the pareto-scaled data as the X-matrix and the
class information as the Y-matrix in order to identify metabolites
with significant intergroup differences. The fit of the models were
evaluated using R2X and Q2, which
respectively represent the explained variations and predictability
of the models. Values of these parameters near 1.0 indicated an
effective and stable model, with predictive reliability. All models
were additionally tested using the cross-validated analysis of
variance approach. P<0.05 was considered to indicate a
statistically significant difference. A univariate analysis was
also applied to verify statistically significant metabolites using
parametric (Student's t-test) or nonparametric (Mann-Whitney test)
tests for potential characteristic biomarkers.
To obtain the dynamic changes of potential
characteristic biomarkers following ZZDHD intervention, the ratios
of the metabolites were calculated for the corresponding time
points in the forms of [FA -
FC]/FC and [FZ -
FC]/FC, where FA, FC
and FZ stood for the average metabolite concentrations
of the corresponding metabolites following probabilistic quotient
normalization in the AG, CG and ZG, and these results were
expressed as a line graph.
Results
Effects of ZZDHD on biochemical
indicators and histopathological examination of rats with
alcohol-induced liver damage
To determine the hepatoprotective effects of ZZDHD,
the levels of serum AST and ALT and liver SOD, GSH and MDA were
detected. The biochemical analysis indicated that the levels of
AST, ALT, SOD, GSH and MDA were significantly changed in the AG
compared with the CG and ZG (P<0.05; Table I). AG rats had significantly higher
levels of AST and ALT in the serum compared with the CG
(P<0.05). AST and ALT activity in the serum are typically low,
however, the levels of ALT and AST increase in the event of liver
injury. The levels of SOD and GSH were significantly decreased
(P<0.05), and MDA levels were significantly increased, in the AG
compared with the CG (P<0.05). However, the biochemical
indicators, including serum AST, ALT, liver SOD, GSH and MDA, were
markedly improved in the ZG compared with the AG (P<0.05;
Table I). Thus, when combined with
alcohol treatment, the ZZDHD alleviated alcohol-induced liver
damage.
 | Table IPhysiological and biochemical
characteristics from the serum and liver of rats in control,
alcohol and ZZDHD groups. |
Table I
Physiological and biochemical
characteristics from the serum and liver of rats in control,
alcohol and ZZDHD groups.
| Clinical chemistry
data | Control group | Alcohol group | ZZDHD group |
|---|
| ALT (IU/l) | 32.97±1.20b | 58.53±6.22 | 45.32±7.93a |
| AST (IU/l) | 46.89±15.64a | 106.16±27.96 | 85.01±17.73a |
| SOD
(μ/mgprot) |
266.95±50.05a | 167.99±24.96 |
215.23±13.62a |
| GSH
(mg/mgprot) | 28.65±3.58a | 19.11±2.20 | 24.19±2.89a |
| MDA
(nmol/mgprot) | 1.14±0.36a | 2.43±0.60 | 1.41±0.55a |
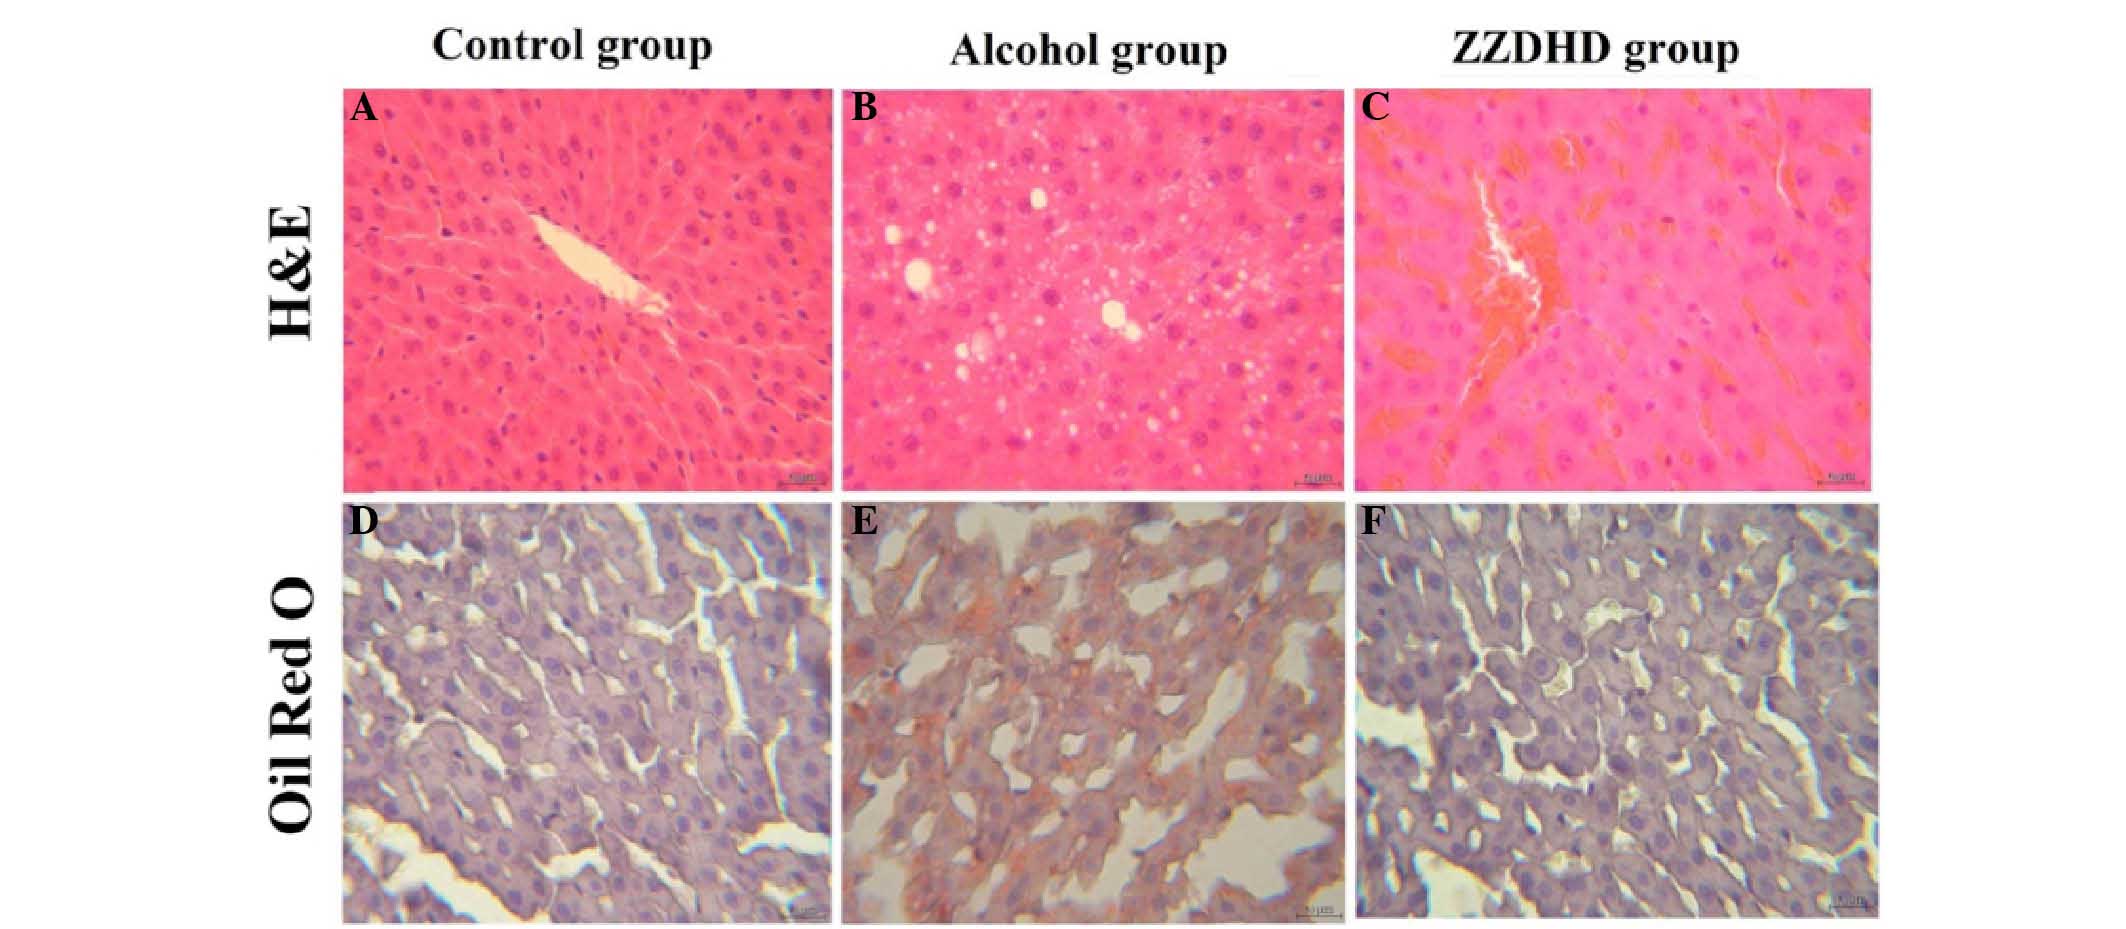
In order to investigate the protective effects of
ZZDHD on hepatic tissue damage, histological analysis was conducted
on rat liver tissues (Fig. 2). The
CG rats exhibited normal liver tissue and no pathological changes
were observed (Fig. 2A), with a
similar phenomenon observed following Oil red O staining (Fig. 2B). However, the AG rats exhibited
fat particles of varying sizes (Fig.
2C and D), thus presenting a degree of hepatic injury.
Histological examination of the ZG did not indicate any observable
fat particles (Fig. 2E and F);
thus, ZZDHD may ameliorate the hepatic steatosis of rats with
alcohol-induced liver damage.
Identification of potential
characteristic biomarkers in rat urine
The typical 1H NMR spectra of rat urine
are presented in Fig. 3 for the
CG, AG and ZG, with major metabolites labeled. With respect to the
identification of differential metabolites, the corresponding
chemical shifts of the metabolites were previously described
(22–25) and are publicly accessible in
metabolomic databases, including Madison (www.mmcd.nmrfam.wisc.edu), Kyoto Encyclopedia of Genes
and Genomes (www.genome.jp/kegg/) and the Human Metabolome Database
(www.hmdb.ca), and using Chenomx NMR Suite software
(version 7.5, Chenomx, Inc., Edmonton, Canada). The detectable
metabolites in these spectra included ethanol, EtG, acetate,
taurine, glycine, lactate, creatinine, creatine, N-acetyl
glycoproteins, dimethylamine (DMA), dimethylglycine (DMG),
methylamine and tricarboxylic acid cycle intermediates (citrate,
α-ketoglutarate and succinate), hippurate, trigonelline and
formate. Compared with the CG, the primary differences in the AG
were the appearance of ethanol and EtG, an increase in creatine,
lactate and glycine, and a decrease in hippurate, DMG, DMA and
tricarboxylic acid cycle intermediates. In the ZG compared with the
AG, hippurate and DMG levels were increased, whereas creatinine and
lactate levels were decreased. Additionally, hippurate levels in
the ZG were significantly increased compared with the AG, and were
even higher compared with the CG.
 | Figure 3Nuclear magnetic resonance 500 MHz 1H
spectra (δ8.5~7.5, δ4.5~1.1 ppm) of rat urine obtained from CG, AG
and ZG. CG, control group; AG, alcohol group; ZG, Zhi-Zi-Da Huang
decoction group; EtG, ethyl glucuronide; DMG, dimethylglycine; DMA,
dimethylamine; MA, methylamine; NAGs, N-acetyl glycoproteins. |
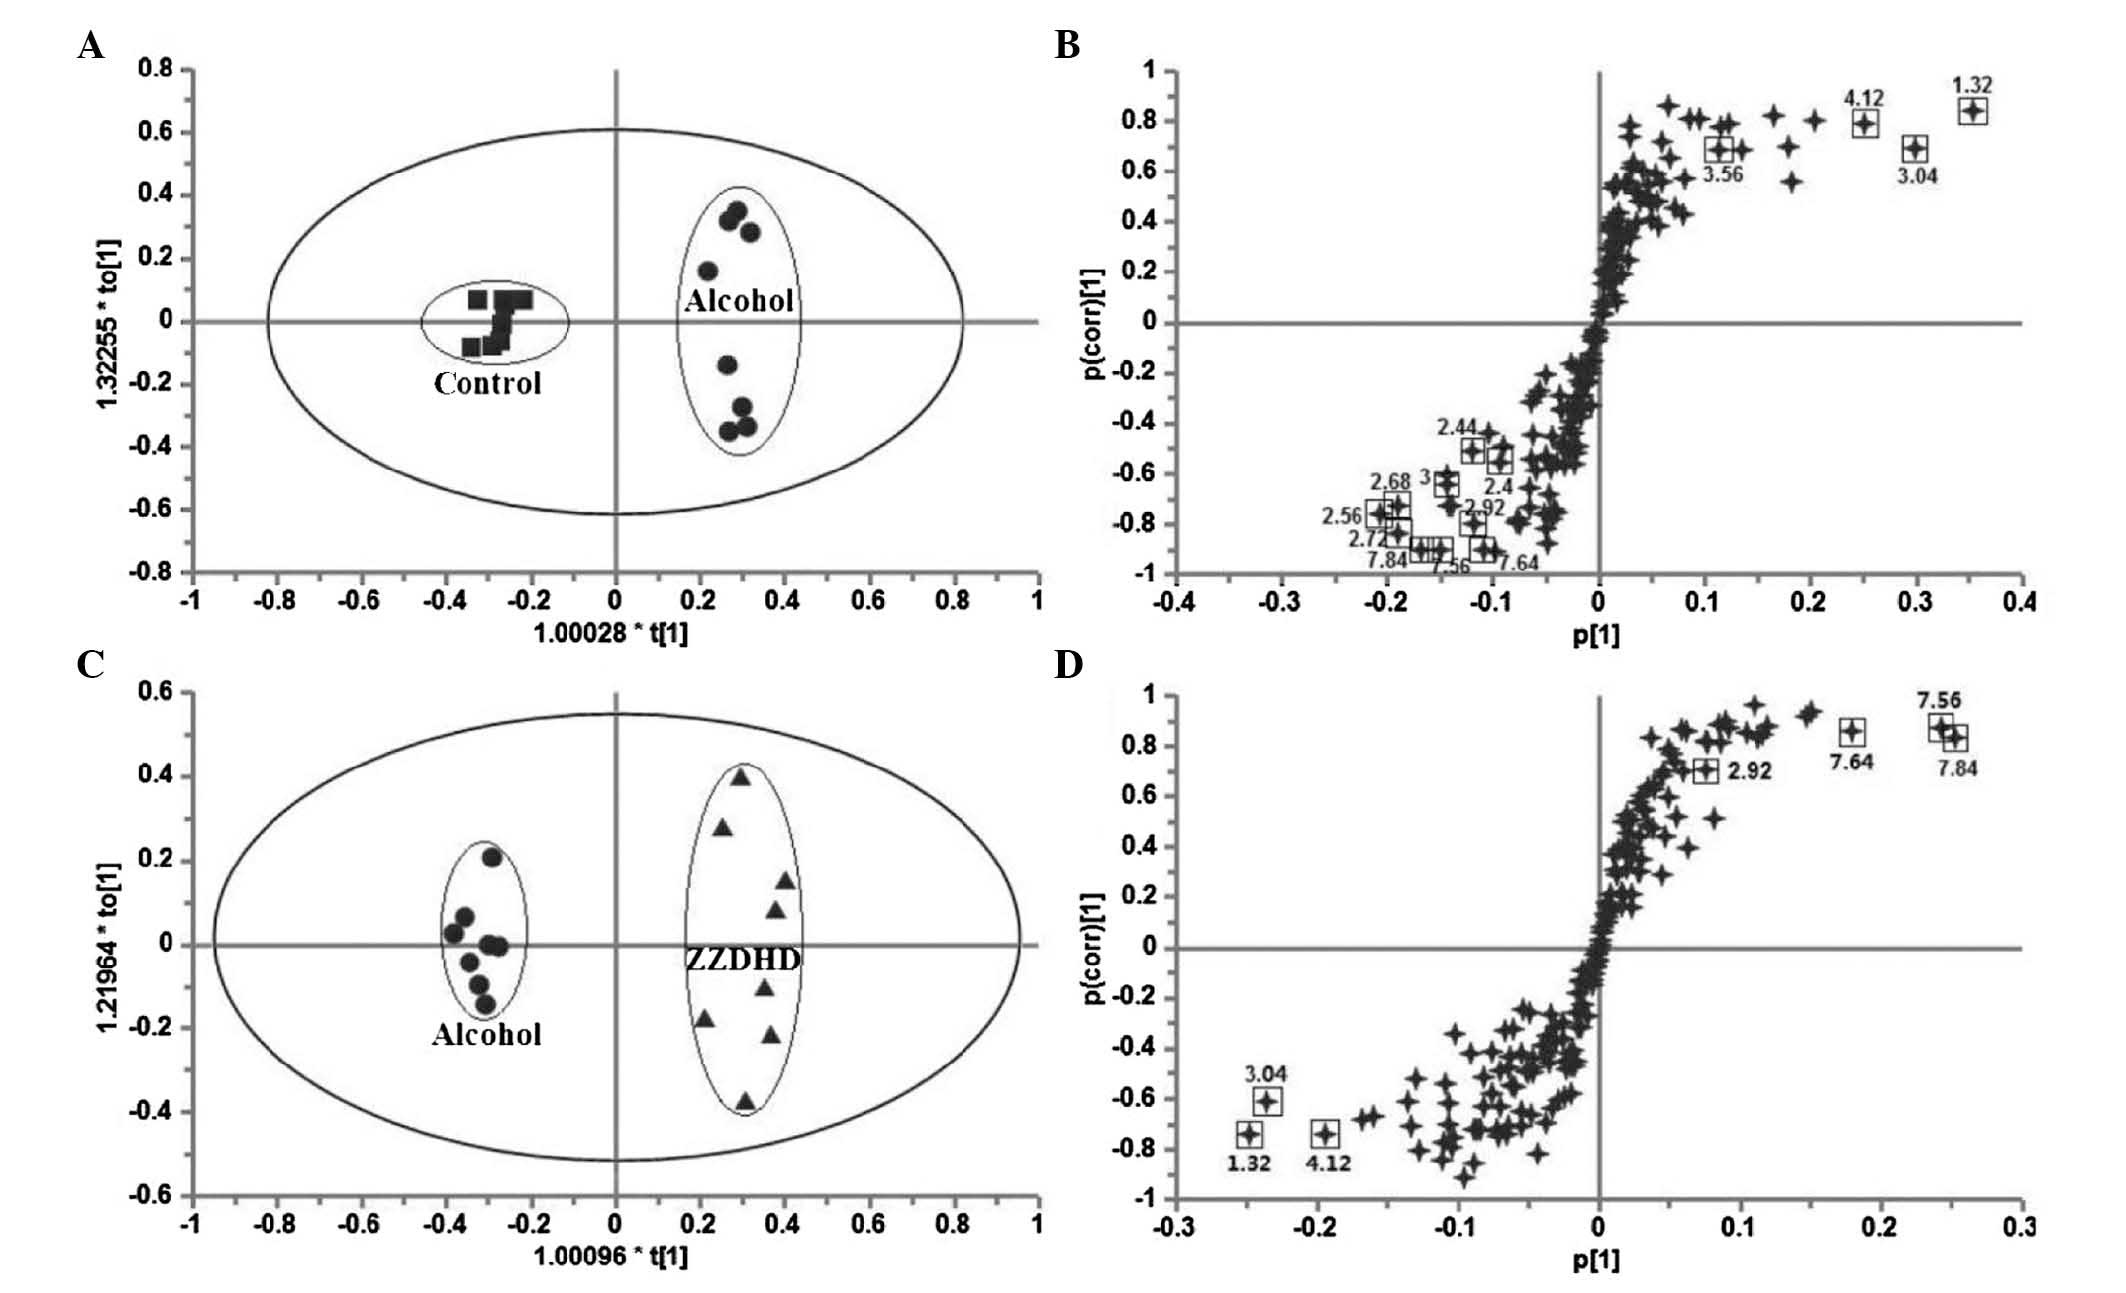
Analysis of urine metabolomics data
To obtain further details regarding metabolic
changes and to identify potential characteristic biomarkers, which
represent the effect of ZZDHD on alcohol-induced liver damage,
multivariate and univariate analyses were conducted on the NMR data
on day 8 (Table II). OPLS-DA was
performed to determine if there were significant differences in the
metabolites of the different treatment groups. A clear separation
between the AG and CG (Fig. 4A)
was demonstrated and significant metabolomic differences with good
model fit (R2X=0.845, Q2=0.907,
P=3.54×10⁻⁴) were observed. The corresponding S-plot
(Fig. 4B) distinguished nine
metabolites. Lactate, creatine and glycine were increased in the AG
compared with CG, and were located in the upper right quadrant. The
decreased metabolites, including hippurate, TCA cycle
intermediates, DMG and DMA, were located in the lower-left
quadrant. The score plot of OPLS-DA for AG and ZG (Fig. 4C) indicated a clear separation
between the two groups (R2X=0.523, Q2=0.936,
P=1.68×10⁻⁶) and four metabolites exhibited changes in
the S-plot (Fig. 4D), including
hippurate and DMG increased in the ZG, while creatine and lactate
levels were decreased.
| Table IIChanges in rat urine metabolites from
AG vs. CG and ZG vs. AG on day 8. |
Table II
Changes in rat urine metabolites from
AG vs. CG and ZG vs. AG on day 8.
| No. | Metabolite | Chemical shift
(ppm) | AG vs. CG
| ZG vs. AG
|
|---|
| VIPa | Pb | VIPa | Pb |
|---|
| 1 | Hippurate | 7.56(t), 7.64(t),
7.84(d) | 3.34 | 0.000 | 2.89 | 0.001 |
| 2 | Lactate | 1.32(d),
4.12(q) | 5.64 | 0.002 | 2.91 | 0.005 |
| 3 | Glycine | 3.56(s) | 2.86 | 0.006 | – | n.s. |
| 4 | Creatine | 3.04(s) | 6.38 | 0.009 | 3.25 | 0.013 |
| 5 | DMA | 2.72(s) | 2.10 | 0.000 | – | n.s. |
| 6 | DMG | 2.92(s) | 1.87 | 0.000 | 1.03 | 0.003 |
| 7 |
α-Ketoglutarate | 2.44(t),
3.00(t) | 1.48 | n.s. | 1.07 | n.s. |
| 8 | Citrate | 2.56(d),
2.68(d) | 2.61 | 0.002 | – | 0.003 |
| 9 | Succinate | 2.40(s) | 1.03 | 0.021 | – | n.s. |
The altered urine metabolites described above from
the AG compared with CG and ZG were validated via variable
importance in the projection (VIP) using a VIP ≥1. The P-values for
the detected metabolites in the different groups were calculated
using Student's t-test or Mann-Whitney test. The results
demonstrated that the levels of metabolites, including lactate,
creatine, hippurate and DMG, were significantly altered following
ZZDHD intervention. Thus, these four metabolites may be potential
characteristic biomarkers of the intervention effects of ZZDHD on
alcohol-induced liver damage. The present study demonstrated that
alcohol administration disrupted energy, amino acid, methionine and
gut bacterial metabolism. The results indicated that ZZDHD
partially regulated the altered metabolic changes induced by
alcohol to promote a return to basal levels, which was also
validated by the assessment of biochemical indicators and
histopathology.
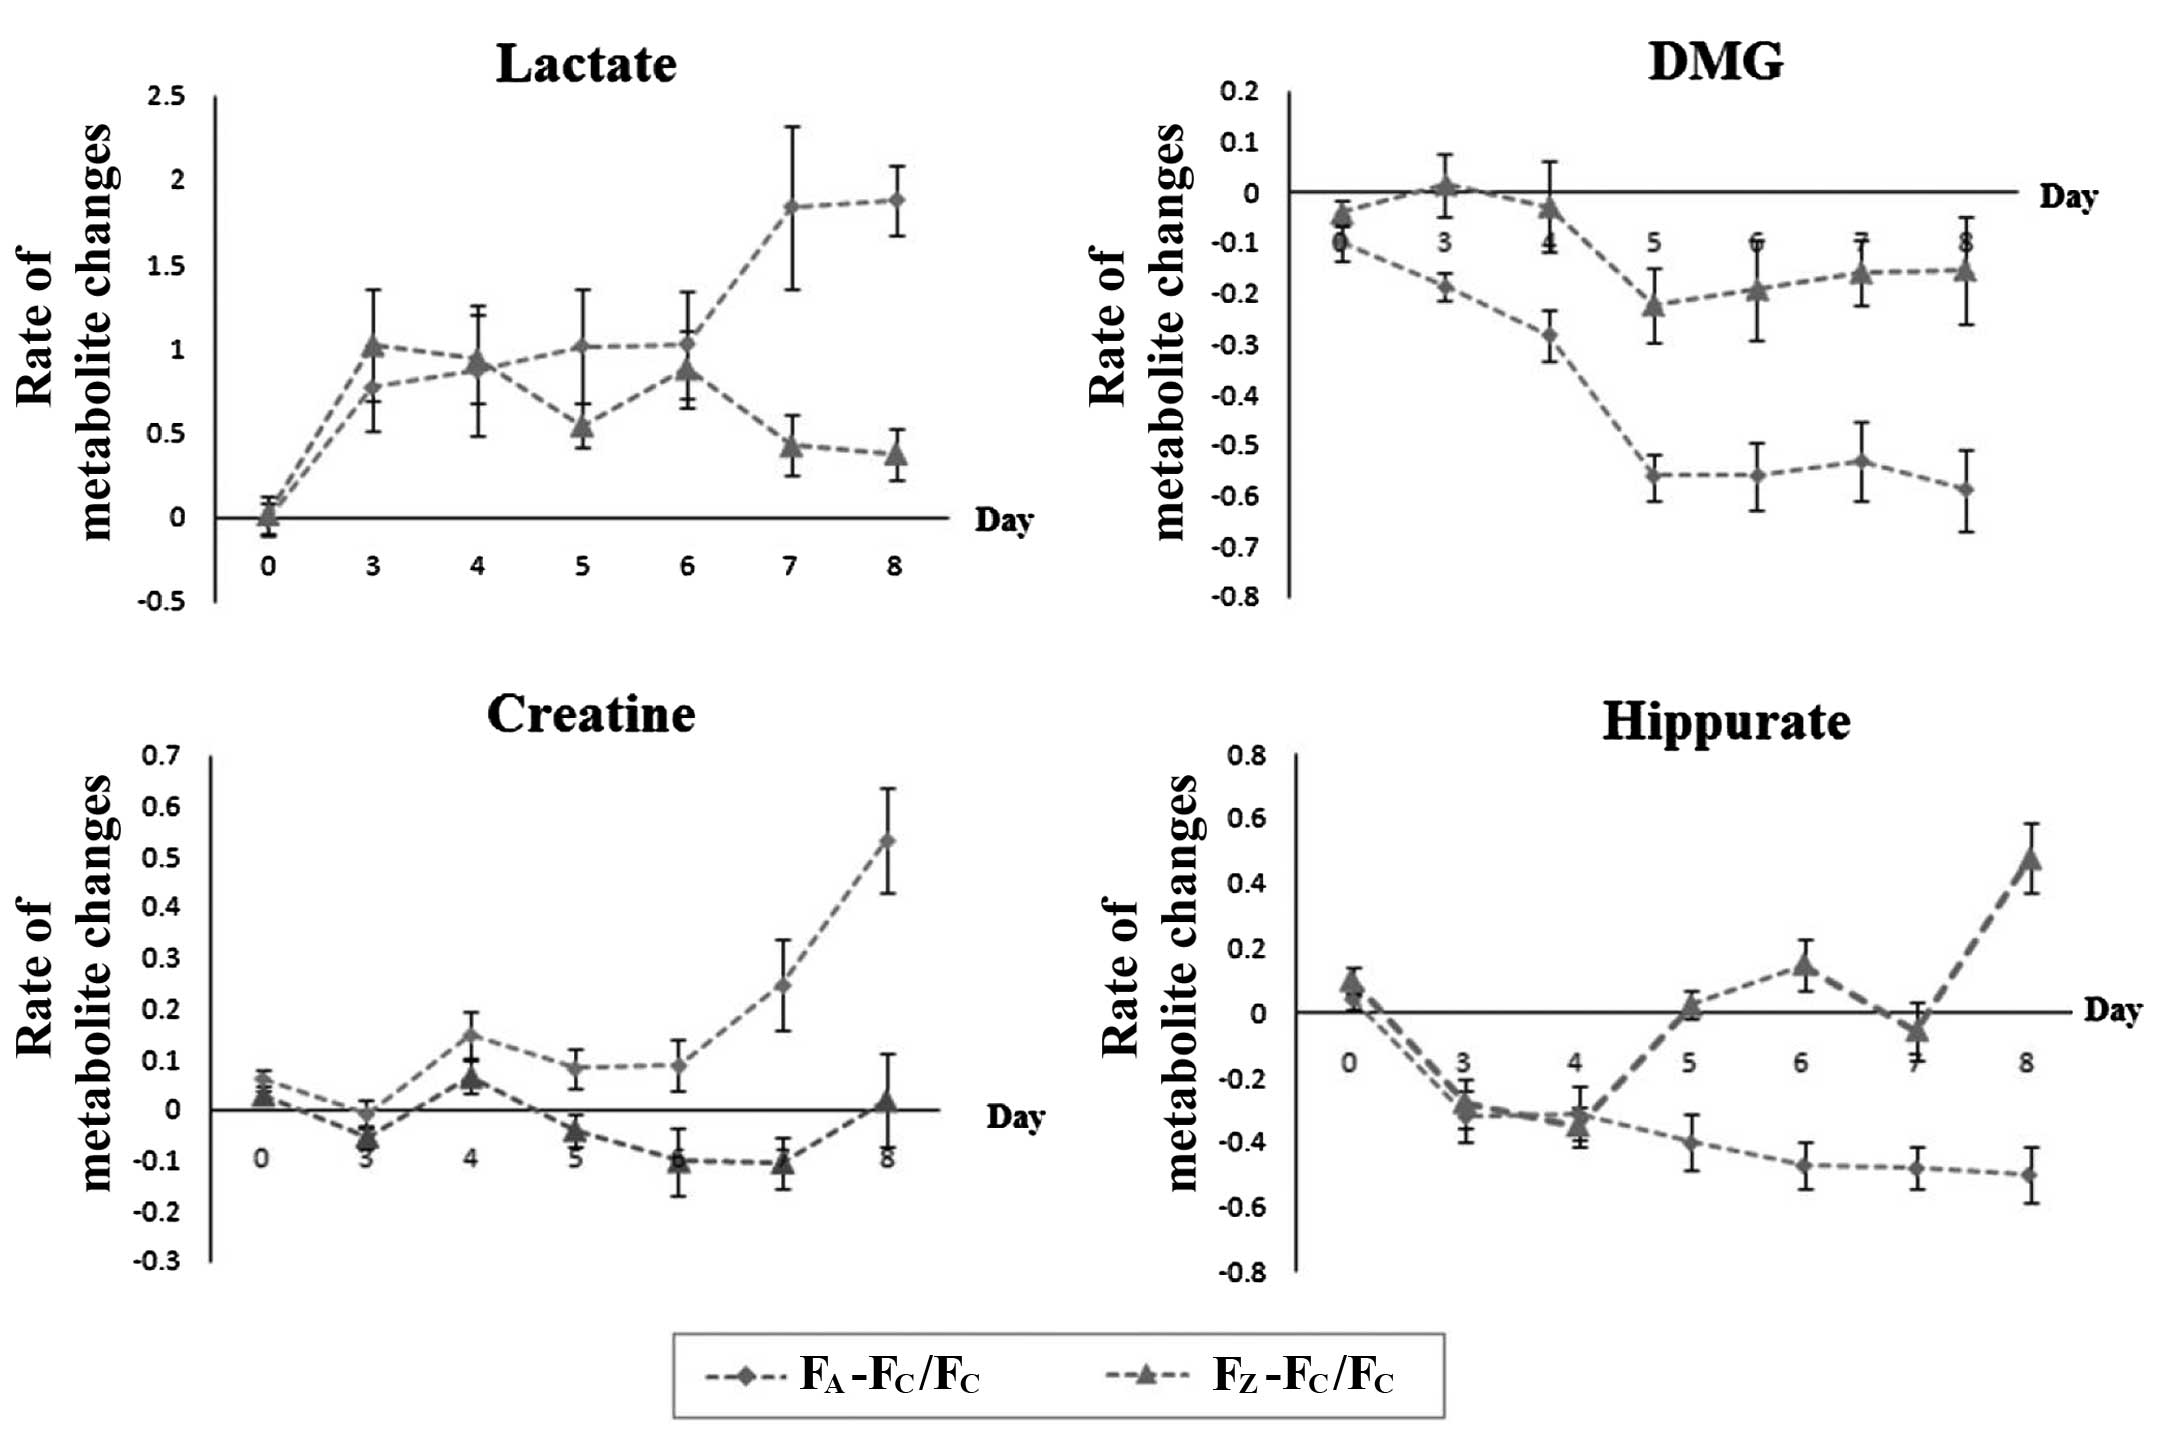
Dynamic metabolic profiling of potential
characteristic biomarkers
The ratios of the four potential characteristic
biomarkers, including lactate, hippurate, DMG and creatine were
calculated as AG or ZG relative to CG (Fig. 5), in order to investigate the
changes and dynamic effects in the occurrence, development and
ZZDHD intervention of early-stage alcoholic liver injury. All four
metabolites exhibited time-dependent changes. The ratio of lactate
in the AG compared with the CG varied between 0.8 and 1 from day
3–6. Lactate exhibited a nearly 2-fold increase, with a maximum
level observed on day 5 following ethanol administration. Lactate
in the ZG, relative to the CG, ranged between 0.6 and 1 from day
3–6; however, this ratio was approximately 5-fold lower compared
with the AG after day 7 and 8. The ratio of DMG in the AG (relative
to CG) decreased between 0.22 and 0.31 on day 3 and 4, and it was
0.6 from day 5–8, which suggested that DMG was reduced compared
with the controls during ethanol treatment from day 5–8. The DMG
level in the ZG was maintained below 0.22 compared with the CG
during ethanol administration. Creatine increased to 0.27 on day 7
and to 0.52 on day 8 in the AG compared with the CG. The creatine
in the ZG remained constant compared with the CG rats. The
hippurate in the AG was decreased to ~0.3 on day 3 and 4, and was
lower than 0.4 from day 5–8 in the corresponding period. The
hippurate level in the ZG exhibited similar changes to the AG
compared with the CG rats on day 3 and 4, that remained unchanged
compared with CG rats from day 5 to day 7 and increased to >0.4
on day 8. This indicated that ZZDHD altered the gut bacteria to
restore the normal metabolism of hippuric acid, with increased
production of hippurate due to the polyphenols of ZZDHD. Metabolite
changes were observed in the AG and the ZG compared with the CG for
lactate, DMG, creatine, and hippurate.
Discussion
The present study investigated the hepatoprotective
effects of ZZDHD on alcohol-induced liver damage. Additionally, the
current study investigated the dynamic metabolic variations in
potential characteristic biomarkers that changed following ZZDHD
intervention and the underlying mechanisms involved.
Alcohol metabolism leads to redox state changes in
the nicotinamide adenine dinucleotide (NAD+)/reduced
nicotinamide adenine dinucleotide (NADH) ratio, including excessive
generation of reactive oxygen species and oxidative stress
(26–28). This results in mitochondrial
dysfunction, which further disturbs normal metabolism. Lactate, a
metabolic product of glycolysis, maintains normal energy
metabolism. Pyruvate is converted to lactate by lactic
dehydrogenase during hypoxia. The NADH/NAD+ ratio also
affects the production of lactic acid. As a consequence of ethanol
metabolism, the NADH/NAD+ redox ratio increases as
ethanol is oxidized to acetaldehyde, and acetic acid and the
vitamin cofactor NAD+ of these two processes is reduced
to NADH (29–31). Increased NADH accelerates the
transformation of pyruvate to lactate. Additionally, hypoxia has
been demonstrated in ethanol metabolism (32). In the current study, the lactate
levels in the AG were significantly increased from day 7,
indicating that energy metabolism may be different from normal. The
lactate levels in the ZG were lower compared with the AG. However,
they were similar to the CG on day 8, indicating that ZZDHD reduced
the level of lactate and restored the energy metabolism to a normal
level. ZZDHD may relieve the abnormal effects of liver injury by
regulating energy metabolism.
Alcohol and its metabolites have been previously
demonstrated to affect the methionine metabolic pathway (33–35)
by increasing the activity of betaine-homocysteine
methyltransferase (BHMT) and decreasing the activity of
cystathionine β-synthase (CβS) (36). Betaine is demethylated by BHMT to
produce DMG, and homocysteine is synchronously transformed to
methionine (37). Thus, DMG
production may increase due to improved BHMT activity; however, a
significant reduction in DMG was observed in the AG from day 5–8.
This may be due to DMG not being excreted directly into the urine,
or it may have been metabolized to glycine and then to creatine
(38). The creatine levels in the
AG compared with the CG were significantly increased to 0.52
following 6 days of exposure to alcohol, whereas the creatine
levels in the ZG did not exhibit any observable change compared
with the CG. ZZDHD significantly improved the levels of DMG and
creatine. This indicated that ZZDHD treatment may ameliorate
disrupted methionine metabolism caused by alcohol, as demonstrated
by its abilities to restore the levels of DMG and creatine to near
normal levels.
Benzoic acid, the precursor of hippurate, is
produced by gut microflora (39).
Decreased DMA and hippurate levels are indicators of a damaged
intestinal environment. Additionally, hippurate, which is the
glycine conjugate of benzoic acid, is formed in the mitochondria of
liver cells, in which the conversion from benzoic acid to
benzoyl-CoA requires adenosine triphosphate (ATP). Therefore,
reduced ATP due to mitochondrial dysfunction also affects the
generation of hippurate. A previous study reported that glycine
availability is an important factor in determining hippurate
production (40). In the present
study, increased glycine content and decreased hippurate content in
the AG suggested that the change observed in hippurate levels may
also be attributed to mitochondrial dysfunction. The dynamic
changes of hippurate suggested that ethanol administration
disrupted the intestinal flora and ZZDHD alleviated the extent of
this disturbance, which may contribute to its protective
mechanism.
The present study used a 1H NMR-based
metabolomics approach to determine the metabolic profiles of rats
in different groups and identify potential characteristic
biomarkers of the hepatoprotective effects of the ZZDHD on
alcohol-induced liver injury. Furthermore, time-course urinary
metabolic responses of rats to ZZDHD intervention indicated that
DMG, hippurate, lactate and creatine are important biomarkers for
the specific processes affected by ZZDHD. It was demonstrated that
ZZDHD regulated the abnormal metabolic state by interfering with
different metabolic pathways, including energy, amino acid,
methionine and gut bacterial metabolism. The present study also
demonstrated that the 1H NMR-based metabolomics method
is a useful tool for determining the potential molecular mechanisms
of the TCM formulas on hepatic injury and investigating their mode
of action by identifying potential characteristic biomarkers.
Acknowledgments
The present study was supported by National Natural
Science Foundation of China (grant no. 81274063) and a Project
Funded by the Priority Academic Program Development of Jiangsu
Higher Education Institutions.
References
|
1
|
Rehm J, Samokhvalov AV and Shield KD:
Global burden of alcoholic liver diseases. J Hepatol. 59:160–168.
2013. View Article : Google Scholar : PubMed/NCBI
|
|
2
|
Gao B and Bataller R: Alcoholic liver
disease: Pathogenesis and new therapeutic targets.
Gastroenterology. 141:1572–1585. 2011. View Article : Google Scholar : PubMed/NCBI
|
|
3
|
Li YM, Fan JG, Wang BY, Lu LG, Shi JP, Niu
JQ and Shen W; Chinese Association for the Study of Liver Disease:
Guidelines for the diagnosis and management of alcoholic liver
disease: Update 2010: (Published in Chinese on Chinese Journal of
Hepatology 2010; 18: 167–170). J Dig Dis. 12:45–50. 2011.
View Article : Google Scholar : PubMed/NCBI
|
|
4
|
Ramaiah S, Rivera C and Arteel G:
Early-phase alcoholic liver disease: An update on animal models,
pathology, and pathogenesis. Int J Toxicol. 23:217–231. 2004.
View Article : Google Scholar : PubMed/NCBI
|
|
5
|
Tan HY, Serban SM, Wang N, Hong M, Li S,
Li L, Cheung F, Wen XY and Feng Y B: Preclinical Models for
Investigation of Herbal Medicines in Liver Diseases: Update and
Perspective. Evid Based Complement Alternat Med. 2016:47501632016.
View Article : Google Scholar : PubMed/NCBI
|
|
6
|
Chen JC: Hypothesis and clinical study of
modular formulology. Journal of Chinese Medicine. 12:69–80.
2001.
|
|
7
|
An L and Feng F: Network
pharmacology-based antioxidant effect study of Zhi-Zi-Da-Huang
decoction for alcoholic liver disease. Evid Based Complement
Alternat Med. 2015:4924702015. View Article : Google Scholar : PubMed/NCBI
|
|
8
|
Wang H, Feng F, Zhuang BY and Sun Y:
Evaluation of hepatoprotective effect of Zhi-Zi-Da-Huang decoction
and its two fractions against acute alcohol-induced liver injury in
rats. J Ethnopharmacol. 126:273–279. 2009. View Article : Google Scholar : PubMed/NCBI
|
|
9
|
Nicholson JK, Lindon JC and Holmes E:
'Metabonomics': Understanding the metabolic responses of living
systems to pathophysiological stimuli via multivariate statistical
analysis of biological NMR spectroscopic data. Xenobiotica.
29:1181–1189. 1999. View Article : Google Scholar : PubMed/NCBI
|
|
10
|
Ghauri FY, Nicholson JK, Sweatman BC, Wood
J, Beddell CR, Lindon JC and Cairns NJ: NMR spectroscopy of human
post mortem cerebrospinal fluid: Distinction of Alzheimer's disease
from control using pattern recognition and statistics. NMR Biomed.
6:163–167. 1993. View Article : Google Scholar : PubMed/NCBI
|
|
11
|
Brindle JT, Antti H, Holmes E, Tranter G,
Nicholson JK, Bethell HW, Clarke S, Schofield PM, McKilligin E,
Mosedale DE and Grainger DJ: Rapid and noninvasive diagnosis of the
presence and severity of coronary heart disease using 1H-NMR based
metabonomics. Nat Med. 8:1439–1444. 2002. View Article : Google Scholar : PubMed/NCBI
|
|
12
|
Yang J, Xu G, Kong H, Zheng Y, Pang T and
Yang Q: Artificial neural network classification based on
high-performance liquid chromatography of urinary and serum
nucleosides for the clinical diagnosis of cancer. J Chromatogr B
Analyt Technol Biomed Life Sci. 780:27–33. 2002. View Article : Google Scholar
|
|
13
|
Li J, Yang L, Li Y, Tian Y, Li S, Jiang S,
Wang Y and Li X: Metabolomics study on model rats of chronic
obstructive pulmonary disease treated with Bu-Fei Jian-Pi. Mol Med
Rep. 11:1324–1333. 2015.
|
|
14
|
Huang M, Liang Q, Li P, Xia J, Wang Y, Hu
P, Jiang Z, He Y, Pang L, Han L, et al: Biomarkers for early
diagnosis of type 2 diabetic nephropathy: A study based on an
integrated biomarker system. Mol Biosyst. 9:2134–2141. 2013.
View Article : Google Scholar : PubMed/NCBI
|
|
15
|
Griffin JL: Metabonomics: NMR spectroscopy
and pattern recognition analysis of body fluids and tissues for
characterisation of xenobiotic toxicity and disease diagnosis. Curr
Opin Chem Biol. 7:648–654. 2003. View Article : Google Scholar : PubMed/NCBI
|
|
16
|
Lin WN, Lu HY, Lee MS, Yang SY, Chen HJ,
Chang YS and Chang WT: Evaluation of the cultivation age of dried
ginseng radix and its commercial products by using (1)H-NMR
fingerprint analysis. Am J Chin Med. 38:205–218. 2010. View Article : Google Scholar : PubMed/NCBI
|
|
17
|
Saric J, Wang Y, Li J, Coen M, Utzinger J,
Marchesi JR, Keiser J, Veselkov K, Lindon JC, Nicholson JK and
Holmes E: Species variation in the fecal metabolome gives insight
into differential gastrointestinal function. J Proteome Res.
7:352–360. 2008. View Article : Google Scholar
|
|
18
|
Diao C, Zhao L, Guan M, Zheng Y, Chen M,
Yang Y, Lin L, Chen W and Gao H: Systemic and characteristic
metabolites in the serum of streptozotocin-induced diabetic rats at
different stages as revealed by a (1)H-NMR based metabonomic
approach. Mol Biosyst. 10:686–693. 2014. View Article : Google Scholar : PubMed/NCBI
|
|
19
|
Shi X, Wei X, Koo I, Schmidt RH, Yin X,
Kim SH, Vaughn A, McClain CJ, Arteel GE, Zhang X and Watson WH:
Metabolomic analysis of the effects of chronic arsenic exposure in
a mouse model of diet-induced Fatty liver disease. J Proteome Res.
13:547–554. 2014. View Article : Google Scholar :
|
|
20
|
Liu P, Duan J, Wang P, Qian D, Guo J,
Shang E, Su S, Tang Y and Tang Z: Biomarkers of primary
dysmenorrhea and herbal formula intervention: An exploratory
metabonomics study of blood plasma and urine. Mol Biosyst. 9:77–87.
2013. View Article : Google Scholar
|
|
21
|
Nicholas PC, Kim D, Crews FT and Macdonald
JM: Proton nuclear magnetic resonance spectroscopic determination
of ethanol-induced formation of ethyl glucuronide in liver. Anal
Biochem. 358:185–191. 2006. View Article : Google Scholar : PubMed/NCBI
|
|
22
|
Liu Y, Huang R, Liu L, Peng J, Xiao B,
Yang J, Miao Z and Huang H: Metabonomics study of urine from
Sprague-Dawley rats exposed to Huang-yao-zi using (1)H NMR
spectroscopy. J Pharm Biomed Anal. 52:136–141. 2010. View Article : Google Scholar : PubMed/NCBI
|
|
23
|
Bradford BU, O'Connell TM, Han J, Kosyk O,
Shymonyak S, Ross PK, Winnike J, Kono H and Rusyn I: Metabolomic
profiling of a modified alcohol liquid diet model for liver injury
in the mouse uncovers new markers of disease. Toxicol Appl
Pharmacol. 232:236–243. 2008. View Article : Google Scholar : PubMed/NCBI
|
|
24
|
Sun YJ, Wang HP, Liang YJ, Yang L, Li W
and Wu YJ: An NMR-based metabonomic investigation of the subacute
effects of melamine in rats. J Proteome Res. 11:2544–2550. 2012.
View Article : Google Scholar : PubMed/NCBI
|
|
25
|
Xu W, Wu J, An Y, Xiao C, Hao F, Liu H,
Wang Y and Tang H: Streptozotocin-induced dynamic metabonomic
Changes in rat biofluids. J Proteome Res. 11:3423–3435. 2012.
View Article : Google Scholar : PubMed/NCBI
|
|
26
|
Riveros-Rosas H, Julian-Sanchez A, Pina E
and Pinã E: Enzymology of ethanol and acetaldehyde metabolism in
mammals. Arch Med Res. 28:453–471. 1997.PubMed/NCBI
|
|
27
|
Cederbaum AI: Alcohol metabolism. Clin
Liver Dis. 16:667–685. 2012. View Article : Google Scholar : PubMed/NCBI
|
|
28
|
Kennedy NP and Tipton KF: Ethanol
metabolism and alcoholic liver disease. Essays Biochem. 25:137–195.
1990.PubMed/NCBI
|
|
29
|
Zakhari S: Overview: How is alcohol
metabolized by the body? Alcohol Res Health. 29:245–254. 2006.
|
|
30
|
Gordon ER: The effect of chronic
consumption of ethanol on the redox state of the rat liver. Can J
Biochem. 50:949–957. 1972. View
Article : Google Scholar : PubMed/NCBI
|
|
31
|
Veech RL, Guynn R and Veloso D: The
time-course of the effects of ethanol on the redox and
phosphorylation states of rat liverm. Biochem J. 127:387–397. 1972.
View Article : Google Scholar : PubMed/NCBI
|
|
32
|
Arteel GE, Iimuro Y, Yin M, Raleigh JA and
Thurman RG: Chronic enteral ethanol treatment causes hypoxia in rat
liver tissue in vivo. Hepatology. 25:920–926. 1997. View Article : Google Scholar : PubMed/NCBI
|
|
33
|
Ji C: Mechanisms of alcohol-induced
endoplasmic reticulum stress and organ injuries. Biochem Res Int.
2012:2164502012. View Article : Google Scholar
|
|
34
|
Halsted CH and Medici V: Aberrant hepatic
methionine metabolism and gene methylation in the pathogenesis and
treatment of alcoholic steatohepatitis. Int J Hepatol.
2012:9597462012. View Article : Google Scholar
|
|
35
|
Kharbanda KK: Alcoholic liver disease and
methionine metabolism. Semin Liver Dis. 29:155–165. 2009.
View Article : Google Scholar : PubMed/NCBI
|
|
36
|
Tsukamoto H and Lu SC: Current concepts in
the pathogenesis of alcoholic liver injury. FASEB J. 15:1335–1349.
2001. View Article : Google Scholar : PubMed/NCBI
|
|
37
|
McGregor DO, Dellow WJ, Lever M, George
PM, Robson RA and Chambers ST: Dimethylglycine accumulates in
uremia and predicts elevated plasma homocysteine concentrations.
Kidney Int. 59:2267–2272. 2001. View Article : Google Scholar : PubMed/NCBI
|
|
38
|
Wei L, Liao P, Wu H, Li X, Pei F, Li W and
Wu Y: Metabolic profiling studies on the toxicological effects of
realgar in rats by (1)H NMR spectroscopy. Toxicol Appl Pharmacol.
234:314–325. 2009. View Article : Google Scholar
|
|
39
|
Keller W: Keller on the conversion of
benzoic into hippuric acid. Prov Med J Retrosp Med Sci. 4:256–257.
1842.PubMed/NCBI
|
|
40
|
Beliveau GP and Brusilow SW: Glycine
availability limits maximum hippurate synthesis in growing rats. J
Nutr. 117:36–41. 1987.PubMed/NCBI
|