Introduction
Tooth eruption is a complex physiological process
whereby teeth migrate to functional spaces from the jaw. For a
tooth to erupt, the alveolar bone must be resorbed to create an
eruption pathway (1), and a
biological process must exist that will result in the tooth moving
through this eruption pathway. The dental follicle (DF) is a loose
connective tissue that surrounds the enamel organ and dental
papilla of the developing tooth germ, prior to eruption (2). One of the biological functions of the
DF is the coordination of tooth eruption (3). Before differentiation into
osteoclasts, osteoclast precursors are recruited into the DF; a
process that is necessary for bone resorption and the initiation of
the eruption pathway (4).
Osteoclast recruitment and activation during the
various stages of tooth eruption depend on complex signaling
mechanisms that have been elucidated in recent decades (5). The regulatory factors expressed in
the DF or the satellite reticulum include macrophage
colony-stimulating factor-1 (CSF-1) (6), monocyte chemoattractant protein
(MCP-1) (7), nuclear
factor-kB (NF-kB), interleukin-1α
(IL-1α) and its receptor (IL-1R type I), epithelial growth
factor (EGF), osteoprotegerin (OPG), tumor necrosis factor
superfamily member 11 (RANKL) and c-fos. These factors interact to
form the regulatory system of tooth eruption (8).
CSF-1 and IL-1α serve important roles in
tooth eruption. CSF-1 is a glycoprotein growth factor that
specifically stimulates the survival, proliferation and
differentiation of cells of the mononuclear phagocytic lineage
(9). CSF-1 attracts monocytes into
the DF and stimulates osteoclast differentiation. In the process of
first mandibular molar eruption in rats, CSF-1 is expressed at its
highest level on post-natal days 3 and 10, when the peak of
osteoclastogenesis occurs. The increased expression of CSF-1
elevates the level of c-fos and downregulates OPG on the third day
(8). Once osteoclasts are
recruited to the alveolar crypt bone located around the tooth germ,
RANKL/OPG signaling persists during the successive stages of
eruptive movement, in order to modulate resorptive activity
(5). The occlusal portion of the
DF produces CSF-1, and CSF-1-mutant rats are toothless (10). Thus, CSF-1 is a major
osteoclastogenesis factor during tooth eruption. Another factor
that is involved in both osteoclastogenesis and tooth eruption is
IL-1α. A previous study observed that IL-1α is located in
the stellate reticulum, and its receptor (IL-1R type I) is present
in the adjacent DF (11). Compared
with wild-type controls, the time of eruption for the first
mandibular molar in IL-1R null mice was delayed by 2 days.
Additionally, IL-1α contributes to the upregulation of CSF-1, MPC-1
and NF-kB expression in DF cells (DFCs), which indicates
that IL-1α may be the initial promoter of tooth eruption.
However, the signaling mechanisms that occur in the
DF during the process of tooth eruption remain elusive. To date,
studies regarding the molecular mechanisms of tooth eruption have
focused primarily on the function of single or a number of
associated genes or proteins, and only a few have investigated the
gene and protein profiles of DFCs after osteogenic differentiation
(12–14). In the current study, the effects of
CSF-1 and IL-1α on DFCs were investigated in vitro using
differential proteomics techniques.
Materials and methods
DFC culture and treatments
All animal procedures were approved by Ethics
Committee of the Guanghua College of Stomatology at Sun Yat-sen
University (Guangzhou, China). DFs were isolated from the first
mandibular molars of Sprague-Dawley rats [5–7 days old, supplied by
the Laboratory Animal Center of Sun Yat-sen University (Guangzhou,
China)], and digested using 0.1% collagenase type I and 10 U/ml
dispase (Sigma-Aldrich, St. Louis, MO, USA) for 30 min at 37°C to
obtain DFCs as described previously (15). To ensure a uniform cell population,
the DFCs were cultured for 3–4 passages at 37°C and 5%
CO2 in Dulbecco's modified Eagle's medium (DMEM, low
glucose; GE Healthcare Life Sciences, Logan, UT, USA) supplemented
with 10% fetal bovine serum (FBS: Gibco; Thermo Fisher Scientific,
Inc., Waltham, MA, USA) and 1% penicillin/streptomycin. DFCs at
passages 3–5 were used in all subsequent experiments.
DFCs were grown in T-25 flasks until cells reached
80–90% confluence. Cells were then cultured for an additional 24 h
in serum-free DMEM prior to experimental treatments. DFCs were
treated with rat CSF-1 or IL-1α (PeproTech China, Jiangsu,
China) at a concentration of 50 ng/ml for 12 h. The DFCs were
collected for protein isolation following the designated
treatments, and the treatments were repeated three times, each with
a different set of DFC cultures.
Hematoxylin and eosin (HE) staining and
immunocytochemistry
The first molar germs of rats were fixed overnight
at 4°C in 4% formaldehyde diluted in phosphate-buffered saline
(PBS), and were routinely prepared for paraffin embedding. Serial
5-mm sections were prepared, collected on
3-aminopropyl-triethoxysilane-coated slices and air-dried. The
sections were deparaffinized, rehydrated and stained with HE, and
then dehydrated, cleared and mounted.
DFCs at passage 3 were seeded in 48-well plates
until they reached 50–60% confluence. The cells were fixed with 4%
formaldehyde for 15 min at room temperature, blocked with 1% bovine
serum albumin for 1 h, and incubated overnight at 4°C with
antibodies against vimentin (catalog no. BM0135; Wuhan Boster
Biological Technology, Ltd., Wuhan, China) and keratin (catalog no.
BM0031; Wuhan Boster Biological Technology, Ltd.) diluted 1:1,000,
or PBS as a negative control. Subsequently, biotinylated-goat
anti-mouse IgG (catalog no. BA1001; Wuhan Boster Biological
Technology, Ltd.) diluted 1:1,000 was added and samples were
incubated at 37°C for 30 min, washed 3 times with PBS for 3 min,
stained with 3,3′-diaminobenzidine and counterstained with
hematoxylin. Cells were imaged using an inverted microscope (Zeiss
GmbH, Jena, Germany).
Protein extraction
Following the removal of culture medium from the
flasks, cells were washed 3 times with ice-cold Tris-buffered
sucrose solution. Cells were carefully scraped from the bottom of
the flask and incubated on ice for 10 min in 100 µl of standard
lysis buffer containing 7 mol/l urea, 2 mol/l thiourea, 4% CHAPS
buffer (GE Healthcare Life Sciences, Uppsala, Sweden) and 30 mmol/l
Tris buffer. Cell lysates were sonicated on ice and the nuclear
fraction was removed by centrifugation at 20,000 × g for 30 min at
4°C. Protein samples were purified using a Clean-Up kit (GE
Healthcare Life Sciences), and protein concentrations were measured
with a Quant kit (GE Healthcare Life Sciences) according to the
manufacturer's instructions.
CyDye labeling
Protein extracts were labeled with the CyDye
Difference Gel Electrophoresis (DIGE) Fluor (Minimal Dye) Labeling
kit (GE Healthcare Life Sciences) according to the manufacturer's
instructions. The internal standard was prepared by combining equal
amounts of the 12 test samples. A total of 6 DIGE gels were used to
analyze the control or treatment samples. A total of 50 mg of
protein from control or treatment cultures was labeled with 1 µl of
Cy3 or Cy5 working dye solution, and 50 mg the internal standard
mixture was labeled with Cy2 (Table
I). Samples were then incubated on ice for 30 min in the dark.
Reactions were quenched with the addition of 2 µl of 10 mmol/l
lysine for 10 min on ice in the dark. Cy3 and Cy5-labeled samples
and the Cy2-labeled internal standard were then pooled prior to
two-dimensional (2D)-DIGE analysis.
 | Table IExperimental design of difference gel
electrophoresis gels. |
Table I
Experimental design of difference gel
electrophoresis gels.
| Gel no. | Fluorescent CyDye
labeling
|
|---|
| (Cy2) | (Cy3) | (Cy5) |
|---|
| 1 | Internal
standard | Control | CSF |
| 2 | Internal
standard | CSF | Control |
| 3 | Internal
standard | Control | IL-1 |
| 4 | Internal
standard | IL-1 | Control |
| 5 | Internal
standard | CSF | IL-1 |
| 6 | Internal
standard | IL-1 | CSF |
2D-DIGE and two-dimensional
electrophoresis (2-DE)
Protein samples were loaded onto dry strips (pH
4.0–7.0, 24 cm; GE Healthcare Life Sciences). Rehydration,
isoelectric focusing and equilibration were performed using the
methods described previously (16). The DIGE gels were visualized using
a Typhoon Variable Mode Imager 9400 (GE Healthcare Life Sciences).
A total of 2 preparative gels, each containing 500 mg of unlabeled
internal standard mixture proteins extracted from 12 samples (6
control and 6 treatment samples), were also analyzed. Following the
2-DE, 2 preparative gels were stained with Deep Purple (0.5%: GE
Healthcare Life Sciences) and scanned. The emission filters were
488 nm (Cy2; blue), 532 nm (Cy3; green), 633 nm (Cy5; red) and 532
nm (Deep Purple) with a resolution of 100 µm.
Image analysis
Protein expression analysis was performed using the
differential in-gel analysis (DIA) module and the DeCyder 6.0
software (GE Healthcare Life Sciences, Fairfield, CT, USA). A value
of 3,000 was set as the initial estimate of the number of protein
spots present. The intensities of individual protein spots within
the proteomes of the control and treatment samples were compared.
These DIA analyses were collated into a single analysis using the
DeCyder biological variation analysis module, and the final values
for the expression ratio of specific protein spots between control
and treatment samples were determined. Student's t-test was
used to calculate significant differences in the relative abundance
of individual protein spot features between control and stimulated
samples. Protein spots with mean abundance ratios >1.5 or
<−1.5 were selected and added to a list of proteins of
interest.
In-gel digestion and matrix-assisted
laser desorption/ionization-time of flight (MALDI-TOF)-mass
spectrometry (MS)
Spot map images generated from Deep Purple
post-stained preparative gels were matched to the analytical
2D-DIGE gels. The picking of selected protein spots from the
preparative gels, in-gel digestion, peptide extraction, preparation
of the samples for MS and spotting on target slides, were conducted
automatically with an Ettan spot handling workstation (GE
Healthcare Life Sciences) as described previously (16). Protein identification by peptide
mass fingerprinting (PMF) was performed using an Ultraflex III
MALDI-TOF-MS spectrometer (GE Healthcare Life Sciences) operating
in the reflectron mode. The PMF results were searched by Mascot
(Matrix Science Ltd., London, UK). The search parameters were as
follows: Database, Swissprot; species of search, rat; database
retrieval, combined; maximum missed cleavages, 1; enzyme, trypsin;
fixed modification, carbamidomethylation (Cys); variable
modifications, oxidation (Met); and peptide mass tolerance, 100
ppm, MA/MS 0.7 D. Identified proteins were grouped into functional
categories according to information from the UniProt database
(www.uniprot.org) and DAVID (http://niaid.abcc.ncifcrf.gov/home.jsp),
in combination with BLAST (www.ncbi.nlm.nih.gov/BLAST/) alignment results.
Western blot analysis
Control and stimulated DFCs were harvested in
Laemmli buffer, sonicated and centrifuged at 12,000 × g, 4°C for 5
min. Total protein was measured using a Bio-Rad Coomassie Blue
protein assay (Bio-Rad Laboratories Inc., Richmond, CA, USA). A
total of 20 µg protein was diluted in 10% bromophenol blue, boiled,
separated by sodium dodecyl sulfate-polyacrylamide gel
electrophoresis and transferred to a nitrocellulose membrane. The
membranes were blocked in 5% low-fat milk at room temperature for 1
h, rinsed, and incubated with goat anti-vimentin (1:200; catalog
no. sc-7558; Santa Cruz Biotechnology, Inc., Dallas, TX, USA),
sheep anti-actin (1:1,000: catalog no. AF4000; R&D Systems
China Co., Ltd., Shanghai, China), rabbit anti-HSP25 (1:1,000;
catalog no. SPA-801; Stressgen; Enzo Life Sciences, Inc.,
Farmingdale, NY, USA), goat anti-Rab-3D (1:200; catalog no.
sc-26559; Santa Cruz Biotechnology, Inc.) or mouse anti-tubulin
(1:1,000; catalog no. ab173840; Abcam, Shanghai, China) overnight
at 4°C. Membranes were then incubated with the horseradish
peroxidase (HRP)-conjugated secondary antibodies rat anti-goat IgG
(catalog no. BA1060; Wuhan Boster Biological Technology, Ltd.),
bovine anti-sheep IgG (catalog no. sc-2701; Santa Cruz
Biotechnology, Inc.), goat anti-rabbit IgG (catalog no. BA1055;
Wuhan Boster Biological Technology, Ltd.), or goat anti-mouse IgG
(catalog no. BA1050; Wuhan Boster Biological Technology, Ltd.), at
a dilution of 1:1,000. Protein bands were visualized using
Immobilon Western Chemiluminescent HRP Substrate (EMD Millipore,
Billerica, MA, USA). The expressed bands were detected by
ImageQuant™ LAS 4000 mini (GE Healthcare Life Sciences) and the
densitometry was measured using ImageJ software version 2 (National
Institutes of Health, Bethesda, MD, USA).
Reverse transcription-quantitative
polymerase chain reaction (RT-qPCR)
Total RNA was isolated with TRIzol reagent
(Invitrogen; Thermo Fisher Scientific, Inc.) following the
manufacturer's protocol. mRNA quantification was performed using
the ABI 7300 Real-Time PCR System (Applied Biosystems; Thermo
Fisher Scientific, Inc.). Complementary DNA (cDNA) was synthesized
with a RevertAid First Strand cDNA Synthesis kit (Thermo Fisher
Scientific, Inc.) in a final volume of 20 µl. Reverse
transcription was performed at 37°C for 1 h followed by a 10-min
incubation at 70°C to inactivate the reverse transcriptase.
Subsequently, 5 µl reaction mixture was incubated with
FastStart Universal SYBR Green Master Mix (Rox: Roche Diagnostics,
Basel, Switzerland) in a final volume of 10 µl. Primers used
for RT-qPCR are presented in Table
II. All reactions were run using a hot-start pre-incubation
step of 10 min at 95°C, followed by 40 cycles of 15 sec at 95°C, 60
sec at 60°C, and a final 5-min step at 60°C. The amount of RNA was
quantified using the comparative quantification cycle (Cq) method
according to the manufacturer's protocol. Relative gene expression
was calculated using the 2−ΔΔCq method (17) with glyceraldehyde 3-phosphate
dehydrogenase (GAPDH) as an internal control.
| Table IIPrimer sequences used in RT-qPCR. |
Table II
Primer sequences used in RT-qPCR.
| Gene | Primers | Length (bp) |
|---|
| Vimentin | F:
5′-GCCCAGATTCAGGAACAGCA-3′
R: 5′-TTCGTTTGACTCCTGCTTTGC-3′ | 216 |
| Actin | F:
5′-TGCTATGTTGCCCTAGACTTCG-3′
R: 5′-GTTGGCATAGAGGTCTTTACGG-3′ | 240 |
| HSP25 | F:
5′-AAAATACCCGGCTGGACACC-3′
R: 5′-CCACTCATCGGGAAACCGAG-3′ | 242 |
| Rab-3D | F:
5′-AGGACTGGGCTACGCAGATTA-3′
R: 5′-GATACGACCCGTTCATCCTCC-3′ | 97 |
| GAPDH | F:
5′-CAGGGCTGCCTTCTCTTGT-3′
R: 5′-TGATGGGTTTCCCATTGATGA-3′ | 76 |
Statistical analysis
Experiments were repeated a minimum of three times
with three independent cell samples. Data were expressed as the
mean ± standard deviation. Student's t-test was used to
calculate significant differences between control and stimulated
samples. P<0.05 was considered to indicate a statistically
significant difference. Statistical analyses were performed using
SPSS software (version 13.0; SPSS Inc., Chicago, IL, USA).
Results
Isolation and visualization of rat
DFCs
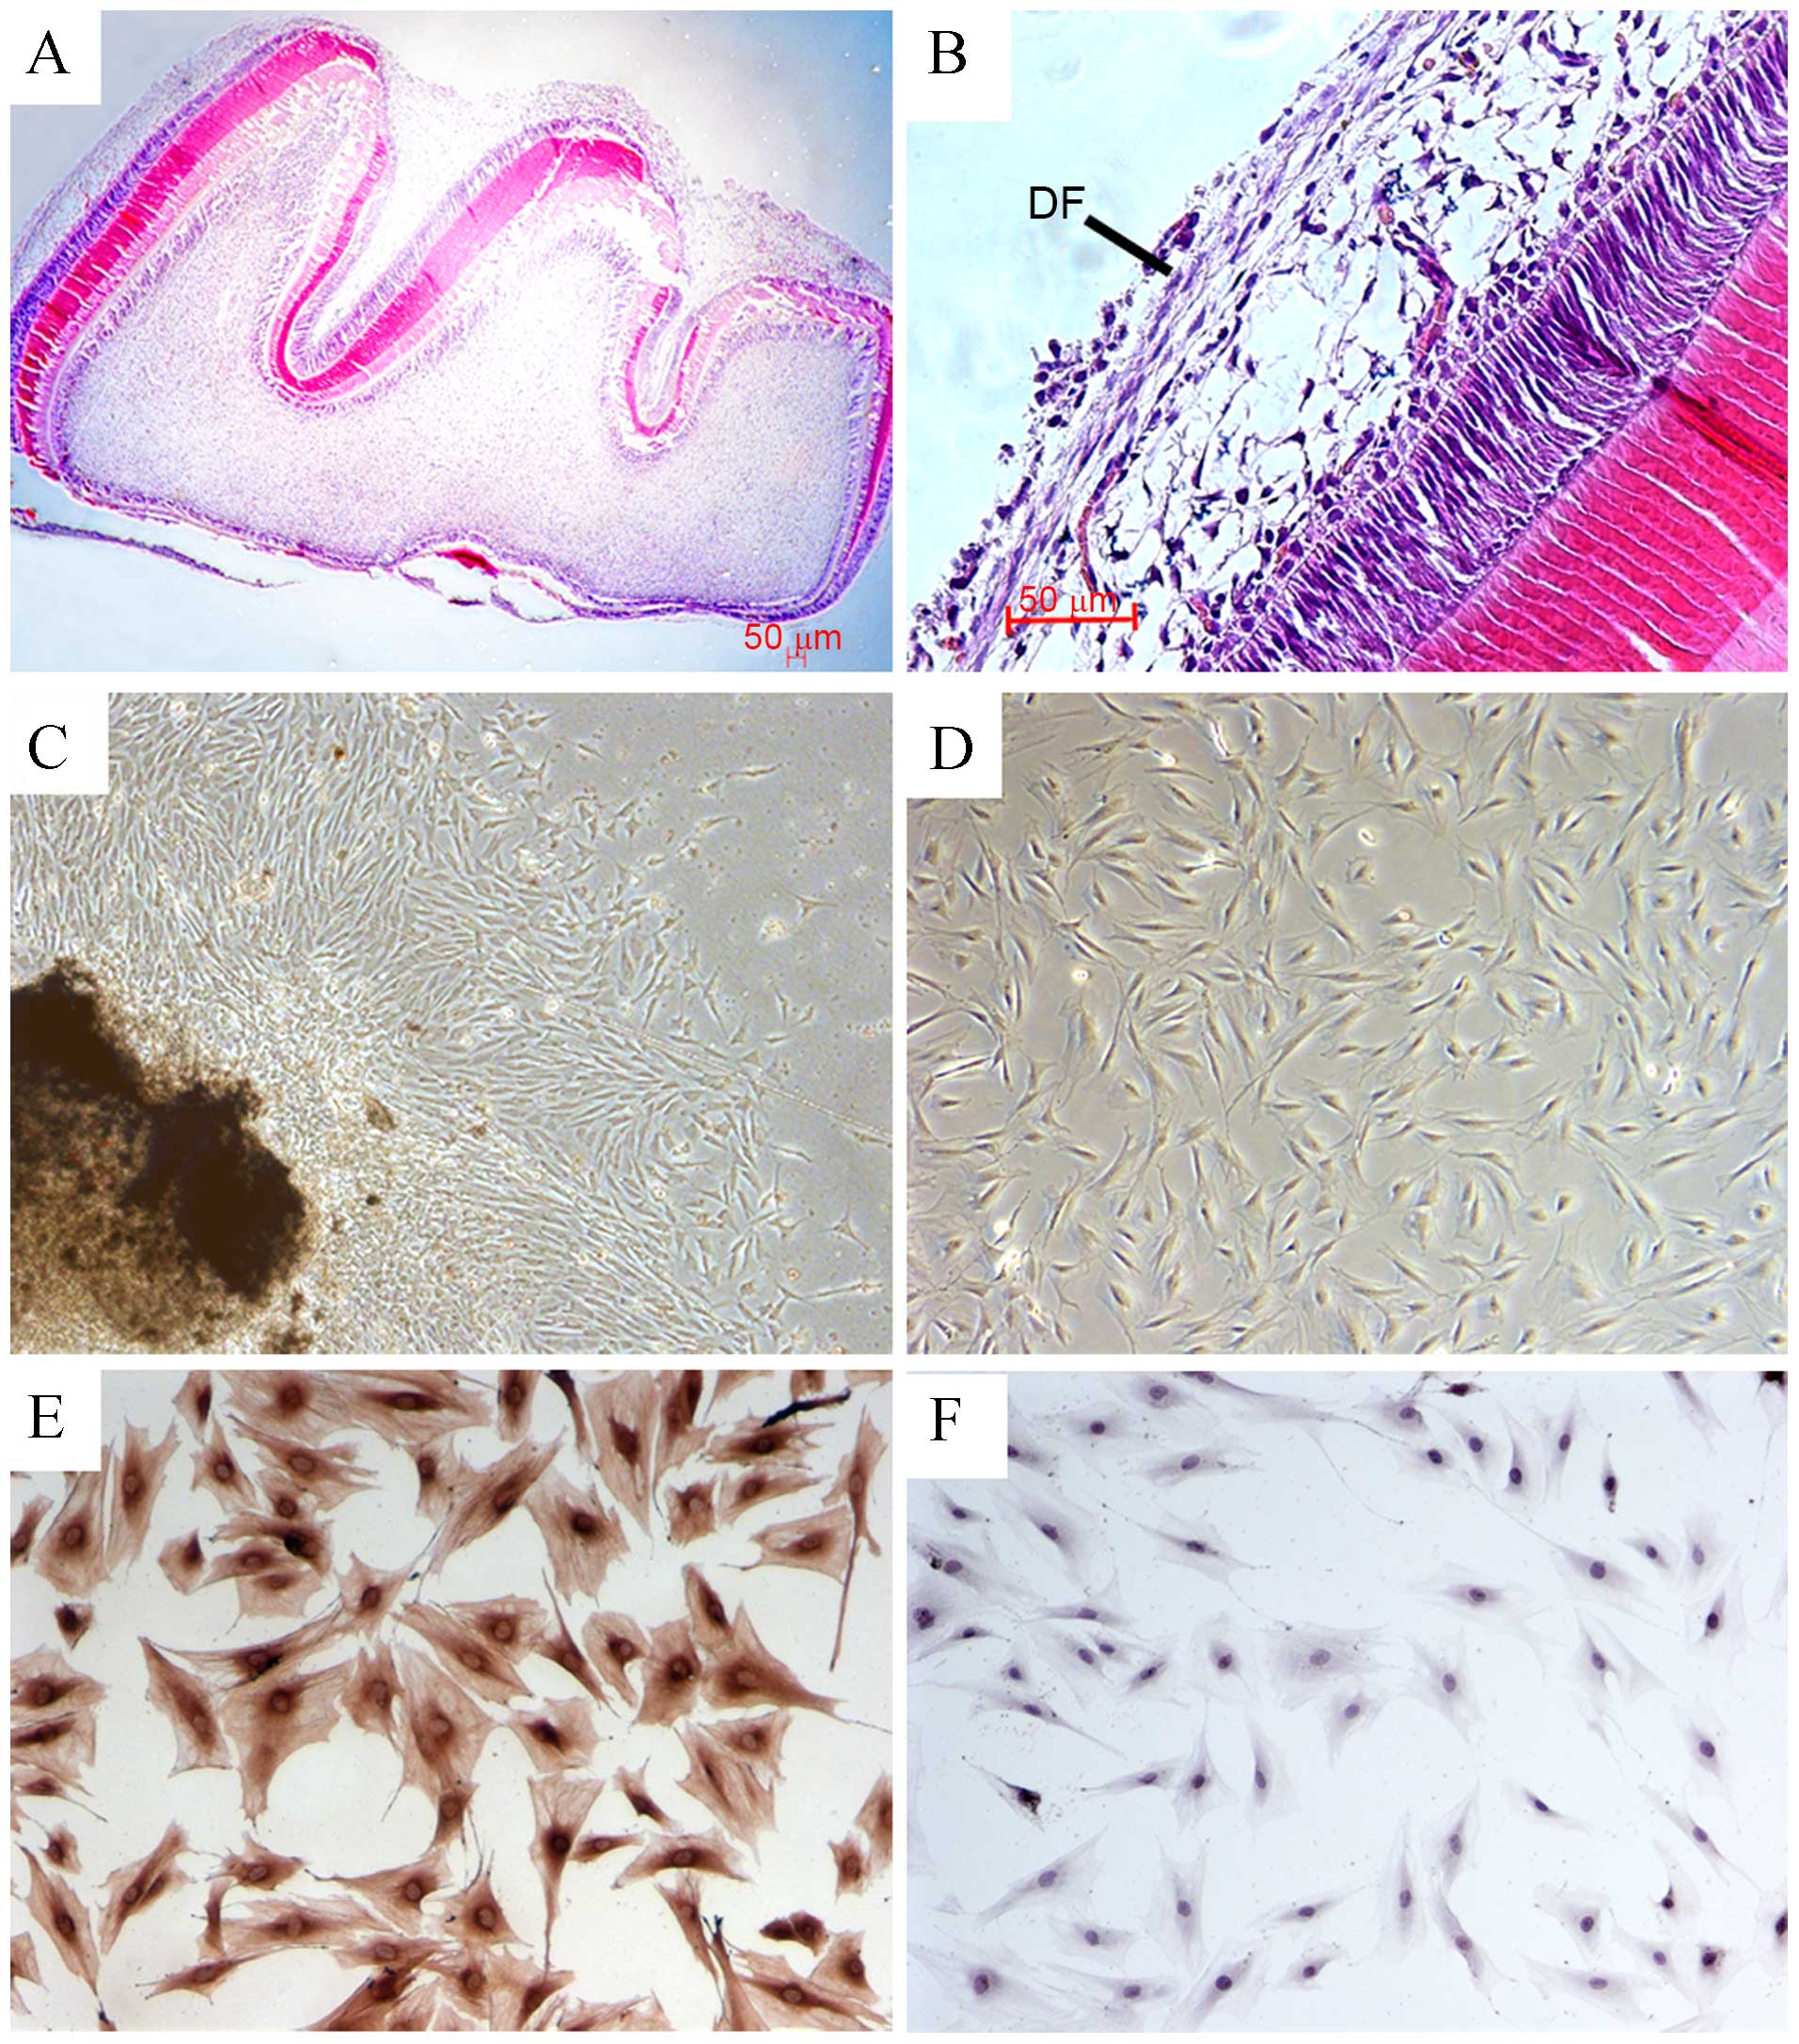
As shown in Fig. 1A and
B, the DF is the outer layer of the tooth germ surrounding the
enamel organ and the dental papilla. Primary DFCs were isolated
from rat first mandibular molars. After the molars were cultured
in vitro for 2–3 days, rat DFCs were observed around the rat
DF (Fig. 1C). The majority of the
DFCs exhibited a fusi-form shape after 2 passages (Fig. 1D). Immunocytochemical staining
showed that passage 3 cells were vimentin-positive (Fig. 1E) but negative for keratin 1
(Fig. 1F), which confirmed DFCs
originating from the mesenchyme were obtained.
Treatment of rat DFCs with IL-1α or CSF-1
alters protein expression profiles
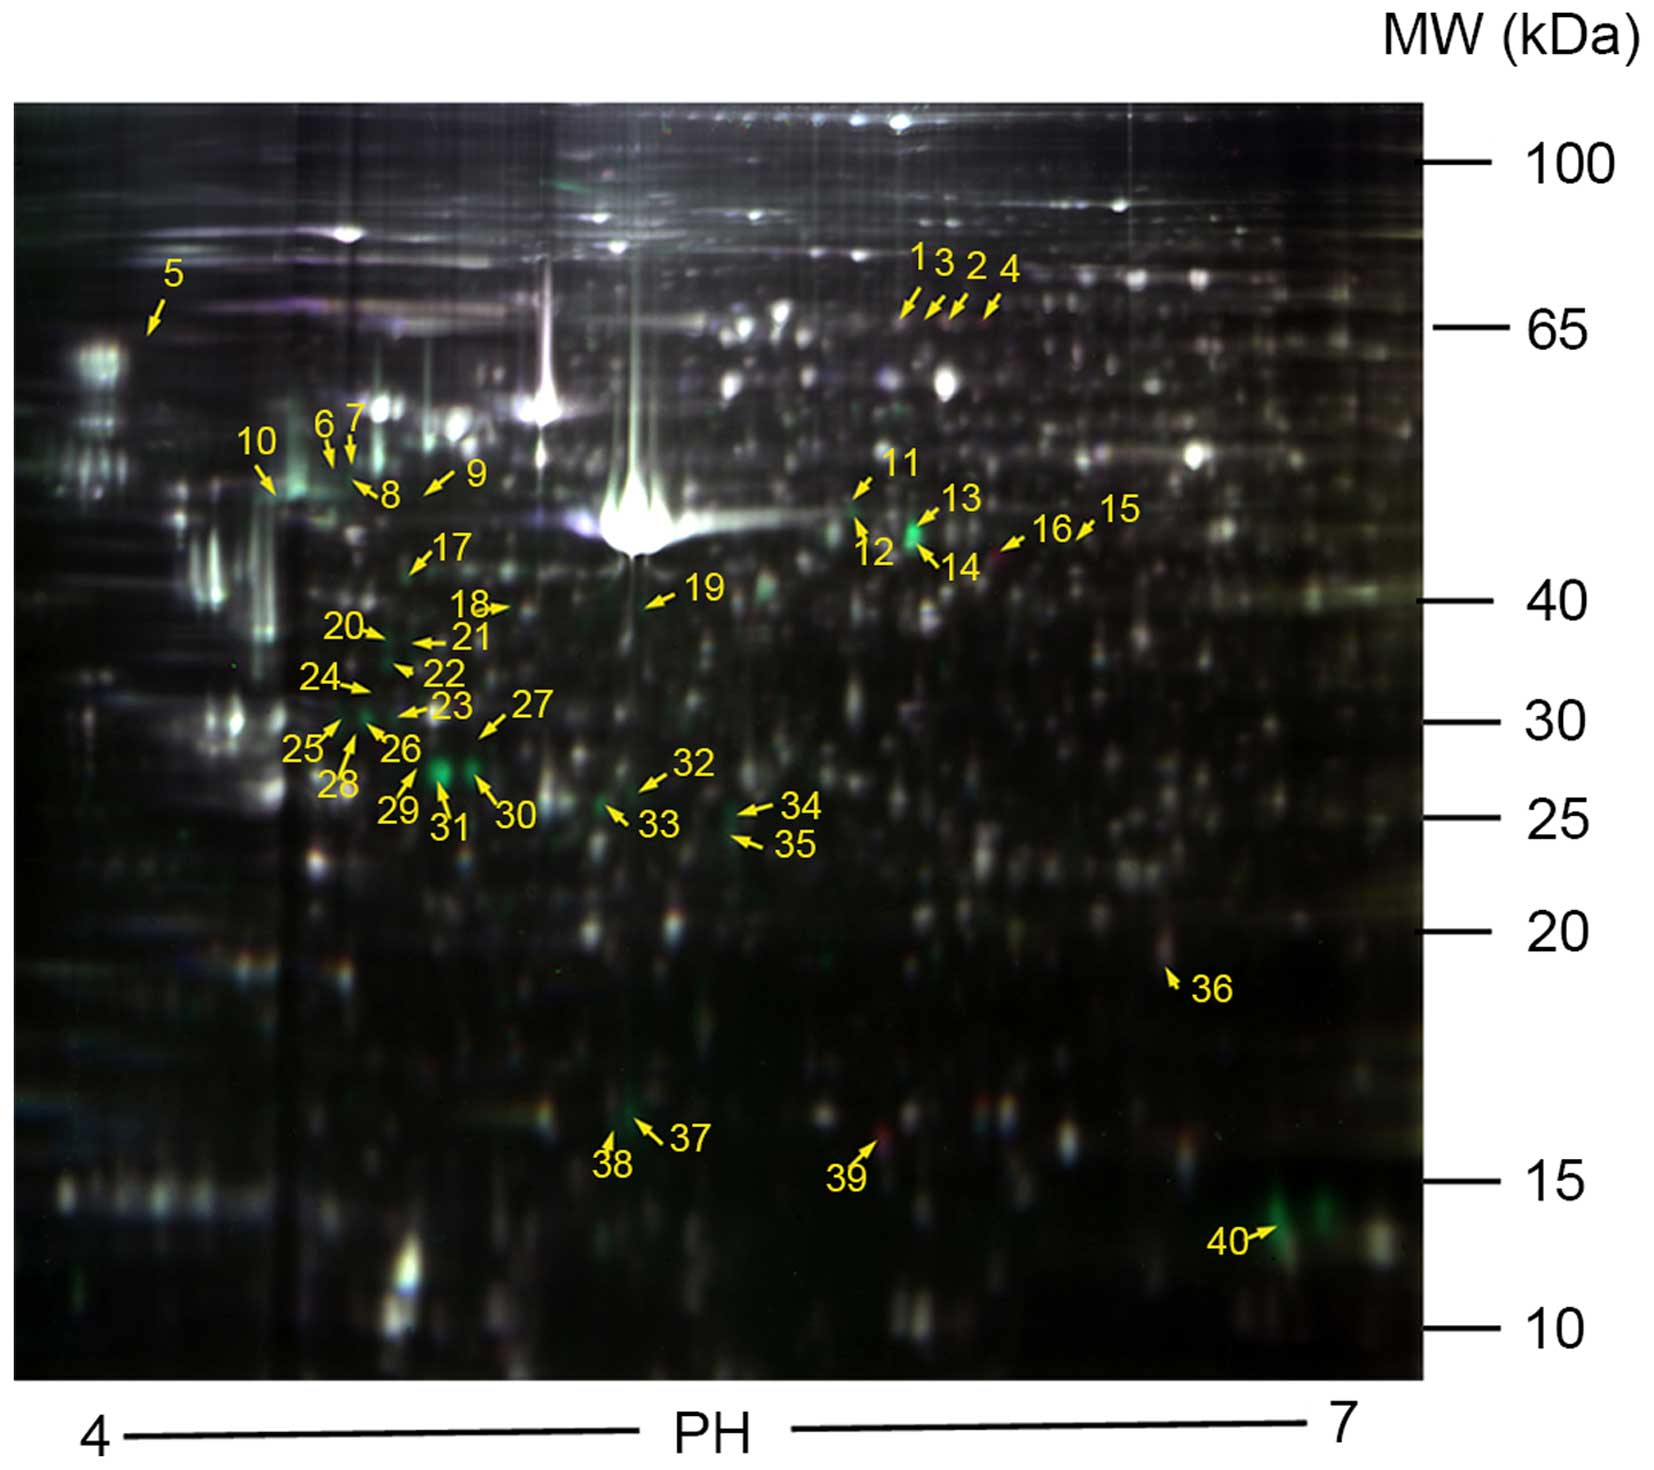
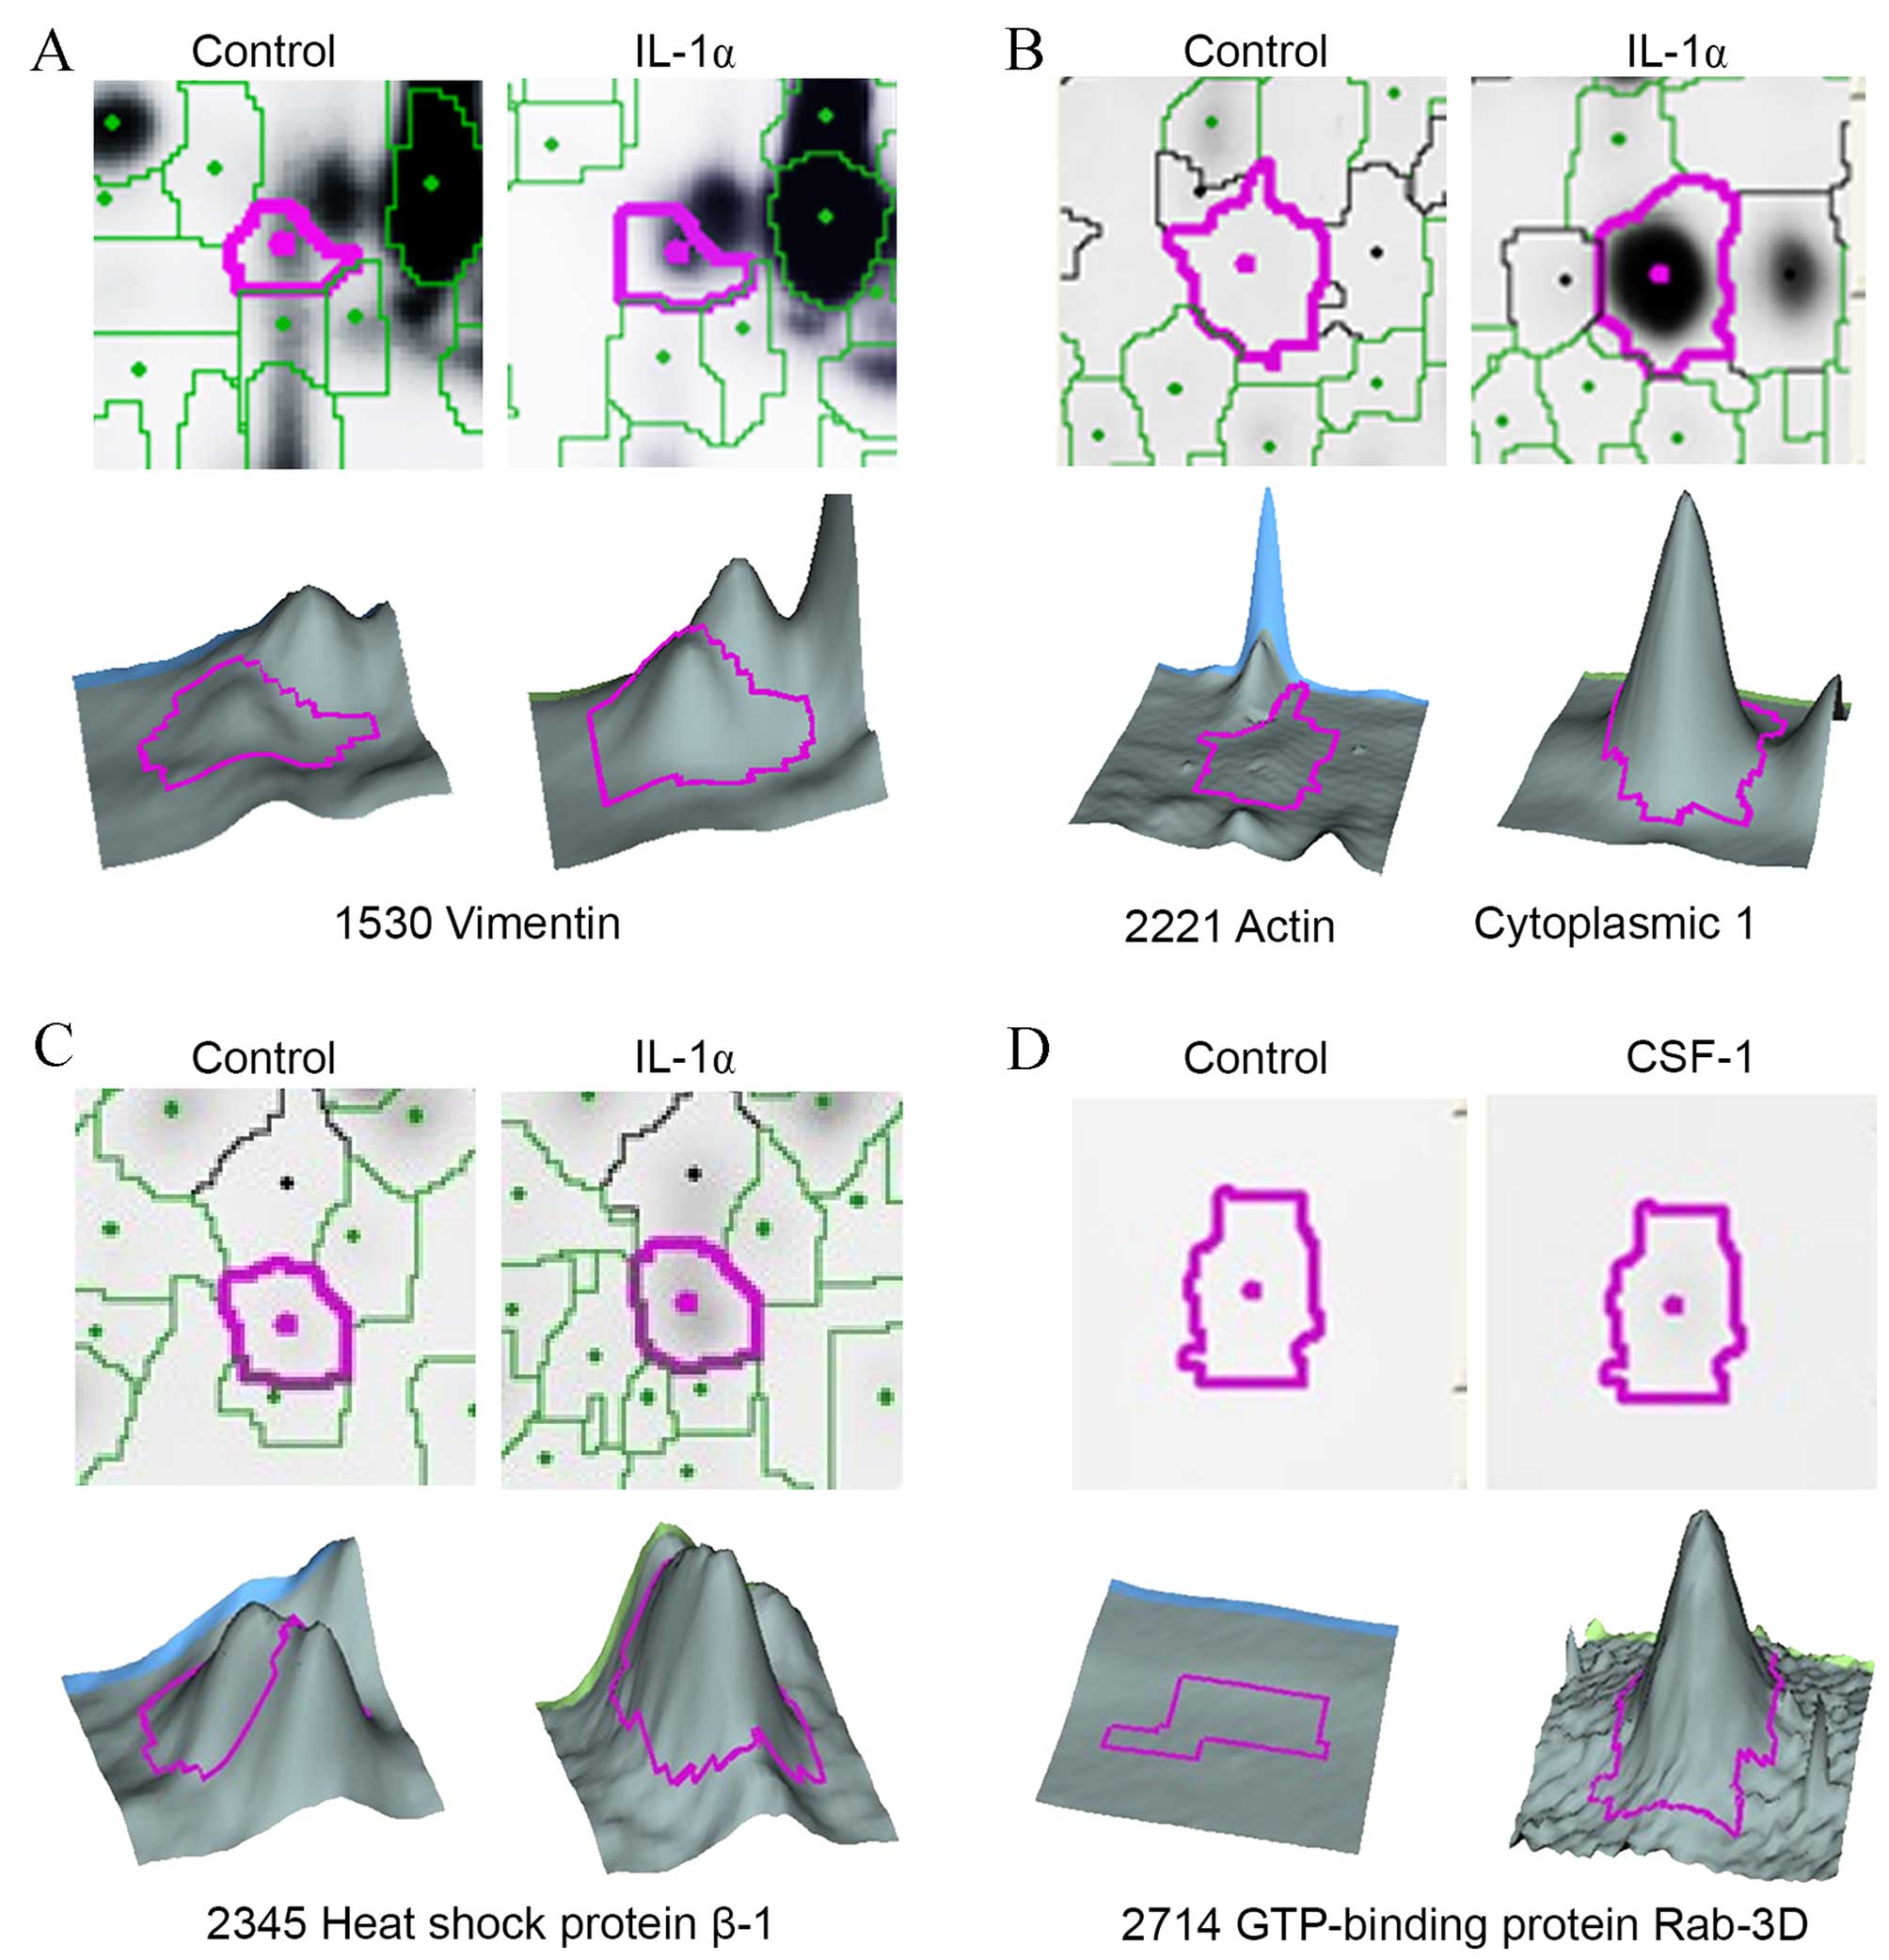
2D-DIGE was used to compare the protein expression
profiles between control and treated DFCs (Fig. 2). The data were analyzed using the
DeCyder image analysis software. A total of 47 protein spots with a
>1.5-fold upregulation or downregulation were identified in the
6 gels. A total of 37 protein spots were identified in the
IL-1α-treated DFC samples, with 31 proteins observed to be
upregulated and 6 downregulated, compared with the controls
(Table III). A total of 10
protein spots were identified in the CSF-1-treated DFC samples,
with 3 proteins found to be upregulated and 7 down-regulated
compared with the controls (Table
III). A partial view of the protein spots from the 2D gel and
3D images are presented in Fig.
3.
| Table IIIProteins with altered expression
identified by 2D-DIGE/matrix assisted laser
desorption/ionization-time of flight-mass spectrometry. |
Table III
Proteins with altered expression
identified by 2D-DIGE/matrix assisted laser
desorption/ionization-time of flight-mass spectrometry.
| A, Proteins
differentially expressed between IL-1-treated and control
samples |
|---|
|
|---|
| Pos. | Master no. | Av. ratio | Protein name
(Rattus norvegicus) | NCBI accession
no. | Score | MW (kDa) | pI | P-value |
|---|
| Cytoskeleton |
| 6 | 1460 | 1.75 | Vimentin | gi|14389299 | 107 | 45 | 4.77 |
5.5×10⁻³ |
| 7 | 1471 | 2.27 | Vimentin | gi|14389299 | 480 | 45 | 4.81 |
1.9×10⁻⁵ |
| 8 | 1516 | 1.54 | Vimentin | gi|14389299 | 342 | 44 | 4.78 |
7.9×10⁻⁴ |
| 9 | 1529 | 1.87 | Vimentin | gi|14389299 | 86 | 44 | 4.92 |
3.7×10⁻³ |
| 10 | 1530 | 1.93 | Vimentin | gi|14389299 | 246 | 44 | 4.65 |
1.0×10⁻⁴ |
| 13 | 1635 | 11.71 | Actin, cytoplasmic
1 | gi|13592133 | 552 | 44 | 5.96 |
3.8×10⁻⁹ |
| 14 | 1668 | 3.94 | Actin, cytoplasmic
1 | gi|13592133 | 556 | 44 | 5.96 |
2.8×10⁻⁹ |
| 15 | 1680 | 2 | Actin, cytoplasmic
1 | gi|13592133 | 138 | 44 | 6.28 |
3.8×10⁻³ |
| 17 | 1758 | 2.28 | Actin, cytoplasmic
1 | gi|13592133 | 314 | 42 | 4.92 |
7.3×10⁻⁷ |
| 20 | 1925 | 5.29 | Actin, cytoplasmic
1 | gi|13592133 | 131 | 38 | 4.89 |
4.4×10⁻⁵ |
| 21 | 1926 | 1.67 | Actin, cytoplasmic
2 | gi|188536082 | 70 | 38 | 4.94 |
2.6×10⁻³ |
| 22 | 1991 | 3.15 | Actin, cytoplasmic
1 | gi|13592133 | 174 | 36 | 4.89 |
2.1×10⁻³ |
| 23 | 2110 | 2.15 | Actin,
gamma-enteric smooth muscle | gi|25365 | 87 | 32 | 4.9 |
5.1×10⁻⁴ |
| 24 | 2114 | 7.53 | Actin, cytoplasmic
2 | gi|188536082 | 179 | 32 | 4.84 |
1.2×10⁻⁶ |
| 27 | 2172 | 2.36 | Actin, cytoplasmic
1 | gi|13592133 | 78 | 30 | 5.1 |
4.3×10⁻⁶ |
| 29 | 2214 | 5.45 | Actin, cytoplasmic
2 | gi|188536082 | 53 | 28 | 4.95 |
3.8×10⁻⁶ |
| 30 | 2215 | 26.13 | Actin, cytoplasmic
1 | gi|13592133 | 203 | 29 | 5.06 |
1.4×10⁻⁷ |
| 31 | 2221 | 26.06 | Actin, cytoplasmic
1 | gi|13592133 | 226 | 28 | 4.99 |
2.6×10⁻⁸ |
| 33 | 2278 | 4.5 | Actin, cytoplasmic
1 | gi|13592133 | 132 | 27 | 5.32 |
3.5×10⁻⁶ |
| 34 | 2292 | 3.23 | Actin, cytoplasmic
1 | gi|13592133 | 85 | 26 | 5.59 |
1.7×10⁻⁵ |
| 37 | 2846 | 6.57 | Actin, cytoplasmic
1 | gi|13592133 | 96 | 16 | 5.38 |
1.5×10⁻⁶ |
| 28 | 2203 | 1.59 | Lamin-A | gi|383110 | 45 | 29 | 4.89 |
4.4×10⁻⁴ |
| 38 | 2875 | 3.95 | Dystrophin-related
protein 2 | gi|13095924 | 46 | 16 | 5.35 |
4.0×10⁻⁵ |
| Stress |
| 11 | 1539 | 1.7 | 78 kDa
glucose-regulated protein | gi|25742763 | 61 | 44 | 5.83 |
3.0×10⁻³ |
| 12 | 1579 | 1.97 | 78 kDa
glucose-regulated protein | gi|25742763 | 115 | 44 | 5.84 |
3.9×10⁻⁴ |
| 35 | 2345 | 2.01 | Heat shock protein
beta-1 | gi|752993027 | 131 | 25 | 5.59 |
4.6×10⁻⁵ |
| Protein secretion
and degradation |
| 18 | 1853 | 2.58 | GTP-binding protein
Rab-3D | gi|18034781 | 54 | 41 | 5.14 |
1.6×10⁻⁵ |
| 26 | 2169 | −1.8 | Cullin-5 | gi|12083629 | 48 | 30 | 4.87 | 1.6
×10−3 |
| Metal binding |
| 2 |
953 | −1.6 | Serum albumin
precursor | gi|158138568 | 180 | 66 | 6.03 |
1.1×10⁻⁵ |
| 4 |
963 | −1.91 | Serum albumin
precursor | gi|158138568 | 94 | 66 | 6.1 |
6.8×10⁻⁶ |
| 32 | 2252 | 2.27 | 6-pyruvoyl
tetrahydrobiopterin synthase | gi|29498 | 18 | 27 | 5.38 |
2.1×10⁻⁵ |
| Cell cycle |
| 39 | 2883 | −3.09 | Cyclin-G1 | gi|6978621 | 41 | 16 | 5.9 |
2.6×10⁻⁶ |
| Other |
| 5 | 1007 | −1.53 | DNA primase large
subunit | gi|6679461 | 51 | 65 | 4.4 | 4.0
×10−3 |
| 16 | 1722 | −1.78 | PDZ
domain-containing | gi|16758060 | 268 | 43 | 6.11 |
1.1×10⁻³ |
| 25 | 2129 | 2.81 | Transmembrane | gi|56090383 | 48 | 32 | 4.81 |
8.8×10⁻⁶ |
| 40 | 3034 | 1.78 | Disks large homolog
3 | gi|13928878 | 34 | 14 | 6.73 |
2.5×10⁻³ |
| B, Proteins
differentially expressed between CSF-1-treated and control
samples |
|---|
|
|---|
| Pos. | Master no. | Av. ratio | Protein
namea | NCBIaccession
no. | Score | MW (kDa) | pI | P-value |
|---|
| Cytoskeleton |
| 30 | 2215 | 1.63 | Actin, cytoplasmic
1 | gi|13592133 | 203 | 29 | 5.06 |
1.4×10⁻⁷ |
| 31 | 2221 | 1.56 | Actin, cytoplasmic
1 | gi|13592133 | 226 | 28 | 4.99 |
2.6×10⁻⁸ |
| Protein secretion
and degradation |
| 36 | 2714 | 4.81 | GTP-binding protein
Rab-3D | gi|18034781 | 52 | 18 | 6.6 |
1.6×10⁻⁵ |
| 26 | 2169 | −1.56 | Cullin-5 | gi|12083629 | 48 | 30 | 4.87 |
1.6×10⁻³ |
| Metal binding |
| 1 |
952 | −1.52 | Serum albumin | gi|158138568 | 95 | 66 | 5.93 |
2.6×10⁻⁴ |
| 2 |
953 | −2.59 | Serum albumin | gi|158138568 | 180 | 66 | 6.03 |
1.1×10⁻⁵ |
| 3 |
957 | −1.53 | Serum albumin | gi|158138568 | 61 | 66 | 5.98 |
3.5×10⁻³ |
| 4 |
963 | −2.26 | Serum albumin | gi|158138568 | 94 | 66 | 6.1 |
6.8×10⁻⁶ |
| Cell cycle |
| 39 | 2883 | −2.17 | Cyclin-G1 | gi|6978621 | 41 | 16 | 5.9 |
2.6×10⁻⁶ |
| Other |
| 16 | 1722 | −1.63 | PDZ
domain-containing protein | gi|16758060 | 268 | 43 | 6.11 |
2.5×10⁻³ |
Identification and functional grouping of
protein spots by MALDI-TOF-MS
To identify the 47 protein spots flagged by the
image software, preparative gels containing 500 mg of each extract
were run and stained with Deep Purple. The protein spots were
matched to the CyDye-labeled images by the DeCyder software,
excised from the gel and digested with trypsin. Peptide mass maps
were obtained from MALDI-TOF PMF analysis, and 40 proteins were
identified (Table III). The
identified proteins were grouped into functional categories, which
included cytoskeletal proteins, metal-binding proteins, proteins
involved in secretion and degradation, cell cycle proteins and
stress proteins. In IL-1α-induced rat DFCs, cytoskeletal
proteins, stress proteins and proteins involved in secretion (such
as HSP25), vimentin, transmembrane protein 43 (TMEM43), the
GTP-binding protein Rab-3D, 6-pyruvoyl tetrahydrobiopterin synthase
(PTPS) and actin. However, proteins associated with protein
degradation, metal-binding and the cell cycle including serum
albumin, GIPC PDZ domain containing family member 1 (GIPC1), DNA
primase large subunit, cullin-5 and cyclin-G1, were observed to be
downregulated (Table III). In
CSF-1-induced rat DFCs, 3 proteins were found to be upregulated and
7 proteins were downregulated compared with the control group.
Upregulated proteins consisted of the GTP-binding protein Rab-3D
and α-actin. Downregulated proteins included cullin-5, serum
albumin, PDZ domain-containing protein and cyclin-G1 (Table III).
Verification of protein analysis by
western blotting and RT-qPCR
Western blotting and RT-qPCR analyses were performed
on 4 proteins of interest (vimentin, actin, HSP25 and Rab-3D) to
confirm the results obtained from the DIGE gels. For all
transcripts studied, a significant difference between the
expression levels in the control and treated groups was observed.
The mRNA levels of vimentin (P=0.0315), actin (P=0.0446), HSP25
(P=0.0004) and Rab-3D (P=0.0112) were significantly upregulated
within the IL-1α and CSF-1-treated cultures compared with
the control cultures. The results for mRNA and protein expression
were similar (Fig. 4). The data
obtained by western blotting and RT-qPCR analyses supported the
DIGE results for the analyzed proteins.
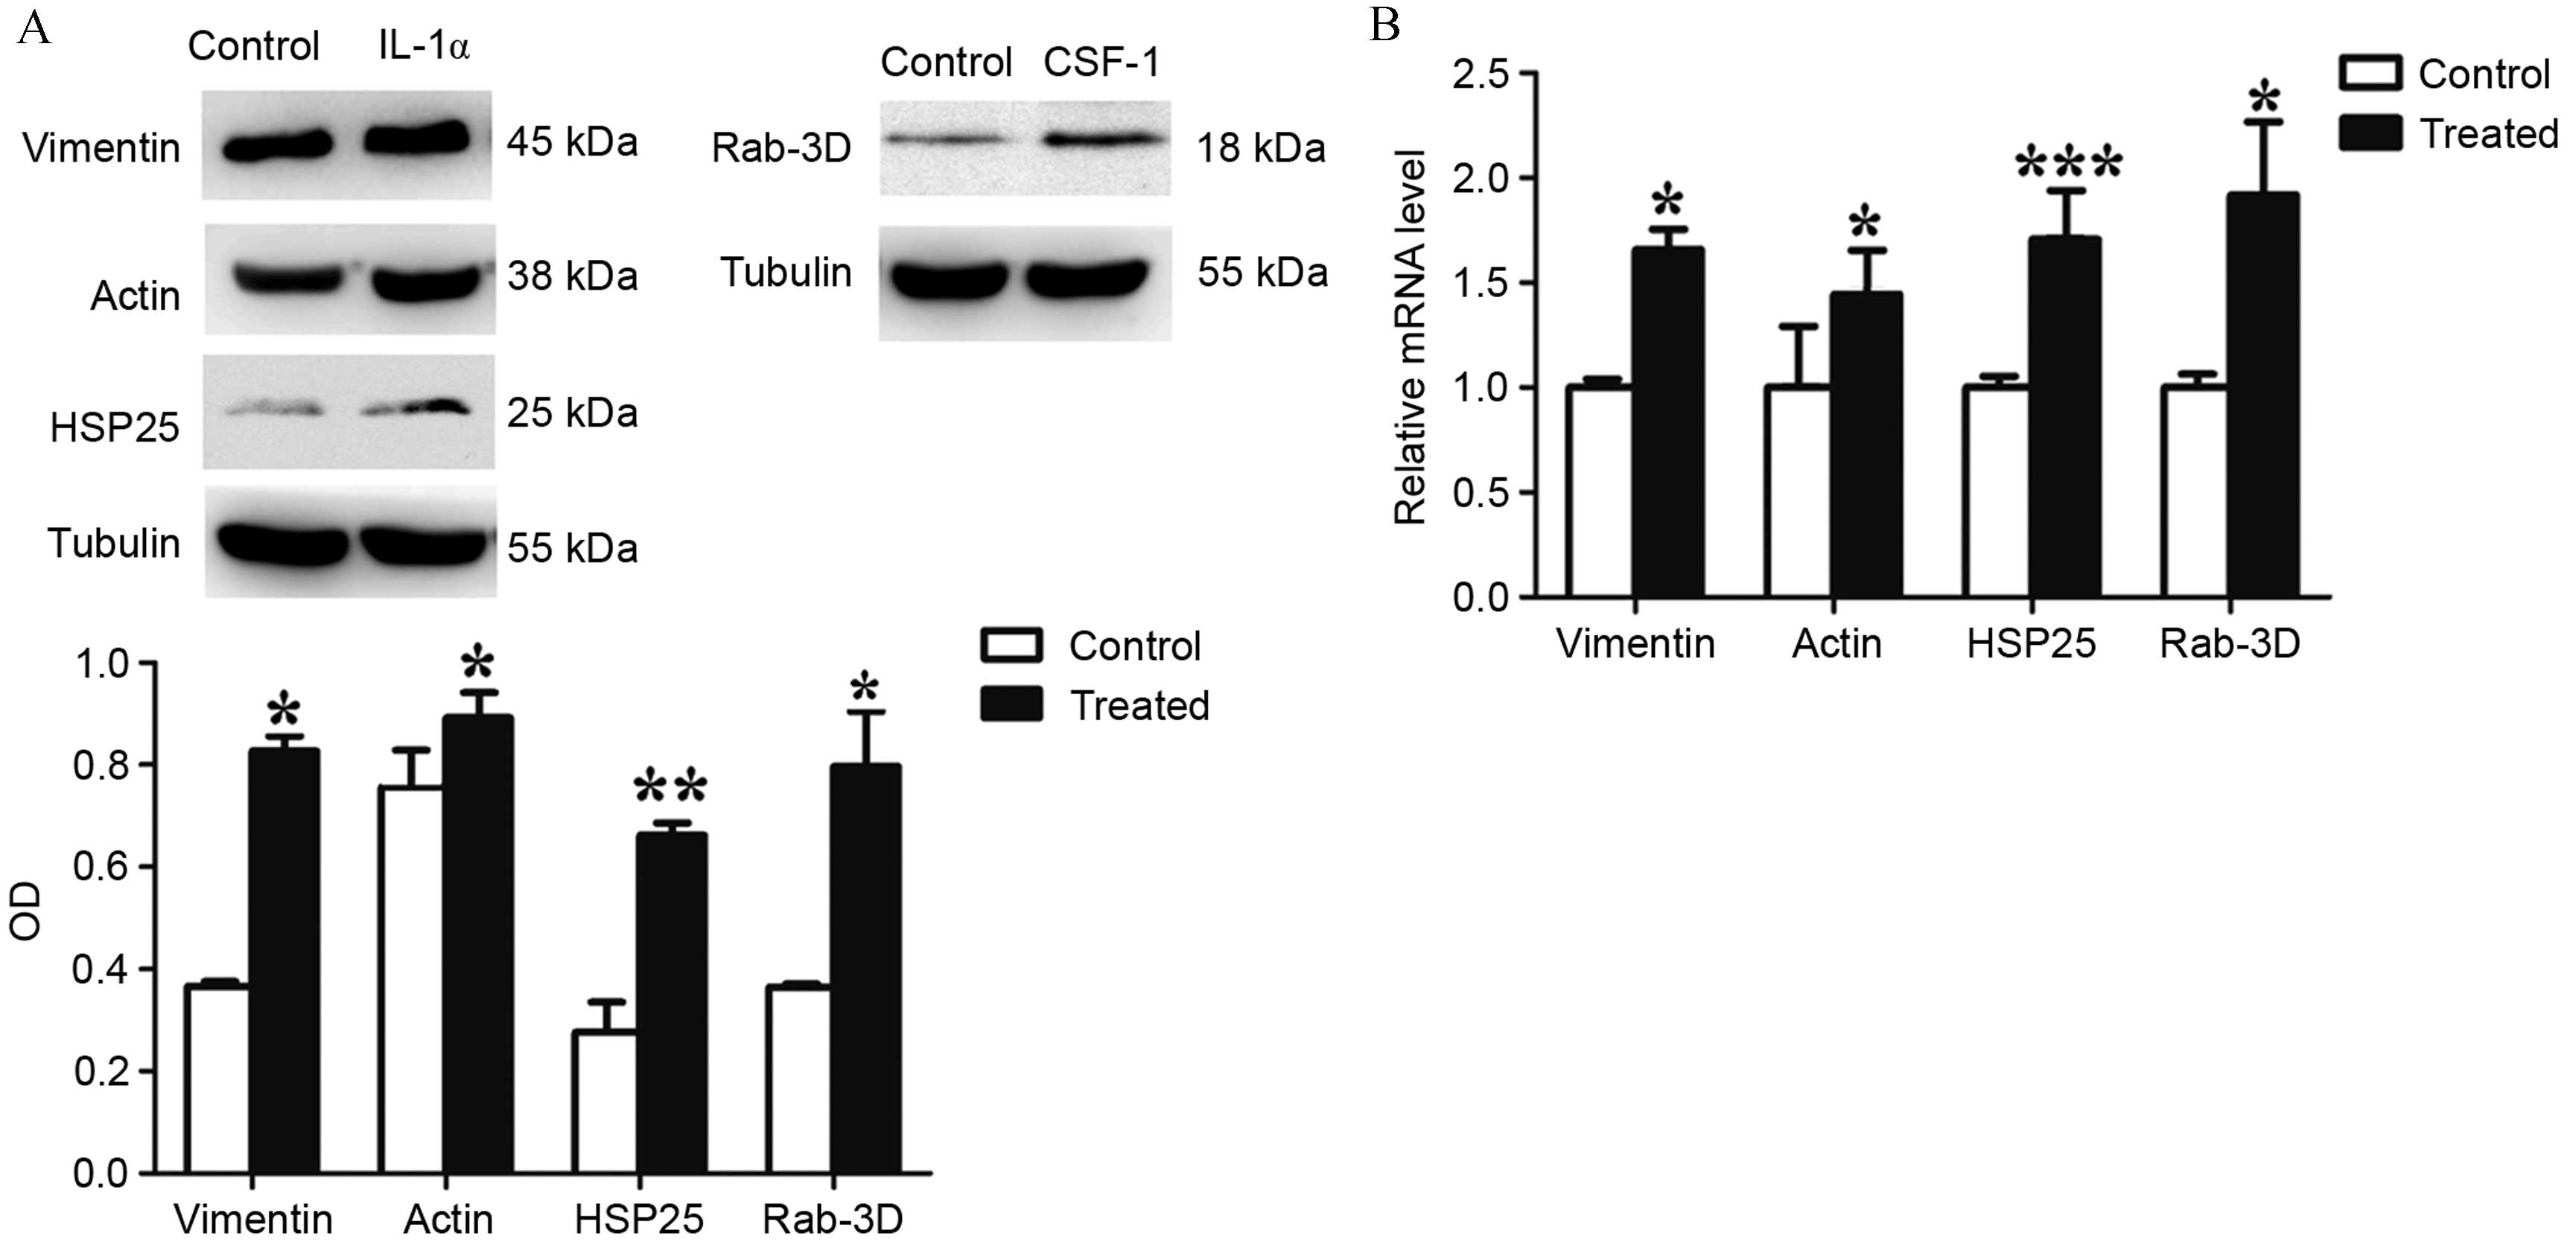 | Figure 4Western blotting and reverse
transcription-quantitative polymerase chain reaction analysis of
vimentin, actin, HSP25 and Rab-3D expression, in IL-1α and
CSF-1-treated DFCs. (A) Western blot analysis demonstrates that the
protein expression of vimentin, actin, HSP25 and Rab-3D were
significantly upregulated in treated DFC cultures compared with
control cultures. (B) mRNA levels of vimentin, actin, HSP25 and
Rab-3D were significantly upregulated in treated DFC cultures
compared with control cultures. Values are presented as the mean ±
standard deviation and were calculated from 3 independent cell
samples, with each cell sample repeated in triplicate.
*P<0.05, **P<0.05 and
***P<0.001 vs. control. HSP25, heat shock protein;
IL, interleukin; CSF-1, colony stimulating factor-1; DFCs, dental
follicle cells; OD, optical density. |
Discussion
Tooth eruption is a local event whereby specific
genes in the DF, which surrounds the unerupted tooth, are either
upregulated or downregulated at critical times to bring about the
osteoclastogenesis and osteogenesis required for eruption (1). Previous studies have investigated the
gene and protein profiles of DFCs after osteogenic differentiation
(12–14). Morsczeck et al (14) used 2-DE combined with capillary
liquid chromatography-tandem mass spectrometry analysis to profile
differentially regulated proteins upon DF precursor cell
differentiation, identifying 115 differentially regulated proteins.
Upregulated proteins were associated with actin bundling and
defense against oxidative cellular stress, whereas downregu-lated
proteins were associated with collagen biosynthesis (14). In the present study, the effects of
CSF-1 and IL-1α treatment on DFCs were investigated using
differential proteomics techniques, and the characteristic
molecular markers for tooth eruption were analyzed. Proteins that
were found to be upregulated as a result of treatment were
cytoskeletal proteins and those involved in stress and secretion.
Downregulated proteins were associated with protein degradation,
metal-binding and the cell cycle. The observed changes in the
expression of these proteins indicate that CSF-1 and IL-1α
regulate both osteogenesis and bone resorption to promote alveolar
bone remodeling during the process of tooth eruption.
The cytoskeleton is an intracellular matrix that
supports cell shape and function. The cytoskeletal systems of
different organisms are composed of similar proteins. However, the
structure, function and dynamic behavior of the cytoskeleton can
vary, depending on the organism and cell type (18). Vimentin is a cytoskeletal
intermediate filament protein found in cells of mesenchymal origin
including fibroblasts, endothelial cells and leukocytes. Vimentin,
tubulin and microfilaments form the entire cytoskeletal network.
Previous studies have shown that vimentin is associated with
apoptosis (19) and may function
in immunity (20). Lian et
al (21) reported that
vimentin production is stimulated by TGFβ via
phosphoinositide 3-kinase/Akt/mechanistic target of rapamycin
signaling, which leads to the suppression of activating
transcription factor 4-dependent Ocn transcription and osteoblast
differentiation. In human tooth germs, mesenchymal regions, such as
the dental papilla and dental sac, predominantly express vimentin
(22). In DFCs, vimentin is
expressed and distributed in the intermediate filament (23), similar to the periodontal ligament
cells (PDLCs) (24). Webb et
al (25) investigated the
expression of vimentin in rat DFCs and PDLCs at postnatal weeks 1,
2, 3, 4, 8 and 12 by indirect immunofluorescence, and observed that
the expression of vimentin in DFCs or PDLCs is always positive
during tooth development. In the current study, IL-1α was found to
upregulate the expression of vimentin in rat DFCs. This suggests
that vimentin may participate in the regulation of DFC
differentiation and bone resorption during the process of tooth
eruption. Further investigation will be required to elucidate the
mechanisms by which vimentin regulates DFC differentiation.
Actin is expressed universally in eukaryotic cells
and has been implicated in the division, migration, growth and
structural stability of cells. There are three actin protein
subtypes: α-, β- and γ-actin. Hosoya et
al (26) reported the
expression of α-smooth muscle actin (α-SMA) in the DF
in rat tooth development, and its distribution in the side of the
alveolar bone indicated that α-SMA may be a marker of the
osteogenic differentiation in DFCs. San Miguel et al
(27) reported α-SMA-GFP
expression during the early stages of primary cultures derived from
the DF and periodontal ligaments. Expression was reduced in areas
undergoing mineralization, suggesting that the α-SMA
promoter may be used to identify a population of osteoprogenitor
cells residing within the DF and periodontal ligament that are able
to differentiate into mature osteoblasts. The elevated expression
levels of actin by CSF-1 and IL-1α observed in the present study,
indicates that CSF-1 and IL-1α may stimulate the osteogenic
differentiation of DFCs.
HSPs are one of the most widely conserved stress
proteins that are produced by organisms in response to abnormal
conditions. HSP25 (also known as HSP27/HSPβ1) is a member of
the small HSP subfamily and protects cells from injury caused by
stress factors and is involved in cell proliferation,
differentiation and apoptosis. HSP25 serves an important role in
tooth development, with persistent expression in enamel and dentin,
and temporal expression in the pulp (28). A previous study demonstrated that
HSP25 is localized exclusively in the odontoblast layer (29), suggesting that it is a marker of
odontoblast differentiation (30,31).
Du et al (32) reported
HSP25 immunoreactivity is increased chronologically during DF
development. The protein was observed to have no significant effect
on cell proliferation, however, it may play a role in
cementoblast/osteoblast differentiation of DFCs. In the current
study, HSP25 expression was observed to be significantly
upregulated in the IL-1α-treated DFC group. This result may be due
to the protective reaction to IL-1α stimulation, which may bring
about the cementoblast/osteoblast differentiation of DFCs.
Rab-3D is a member of the Rab3 subfamily
(Rab3A/B/C/D) of small exocytotic GTPases, and represents a core
component of the osteoclastic vesicle transport machinery (33). Rab-3D is expressed in non-neuronal
cell types with high secretory requirements, where it localizes to
specialized secretory vesicles (34–36).
Pavlos et al (37) reported
an osteosclerotic phenotype in Rab-3D-deficient mice. Further
investigation revealed that Rab-3D modulates a post-trans-golgi
network trafficking step that is required for osteoclastic bone
resorption. In the present study, differential proteomics was
conducted, which indicated that DFCs demonstrated increased
expression of Rab-3D when induced by CSF-1. This was verified by
western blotting and RT-qPCR analysis. These findings indicate that
the activity of osteoclasts is regulated by the expression of
Rab-3D in tooth eruption.
Furthermore, in the present study, cullin-5 and
cyclin-G1 were downregulated in both the IL-1α- and CSF-1-treated
groups. Cullin-5 is a member of the cullin-RING E3 ubiquitin
family, which is involved in a variety of biological processes,
including the cell cycle and proliferation (38). The knockdown of cullin-5 has been
reported to promote cell growth by accelerating cell cycle
progression in vitro (38).
Cyclin-G1 is a member of the cyclin family of proteins, which
control the progression of cells through the cell cycle by
activating cyclin-dependent kinase (cdk) enzymes. Cyclin D1 has
been suggested to be required for growth arrest prior to commitment
to differentiation (39). Taking
these observations into account, the results of the present study
indicate that both IL-1α and CSF-1 accelerate the cell cycle
and the proliferation of DFCs. These results indicate a
coregulation of cullin-5 and cyclin-G1. Therefore, some form of
interaction may occur between these two proteins, however, this
interaction requires confirmation in future studies.
In conclusion, the present study identified the
differential protein expression of DFCs following incubation with
CSF-1 and IL-1α. These results suggest that CSF-1 and IL-1α
stimulate osteoclastogenesis (required for bone resorption and the
initiation of the eruption pathway), and the osteogenic
differentiation of DFCs. This investigation may provide new
insights into tooth eruption. The molecular mechanisms through
which CSF-1 and IL-1α promote tooth eruption via the DF requires
further study in order to provide an experimental foundation for
the early diagnosis and prevention of delayed tooth eruption and
impaction, in addition to novel therapeutic targets.
Acknowledgments
The present study was supported by the National
Natural Science Foundation of China (grant nos. 81170932 and
81300846) and the Science and Technology Research Fund of Guangdong
Province in China (grant no. B2013153).
References
|
1
|
Wise GE: Cellular and molecular basis of
tooth eruption. Orthod Craniofac Res. 12:67–73. 2009. View Article : Google Scholar : PubMed/NCBI
|
|
2
|
Ten Cate AR: The development of the
periodontium-a largely ectomesenchymally derived unit. Periodontol
2000. 13:9–19. 1997. View Article : Google Scholar : PubMed/NCBI
|
|
3
|
Lee HS, Lee J, Kim SO, Song JS, Lee JH,
Lee SI, Jung HS and Choi BJ: Comparative gene-expression analysis
of the dental follicle and periodontal ligament in humans. PLoS
One. 8:e842012013. View Article : Google Scholar :
|
|
4
|
Wise GE and Fan W: Changes in the
tartrate-resistant acid phosphatase cell population in dental
follicles and bony crypts of rat molars during tooth eruption. J
Dent Res. 68:150–156. 1989. View Article : Google Scholar : PubMed/NCBI
|
|
5
|
Bradaschia-Correa V, Moreira MM and
Arana-Chavez VE: Reduced RANKL expression impedes osteoclast
activation and tooth eruption in alendronate-treated rats. Cell
Tissue Res. 353:79–86. 2013. View Article : Google Scholar : PubMed/NCBI
|
|
6
|
Wise GE, Lin F and Zhao L: Transcription
and translation of CSF-1 in the dental follicle. J Dent Res.
74:1551–1557. 1995. View Article : Google Scholar : PubMed/NCBI
|
|
7
|
Que BG and Wise GE: Colony-stimulating
factor-1 and monocyte chemotactic protein-1 chemotaxis for
monocytes in the rat dental follicle. Arch Oral Biol. 42:855–860.
1997. View Article : Google Scholar
|
|
8
|
Wise GE, Frazier-Bowers S and D'Souza RN:
Cellular, molecular, and genetic determinants of tooth eruption.
Crit Rev Oral Biol Med. 13:323–334. 2002. View Article : Google Scholar : PubMed/NCBI
|
|
9
|
Neves JS, Salmon CR, Omar NF, Narvaes EA,
Gomes JR and Novaes PD: Immunolocalization of CSF-1, RANKL and OPG
in the enamel-related periodontium of the rat incisor and their
implications for alveolar bone remodeling. Arch Oral Biol.
54:651–657. 2009. View Article : Google Scholar : PubMed/NCBI
|
|
10
|
Van Wesenbeeck L, Odgren PR, MacKay CA,
D'Angelo M, Safadi FF, Popoff SN, Van Hul W and Marks SC Jr: The
osteopetrotic mutation toothless (tl) is a loss-of-function
frameshift mutation in the rat Csf1 gene: Evidence of a crucial
role for CSF-1 in osteoclastogenesis and endochondral ossification.
Proc Natl Acad Sci USA. 99:14303–14308. 2002. View Article : Google Scholar : PubMed/NCBI
|
|
11
|
Huang H and Wise GE: Delay of tooth
eruption in null mice devoid of the type I IL-1R gene. Eur J Oral
Sci. 108:297–302. 2000. View Article : Google Scholar : PubMed/NCBI
|
|
12
|
Vollkommer T, Gosau M, Felthaus O,
Reichert TE, Morsczeck C and Götz W: Genome-wide gene expression
profiles of dental follicle stem cells. Acta Odontol Scand.
73:93–100. 2015. View Article : Google Scholar
|
|
13
|
Morsczeck C, Schmalz G, Reichert TE,
Völlner F, Saugspier M, Viale-Bouroncle S and Driemel O: Gene
expression profiles of dental follicle cells before and after
osteogenic differentiation in vitro. Clin Oral Invest. 13:383–391.
2009. View Article : Google Scholar
|
|
14
|
Morsczeck C, Petersen J, Völlner F,
Driemel O, Reichert T and Beck HC: Proteomic analysis of osteogenic
differentiation of dental follicle precursor cells.
Electrophoresis. 30:1175–1184. 2009. View Article : Google Scholar : PubMed/NCBI
|
|
15
|
Du Y, Ling J, Wei X, Ning Y, Xie N, Gu H
and Yang F: Wnt/β-catenin signaling participates in
cementoblast/osteoblast differentiation of dental follicle cells.
Connect Tissue Res. 53:390–397. 2012. View Article : Google Scholar
|
|
16
|
Wei X, Wu L, Ling J, Liu L, Liu S, Liu W,
Li M and Xiao Y: Differentially expressed protein profile of human
dental pulp cells in the early process of odontoblast-like
differentiation in vitro. J Endod. 34:1077–1084. 2008. View Article : Google Scholar : PubMed/NCBI
|
|
17
|
Livak KJ and Schmittgen TD: Analysis of
relative gene expression data using real-time quantitative PCR and
the 2[-Delta Delta C(T)] method. Methods. 25:402–408. 2001.
View Article : Google Scholar
|
|
18
|
Wickstead B and Gull K: The evolution of
the cytoskeleton. J Cell Biol. 194:513–525. 2011. View Article : Google Scholar :
|
|
19
|
van Engeland M, Kuijpers HJ, Ramaekers FC,
Reutelingsperger CP and Schutte B: Plasma membrane alterations and
cytoskeletal changes in apoptosis. Exp Cell Res. 235:421–430. 1997.
View Article : Google Scholar : PubMed/NCBI
|
|
20
|
Mor-Vaknin N, Punturieri A, Sitwala K and
Markovitz DM: Vimentin is secreted by activated macrophages. Nat
Cell Biol. 5:59–63. 2003. View
Article : Google Scholar
|
|
21
|
Lian N, Lin T, Liu W, Wang W, Li L, Sun S,
Nyman JS and Yang X: Transforming growth factor β suppresses
osteoblast differentiation via the vimentin activating
transcription factor 4 (ATF4) axis. J Biol Chem. 287:35975–35984.
2012. View Article : Google Scholar : PubMed/NCBI
|
|
22
|
Kero D, Kalibovic Govorko D, Vukojevic K,
Cubela M, Soljic V and Saraga-Babic M: Expression of cytokeratin 8,
vimentin, syndecan-1 and Ki-67 during human tooth development. J
Mol Histol. 45:627–640. 2014. View Article : Google Scholar : PubMed/NCBI
|
|
23
|
Wise GE, Lin F and Fan W: Culture and
characterization of dental follicle cells from rat molars. Cell
Tissue Res. 267:483–492. 1992. View Article : Google Scholar : PubMed/NCBI
|
|
24
|
Sculean A, Berakdar M, Windisch P,
Remberger K, Donos N and Brecx M: Immunohistochemical investigation
on the pattern of vimentin expression in regenerated and intact
monkey and human periodontal ligament. Arch Oral Biol. 48:77–86.
2003. View Article : Google Scholar : PubMed/NCBI
|
|
25
|
Webb PP, Moxham BJ, Benjamin M and Ralphs
JR: Changing expression of intermediate filaments in fibroblasts
and cementoblasts of the developing periodontal ligament of the rat
molar tooth. J Anat. 188:529–539. 1996.PubMed/NCBI
|
|
26
|
Hosoya A, Nakamura H, Ninomiya T, Yoshiba
K, Yoshiba N, Nakaya H, Wakitani S, Yamada H, Kasahara E and Ozawa
H: Immunohistochemical localization of alpha-smooth muscle actin
during rat molar tooth development. J Histochem Cytochem.
54:1371–1378. 2006. View Article : Google Scholar : PubMed/NCBI
|
|
27
|
San Miguel SM, Fatahi MR, Li H, Igwe JC,
Aguila HL and Kalajzic I: Defining a visual marker of
osteoprogenitor cells within the periodontium. J Periodontal Res.
45:60–70. 2010. View Article : Google Scholar :
|
|
28
|
Ohshima H, Ajima H, Kawano Y, Nozawa-Inoue
K, Wakisaka S and Maeda T: Transient expression of heat shock
protein (Hsp)25 in the dental pulp and enamel organ during
odontogenesis in the rat incisor. Arch Histol Cytol. 63:381–395.
2000. View Article : Google Scholar : PubMed/NCBI
|
|
29
|
Nakasone N, Yoshie H and Ohshima H: An
immunohistochemical study of the expression of heat-shock
protein-25 and cell proliferation in the dental pulp and enamel
organ during odontogenesis in rat molars. Arch Oral Biol.
51:378–386. 2006. View Article : Google Scholar
|
|
30
|
Masuda-Murakami Y, Kobayashi M, Wang X,
Yamada Y, Kimura Y, Hossain M and Matsumoto K: Effects of mineral
trioxide aggregate on the differentiation of rat dental pulp cells.
Acta Histochem. 112:452–458. 2010. View Article : Google Scholar
|
|
31
|
Nakatomi M, Ida-Yonemochi H and Ohshima H:
Lymphoid enhancer-binding factor 1 expression precedes dentin
sialophosphoprotein expression during rat odontoblast
differentiation and regeneration. J Endod. 39:612–618. 2013.
View Article : Google Scholar : PubMed/NCBI
|
|
32
|
Du Y, Gu HJ, Gong QM, Yang F and Ling JQ:
HSP25 affects the proliferation and differentiation of rat dental
follicle cells. Int J Oral Sci. 1:72–80. 2009. View Article : Google Scholar : PubMed/NCBI
|
|
33
|
Pavlos NJ, Cheng TS, Qin A, Ng PY, Feng
HT, Ang ES, Carrello A, Sung CH, Jahn R, Zheng MH and Xu J:
Tctex-1, a novel interaction partner of Rab3D, is required for
osteoclastic bone resorption. Mol Cell Biol. 31:1551–1564. 2011.
View Article : Google Scholar : PubMed/NCBI
|
|
34
|
Tian X, Jin RU, Bredemeyer AJ, Oates EJ,
Błazewska KM, McKenna CE and Mills JC: RAB26 and RAB3D are direct
transcriptional targets of MIST1 that regulate exocrine granule
maturation. Mol Cell Biol. 30:1269–1284. 2010. View Article : Google Scholar :
|
|
35
|
Evans E, Zhang W, Jerdeva G, Chen CY, Chen
X, Hamm-Alvarez SF and Okamoto CT: Direct interaction between Rab3D
and the polymeric immunoglobulin receptor and trafficking through
regulated secretory vesicles in lacrimal gland acinar cells. Am J
Physiol Cell Physiol. 294:C662–C674. 2008. View Article : Google Scholar : PubMed/NCBI
|
|
36
|
Ngyen D, Jones A, Ojakian GK and
Raffaniello RD: Rab3D redistribution and function in rat parotid
acini. J Cell Physiol. 197:400–408. 2003. View Article : Google Scholar : PubMed/NCBI
|
|
37
|
Pavlos NJ, Xu J, Riedel D, Yeoh JS,
Teitelbaum SL, Papadimitriou JM, Jahn R, Ross FP and Zheng MH:
Rab3D regulates a novel vesicular trafficking pathway that is
required for osteoclastic bone resorption. Mol Cell Biol.
25:5253–5269. 2005. View Article : Google Scholar : PubMed/NCBI
|
|
38
|
Ma C, Qi Y, Shao L, Liu M, Li X and Tang
H: Downregulation of miR-7 upregulates Cullin 5 (CUL5) to
facilitate G1/S transition in human hepatocellular carcinoma cells.
IUBMB Life. 65:1026–1034. 2013. View Article : Google Scholar : PubMed/NCBI
|
|
39
|
Galderisi U, Jori FP and Giordano A: Cell
cycle regulation and neural differentiation. Oncogene.
22:5208–5219. 2003. View Article : Google Scholar : PubMed/NCBI
|