Introduction
Borna disease virus (BDV) is an enveloped,
non-segmented, negative-sense, single-stranded RNA virus, which
belongs to the Bornaviridae family (1). BDV is a neurotropic that persists in
the central nervous system (2),
and affects infected individuals for their entire life span
resulting in chronic, persistent infections of neurons and glial
cells. It has been reported that BDV infects a range of animal
species worldwide (3), including
China (4,5). BDV infects neurons in the limbic
system, and primarily in the hippocampus and the cortex, which has
wide spread connections to diverse cortical areas (6). However, BDV infection is restricted
to areas of the rat brain that are responsible for intensive
neurodegeneration in newborn Sprague-Dawley rats, indicating that
the function of immature neural cells is impaired by BDV (7).
Although the exact mechanism(s) of BDV pathogenesis
have not been determined (8),
there is interest in the interaction of host mRNA and microRNAs
(miRNAs). miRNAs are short (~22 nt) endogenous RNAs that are key in
regulating expression of a diverse genes involved in different
cellular processes. Aberrant miRNA expression has been associated
with a number of human diseases and accurate quantification of
miRNA expression is important for their use as biomarkers and to
determine their functions in health. When attempting to analyze the
consequences of BDV infection in a model, a well-established and
understood technique was required, thus, the accurate and specific
reverse transcription-quantitative polymerase chain reaction
(RT-qPCR) is used to evaluate miRNA levels in biological samples
(9).
There has been no formal evaluation of optimal
primary rat hippocampal neurons miRNA reference genes for BDV
research. Thus, the current study systematically identified the
most stable housekeeping genes in cultured primary rat hippocampal
neurons infected with BDV Hu-H1 strain. A total of 10 commonly used
reference genes [5S, U6, U87, E2 small nucleolar RNA (snoRNA),
miR-16, miR-103, miR-191, miR-let-7a, miR-92a and miR-101a] were
selected as candidate reference genes, and RT-qPCR was subsequently
used to validate the infected and non-infected hippocampal neurons.
Four statistical algorithms and consensus ranking were applied to
identify the most stable reference genes. These results may provide
information regarding appropriate reference genes for normalization
of RT-qPCR data in BDV-infected rat hippocampal neurons.
Materials and methods
Primary culture of hippocampal neurons
and viral infection
Hippocampal neurons were isolated from the brains of
24 male Sprague-Dawley rats (postnatal day 1; weight, 8–10 g;
Chongqing Medical University Animal Experimental Center, Chongqing,
China). Prior to neuronal isolation the rats were anesthetized in
ice for 1–5 min, after which they were incubated in 70% ethanol for
30 sec until hyothermic; subsequently, the rats were decaptitated
and the heads were placed in cold Hank's Balanced Salt Solution
(HBSS; Invitrogen; Thermo Fisher Scientific, Inc., Waltham, MA,
USA). The neurons were maintained in Dulbecco's modified Eagle's
medium/Nutrient Mixture F-12 (Gibco; Thermo Fisher Scientific,
Inc., Waltham, MA, USA) supplemented with 15% fetal calf serum, 10%
horse serum, 1% glutamine, 0.5% 10 U/ml penicillin/streptomycin
(all obtained from Gibco; Thermo Fisher Scientific, Inc.), as
previously described (10). Cells
were seeded at a density of 5×10⁵ cells/well on
poly-L-lysine-coated six-well plates (Sigma-Aldrich; Merck
Millipore, Darmstadt, Germany). After 4 h at 37°C, half of the
cultured neurons were infected with BDV Hu-H1 strain [in an
oligodendroglia cell line; multiplicity of infection (MOI)=0.2],
which was presented by Professor Hanns Ludwig (Free University of
Berlin, Berlin, Germany), by adding cell-released virus (CRV) to
the culture medium. CRV stocks were prepared as previously
described (11). The BDV Hu-H1
strain is one of the first three human strains derived from
mentally affected patients (12).
These strains have been partially characterized by sequencing
(13). The remaining neurons were
maintained as a control sample. After 2 h of BDV infection, excess
virus was removed by washing with HBSS (1 ml/well; Ca2+
and Mg2+ free). Subsequently, the neurons were incubated
in neurobasal medium with 2% B-27 (Gibco; Thermo Fisher Scientific,
Inc.) for 12 days at 37°C. The present study was approved by the
ethics committee of Chongqing Medical University (Chongqing,
China).
Immunofluorescence
To identify the purity of neurons and the effect of
BDV infection for each experiment, a standard immunofluorescence
protocol was used, as previously described (14,15)
and observed with a fluorescence microscope (Nikon Corporation,
Tokyo, Japan). Briefly, the BDV-infected and non-infected neurons
were incubated in six-well plates for 20 min at room temperature
with 4% paraformaldehyde, followed by permeabilization for 10 min
in 0.25% Triton X-100. Subsequently, the two neuron groups were
rinsed with HBSS (1 ml/well) three times for 5 min and blocked with
5% bovine serum albumin (Sigma-Aldrich) for 30 min, followed by
incubation at 4°C overnight with primary antibodies (16). Following three washes with HBSS,
the cells were incubated with the neuron-specific marker
microtubule associated protein 2 (1:5,000; cat. no. ab5392; Abcam,
Cambridge, MA, USA) and a BDV-specific anti-P40 monoclonal antibody
(1:400; cat. no. AJ1572a; Abgent, Inc., Santa Diego, CA, USA)
(15). Cells were then incubated
with Alexa Fluor 594-conjugated goat anti-chicken secondary
antibody (1:500; cat. no. A-11042; Invitrogen; Thermo Fisher
Scientific, Inc.) for 2 h at room temperature. Following extensive
phosphate-buffered saline washing, cells were incubated with DAPI
(Beyotime Institute of Biotechnology, Haimen, China) for 1 min at
room temperature and observed using an inverted fluorescence
microscope.
RT-qPCR expression studies of
candidate reference genes
A total of 10 commonly used candidate reference
genes for miRNAs were selected from the reference literature
(17–20). Their primer sequences, amplicon
size, and amplification efficiencies are presented in Table I. To identify candidate reference
miRNAs from each hippocampal neurons group, the following criteria
were used: i) miRNAs had to be detected as ‘present’
(foreground-background, >100) in all 32 samples; ii) the
fold-change of the candidate reference gene expression indicated a
significant difference between the two groups (P<0.05); and iii)
candidate miRNAs must be unambiguously annotated in the miRBase
(http://www.mirbase.org/).
 | Table I.List of candidate reference
genes. |
Table I.
List of candidate reference
genes.
| Symbol | Accession | Primer sequences
(5′→3′) | Amplicon size | Amplicon
efficiency | Cq value (mean ±
SD) | Mean relative
quantificationa |
|---|
| miR-92a |
MI0000878b | RT:
GTCTCCTCTGGTGCAGGGTCCGAGGTATTCGCACCAGAGGAGACCAGGCC | 48 | 1.01 | 28.26±0.76 | 0.94 |
|
|
| F:
CGCGTATTGCACTTGTCCC |
|
|
|
|
| 5S |
K01594.1b | RT:
AGCCTACAGCACCCGGTATT | 40 | 0.98 | 20.41±0.83 | 1.05 |
|
|
|
F:GCCCGATCTTGTCTGATCTC |
|
|
|
|
| U6 |
K00784.1b | RT:
AACGCTTCACGAATTTGCGT | 93 | 0.98 | 29.03±0.67 | 0.87 |
|
|
|
F:CTCGCTTCGGCAGCACA |
|
|
|
|
| miR-103 |
MI0000934b | RT:
GTCTCCTCTGGTGCAGGGTCCGAGGTATTCGCACCAGAGGAGACTCATAG | 51 | 0.95 | 25.10±0.82 | 0.72 |
|
|
|
F:TACGCAGCAGCATTGTACAG |
|
|
|
|
|
miR-101a |
MI0000886b | RT:
TCTCCTCTGGTGCAGGGTCCGAGGTATTCGCACCAGAGGAGACTTCAGT | 49 | 0.95 | 31.72±0.58 | 0.82 |
|
|
|
F:GCGCGTACAGTACTGTGATA |
|
|
|
|
| miR-let-7a |
MI0000827b | RT:
GTCTCCTCTGGTGCAGGGTCCGAGGTATTCGCCACCAGAGGAGACAACTAT | 50 | 1.02 | 24.07±0.45 | 0.88 |
|
|
|
F:CGCGCTGAGGTAGTAGGTTG |
|
|
|
|
| miR-16 |
MI0000844b | RT:
GTCTCCTCTGGTGCAGGGTCCGAGGTATTCGCACCAGAGGAGACCGCCAA | 50 | 0.98 | 22.25±0.57 | 0.93 |
|
|
|
F:CAGCCTAGCAGCACGTAAAT |
|
|
|
|
| E2 snoRNA |
U64702.1c | RT:
GTCTCCTCTGGTGCAGGGTCCGAGGTATTCGCACCAGAGGAGACCTTGCC | 67 | 0.97 | 27.98±0.57 | 1.17 |
|
|
|
F:CGATGAACTCCTAAGTGTAGG |
|
|
|
|
| U87 |
AF272707c | RT:
GTCTCCTCTGGTGCAGGGTCCGAGGTATTCGCACCAGAGGAGACGCTCAG | 75 | 0.95 | 20.27±0.60 | 0.88 |
|
|
| F:
CCAGCTGAGGGTTTCTTTGA |
|
|
|
|
| miR-191 |
MI0000934b | RT:
GTCTCCTCTGGTGCAGGGTCCGAGGTATTCGCACCAGAGGAGACCAGCTG | 49 | 0.96 | 25.43±0.62 | 0.79 |
|
|
| F:
GCACCAACGGAATCCCAAA |
|
|
|
|
| miR-155 | MIMAT | RT:
GTCTCCTCTGGTGCAGGGTCCGAGGTATTCGCACCAGAGGAGACACCCCT | 51 | 0.97 |
|
|
|
|
0030409b |
|
|
|
|
F:GGCGCTTAATGCTAATTGTGATGAGGTATTCGCACCAGAGGA |
|
|
|
|
| Universal reverse
primer |
|
|
|
|
|
|
RNA isolation and reverse
transcription
Total RNA was extracted from the hippocampal neurons
using RNAiso Plus (Takara Bio, Inc., Otsu, Japan) according to the
manufacturer's protocols. The samples were dissolved in 20 µl
DNase/RNase-free H2O and stored at −80°C until use. Isolated RNA
was reverse transcribed into cDNA with GoScript™ Reverse
Transcription system (Promega Corporation, Madison, WI, USA)
according to the manufacturer's protocols. Briefly, the first
reaction mixture consisted of 4 µl RNA, 5 µl total primers, and 1.6
µl DNase/RNase-free H2O performed in a Gene Amp PCR System 9700
(Applied Biosystems; Thermo Fisher Scientific, Inc.) at 42°C for 15
min and 70°C for 15 min. Subsequently, first reaction mixture was
added to the prepared RT mix containing 1.6 µl Nuclease-Free Water,
4.0 µl GoScript™ 5X Reaction Buffer, 2 µl MgCl2 (25 mM),
0.4 µl recombinant RNasin® Ribonuclease Inhibitor, and 1
µl GoScript™ Reverse Transcriptase. The whole reverse transcription
was performed in a Gene Amp PCR System 9700 at 25°C for 5 min, 42°C
for 60 min, and 70°C for 15 min. The control cDNA synthesis
reaction, without reverse transcriptase enzyme, was performed to
test that the extracted RNA was not contaminated with genomic DNA.
cDNAs were stored at −20°C until later use.
qPCR
The qPCR reactions were performed according to the
manufacturer's protocol and our previous study (15) in the Gene Amp PCR System 9700.
Briefly, qPCR amplification was performed with 2X GoTaq®
qPCR Master mix (Promega Corporation) in a final volume of 20 µl.
The reaction mixture consisted of 10 µl 2X GoTaq® qPCR
Master mix, 0.3 µl 10 µM Universal Adaptor PCR Forward Primer, 0.3
µl 10 µM PCR Reverse Primer, 2 µl cDNA template, and 7.4 µl sterile
distilled water. The qPCR reaction was initiated with 2 min
incubation at 95°C, followed by 40 cycles at 95°C for 15 sec and 60
sec at 60°C. Subsequently, a melting curve was performed at the end
of the PCR run over a range of 55–99°C, increasing the temperature
stepwise by 0.5°C every 2 sec. The sample maximization method
criterion was used to establish the run layout. A dilution series
was created with random cDNA from the sample group to construct
standard curves for each primer pair. Gene-specific amplification
was confirmed by a single peak in the melting-curve analysis, and a
single band on a 2% agarose gel stained with ethidium bromide. All
samples (each group, n=16; total, n=32) were diluted 20 times and
the reaction was performed, as described above, in duplicate.
Data analysis
All statistical analyses were performed with SPSS
21.0 (IBM SPSS, Armonk, NY, USA) and the figures were produced with
Graphpad Prism 5.0 (GraphPad Software Inc., La Jolla, CA, USA). A
Student's t-test and the Wilcoxon-Mann-Whitney test was used to
determine statistically significant differences between the two
groups. P<0.05 was considered to indicate a statistically
significant difference. Data were presented as the mean ± standard
error of the mean. The stability of miRNA expression for each
reference gene was statistically analyzed with the four software
packages, geNorm (https://genorm.cmgg.be/), NormFinder (http://moma.dk/normfinder-software), BestKeeper
(http://www.gene-quantification.de/bestkeeper.html),
and the comparative Δ-Ct method (21). Cq values were transformed into
relative expression quantity (RQ) values according to the Δ-Ct
formula [RQ=E−ΔCq=E(mean Cq-sample
Cq))]as required for inputs for the geNorm and NormFinder
methods only. Subsequently, the stability measurements were
combined to establish a consensus rank of the housekeeping genes
using the RankAggreg package of the R project.
Results
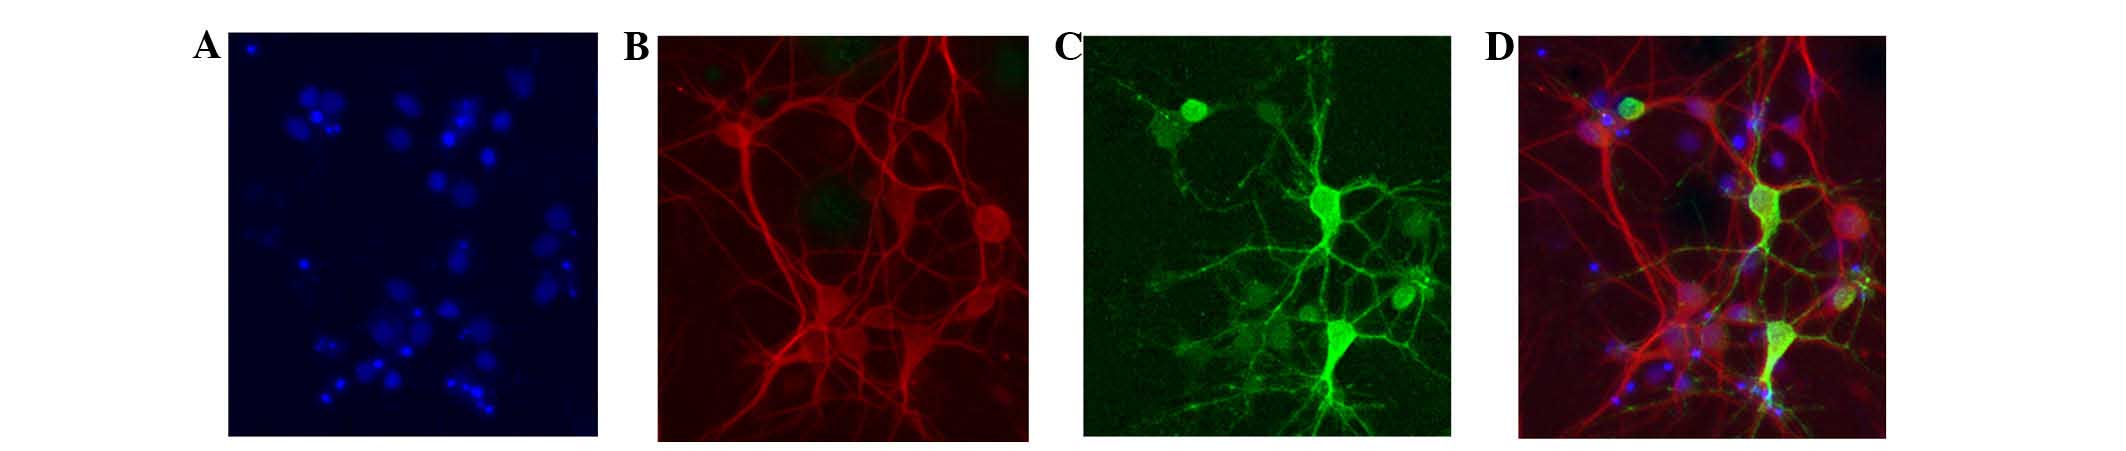
Immunofluorescence assay
As our previous study (15) demonstrated that BDV P40+
neurons were >80% at day 9 and almost 100% by day 12, the cells
were infected with a low MOI of 0.02 focus forming units and the
current immunofluorescence assay was applied on day 10. The purity
of neurons and efficiency of infection was determined via
observation of randomly selected cells across three independent
experiments. On day 10, the results demonstrated that the purity of
neurons was >85% (Fig. 1A and
B). The infection efficiency of BDV P40+ neurons was
~100% (Fig. 1C and D).
Evaluation of methods for measuring
miRNAs in hippocampal neurons
To evaluate the expression level of these candidate
reference genes in rat hippocampal neurons between the BDV-infected
group and the control group at 12 days post-infection. RT-qPCR was
used to detect and the gene products indicated single bands for all
primer sets during agarose gel electrophoresis (data not shown).
Melting curve analysis consistently demonstrated a single
homogenous melting peak for each primer set and no amplicons were
detected for the no template control. The amplification
efficiencies for all candidate reference genes were indicated by
the standard curve and are presented in Table I. These results indicated that the
method of measurement was viable.
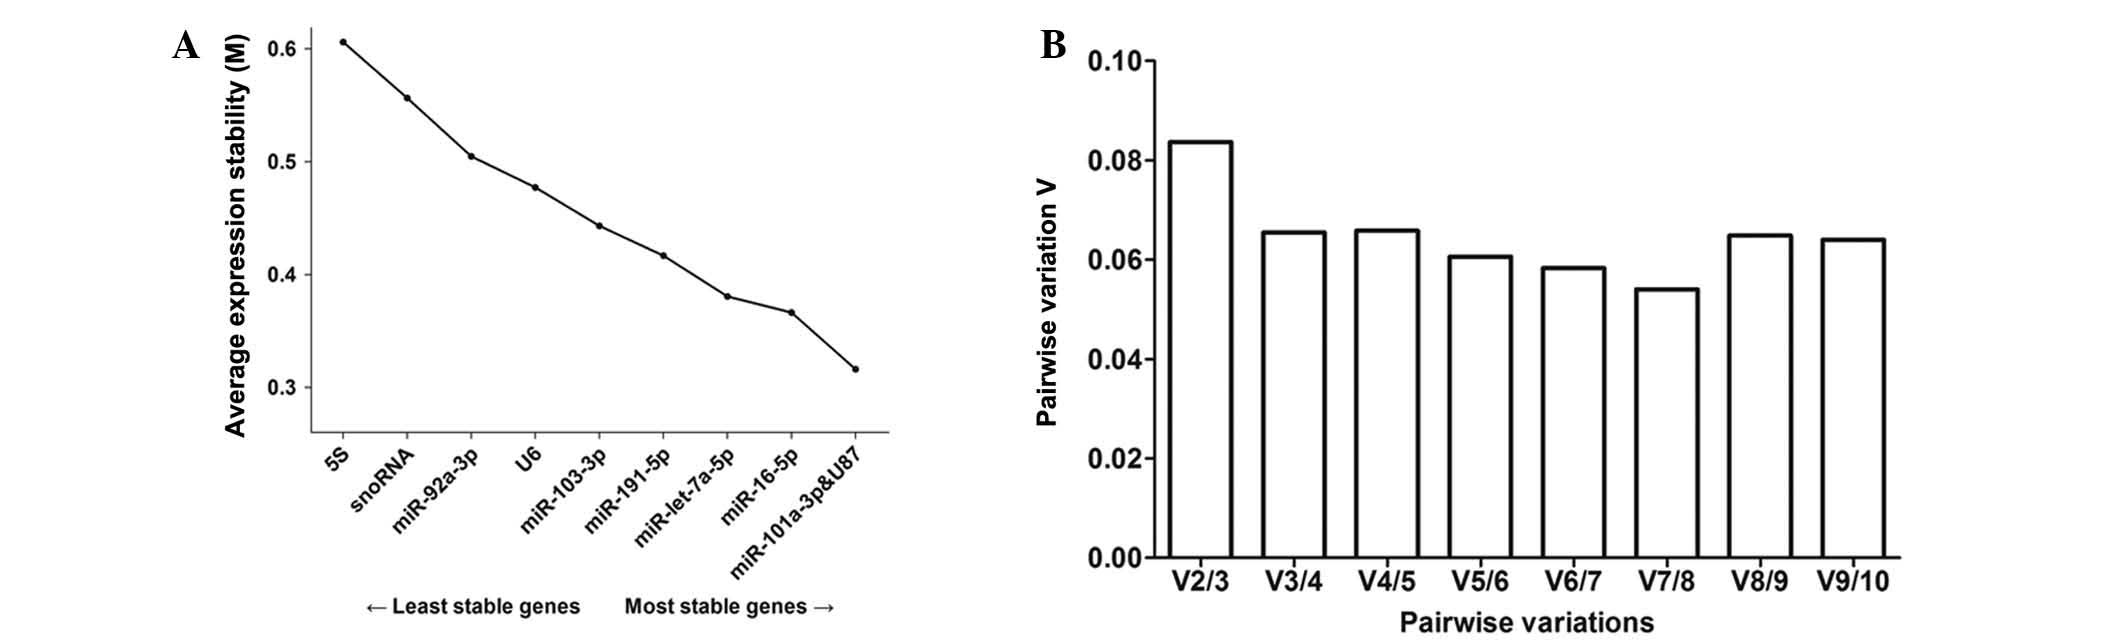
Candidate reference gene ranking by
expression stability
There were four aforementioned algorithms used to
assess the stability of the candidate housekeeping gene miRNAs
expression in infected cells and the control. GeNorm (22) provides a ranking of the candidate
reference genes based on the their expression stability measure (M)
in order to identify the most stable reference gene on day 12. The
lowest M-value corresponds to the most stable reference gene, while
the highest corresponds to the least stable one. In previous
studies, an M-value <0.5 was set as a cut-off to assess gene
stability in homogenous samples (23). GeNorm identified miR-101a and U87
(M-value, 0.3160; Table II) as
the most stable pair-wise combination of reference genes for the
experimental groups on day 12. Furthermore, geNorm calculated the
pairwise variation (Vn/Vn+1) that selects the optimum number of
reference genes (Fig. 2). As
reported by Vandesompele et al (24), the ideal pair-wise variation value
is <0.15. As presented in Fig.
2, the calculated V2/3 was <0.15. Thus, only the two most
stable genes for a reliable normalization were taken into
consideration. Subsequently, the most stable reference genes were
identified by NormFinder (25),
which enables the identification of the single most reliable gene
and provides a ranking order. NormFinder identified U87 as the
optimal reference gene on day 12 (Table II).
| Table II.Expression stability of reference
genes as calculated by geNorm, NormFinder, BestKeeper, and Δ-Ct
(c+V, n=32). |
Table II.
Expression stability of reference
genes as calculated by geNorm, NormFinder, BestKeeper, and Δ-Ct
(c+V, n=32).
| geNorm rank | Gene | M-value | NormFinder
rank | Gene | Variability |
|---|
| 1 | miR-101a | 0.3160 | 1 | U87 | 0.0799 |
| 2 | U87 | 0.3160 | 2 | miR-92ap | 0.1186 |
| 3 | miR-16 | 0.3662 | 3 | miR-101a | 0.1248 |
| 4 | miR-let-7a | 0.3804 | 4 | miR-16 | 0.1265 |
| 5 | miR-191 | 0.4167 | 5 | U6 | 0.1315 |
| 6 | miR-103 | 0.4431 | 6 | miR-let-7a | 0.1384 |
| 7 | U6 | 0.4773 | 7 | miR-191 | 0.1874 |
| 8 | miR-92a | 0.5048 | 8 | 5S | 0.2346 |
| 9 | E2 snoRNA | 0.5566 | 9 | miR-103 | 0.3088 |
| 10 | 5S | 0.6061 | 10 | E2 snoRNA | 0.3482 |
|
| BestKeeper
rank | Gene | Coeff. of
corr.[r] | Δ-Ct rank | Gene | MeanStdDev |
|
| 1 | U87 | 0.891 | 1 | miR-101a | 0.5154 |
| 2 | miR-101a | 0.878 | 2 | U87 | 0.5167 |
| 3 | miR-92a | 0.859 | 3 | miR-16 | 0.5538 |
| 4 | miR-103 | 0.85 | 4 | miR-let-7a | 0.5704 |
| 5 | miR-16 | 0.813 | 5 | miR-191 | 0.5769 |
| 6 | U6 |
| 6 | U6 | 0.6058 |
| 7 | miR-191 | 0.797 | 7 | miR-92a | 0.6259 |
| 8 | miR-let-7a | 0.724 | 8 | miR-103 | 0.6418 |
| 9 | 5S | 0.633 | 9 | E2 snoRNA | 0.7528 |
| 10 | E2 snoRNA | 0.427 | 10 | 5S | 0.8176 |
A total of 10 common used candidate reference genes
were measured and Δ-Ct (Cq, quantification cycle) analysis
(26) demonstrated the ranking of
the stability of reference genes by comparing the Cq value
differences among all samples (Table
II). The optimal reference genes were miR-101a and U87 with
mean standard deviations of 0.5154 and 0.5167, respectively, on day
12. BestKeeper (27) analyzes the
correlation between the genes with the BestKeeper index based on a
Pearson correlation (r) (20)
using repeated pair-wise correlation analysis of candidate gene Cq
values to determine optimal reference genes and recommended U87
(0.891) and miR-101a (0.898) as the two most stable genes.
Consensus ranking was performed by the RankAggreg
package. The consensus ranking was compared with the rankings
produced by geNorm, NormFinder, BestKeeper, and the comparative
Δ-Ct method (Table III). Thus,
the RankAggreg output determined the most (miR-101a and U87) and
the least (snoRNA) suitable reference genes.
| Table III.Consensus ranking of ten candidate
reference genes. |
Table III.
Consensus ranking of ten candidate
reference genes.
| Ranking | geNorm | NormFinder | BestKeeper | Δ-Ct | Consensus
ranking |
|---|
| 1 | miR-101a and
U87 | U87 | U87 | miR-101a | miR-101a |
| 2 | – | miR-92a | miR-101a- | U87 | U87 |
| 3 | miR-16 | miR-101a | miR-92a | miR-16- | miR-16 |
| 4 | miR-let-7a | miR-16 | miR-103 | miR-let-7a | miR-92a |
| 5 | miR-191 | U6 | miR-16 | miR-191 | miR-let-7a- |
| 6 | miR-103 | miR-let-7a | U6 | U6 | U6 |
| 7 | U6 | miR-191 | miR-191 | miR-92a | miR-191 |
| 8 | miR-92a | 5S | miR-let-7a | miR-103 | miR-103 |
| 9 | E2 snoRNA | miR-103 | 5S | E2 snoRNA | 5S |
| 10 | 5S | E2 snoRNA | E2 snoRNA | 5S | E2 snoRNA |
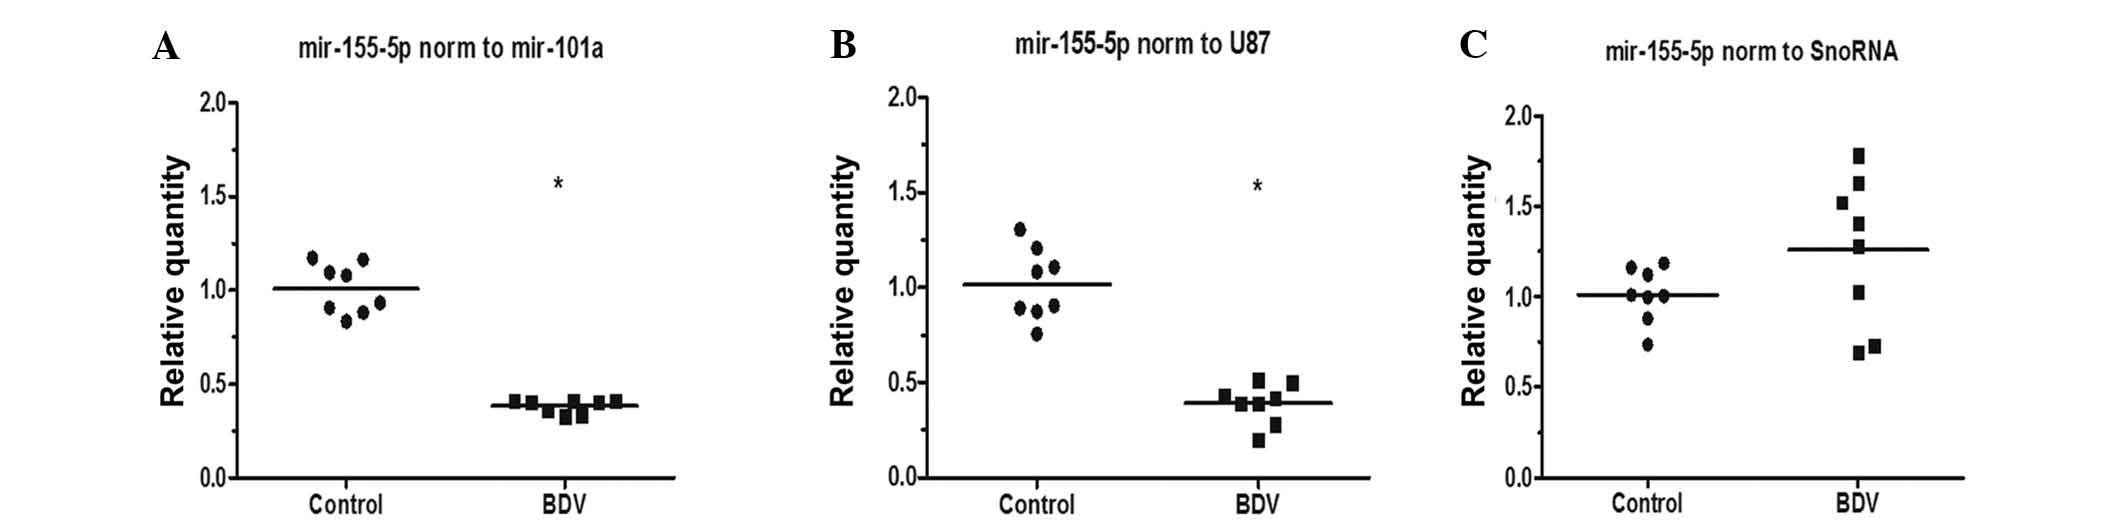
Assessment of validity
To further investigate the use of miR-101a in miRNA
relative quantification, miR-155 was selected as a standard by
which to evaluate the use of miR-101a as a reference gene, as
miR-155 has a core immune regulatory role in cells with BDV
persistent infection, and miR-155 was observed to be downregulated
in persistently infected BDV human oligodendroglia (OL/BDV) cells
as the BDV P protein directly inhibited miR-155 expression
(28). miRNA-155 regulates cell
processes, including cell survival, growth, and chemosensitivity
(29) and dendritic development
and apoptosis (30). The relative
expression levels of the target gene were evaluated using the most
stable reference gene (miR-101a and U87) vs. the least reference
stable gene (snoRNA). When using miR-101a and U87 as a reference
gene, the relative expression of miR-155 was demonstrated to be
significantly downregulated (Table
IV and Fig. 3A and B;
P<0.05), which is similar to a previous study (28). When snoRNA was selected as the
reference gene, the relative expression levels of miR-155 was
demonstrated to be upregulated (Table
IV; Fig. 3C) and no
significant difference was indicated between the BDV-infected and
non-infected groups.
| Table IV.Relative gene expression ratios of
miR-155. |
Table IV.
Relative gene expression ratios of
miR-155.
| Reference
genes | miR-155 (P-value,
n=16) | 2−ΔΔCt
value (mean) |
|---|
| miR-101a | 0.000 | 0.695 |
| U87 | 0.000 | 0.702 |
| E2 snoRNA | 0.141 | 1.134 |
Discussion
miRNAs have been demonstrated to be important as
regulators of gene expression, promoting increased understanding of
gene regulation in normal development and in disease. miRNA
expression profiles have been suggested be more accurate in disease
classification than mRNA expression profiles (31). miRNAs are of research interest due
to their role in the molecular changes underlying different disease
models. miRNAs reduce expression of proteins encoded by their
target RNAs, by binding to the 3′-untranslated region of target
mRNAs. Thus, it is important to expand BDV research in this area,
particularly in BDV-infected hippocampal neurons as it is an
important part of brain.
Recently, human BDV infections have been reported in
China and research into human infections BDV has been conducted
(32–35). BDV is known to result in behavioral
disturbances in mammals, however, its effects on humans is subject
to debate (5). Furthermore, the
present study is the first systematic comparison of different
normalization approaches using RT-qPCR data in BDV-infected primary
rat hippocampal neurons. To validate the appropriate reference
genes, the expressions of 10 commonly used candidate reference
genes were detected and analyzed were detected and analyzed. It was
based on a three-step approach with RT-qPCR validation, selection
of housekeeping miRNAs using computer software, and a proof of
principle study with various miRNA expression. During the RT-qPCR
validation stage, no candidate miRNAs were excluded from subsequent
analysis. Thus, all 10 candidate reference genes were included in
the geNorm, NormFinder, BestKeeper, and comparative Δ-Ct
analysis.
geNorm, NormFinder and BestKeeper analysis did not
recommend the same reference genes for normalization (Table III). This may be due to the
different statistical outputs of the software, namely M-values
obtained from geNorm, variability measurements from NormFinder,
coefficients of correlation from BestKeeper and mean standard
deviations from the Δ-Ct method. The RankAggreg software package
was used to analyze the four different sets of data and combine
these four algorithms to establish a consensus ranking.
Specifically, the brute force method (using the RankAggreg
function) was used to enumerate all possible candidate lists and
then the one with the minimum Spearman foot rule distance was
selected (36). This method output
results in the most stable and least stable reference genes on day
12, however, there may not be consistency in the expression levels
of certain reference genes over time under certain conditions
(22,37). Based on the different normalization
strategies, miR-101a was determined to be the most optimal and
stable reference gene. Furthermore, mir-101a was also demonstrated
to be ideal for normalization of serum microRNA in gastric cancer
patients (38).
There are a number of limitations to the present
study. Firstly, only 10 commonly used candidate housekeeping genes
were analyzed, whereas there may exist more superior combinations
of housekeeping genes for BDV research in BDV infection cell lines.
Secondly, only one cell type was used in vitro (rat cortical
neurons) was investigated for the suitability of reference genes
for RT-qPCR, and RNA extracted from in vivo BDV-infected rat
brains was not analyzed. However, parameters in neuron cultures
have been standardized in the present study, and neuron cultures
are the major cellular targets for BDV in nature, thus, the current
study provides important information to advance BDV research.
In conclusion, housekeeping gene expression levels
were comparatively evaluated for the normalization of miRNAs in BDV
research by RT-qPCR. The combined use of miR-101 and U87 was
assessed as the optimal normalization method for miRNA expression
data from hippocampal neurons infected BDV. Assessment of the
validity of the selected reference genes confirms the suitability
of applying a combination of the most stable reference genes. The
present study provides a method by which more reliable and accurate
gene expression measurements can be obtained, and it has identified
a reliable two gene (miR-101 and U87) normalizer for use in this
context.
Acknowledgements
The present study was supported by the National
Natural Science Foundation of China (grant no. 31300137), the
Medical Scientific Research Project of Chongqing Health Bureau
(grant no. 20142022), the National Key Scientific Program of China
(grant nos. 2009CB918300 and 2012CB910602). The authors would like
to thank the scientific editors at Impactys (www.impactys.com) for editing and proofreading this
manuscript.
References
|
1
|
de la Torre JC: Molecular biology of borna
disease virus: Prototype of a new group of animal viruses. J Virol.
68:7669–7675. 1994.PubMed/NCBI
|
|
2
|
Ludwig H, Bode L and Gosztonyi G: Borna
disease: A persistent virus infection of the central nervous
system. Prog Med Virol. 35:107–151. 1988.PubMed/NCBI
|
|
3
|
Kinnunen PM, Palva A, Vaheri A and
Vapalahti O: Epidemiology and host spectrum of Borna disease virus
infections. J Gen Virol. 94:247–262. 2013. View Article : Google Scholar : PubMed/NCBI
|
|
4
|
Zhang L, Xu MM, Zeng L, Liu S, Liu X, Wang
X, Li D, Huang RZ, Zhao LB, Zhan QL, et al: Evidence for Borna
disease virus infection in neuropsychiatric patients in three
western China provinces. Eur J Clin Microbiol Infect Dis.
33:621–627. 2014. View Article : Google Scholar : PubMed/NCBI
|
|
5
|
Liu X, Bode L, Zhang L, Wang X, Liu S,
Zhang L, Huang R, Wang M, Yang L, Chen S, et al: Health care
professionals at risk of infection with Borna disease
virus-evidence from a large hospital in China (Chongqing). Virol J.
12:392015. View Article : Google Scholar : PubMed/NCBI
|
|
6
|
Gonzalez-Dunia D, Sauder C and de la Torre
JC: Borna disease virus and the brain. Brain Res Bull. 44:647–664.
1997. View Article : Google Scholar : PubMed/NCBI
|
|
7
|
Pletnikov MV, Rubin SA, Moran TH and
Carbone KM: Exploring the cerebellum with a new tool: Neonatal
Borna disease virus (BDV) infection of the rat's brain. Cerebellum.
2:62–70. 2003. View Article : Google Scholar : PubMed/NCBI
|
|
8
|
Gosztonyi G: Natural and experimental
Borna disease virus infections-neuropathology and pathogenetic
considerations. APMIS Suppl. 53–57. 2008. View Article : Google Scholar : PubMed/NCBI
|
|
9
|
Mestdagh P, Feys T, Bernard N, Guenther S,
Chen C, Speleman F and Vandesompele J: High-throughput stem-loop
RT-qPCR miRNA expression profiling using minute amounts of input
RNA. Nucleic Acids Res. 36:e1432008. View Article : Google Scholar : PubMed/NCBI
|
|
10
|
Beaudoin GM III, Lee SH, Singh D, Yuan Y,
Ng YG, Reichardt LF and Arikkath J: Culturing pyramidal neurons
from the early postnatal mouse hippocampus and cortex. Nat Protoc.
7:1741–1754. 2012. View Article : Google Scholar : PubMed/NCBI
|
|
11
|
Bajramovic JJ, Münter S, Syan S, Nehrbass
U, Brahic M and Gonzalez-Dunia D: Borna disease virus glycoprotein
is required for viral dissemination in neuons. J Virol.
77:12222–12231. 2003. View Article : Google Scholar : PubMed/NCBI
|
|
12
|
Bode L, Dürrwald R, Rantam FA, Ferszt R
and Ludwig H: First isolates of infectious human Borna disease
virus from patients with mood disorders. Mol Psychiatry. 1:200–212.
1996.PubMed/NCBI
|
|
13
|
Suberbielle E, Stella A, Pont F, Monnet C,
Mouton E, Lamouroux L, Monsarrat B and Gonzalez-Dunia D: Proteomic
analysis reveals selective impediment of neuronal remodeling upon
Borna disease virus infection. J Virol. 82:12265–12279. 2008.
View Article : Google Scholar : PubMed/NCBI
|
|
14
|
Huang R, Gao H, Zhang L, Jia J, Liu X,
Zheng P, Ma L, Li W, Deng J, Wang X, et al: Borna disease virus
infection perturbs energy metabolites and amino acids in cultured
human oligodendroglia cells. PLoS One. 7:e446652012. View Article : Google Scholar : PubMed/NCBI
|
|
15
|
Zhang L, Liu S, Zhang L, You H, Huang R,
Sun L, He P, Chen S, Zhang H and Xie P: Real-time qPCR identifies
suitable reference genes for Borna disease virus-infected rat
cortical neurons. Int J Mol Sci. 15:21825–21839. 2014. View Article : Google Scholar : PubMed/NCBI
|
|
16
|
Lewin GR and Barde YA: Physiology of the
neurotrophins. Annu Rev Neurosci. 19:289–317. 1996. View Article : Google Scholar : PubMed/NCBI
|
|
17
|
Davoren PA, McNeill RE, Lowery AJ, Kerin
MJ and Miller N: Identification of suitable endogenous control
genes for microRNA gene expression analysis in human breast cancer.
BMC Mol Biol. 9:762008. View Article : Google Scholar : PubMed/NCBI
|
|
18
|
Lardizabal MN, Nocito AL, Daniele SM,
Ornella LA, Palatnik JF and Veggi LM: Reference genes for real-time
PCR quantification of microRNAs and messenger RNAs in rat models of
hepatotoxicity. PLoS One. 7:e363232012. View Article : Google Scholar : PubMed/NCBI
|
|
19
|
Ratert N, Meyer HA, Jung M, Mollenkopf HJ,
Wagner I, Miller K, Kilic E, Erbersdobler A, Weikert S and Jung K:
Reference miRNAs for miRNAome analysis of urothelial carcinomas.
PLoS One. 7:e393092012. View Article : Google Scholar : PubMed/NCBI
|
|
20
|
Liu X, Zhang L, Cheng K, Wang X, Ren G and
Xie P: Identification of suitable plasma-based reference genes for
miRNAome analysis of major depressive disorder. J Affect Disord.
163:133–139. 2014. View Article : Google Scholar : PubMed/NCBI
|
|
21
|
Wang Y, Tang N, Hui T, Wang S, Zeng X, Li
H and Ma J: Identification of endogenous reference genes for
RT-qPCR analysis of plasma microRNAs levels in rats with
acetaminophen-induced hepatotoxicity. J Appl Toxicol. 33:1330–1336.
2013.PubMed/NCBI
|
|
22
|
Langnaese K, John R, Schweizer H, Ebmeyer
U and Keilhoff G: Selection of reference genes for quantitative
real-time PCR in a rat asphyxial cardiac arrest model. BMC Mol
Biol. 9:532008. View Article : Google Scholar : PubMed/NCBI
|
|
23
|
Kim I, Yang D, Tang X and Carroll JL:
Reference gene validation for qPCR in rat carotid body during
postnatal development. BMC Res Notes. 4:4402011. View Article : Google Scholar : PubMed/NCBI
|
|
24
|
Vandesompele J, De Preter K, Pattyn F,
Poppe B, Van Roy N, De Paepe A and Speleman F: Accurate
normalization of real-time quantitative RT-PCR data by geometric
averaging of multiple internal control genes. Genome Biol.
3:RESEARCH00342002. View Article : Google Scholar : PubMed/NCBI
|
|
25
|
Zhao C, Zha Y, Wu X, Chen L, Shi J and Cui
L: The quantification of ADAMTS4 and 8 expression and selection of
reference genes for quantitative real-time PCR analysis in
myocardial infarction. Biomed Pharmacother. 65:555–559. 2011.
View Article : Google Scholar : PubMed/NCBI
|
|
26
|
Silver N, Best S, Jiang J and Thein SL:
Selection of housekeeping genes for gene expression studies in
human reticulocytes using real-time PCR. BMC Mol Biol. 7:332006.
View Article : Google Scholar : PubMed/NCBI
|
|
27
|
Pfaffl MW, Tichopad A, Prgomet C and
Neuvians TP: Determination of stable housekeeping genes,
differentially regulated target genes and sample integrity:
BestKeeper-Excel-based tool using pair-wise correlations.
Biotechnol Lett. 26:509–515. 2004. View Article : Google Scholar : PubMed/NCBI
|
|
28
|
Zhai A, Qian J, Kao W, Li A, Li Y, He J,
Zhang Q, Song W, Fu Y, Wu J, et al: Borna disease virus encoded
phosphoprotein inhibits host innate immunity by regulating miR-155.
Antiviral Res. 98:66–75. 2013. View Article : Google Scholar : PubMed/NCBI
|
|
29
|
Kong W, He L, Coppola M, Guo J, Esposito
NN, Coppola D and Cheng JQ: MicroRNA-155 regulates cell survival,
growth, and chemosensitivity by targeting FOXO3a in breast cancer.
J Biol Chem. 285:17869–17879. 2010. View Article : Google Scholar : PubMed/NCBI
|
|
30
|
Lu C, Huang X, Zhang X, Roensch K, Cao Q,
Nakayama KI, Blazar BR, Zeng Y and Zhou X: miR-221 and miR-155
regulate human dendritic cell development, apoptosis, and IL-12
production through targeting of p27kip1, KPC1, and SOCS-1. Blood.
117:4293–4303. 2011. View Article : Google Scholar : PubMed/NCBI
|
|
31
|
Lu J, Getz G, Miska EA, Alvarez-Saavedra
E, Lamb J, Peck D, Sweet-Cordero A, Ebert BL, Mak RH, Ferrando AA,
et al: MicroRNA expression profiles classify human cancers. Nature.
435:834–838. 2005. View Article : Google Scholar : PubMed/NCBI
|
|
32
|
Liu X, Yang Y, Zhao M, Bode L, Zhang L,
Pan J, Lv L, Zhan Y, Liu S, Zhang L, et al: Proteomics reveal
energy metabolism and mitogen-activated protein kinase signal
transduction perturbation in human Borna disease virus
Hu-H1-infected oligodendroglial cells. Neuroscience. 268:284–296.
2014. View Article : Google Scholar : PubMed/NCBI
|
|
33
|
Liu X, Zhao L, Yang Y, Bode L, Huang H,
Liu C, Huang R, Zhang L, Wang X, Zhang L, et al: Human borna
disease virus infection impacts host proteome and histone lysine
acetylation in human oligodendroglia cells. Virology 464–465.
196–205. 2014. View Article : Google Scholar
|
|
34
|
Li D, Lei Y, Deng J, Zhou C, Zhang Y, Li
W, Huang H, Cheng S, Zhang H, Zhang L, et al: Human but not
laboratory Borna disease virus inhibits proliferation and induces
apoptosis in human oligodendrocytes in vitro. PLoS One.
8:e666232013. View Article : Google Scholar : PubMed/NCBI
|
|
35
|
Li Q, Wang Z, Zhu D, Xu M, Chen X, Peng D,
Iwata Y and Xie P: Detection and analysis of Borna disease virus in
Chinese patients with neurological disorders. Eur J Neurol.
16:399–403. 2009. View Article : Google Scholar : PubMed/NCBI
|
|
36
|
Pihur V and Datta S and Datta S:
RankAggreg, an R package for weighted rank aggregation. BMC
Bioinformatics. 10:622009. View Article : Google Scholar : PubMed/NCBI
|
|
37
|
Lilly ST, Drummond RS, Pearson MN and
MacDiarmid RM: Identification and validation of reference genes for
normalization of transcripts from virus-infected Arabidopsis
thaliana. Mol Plant Microbe Interact. 24:294–304. 2011. View Article : Google Scholar : PubMed/NCBI
|
|
38
|
Song J, Bai Z, Han W, Zhang J, Meng H, Bi
J, Ma X, Han S and Zhang Z: Identification of suitable reference
genes for qPCR analysis of serum microRNA in gastric cancer
patients. Dig Dis Sci. 57:897–904. 2012. View Article : Google Scholar : PubMed/NCBI
|