Introduction
Ovarian cancer remains a leading cause of death in
women, with a 2% lifetime risk of disease and only a 40% 5-year
survival rate. In the United Kingdom, there were over 7,000 new
cases of ovarian cancer registered in 2011 (1–3). To
date, there is no reliable screening programme, and therefore
diagnosis, which requires a high index of suspicion, is difficult.
The overall mortality remains high despite newer treatments, since
it presents commonly in advanced stages: Therefore, adjuvant
treatments post-surgery are almost always required (4). Risk factors for ovarian cancer have
been identified, although the initiating mechanism, the origin and
the pathogenesis of the disease are poorly understood, and have yet
to be elucidated (5).
Uncontrolled cell proliferation, loss of contact
inhibition and suppressed programmed cell death associated with
gene mutation underlie cancer progression, and this has formed the
basis of new therapies targeting ovarian cancer (6). Quantitative polymerase chain reaction
(qPCR) is an accepted, sensitive technique of quantifying mRNA in
biological samples for gene expression analysis (7,8).
However, it is not without problems, which may affect the quality
of the qPCR experiments. These problems include sample type, sample
size, sample collection and preparation and time taken for tissue
processing (9). Various
fluctuations take place during a qPCR experiment that may result in
variations in mRNA expression levels in different samples. These
fluctuations are due to genuine biological and mechanical
discrepancies, and may lead to biased results, which affect the
quality of the qPCR experiments. Previously, qPCR experiments were
performed using traditional reference genes, such as β-actin
(ACTB), glyceraldehyde-3-phosphate dehydrogenase (GAPDH),
β-microglobulin (B2M) or 18S ribosomal RNA (18S rRNA) without
verification, which also led to unreliable and irreproducible
results (10). To avoid this, a
definitive method of normalisation was chosen to control for this
disparity (11,12). Different strategies have been used
for normalising qPCR data, although the use of reference genes is
the most common method for reducing and controlling the variation
in these RNA levels (8).
Reference genes, previously known as housekeeping
genes, are genes that are required for the maintenance of
elementary constitutional functions important for the survival of a
cell (13). It is important that
the reference genes used in qPCR experiments have expression levels
that are close to constant across the different tissues being
analysed, and the selected reference genes should be validated for
each qPCR experiment, since normalisation using numerous
meticulously validated reference genes has been shown to result in
vastly more accurate results (8,13–15).
The suitability of reference genes for the purpose of
normalisation, in studying the relative quantification of target
genes in gene expression studies in ovarian tissues, including
borderline tumour and ovarian cancers, has not hitherto been
adequately studied.
The aim of the present study was to select the most
suitable reference genes from a set of five probable reference
genes for gene expression studies in normal ovarian tissues,
borderline ovarian tissues and ovarian cancer tissues, rather than
use the traditional reference genes. The reference genes [ACTB,
GAPDH, β-glucuronidase (GUSB), hypoxanthine phosphoribosyl
transferase-1 (HPRT1) and B2M] were selected on the basis of their
known expression and their common use as reference genes in cancer
studies (10,14,16)
(Table I). They were investigated
to identify the ideal tissue-specific genes, since no generic
reference gene exists as several of the most commonly used ones are
diverse, resulting in different expression variability under
different environmental conditions (17–19).
 | Table I.Summary of the five evaluated
candidate reference genes. |
Table I.
Summary of the five evaluated
candidate reference genes.
| Symbol | Gene name (assay
ID) | Location on
chromosome | Description | Primer sequence
(5′→3′) |
|---|
| ACTB | β-actin | 7q22 | Cytoskeletal
structural protein | F:
ATGTGGCCGAGGACTTTGATT |
|
|
|
|
| R:
AGTGGGGTGGCTTTTAGGATG |
| GUSB |
β-D-glucuronidase | 7q21.11 |
Glycosaminoglycan-degrading hydrolase | F:
TGGTGCTGAGGATTGG |
|
|
|
|
| R:
TGTTGATGGCGATAGTGA |
| B2M |
β-2-microglobulin | 15q21 | β-chain of major
histocompatibility complex class I molecules | F:
TGACTTTGTCACAGCCCAAGATA |
|
|
|
|
| R:
CGGCATCTTCAAACCTCCA |
| GAPDH |
Glyceraldehyde-3-phosphate | 12p13 | Oxidoreductase in
glycolysis and gluconeogenesis dehydrogenase | F:
TCTCCTCTGACTTCAACAGCGAC |
|
|
|
|
| R:
CCCTGTTGCTGTAGCCAAATTC |
| HPRT1 | HPRT1 (hypoxanthine
guanine phosphoribosyl transferase 1) | Xq26.1 | Generation of
purine nucleotides | F:
TGACACTGGCAAAACAATGCA |
|
|
|
|
| R:
GGTCCTTTTCACCAGCAAGCT |
Materials and methods
Informed consent
Informed consent was obtained from the subjects for
use of their tissues in the present study. A written statement
regarding the study was provided, informing the participants of the
study and its anonymity.
Tissue samples
A total of 15 fresh frozen ovarian tissue samples
were selected for the present study. Ovarian cancer tissues (n=5)
and borderline ovarian tumours (n=5) were obtained from patients
undergoing primary surgery for suspected ovarian cancer. Normal
ovarian epithelial tissue samples (n=5) were obtained from patients
undergoing oophorectomy as part of an operation under benign
gynaecological conditions (uterine fibroids, uterine prolapse,
endometriosis and benign ovarian cysts). All the ovarian cancer
tissue samples were serous adenocarcinoma, and the patients had not
received any previous treatment; all the normal ovarian tissue
samples were confirmed to be free of any disease. The cancers were
defined according to the International Federation of Gynecology and
Obstetrics (FIGO) staging system (20). All tissue samples were collected
from the Royal Derby Hospital, Derby, United Kingdom after
obtaining informed consent from each patient. Ethical approval was
sought and obtained from the National Health Service/Health and
Social Care (NHS/HSC) Research Ethics Committee and the local
Research and Development (R&D) committee of Derby Teaching
Hospitals NHS Foundation Trust.
The fresh tissue samples were harvested and
snap-frozen immediately at −80°C in liquid nitrogen prior to use in
tissue analyses. The samples were homogenised using mechanical
disruption; 30 g ovarian tissue was disrupted by dividing into
small fragments with tweezers and a scalpel, and subsequently added
to Lysing Matrix D (MP Biomedicals, Santa Ana, CA, USA) and
homogenised using tubes pre-filled with ceramic beads containing
600 µl Buffer RLT (miRNeasy Mini Kit; Qiagen Gmbh, Hilden, Germany)
to which 6 ml of β-mercaptoethanol was added. Samples were
homogenised using an MP Fast-Prep-24 homogeniser (MP Biomedicals)
and run at a speed of 6.0 m/sec for 40 sec. They were then
centrifuged at 16,000 × g for 3 min at 4°C, and RNA extraction was
continued according to the manufacturer's protocols with the
extracted total RNA (totRNA) eluted in RNase-free water.
RNA extraction, quantification and
integrity
totRNA was extracted from the ovarian tissue samples
using commercial spin columns (miRNeasy Mini Kit; Qiagen GmbH)
according to the manufacturer's protocol. The concentration and
purity of the extracted totRNA representing each sample was
measured by spectrometry using a Nanodrop ND-1000 spectrophotometer
(Thermo Fisher Scientific, Inc., Wilmington, DE, USA) through
absorbance ratio measurements of A260/A280.
The quality and integrity was assessed by conventional agarose gel
electrophoresis (www.thermofisher.com/uk/en/home/references/ambion-tech-support/rna-isolation/tech-notes/is-your-rna-intact.html).
RT-qPCR
First-strand complementary DNA (cDNA) was
synthesised using a High Capacity® cDNA RT kit (Life
Technologies; Thermo Fisher Scientific, Waltham, MA, USA) following
the manufacturer's protocol. Each RT reaction was allowed to
proceed in a final volume of 20 µl containing 10 µl RNA at a
concentration of 120 ng/µl (1,200 ng totRNA), and the incubations
were performed in duplicate. Synthesised cDNA was stored
immediately at −80°C when not used for qPCR.
Using the synthesised cDNA as template, qPCR
reactions were performed in a final volume of 20 µl to determine
the expression levels of the five reference genes selected. These
experiments were performed in triplicate, with a negative and a
no-template control, using the Chromo4™ Real-Time Detection system
(Bio-Rad Laboratories, Inc., Hercules, CA, USA) attached to a DNA
Engine® Peltier Thermal Cycler (Bio-Rad Laboratories,
Inc.). The analysed genes were sequence-specific TaqMan®
probes, each composed of an oligonucleotide labelled with a
fluorescent dye plus a quencher. The respective TaqMan®
assay descriptions are shown in Table
I. A master mix for each reference gene of interest was first
prepared using TaqMan® inventoried Assays-on-Demand
probes (Life Technologies; Thermo Fisher Scientific), and the qPCR
reactions were performed using a qPCR programme of 40 cycles of
95°C for 10 min; 95°C for 15 sec and 60°C for 1 min, in a final
volume of 20 µl comprising 18 µl Master Mix and 2 µl cDNA
template.
PCR efficiency
To determine the performance of the qPCR
TaqMan® assays, the PCR efficiency of each assay was
assessed. A five-point 5-fold dilution series was generated from
the cDNA of the tissue samples, and these were run using the
standard qPCR protocol described above. The slope, intercept and
r2 (coefficient of determination) of the standard curves
were calculated, and the qPCR efficiency of each TaqMan®
assay was determined from the slopes of the standard curves using
the formula: Efficiency=101/−slope −1.
Analysis of reference gene expression
stability
The cycle threshold (Cq) is the cycle
number at which the fluorescence generated during a qPCR reaction
crosses the fluorescence threshold of detection, and this
fluorescence greatly exceeds the background fluorescence (21). The threshold cycle is inversely
proportional to the amount of original RNA template present in the
sample.
Cq values obtained from the qPCR
experiments were exported into the GeNex software (MultiD Analyses
AB, Gothenburg, Sweden) made up of the geNorm and the Normfinder
algorithms, two theoretically different expression ranking
stability ranking algorithms based on the principle that ideal
reference genes would have similar expression ratios in all
experimental environments indicating their expression stability,
and none is co-regulated to avoid unreliable results (17,22).
The geNorm algorithm ranks the reference genes
according to their M-value (expression stability measure), which is
the average pairwise variation of a gene compared with all other
tested reference genes, gradually eliminating the gene with the
highest M-value that has met the M-value criteria to allow ranking
of the tested genes according to this value, with lower values
exhibiting higher expression stabilities (17,22).
The NormFinder ranks the set of candidate reference
genes according to their expression stability values (SVs) using a
combination of intra- and intergroup variation, and this gives an
optimum (pair of) reference gene(s) (23,24).
The three genes that revealed the highest stability were considered
the best combination of reference genes for use in qPCR
experiments.
Results
Tissue samples
The ovarian cancers were staged and graded according
to the FIGO staging system. One was stage 3a, one was stage 3b and
three were stage 3c. There were four grade 3 cancers and one grade
2 ovarian cancer.
RNA purity and quality
The totRNA yield from the ovarian tissue samples
ranged from 25.2 to 53.9 µg/µl, and the spectrophotometric
experiments reported RNA with absorbance ratios
(A260/A280) of 2.03±0.02. This indicated that
the totRNAs were of adequate quality and generally free of DNA
contamination. Conventional 1% agarose gel electrophoresis did not
reveal any RNA degradation prior to use for reverse
transcription.
PCR efficiency
PCR efficiency of the assays calculated from the
slope of the standard curves of the serial dilutions ranged from 94
to 99% with a range of correlation coefficients (r2) of
0.958 to 0.999, demonstrating a comparable performance of the PCR
assays (Table II).
| Table II.r2 correlation
coefficients, signifying how well the data fitted the standard
curve. |
Table II.
r2 correlation
coefficients, signifying how well the data fitted the standard
curve.
| Gene | Slope | Assay efficiency
(%) | Correlation
coefficient (r2) |
|---|
| GAPDH | −3.455 | 94.7 | 0.998 |
| ACTB | −0.343 | 99.1 | 0.999 |
| GUSB | −0.365 | 98.2 | 0.984 |
| HPRT1 | −0.591 | 96.3 | 0.958 |
| B2M | −0.405 | 96.6 | 0.972 |
Expression levels of candidate
reference genes
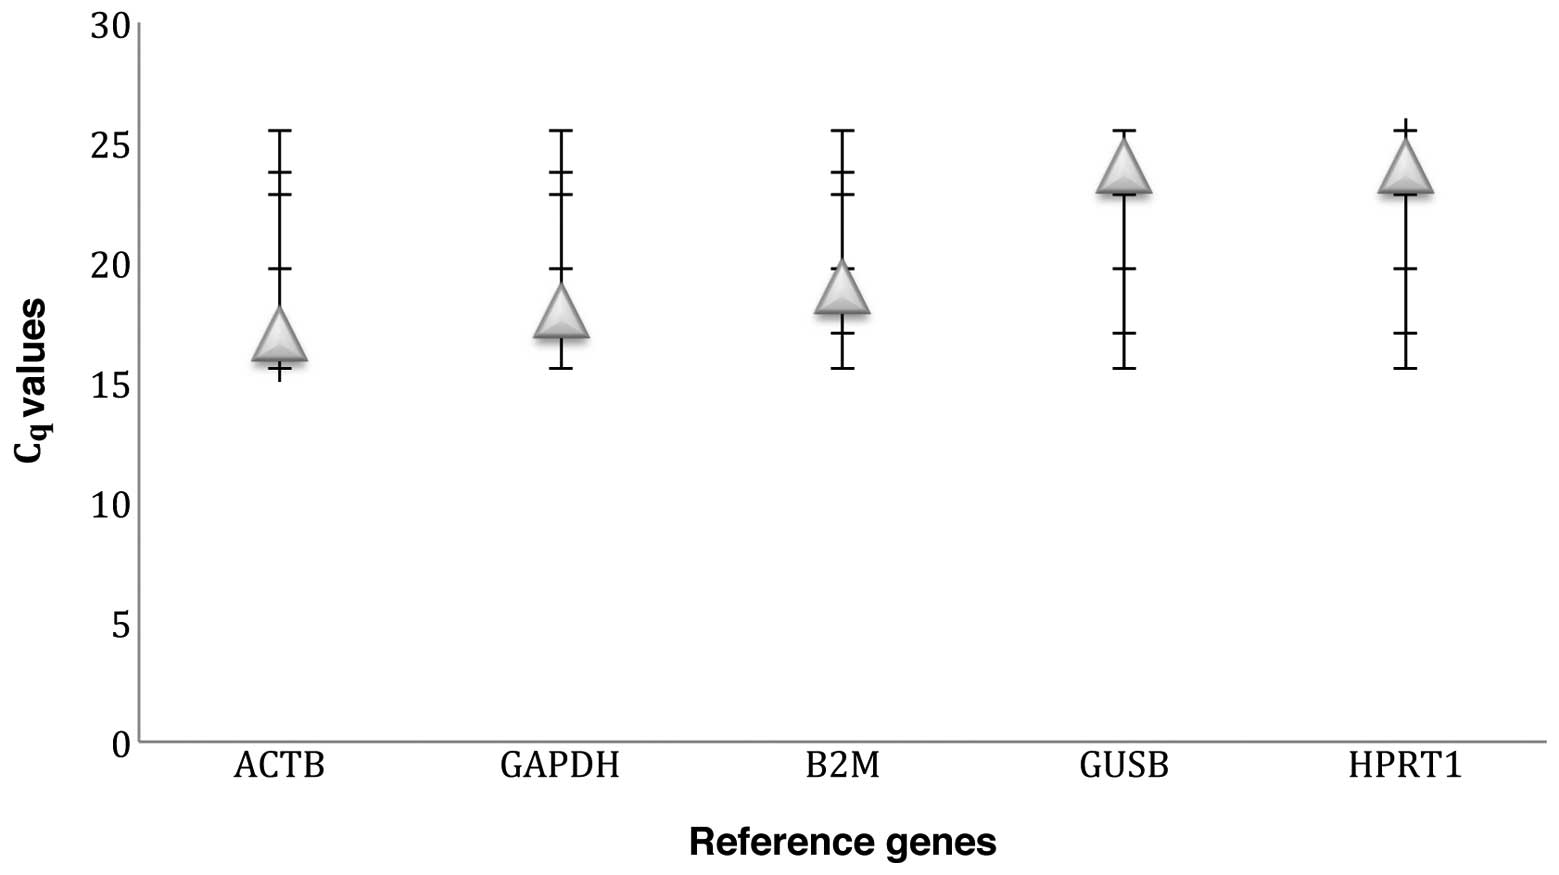
All the five selected candidate reference genes were
expressed in all tissue samples, with various Cq values
ranging from 15 to 26 cycles, demonstrating a wide range of
expression (Fig. 1). ACTB, GAPDH
and B2M were highly expressed, with average Cq values of
20 and below, whereas GUSB and HPRT1 were moderately expressed,
with average Cq values of 24 (Fig. 1).
Stability ranking of the candidate
reference genes
To determine the most stable reference genes across
the ovarian cancer tissue samples (cancer, borderline cancer and
normal), the expression stabilities of the reference genes were
investigated by exporting the qPCR data into the GeNex software,
and gene stability ranking was conducted using the two reference
gene stability analysis algorithms, geNorm and NormFinder.
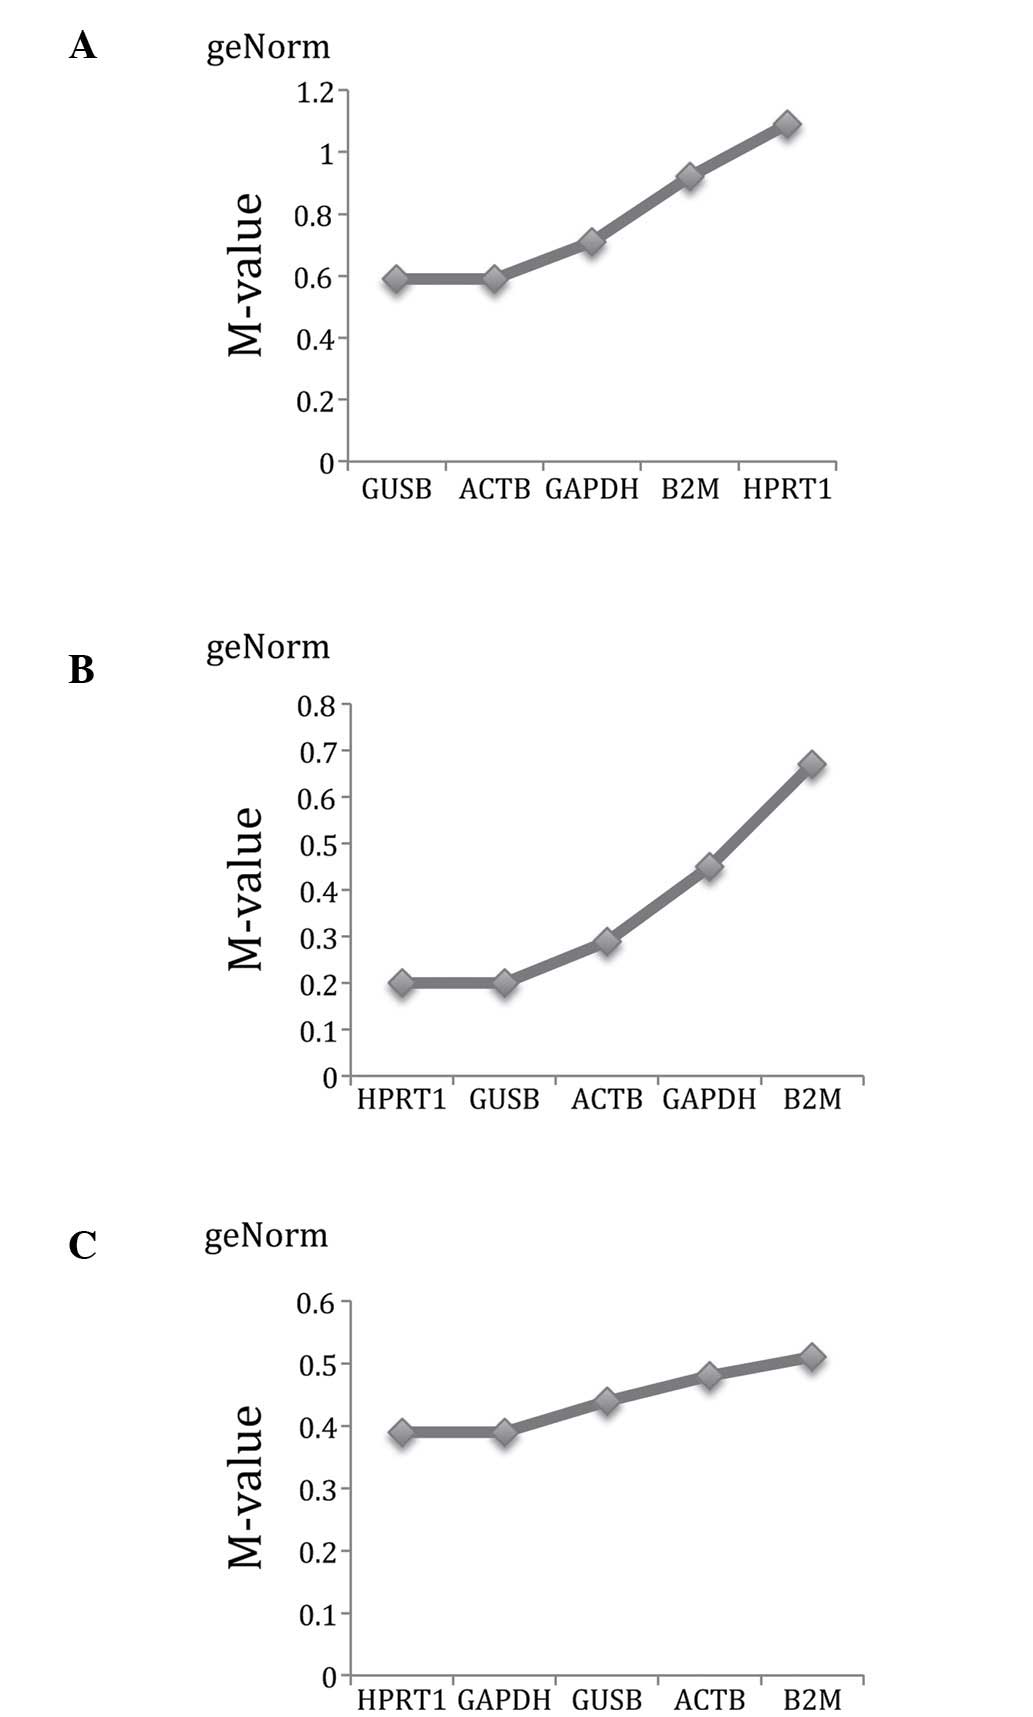
geNorm ranking
Using geNorm (Table
III and Fig. 2), the five
reference genes exhibited M values <1.5 in all the ovarian
tissue types. The two best reference genes in the ovarian cancer
tissues selected were GUSB and ACTB, both with the lowest M value
of 0.59. (Fig. 2A). The third best
gene was GAPDH, with an M value of 0.71. HPRT1 and GUSB were the
most stable reference genes in ovarian borderline tumours, with an
M value of 0.20 (Fig. 2B). The
third most stable gene was ACTB with an M value of 0.29. HPRT1 and
GAPDH were ranked as the most stable in normal ovarian tissues,
with an M value of 0.39 (Fig. 2C).
The third most stable gene was GUSB, with an M value of 0.44.
| Table III.Stability ranking of the reference
genes in all ovarian tissues calculated by geNorm and
normfinder. |
Table III.
Stability ranking of the reference
genes in all ovarian tissues calculated by geNorm and
normfinder.
|
| geNorm |
| NormFinder |
|---|
|
|
|
|
|
|---|
| Rank | Cancer | M | Borderline | M | Normal | M | Cancer | SV | Borderline | SV | Normal | SV |
|---|
| 1 | GUSB | 0.59 | HPRT1 | 0.20 | HPRT1 | 0.39 | ACTB | 0.03 | HPRT1 | 0.22 | GUSB | 0.16 |
| 2 | ACTB | 0.59 | GUSB | 0.20 | GAPDH | 0.39 | GUSB | 0.30 | GUSB | 0.22 | HPRT1 | 0.34 |
| 3 | GAPDH | 0.71 | ACTB | 0.29 | GUSB | 0.44 | HPRT1 | 0.30 | GAPDH | 0.39 | ACTB | 0.34 |
| 4 | B2M | 0.92 | GAPDH | 0.45 | ACTB | 0.48 | GAPDH | 1.17 | ACTB | 0.47 | GAPDH | 0.46 |
| 5 | HPRT1 | 1.09 | B2M | 0.67 | B2M | 0.51 | B2M | 1.22 | B2M | 0.99 | B2M | 0.48 |
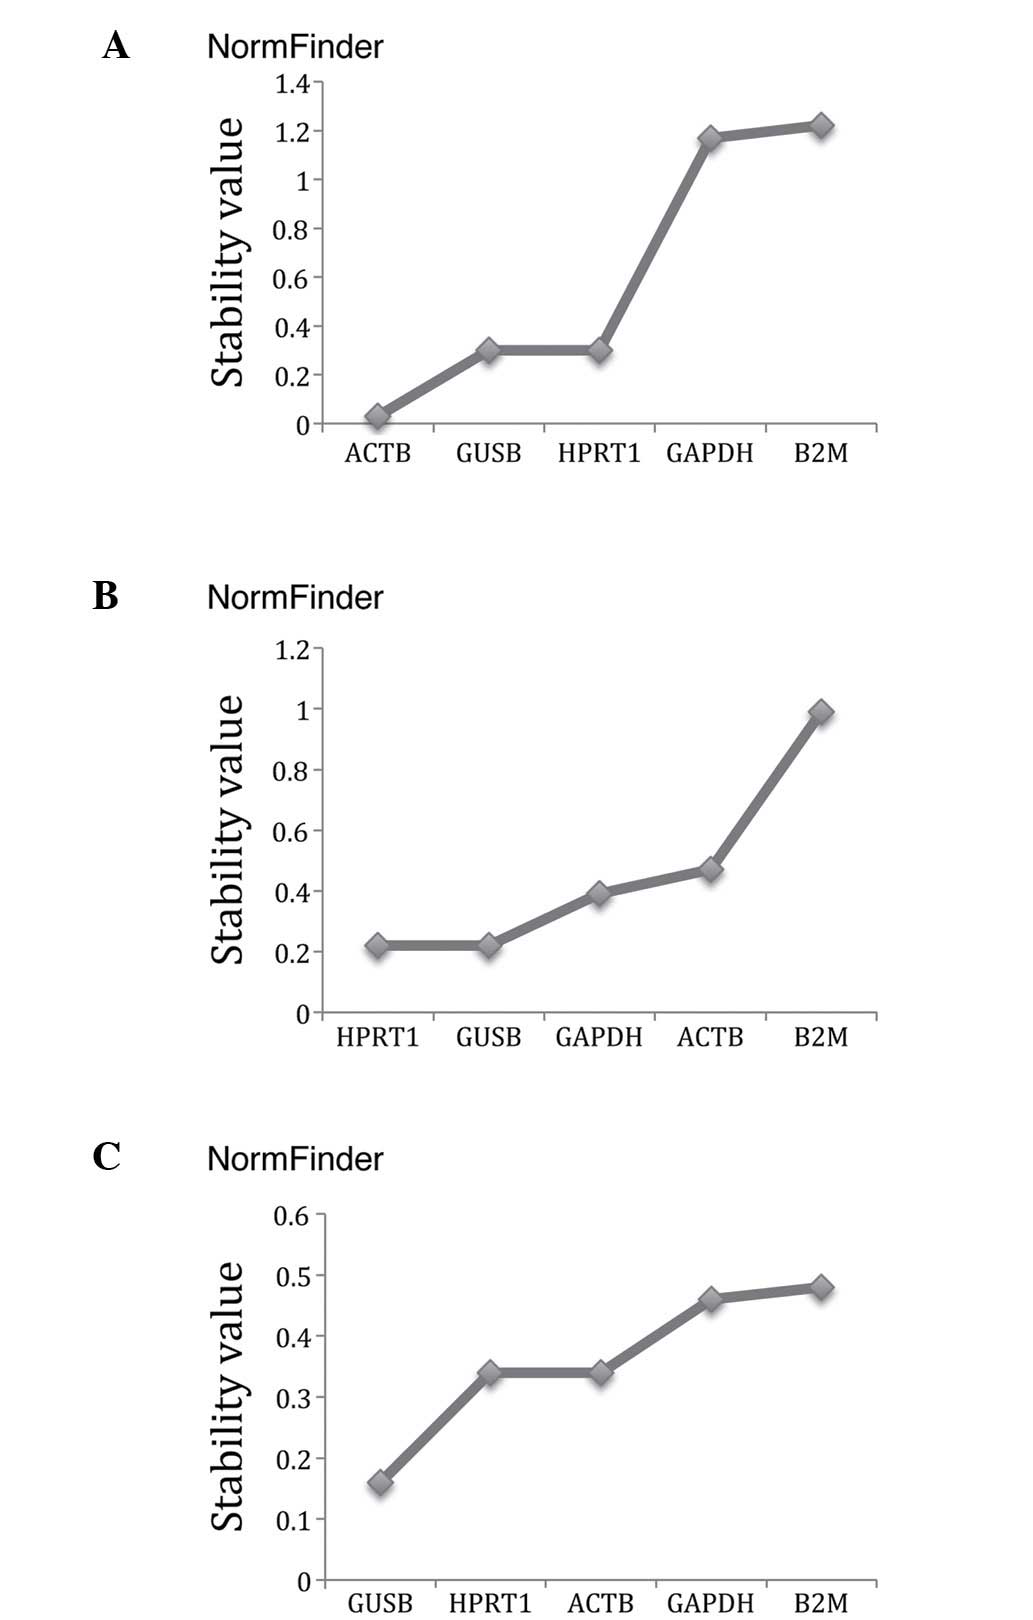
NormFinder ranking
NormFinder (Table
III, Fig. 3) ranked ACTB as
the most stable gene out of the set of five candidate reference
genes for use in ovarian cancer tissues, and the best combination
of two genes were GUSB and HPRT1. In borderline tumours, HPRT1 was
identified as the most stably expressed gene, and the best
combination of two genes were HPRT1 and GUSB. In normal ovarian
tissues, GUSB was recommended as the optimum reference gene, and
the most optimum pair of reference genes was HPRT1 and ACTB
(Fig. 3).
Discussion
Reference gene expression is the recommended method
of normalising PCR data (25).
However, there is no ideal reference gene, i.e. a reference gene
whose expression is constant across all cells and tissues.
‘Classical’ or ‘universal’ reference genes, including GAPDH and
ACTB, have been demonstrated to be unsuitable for use as reference
genes for normalisation in all gene expression studies, as their
expression levels have been found to fluctuate in different
experimental settings and different tissues (26). Selection of a particular gene, or
set of genes, without verification will affect the reproducibility,
reliability, accuracy and quality of gene expression analysis. It
is therefore very important to carefully select thoroughly
validated reference genes prior to performing qPCR experiments.
This is one of the recommendations of the minimum information for
publication of quantitative real-time PCR experiments (MIQE)
guidelines (also including quantification of totRNA to ensure that
the identical RNA quantity is used, purity and quality assessment),
which stipulates how qPCR experiments should be performed (25).
In the present study, totRNA used for RT was not
treated with DNAse, and the results revealed that the totRNA used
was almost pure. Agarose gel electrophoresis demonstrated that
little, or no, totRNA degradation had occurred. Although there was
a slight smeared RNA appearance, there were sharp 28S and 18S rRNA
bands, with a >2:1 ratio of high-quality RNA exhibited. RNA
degradation was prevented by taking great care during the whole
process, collecting and immediately snap-freezing the ovarian
tissue samples in liquid nitrogen, and storing them at −80°C,
adding β-mercaptoethanol (BME) to the lysis buffer to kill the
RNases and help sample stabilisation during extraction, and
dissolving the RNA in diethylpyrocarbonate-treated water. Also, on
extracting the samples from the freezer, they were not allowed to
thaw and were homogenised completely quickly in BME.
An ideal PCR efficiency should be between 90 and
100%, since poor efficiency can result in poor quantification. The
results of the present study demonstrated that the PCR efficiency
of all the reference genes revealed proportionate performance. This
is an important contributor to the proper design of the assays.
GeNex software was used to analyse the data, as it is comprises two
algorithms, geNorm and NormFinder, which have been identified to be
two of the best options for analysing data and recommending the
optimum reference genes required for normalisation of qPCR data
(27,28).
The most stable reference genes generated from
geNorm and NormFinder software applications revealed a high level
of similarity; however, there were subtle disparities in the rank
order. This is an accepted outcome due to the different analytical
pathways of determining stability by the two algorithms (29,30).
On combining the two algorithms, GUSB, ACTB and HPRT1 were revealed
to be common to the two programmes, were ranked as the most stable,
and were selected as the three most suitable reference genes of
choice for normalisation in gene expression studies in ovarian
cancer tissues, ovarian borderline tumours and normal ovarian
tissues.
One limitation of the present study was that only
five candidate reference genes were evaluated: This might be a
limitation of the study design, although it is possible that, even
if a larger panel of possible genes were analysed, the observations
would be supported.
To the best of our knowledge, this is the first
study looking at the selection of a set of candidate reference
genes for normalisation in gene expression studies in different
ovarian tissue disease states. The present study suggested that
GUSB, ACTB and HPRT1 are the most stable reference genes of choice,
and this is important for the investigation of gene expression in
different ovarian tissues.
Acknowledgements
We would like to thank Dr Ben White, Ave Warren and
Rebecca Tarbox, all of the Division of Medical Sciences and
Graduate Entry Medicine, School of Medicine, The University of
Nottingham, Royal Derby Hospital, Derby, for their assistance with
the experiments and advice during the course of this research.
Glossary
Abbreviations
Abbreviations:
|
ACTB
|
β-actin
|
|
B2M
|
β-microglobulin
|
|
BME
|
β-mercaptoethanol
|
|
Cq
|
cycle threshold
|
|
FIGO
|
International Federation of Gynecology
and Obstetrics
|
|
GAPDH
|
glyceraldehyde-3-phosphate
dehydrogenase
|
|
GUSB
|
β-glucuronidase
|
|
HPRT1
|
hypoxanthine phosphoribosyl
transferase-1
|
|
M-value
|
expression stability measure
|
|
MIQE
|
minimum information for publication of
quantitative real-time PCR experiments
|
|
NHS/HSC
|
National Health Service/Health and
Social care
|
|
qPCR
|
quantitative polymerase chain
reaction
|
|
r2
|
coefficient of determination
|
|
RT
|
reverse transcription
|
|
rRNA
|
ribosomal RNA
|
|
SV
|
stability value
|
|
totRNA
|
total RNA
|
References
|
1
|
Ferlay J, Soerjomataram I, Ervik M,
Dikshit R, Eser S, Mathers C, Rebelo M, Parkin DM, Forman D and
Bray F: GLOBOCAN 2012 v1.0, cancer incidence and mortality
worldwide: IARC Cancerbase no. 11. Lyon, France: International
Agency for Research on Cancer; 2013
|
|
2
|
National Cancer Intelligence Network, .
Cancer e-Atlas. http://www.ncin.org.uk/cancer_information_tools/eatlas/accessed
January 2014.
|
|
3
|
Cancer Statistics Registrations, . England
(Series MB1): No. 43. 2012.
|
|
4
|
Nossov V, Amneus M, Su F, Lang J, Janco
JMT, Reddy ST and Farias-Eisner R: The early detection of ovarian
cancer: From traditional methods to proteomics. Can we really do
better than serum CA-125? Am J Obstet Gynecol. 199:215–223.
2008.PubMed/NCBI
|
|
5
|
Kurman RJ and Shih IeM: The origin and
pathogenesis of epithelial ovarian cancer: A proposed unifying
theory. Am J Surg Pathol. 34:433–443. 2010. View Article : Google Scholar : PubMed/NCBI
|
|
6
|
Evan GI and Vousden KH: Proliferation,
cell cycle and apoptosis in cancer. Nature. 411:342–348. 2001.
View Article : Google Scholar : PubMed/NCBI
|
|
7
|
Bustin SA: Absolute quantification of mRNA
using real-time reverse transcription polymerase chain reaction
assays. J Mol Endocrinol. 25:169–193. 2000. View Article : Google Scholar : PubMed/NCBI
|
|
8
|
Huggett J, Dheda K, Bustin S and Zumla A:
Real-time RT-PCR normalisation; Strategies and considerations.
Genes Immun. 6:279–284. 2005. View Article : Google Scholar : PubMed/NCBI
|
|
9
|
Bustin SA: Tenth annual nucleic acid-based
technologies: Time to stop and think. Washington, DC, USA, 24–26
June, 2002. Expert Rev Mol Diagn. 2:405–408. 2002. View Article : Google Scholar : PubMed/NCBI
|
|
10
|
Fu J, Bian L, Zhao L, Dong Z, Gao X, Luan
H, Sun Y and Song H: Identification of genes for normalization of
quantitative real-time PCR data in ovarian tissues. Acta Biochim
Biophys Sin (Shanghai). 42:568–574. 2010. View Article : Google Scholar : PubMed/NCBI
|
|
11
|
Dheda K, Huggett JF, Bustin SA, Johnson
MA, Rook G and Zumla A: Validation of housekeeping genes for
normalizing RNA expression in real-time PCR. Biotechniques.
37:112–119. 2004.PubMed/NCBI
|
|
12
|
Schmittgen TD and Zakrajsek BA: Effect of
experimental treatment on housekeeping gene expression: Validation
by real-time, quantitative RT-PCR. J Biochem Biophys Methods:.
46:69–81. 2000. View Article : Google Scholar : PubMed/NCBI
|
|
13
|
Eisenberg E and Levanon EY: Human
housekeeping genes, revisited. Trends Genet. 29:569–574. 2013.
View Article : Google Scholar : PubMed/NCBI
|
|
14
|
Li YL, Ye F, Hu Y, Lu WG and Xie X:
Identification of suitable reference genes for gene expression
studies of human serous ovarian cancer by real-time polymerase
chain reaction. Anal Biochem. 394:110–116. 2009. View Article : Google Scholar : PubMed/NCBI
|
|
15
|
Pfaffl MW: Quantification strategies in
real-time PCR. AZ of quantitative PCR. 1:89–113. 2004.
|
|
16
|
Ohl F, Jung M, Xu C, Stephan C, Rabien A,
Burkhardt M, Nitsche A, Kristiansen G, Loening SA, Radonić A and
Jung K: Gene expression studies in prostate cancer tissue: Which
reference gene should be selected for normalization? J Mol Med.
83:1014–1024. 2005. View Article : Google Scholar : PubMed/NCBI
|
|
17
|
Vandesompele J, De Preter K, Pattyn F,
Poppe B, Van Roy N, De Paepe A and Speleman F: Accurate
normalization of real-time quantitative RT-PCR data by geometric
averaging of multiple internal control genes. Genome Biol.
3:RESEARCH00342002. View Article : Google Scholar : PubMed/NCBI
|
|
18
|
Radonić A, Thulke S, Mackay IM, Landt O,
Siegert W and Nitsche A: Guideline to reference gene selection for
quantitative real-time PCR. Biochem Biophys Res Commun.
313:856–862. 2004. View Article : Google Scholar : PubMed/NCBI
|
|
19
|
Bustin SA and Nolan T: Pitfalls of
quantitative real-time reverse-transcription polymerase chain
reaction. J Biomol Tech. 15:155–166. 2004.PubMed/NCBI
|
|
20
|
Prat J: FIGO Committee on Gynecologic
Oncology: Staging classification for cancer of the ovary, fallopian
tube, and peritoneum. Int J Gynaecol Obstet. 124:1–5. 2014.
View Article : Google Scholar : PubMed/NCBI
|
|
21
|
Tan SC, Carr CA, Yeoh KK, Schofield CJ,
Davies KE and Clarke K: Identification of valid housekeeping genes
for quantitative RT-PCR analysis of cardiosphere-derived cells
preconditioned under hypoxia or with prolyl-4-hydroxylase
inhibitors. Mol Biol Rep. 39:4857–4867. 2012. View Article : Google Scholar : PubMed/NCBI
|
|
22
|
Żyżyńska-Granica B and Koziak K:
Identification of suitable reference genes for real-time PCR
analysis of statin-treated human umbilical vein endothelial cells.
PLoS One. 7:e515472012. View Article : Google Scholar : PubMed/NCBI
|
|
23
|
Andersen CL, Jensen JL and Ørntoft TF:
Normalization of real-time quantitative reverse transcription-PCR
data: A model-based variance estimation approach to identify genes
suited for normalization, applied to bladder and colon cancer data
sets. Cancer Res. 64:5245–5250. 2004. View Article : Google Scholar : PubMed/NCBI
|
|
24
|
Saha P and Blumwald E: Assessing reference
genes for accurate transcript normalization using quantitative
real-time PCR in pearl millet (Pennisetum glaucum (L.) R. Br). PLoS
One. 9:e1063082014. View Article : Google Scholar : PubMed/NCBI
|
|
25
|
Bustin SA, Benes V, Garson JA, Hellemans
J, Huggett J, Kubista M, Mueller R, Nolan T, Pfaffl MW, Shipley GL,
et al: The MIQE guidelines: Minimum information for publication of
quantitative real-time PCR experiments. Clin Chem. 55:611–622.
2009. View Article : Google Scholar : PubMed/NCBI
|
|
26
|
Radonic A, Thulke S, Mackay IM, Landt O,
Siegert W and Nitsche A: Guideline to reference gene selection for
quantitative realtime PCR. Biochem Biophys Res Commun. 313:856–862.
2004. View Article : Google Scholar : PubMed/NCBI
|
|
27
|
Pérez R, Tupac-Yupanqui I and Dunner S:
Evaluation of suitable reference genes for gene expression studies
in bovine muscular tissue. BMC Mol Biol. 9:792008. View Article : Google Scholar : PubMed/NCBI
|
|
28
|
Tang R, Dodd A, Lai D, McNabb WC and Love
DR: Validation of zebrafish (Danio rerio) reference genes for
quantitative real-time RT-PCR normalization. Acta Biochim Biophys
Sin (Shanghai). 39:384–390. 2007. View Article : Google Scholar : PubMed/NCBI
|
|
29
|
Cruz F, Kalaoun S, Nobile P, Colombo C,
Almeida J, Barros LM, Romano E, Grossi-de-Sá MF, Vaslin M and
Alves-Ferreira M: Evaluation of coffee reference genes for relative
expression studies by quantitative real-time RT-PCR. Mol Breed.
23:607–616. 2009. View Article : Google Scholar
|
|
30
|
Kurman RJ and Shih IM: The origin and
pathogenesis of epithelial ovarian cancer: A proposed unifying
theory. Am J Surg Pathol. 34:433–443. 2010. View Article : Google Scholar : PubMed/NCBI
|