Introduction
Malignant gliomas are the most common and most
aggressive type of malignant primary brain tumor in humans
(1). They are characterized by
high proliferation, migration and invasion abilities. World Health
Organization grade IV astrocytomas are known as glioblastoma
multiforme (GBM). The majority of GBMs arise de novo and are
defined as primary GBMs, whereas progression from lower grade
astrocytomas results in secondary GBMs (1). Despite aggressive surgery combined
with radiation, chemotherapy and biological therapy, the prognosis
of patients remains poor, with a 5-year survival rate of 4–5% and a
median survival rate of ~14 months (2,3).
This poor prognosis is considered to be primarily a result of the
invasive pattern of tumor growth, which precludes complete
resection and enhances resistance to therapies (4). Thus, elucidation of the molecular
mechanisms underlying the progression of malignant gliomas is
urgently required.
The ten-eleven translocation (TET) family of
proteins is composed of three members, TET1, TET2 and TET3. They
share a conserved Cys-rich domain and double-stranded β helix
domain (5). TETs exhibit their
unique enzymatic function and facilitate DNA demethylation,
oxidizing 5-methylcytosine (5mC) to 5-hydroxymethylcytosine (5hmC),
5-formylcytosine (5fC) and 5-carboxylcytosine (5caC) in a stepwise
manner (6,7). TETs can thus act as epigenetic
regulators, and can modulate gene transcription and cellular
functions (8). Genetic
investigations in mutant mice have linked the function of
Tet genes to various biological pathways, including zygotic,
embryonic and perinatal development (9); self-renewal, proliferation and
differentiation of hematopoietic stem/progenitor cells (10); and induction of pluripotent stem
cell reprogramming (11).
Pathologically, mutations and/or deletions of the TET2 gene
have been reported to frequently occur in hematopoietic
malignancies (12,13). Loss of the expression of TET2
confers to the development and progression of hematopoietic
malignancies, including acute myeloid leukemia (14) and B cell malignances (15). Additionally, androgen hormones
involved in the progression of prostate cancer repress TET2. The
repression of TET2 activates key prostate cancer-associated
pathways, including mammalian target of rapamycin (16). Previously, TET1, 2 and 3 have been
reported to be abundant in the brain, and the level of TET2 in
particular is steadily sustained in central nervous system
development (17). The functional
perturbation of TET2 and TET3 leads to defects in neuronal
differentiation (18). The
involvement of TET2 in gliomas remains to be fully elucidated. The
present study aimed to explore the expression pattern, the
biological role and the mechanisms for dysregulation of TET2 and
revealed that TET2 was downregulated and associated with
progression in gliomas. Overexpressed TET2 inhibited glioma cell
proliferation and invasion. It was also demonstrated that the
overexpression of zinc finger E-box-binding homeobox 1 (ZEB1)
repressed the expression of TET2 in glioma cells.
Materials and methods
Clinical specimens, cell culture and
transfection
A total of 42 paired fresh glioma tissues and
adjacent non-tumor tissues were collected between May 2013 and July
2014, and 96 formalin-fixed paraffin-embedded glioma tissues were
collected between June 2007 and October 2010, at Xiangyang No. 1
People's Hospital (Hubei, China). The fresh tissue samples were
immediately snap-frozen in liquid nitrogen and were used for RNA
extraction. Each of the patients provided written informed consent
and the present study was approved by ethics committee of Xiangyang
No. 1 People's Hospital. A172, SW1088, U118MG, U87MG and U251MG
human glioma cell lines were obtained from American Type Culture
Collection (Manassas, VA, USA) and maintained at 37°C in a
humidified atmosphere containing 5% CO2 The cells were
cultured in DMEM supplemented with 10% fetal bovine serum (Gibco;
Thermo Fisher Scientific, Inc., Waltham, MA, USA). For TET2
overexpression and ZEB1 knockdown, the cells were transfected with
the TET2-overexpressing vector, pcDNA3.1-TET2, or with the pSUPER
vector containing ZEB1-specific short hairpin (sh)RNAs,
respectively (Guangzhou Fulengen Co., Ltd., Guangzhou, China).
Transfection was performed using Lipofectamine 2000 (Invitrogen;
Thermo Fisher Scientific, Inc.) in accordance with the
manufacturer's protocol.
Reverse transcription-quantitative
polymerase chain reaction (RT-qPCR) analysis of mRNA
Tissues were excised and homogenized under liquid
nitrogen. Total RNA from the cells and tumor tissues were extracted
using TRIzol reagent, and 2 µg mRNAs was used to synthesize cDNAs
using the Super-Script first-strand synthesis system (Thermo Fisher
Scientific, Inc.); 1 µl cDNAs was used for qPCR and the qPCR
analysis was performed according to the standard protocol of the
ABI 7500 system with SYBR Green supermix (Applied Biosystems;
Thermo Fisher Scientific, Inc.). The reaction system (20 µl)
included 1 µl cDNA, 2 µl primer mix, 10 µl SYBR green PCR Master
Mix and 7 µl ddH2O (Thermo Fisher Scientific, Inc.).
GAPDH was used as an internal control and the RT-qPCR analysis was
repeated biologically three times with four technique repeats for
each. The primers for were as follows: GAPDH, forward
5′-CTCCTGTTCGACAGTCAGCC-3′ and reverse 5′-GCCCAATACGACCAAATCCG-3′;
TET2, forward 5′-GCTAGGCTGCTTTCGTAGAG-3′ and reverse
5′-GAATGTTTGCCAGCCTCGTTC-3′; ZEB1, forward
5′-AGCTGTTTCAAGATGTTTCCTTCC-3′ and reverse
5′-CCTATGCTCCACTCCTTGCT-3′. The PCR conditions were as follows: 1
cycle at 95°C for 5 min; 40 cycles at 95°C for 45 sec, 61°C for 30
sec and 72°C for 30 sec; and 1 cycle at 72°C for 10 min. Cycle
threshold values were established, and data were analyzed using
2−ΔΔCq method (19).
Immunohistochemistry
The tissue specimens were cut into 4-µm sections and
the sections dried at 55°C for 2 h, deparaffinized in xylene and
rehydrated using a series of graded alcohol washes. The tissue
slides were then treated with 3% hydrogen peroxide in methanol for
15 min to quench endogenous peroxidase activity, following which
antigen retrieval was performed by incubation at 98–100°C for 10
min in 0.01 M sodium citrate buffer (pH 6.0), heated using a
microwave oven. Following preincubation for 1 h in 10% goat serum
(Gibco; Thermo Fisher Scientific, Inc.), the specimens were
incubated with the TET2 (45010, 1:100) antibody and ZEB1 antibody
(3396, 1:300) obtained from Cell Signaling Technology, Inc.
(Danvers, MA, USA) for 1 h at room temperature. The tissue slides
were treated with a non-biotin horseradish peroxidase detection
system according to the manufacturer's protocol (Dako; Agilent
Technologies, Inc., Santa Clara, CA, USA). The images were obtained
using a light microscope (LEICA DM6000; Leica Microsystems GmbH,
Wetzlar, Germany). Two pathologists evaluated the
immunohistological samples and the intensity of immunostaining was
considered when analyzing the data. The intensity of staining was
scored (0–3) and the expression was classified as high if the score
was ≥2, and low if the score was ≤1.
Western blot analysis
Total proteins were extracted from the corresponding
cells using RIPA buffer (Thermo Fisher Scientific, Inc.) in the
presence of a protease inhibitor cocktail (Thermo Fisher
Scientific, Inc.). The protein concentrations of the lysates were
measured using a BCA Protein Assay kit (Thermo Fisher Scientific,
Inc.); 50 µg protein was resolved and mixed with 5X Lane Marker
Reducing Sample Buffer (Thermo Fisher Scientific, Inc.),
electrophoresed on a 10% SDS-acrylamide gel and transferred onto an
Immobilon-P Transfer Membrane (Merck KGaA, Darmstadt, Germany). The
membranes were blocked with 5% non-fat milk in Tris-buffered
saline, following which they were incubated with primary antibodies
at 4°C overnight, followed by a secondary antibody at room
temperature for 2 h. The signal was detected using an ECL detection
system (Merck KGaA). The TET2 antibody (45010; 1:1,000), ZEB1
antibody (3396; 1,000) and GAPDH antibody (2118; 1:1,000) were
obtained from Cell Signaling Technology, Inc. The horseradish
peroxidase-conjugated secondary antibody (31460; 1:20,000) was from
Thermo Fisher Scientific, Inc.
Cell invasion assay
Invasion of the cells was assessed using a Cell
Invasion Assay kit (BD Biosciences, Franklin Lakes, NJ, USA)
according to the manufacturer's protocol. Briefly, at 36 h
post-transfection, 3×10⁴ cells in 300 µl serum-free
medium were added to the upper chamber precoated with ECMatrix™
gel. Subsequently, 0.5 ml of 10% FBS-containing medium was added to
the lower chamber as a chemoattractant. The cells were incubated
for 24 h at 37°C, following which the non-invading cells were
removed with cotton swabs. The cells, which had migrated to the
bottom of the membrane were fixed with pre-cooled methanol and
stained with 2% Giemsa solution. The stained cells were visualized
under a light microscope. To minimize bias, at least three randomly
selected fields (magnification, ×100) were counted, and the average
number was determined.
Cell proliferation assay
Cell proliferation was monitored using an MTS assay
with the CellTiter96® AQueous One Solution Cell
Proliferation Assay kit (Promega Corporation, Madison, WI, USA)
according to the manufacturer's protocol. The cells were seeded
into 96-well plates at 2,000 cells/well (0.20 ml/well). The cell
proliferation assay was performed on day 2 by incubation with MTS
(0.02 ml/well) at 37°C for 1 h. Following incubation for a further
2 h, the absorbance at 490 nm was recorded for each well on the
BioTek Synergy 2 reader (BioTek Instruments, Inc., Winooski, VT,
USA). The absorbance represented the cell number, with the
absorbance of the control set as 100%.
Xenograft model in nude mice
Xenograft tumors were generated by subcutaneous
injection of U87MG/Control, U87MG/TET2, U251MG/Control and
U251MG/TET2 cell lines at 2×10⁶ cells in 200 µl,
respectively, into the hind limbs of 4–6 week-old female Balb/C
athymic nude mice, with three mice for each cell line. All mice
were housed and maintained under specific pathogen-free conditions
at 27°C with 12:12 h light:dark cycle and fed with sterilized food
and water, and all animal experiments were approved by the
Experimental Animal Ethics Committee of Hubei University of
Medicine and performed in accordance with institutional guidelines.
Tumor growth was examined every 3 days during the animal
experiment. The mice were sacrificed with 120 µl 10% hydral
(Sinopharm Chemical Reagent Co., Ltd, Shanghai, China) 27 days
later and the tumors were harvested and weighed.
Chromatin immunoprecipitation (ChIP)
assay
Using the high-quality transcription factor binding
profile database (JASPAR database; http://jaspar.binf.ku.dk), ZEB1 was predicted for
regulating TET2 transcription. To determine whether ZEB1 could bind
to the TET2 promoter, the ChIP assay was applied in the
present study. The ChIP assay was performed using an EZ-CHIP™
chromatin immunoprecipitation kit (Merck KGaA). Briefly, chromatin
proteins were cross-linked to DNA by the addition of formaldehyde
to the culture medium to a final concentration of 1%. Following
incubation for 10 min at room temperature, the cells
(2×10⁵) were washed and scraped off in ice-cold
phosphate-buffered saline containing Protease Inhibitor Cocktail
II. The cells were pelleted and then re-suspended in lysis buffer
containing Protease Inhibitor Cocktail II. The resulting lysate was
subjected to sonication to reduce the size of DNA to ~200–1,000
base pairs in length. The sample was centrifuged at 10,000 ×
g at 4°C for 10 min to remove cell debris and diluted
10-fold in ChIP dilution buffer containing Protease Inhibitor
Cocktail II. A 5 µl sample of the supernatant was retained as
‘Input’ and stored at 4°C. Subsequently 5 µg of anti-RNA polymerase
antibody (positive control, included in the kit), anti-ZEB1
antibody (Cell Signaling Technology, Inc.) or IgG (negative
control) were added to the chromatin solution and incubated
overnight at 4°C with rotation. Following antibody incubation,
protein G agarose was added and the sample was incubated at 4°C
with rotation for an additional 2 h. The protein/DNA complexes were
washed with wash buffers four times and eluted with ChIP elution
buffer. Cross-links were then reversed to free DNA by the addition
of 5 M NaCl and incubation at 65°C for 4 h. The DNA was purified
according to the manufacturer's protocol. A total of 50 µl of DNA
was obtained for each treatment, and 0.2 µl of the DNA from each
group was used as a template for PCR. The total 20 µl reaction
system include 0.2 µl cDNA, 2 µl primer mix, 10 µl PCR Master Mix
and 7.8 µl ddH2O (Thermo Fisher Scientific, Inc.). The
primers for the TET2 promoter containing putative ZEB1
binding sites were as follows: Sense 5′-GTGCATTAACAATTTCCAAGAC-3′
and antisense 5′-CAAAGTTGACTCAGATTTCAG-3′. Primers for the human
GAPDH gene were as follows: Sense 5′-TACTAGCGGTTTTACGGGCG-3′ and
antisense 5′-TCGAACAGGAGGAGCAGAGAGCGA-3′. The PCR conditions were
as follows: 1 cycle of 95°C for 5 min; 32 cycles of 95°C for 20
sec, 59°C for 30 sec, 72°C for 30 sec; and one cycle of 72°C for 10
min. The PCR samples were resolved by electrophoresis on a 2%
agarose gel and stained with ethidium bromide.
Promoter activity analysis
To determine whether ZEB1 regulated the promoter
activity of TET2, a 2 kb region upstream of the first exon of
TET2 was cloned into the pGL4-reporter vector upstream of
the luciferase gene. The cells were seeded (1×10⁴/well)
in 96-well plates and co-transfected with the pGL4-reporter vector
or pRL-TK Renilla luciferase vector, with or without the
pSUPER-sh-ZEB1 vector, using Lipofectamine 2000 (Invitrogen; Thermo
Fisher Scientific, Inc.). The transfection was performed at room
temperature. After transfection, the cells were incubated at 37°C
in cell culture conditions. After 48 h, luciferase activity was
determined using a Dual-Luciferase Reporter Assay system (Promega
Corporation) on a BioTek Synergy 2 reader (BioTek Instruments,
Inc.). The activity of Renilla luciferase was used as an internal
control and firefly luciferase activity was calculated as the mean
± standard deviation following normalization relative to the
activity of Renilla luciferase.
Statistical analysis
All statistical analyses were performed using SPSS
statistical software (version 21.0; IBM SPSS, Armonk, NY, USA).
Survival curves were constructed using the Kaplan-Meier method and
analyzed using the log-rank test. Significant prognostic factors
identified by univariate analysis were entered into multivariate
analysis using the Cox proportional hazards model. The results are
reported as the mean ± standard deviation. P<0.05 was considered
to indicate a statistically significant difference.
Results
Expression of TET2 is decreased in
primary glioma tissues
To determine the role of TET2 in glioma, the present
study measured the expression pattern of TET2 in glioma tissues.
RT-qPCR analysis was used to assess the mRNA levels of TET2 in
tissues from 42 cases of primary glioma. Compared with matched
non-tumor brain tissues, the mRNA levels of TET2 were significantly
downregulated in the majority of primary glioma tissues, with a
more marked decrease in high-grade gliomas, compared with low-grade
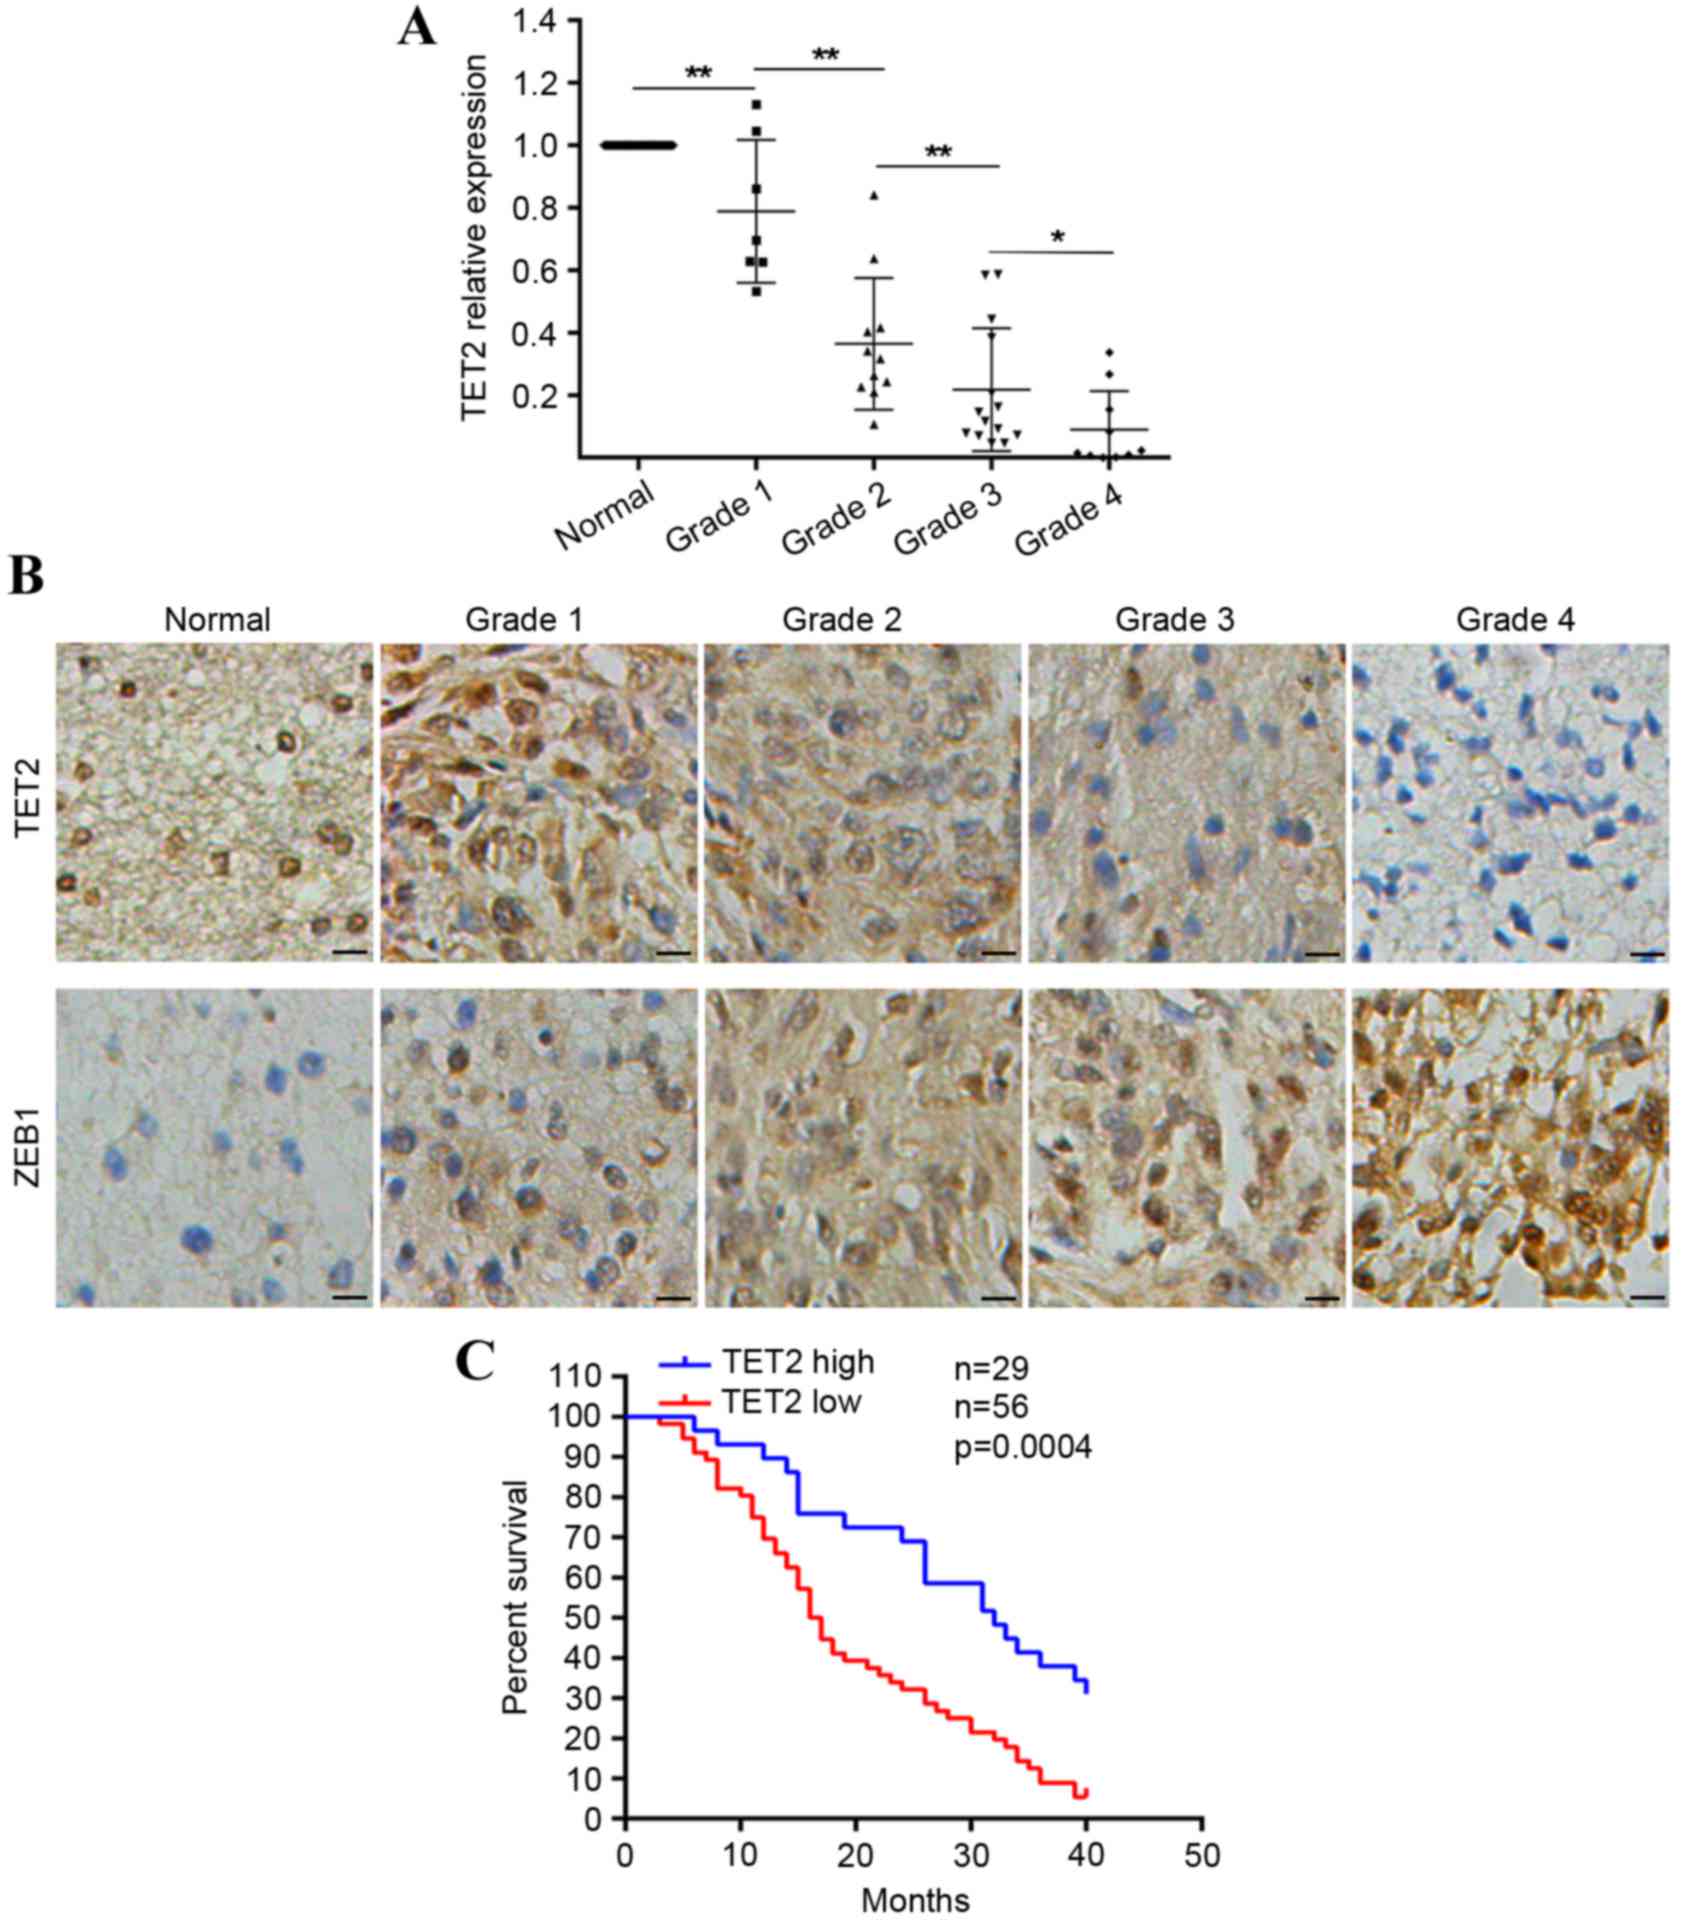
gliomas (Fig. 1A). As survival
data were not available for the tissues used for RT-qPCR analysis,
another cohort of 96 tissues (comprising 11 normal brain tissues
and 85 glioma tissues) with follow-up data were used to confirm the
protein levels of TET2 via immunohistochemical staining. The
protein levels of TET2 were lower in glioma tissues, compared with
normal tissues (Fig. 1B). The
downregulation of TET2 correlated with increases in tumor size and
tumor grade (Table I). Of note, it
was observed that lower expression levels of TET2 in patients with
glioma were predictive of poorer overall survival rates (Fig. 1C). These results indicated that
expression of TET2 was downregulated in gliomas.
 | Table I.Analysis of the correlation between
the expression levels of TET2 and ZEB1 with clinicopathological
parameters in gliomas. |
Table I.
Analysis of the correlation between
the expression levels of TET2 and ZEB1 with clinicopathological
parameters in gliomas.
|
|
| TET2 |
| ZEB1 |
|
|---|
|
|
|
|
|
|
|
|---|
| Parameter | Cases (n) | High | Low | P-value | High | Low | P-value |
|---|
| Age |
|
|
| 0.7143 |
|
| 0.5327 |
| <60
years | 55 | 18 | 37 |
| 31 | 24 |
|
| ≥60
years | 30 | 11 | 19 |
| 19 | 11 |
|
| Gender |
|
|
| 0.6432 |
|
| 0.9586 |
|
Male | 41 | 15 | 26 |
| 24 | 17 |
|
|
Female | 44 | 14 | 30 |
| 26 | 18 |
|
| Tumor size |
|
|
| 0.0023 |
|
| 0.0380 |
| <4.5
cm | 42 | 21 | 21 |
| 20 | 22 |
|
| ≥4.5
cm | 43 | 8 | 35 |
| 30 | 13 |
|
| WHO grade |
|
|
| 0.0004 |
|
| 0.0043 |
|
I+II | 11+20 | 18 | 13 |
| 12 | 19 |
|
|
III+IV | 21+33 | 11 | 43 |
| 38 | 16 |
|
TET2 inhibits glioma cell invasion and
growth
To examine the functional role of TET2 in gliomas,
the present study evaluated the protein level of TET2 in various
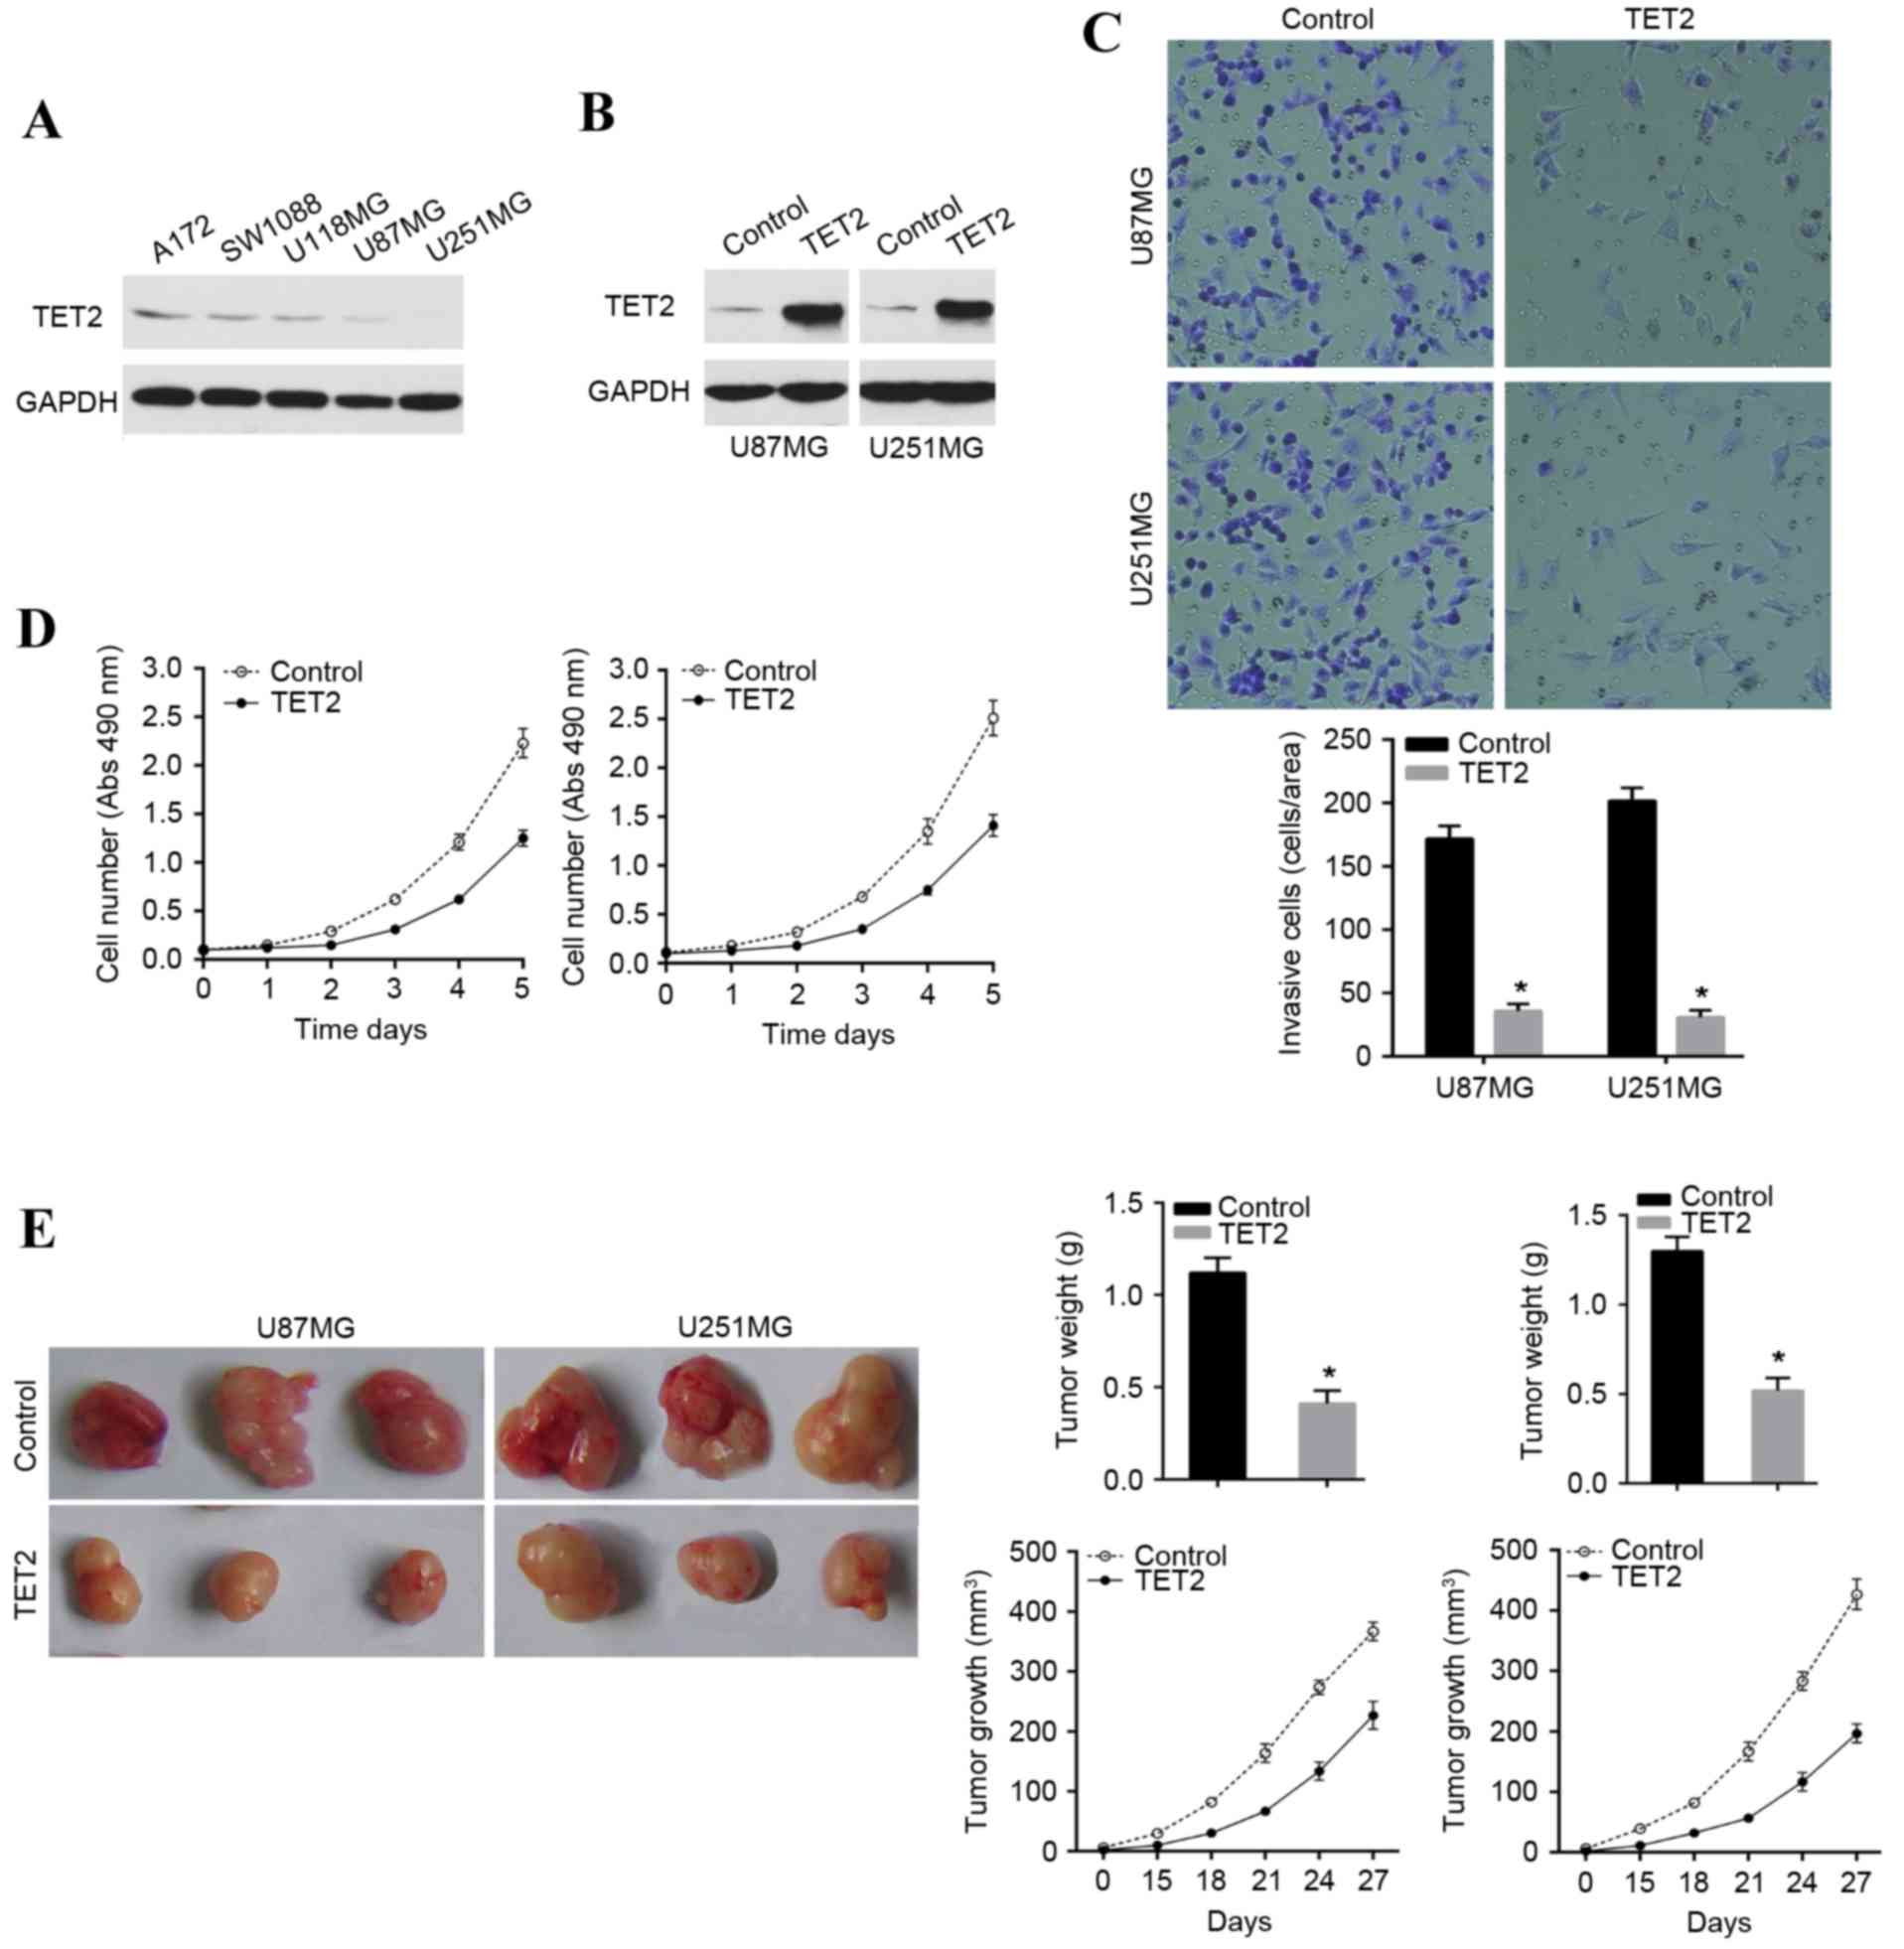
glioma cell lines. It was found that TET2 was expressed at low
levels in the A172, SW1088, U118MG, U87MG and U251MG glioma cell
lines, compared with the endogenous control, GAPDH (Fig. 2A). U87MG and U251MG were used for
overexpression of TET2 to investigate the biological role of TET2
in glioma cells (Fig. 2B). The
results indicated that the overexpression of TET2 inhibited the
invasion potential of the U87MG and U251MG cell lines (Fig. 2C). Additionally, it was found that
TET2 induced marked growth inhibition in the U87MG and U251MG cell
lines in vitro (Fig. 2D).
The effect of TET2 on growth in glioma was further confirmed in
nude mice with human glioma xenografts. This involved subcutaneous
injection into the armpit of athymic mice with TET2-overexpressing
U87MG and U251MG cell lines and their associated control cell
lines. As shown, the tumor sizes derived from the
TET2-overexpressing U87MG and U251MG cell lines were significantly
reduced (Fig. 2E). These results
indicated that restoration of the expression of TET2 inhibited cell
invasion and growth in glioma cells.
Expression of ZEB1 is inversely
correlated with the expression of TET2
To determine whether transcriptional regulation
contributed to the downregulation of TET2, the present study
analyzed the response elements of a cohort of transcription factors
located within a 2 kb region upstream of the first exon of the
TET2 gene. Using the JASPAR database, a putative ZEB1
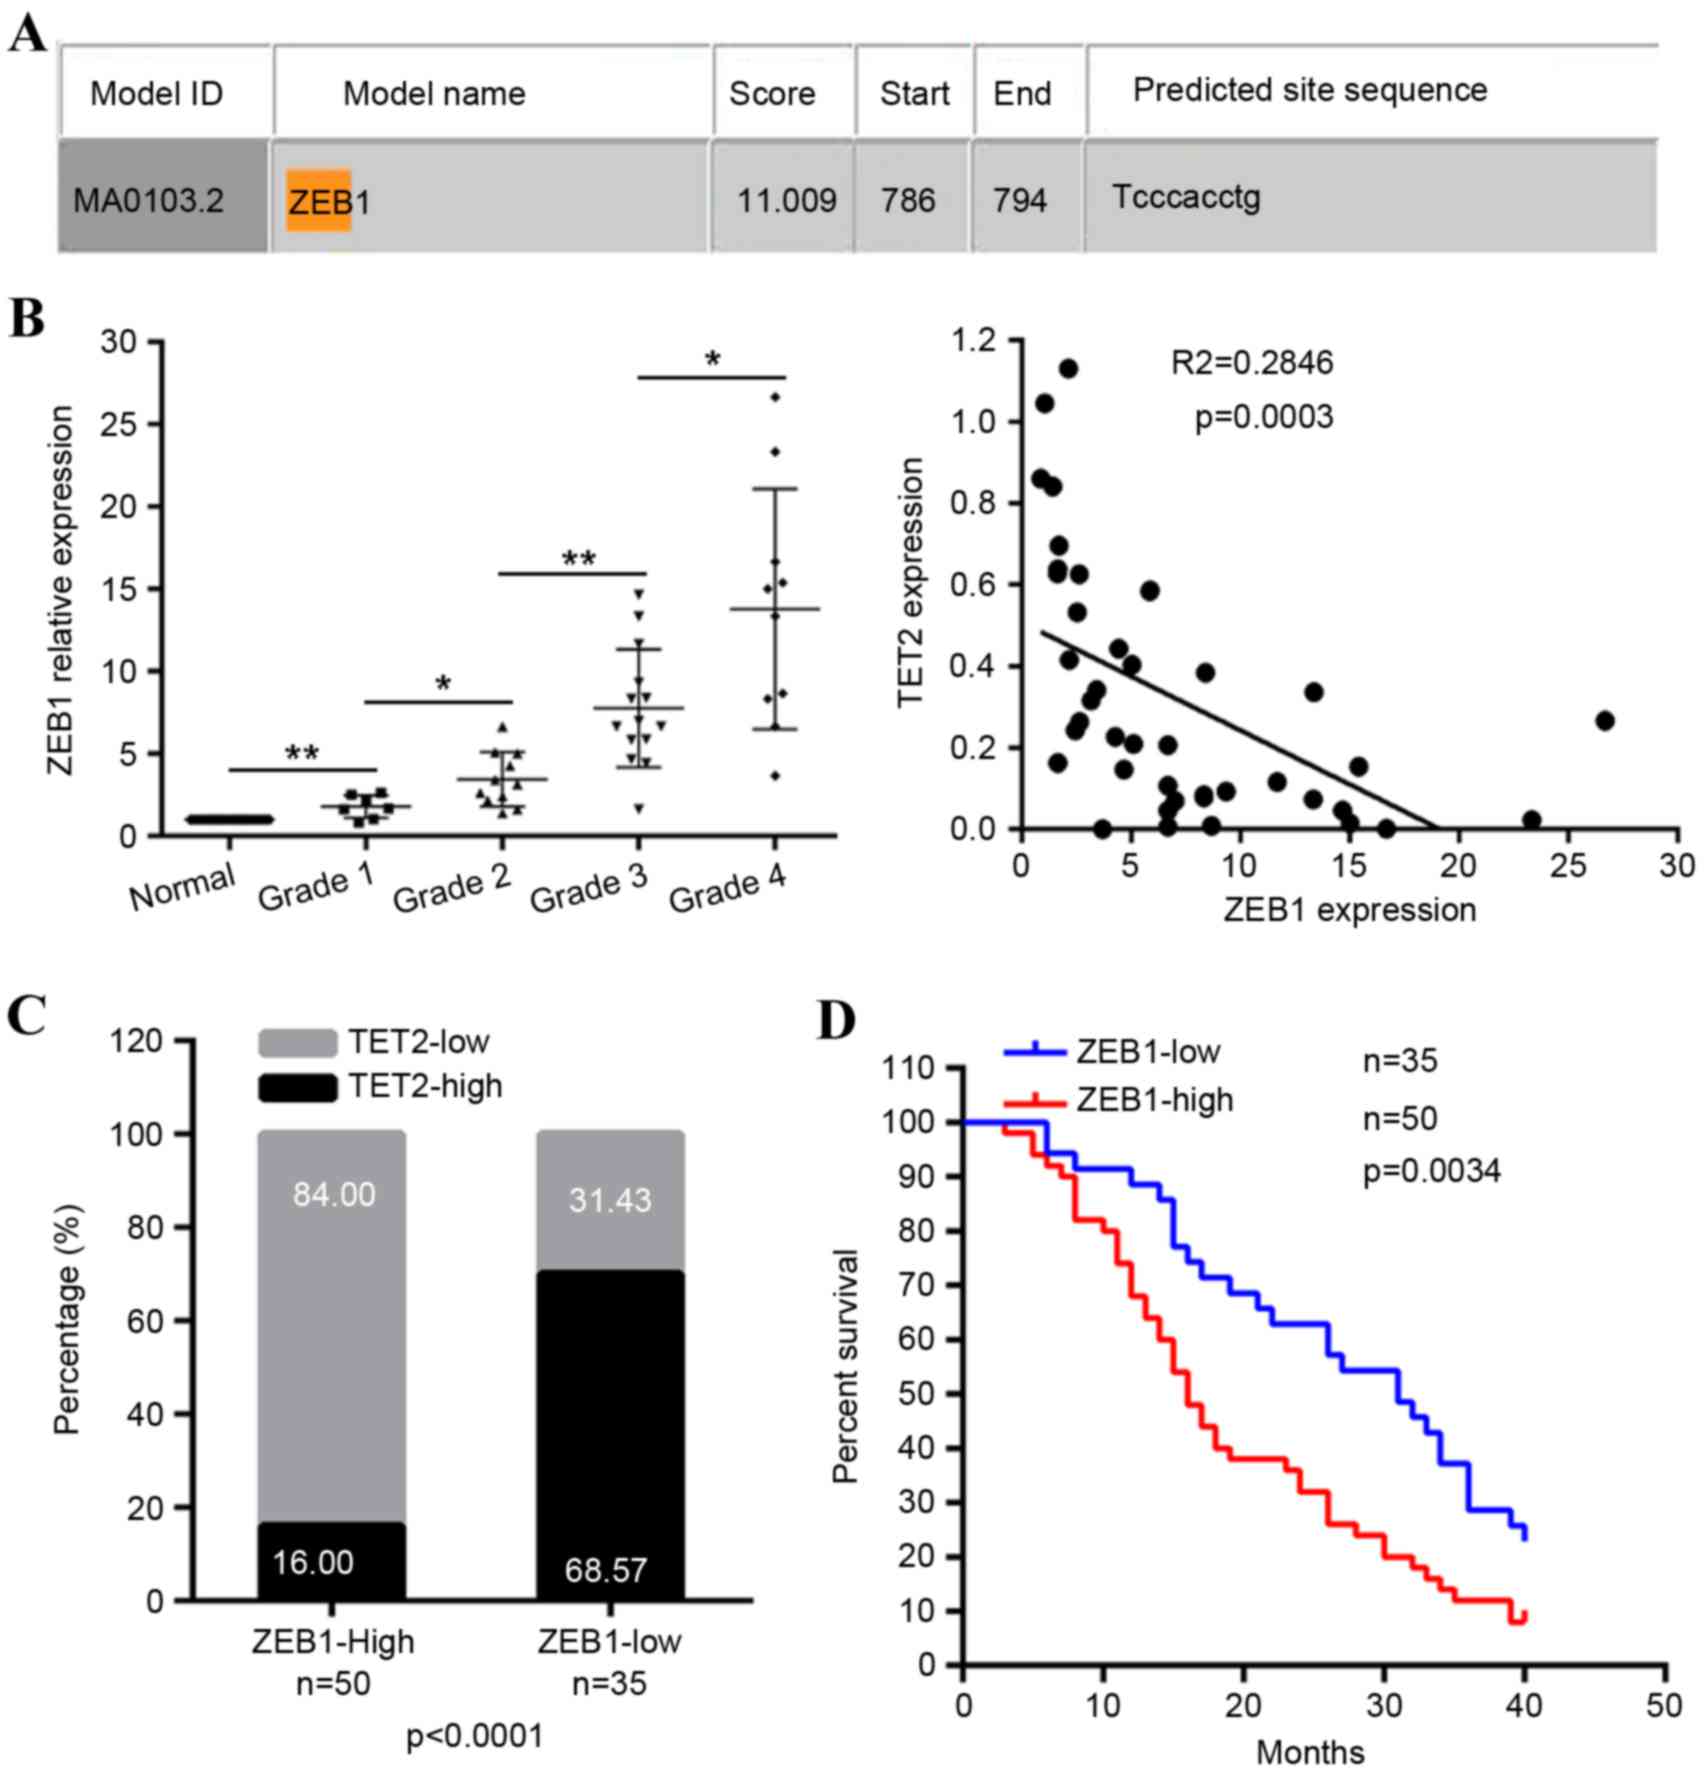
binding site (CACCTG) was identified within this region
(Fig. 3A), suggesting that the
overexpression of ZEB1 resulted in the repression of TET2. As
expected, in the 42 primary glioma tissue samples, compared with
the matched non-tumor brain tissues, the mRNA levels of ZEB1 were
significantly upregulated in the majority of primary glioma
tissues, with a more marked increase in high-grade gliomas,
compared with low-grade gliomas (Fig.
3B). The mRNA levels of ZEB1 were inversely correlated with the
mRNA levels of TET2 (Fig. 3B). The
protein levels of ZEB1 were also confirmed via immunohistochemical
staining of the 96 tissues in which the protein levels of TET2 were
measured. Compared with normal tissues, the protein levels of ZEB1
were high in glioma tissues (Fig.
1B) and negatively correlated with the expression of TET2
(Fig. 3C). The upregulation of
ZEB1 was correlated with increases in tumor size and tumor grade
(Table I), and were predictive of
a poorer overall survival rate (Fig.
3D). These findings indicated a negative correlation between
ZEB1 and TET2 in gliomas.
ZEB1 transcriptionally inhibits the
expression of TET2 in glioma cells
As the expression of ZEB1 was inversely correlated
with that of TET2 in gliomas, and there was a potential ZEB1
binding site in the TET2 potential promoter, it was
necessary to verify whether ZEB1 transcriptionally regulated the
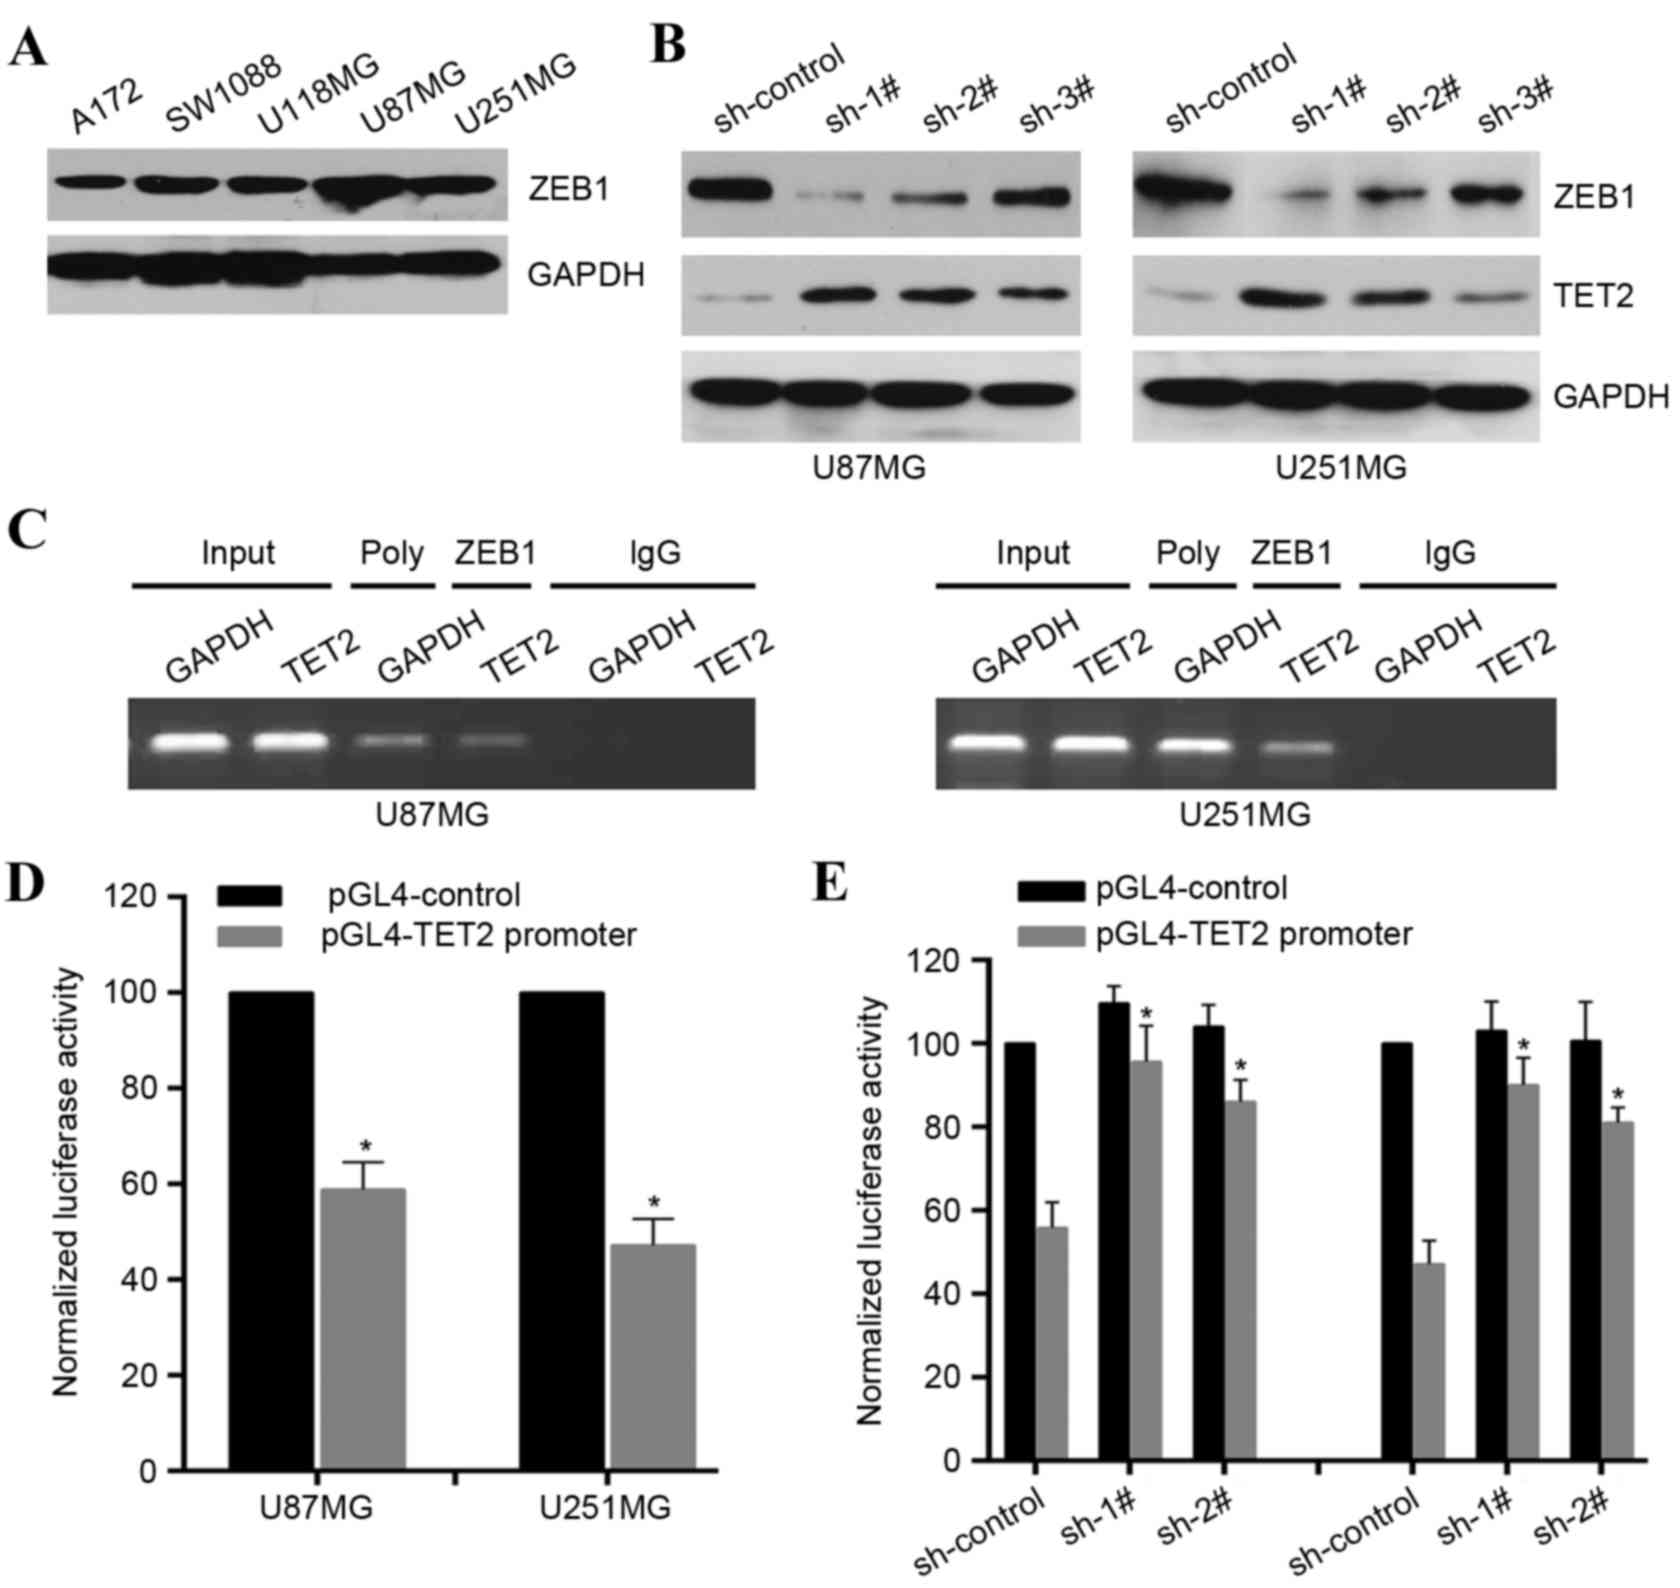
expression of TET2 in gliomas. ZEB1 was expressed at high levels in
the selected glioma cell lines (Fig.
4A). It was found that ZEB1-knockdown significantly upregulated
the expression levels of TET2 in the U87MG and U251MG cell lines
(Fig. 4B). To confirm the direct
association of ZEB1 with the TET2 promoter, ChIP assays were
performed in the U87MG and U251MG cell lines, which revealed that
ZEB1 was bound to the TET2 promoter (Fig. 4C). To determine whether the 2 kb
region had promoter activity, the 2 kb DNA was cloned into the pGL4
reporter plasmid. The experimental results indicated that
luciferase activity driven by the potential TET2 promoter
was lower in the U87MG and U251MG cell lines, compared with the
control (Fig. 4C). However,
ZEB1-knockdown enhanced the luciferase activity in the U87MG and
U251MG cell lines (Fig. 4D). These
results demonstrated that ZEB1 was able to directly bind to the
TET2 promoter to transcriptionally repress the expression of
TET2 in glioma cells.
Discussion
Due to the poor prognosis of patients with malignant
gliomas, there is an urgent requirement to examine the molecular
mechanisms responsible for the progression of glioma. TET2 has been
reported to act as a tumor suppressor in certain types of human
cancer (14,16), however, its role in glioma remains
to be elucidated. In the present study, the expression pattern of
TET2 in gliomas was determined. The findings indicated that TET2
was downregulated in gliomas and its downregulation was correlated
with progression. Functionally, restoration of the expression of
TET2 inhibited glioma cell growth and invasion, indicating that the
repression of TET2 conferred the progression of gliomas.
TET1/2/3 promote DNA demethylation by catalyzing the
conversion of 5mC primarily to 5hmc, in addition to 5fC and 5caC
(6,7). To date, the distinct function of 5hmC
remains to be fully elucidated, however, there is evidence that
5hmC, as an intermediate in active DNA demethylation, is involved
in gene regulation, developmental control and malignant
transformation (20,21). Studies have revealed that TET2
mutations are accompanied by decreased levels of 5hmC, particularly
in hematopoietic diseases (13,22,23).
Human brain tissue exhibits high levels of 5hmC, and there is loss
of 5hmC in brain tumors leading to a disturbance of
hydroxymethylome (24). However,
in a previous study by Kraus et al (25) no correlation was found between
alterations in TETs and the levels of 5hmC in gliomas. This
suggests other disturbances, including disrupted gene expression or
functional inhibition of TET proteins, may be responsible for the
aberrant epigenome of gliomas. Consistently, the findings of the
present study indicated that the expression of TET2 was
significantly downregulated in gliomas. The roles of TET proteins
in regulating chromatin architecture and gene transcription
independently of DNA methylation have been gradually uncovered
(8,26). Thus, the precise molecular
mechanisms underlying the effects of TET2 in gliomas require
further examination and confirmation in future investigations.
The functional loss of TET2 due to mutations and/or
deletions frequently occurs in hematopoietic diseases. As the
expression of TET2 is repressed in gliomas, and the frequency of
TET2 mutations (25) and
methylation of the TET2 promoter are low (27), the present study focused on whether
certain transcription factors can regulate the expression of TET2
in gliomas. ZEB1 was found to have an inverse correlation with
levels of TET2 in gliomas. Bioinformatics analysis combined with
experimental validation revealed that ZEB1 bound to the promoter of
the TET2 gene and transcriptionally repressed its activity. ZEB1
has been reported to be expressed at high levels in epithelial
cancer, and its expression correlates with poor prognosis (28). ZEB1 is an inducer of
epithelial-to-mesenchymal transition via transcriptionally
modulating the expression of cell adhesion molecules, microRNAs,
particularly the miR-200 family, and cell polarity-associated
genes, and then contributes to metastasis, drug resistance and poor
clinical outcome (29,30). Edwards et al (31) reported the induction of ZEB1
through the tumor microenvironment in glioma and the promotion of
invasion. Siebzehnrubl et al (32) also showed the link between the ZEB1
pathway and glioblastoma initiation, invasion and chemoresistance,
predicting shorter survival rates. Despite these reports on ZEB1 in
glioma, further elucidation is required. The present study
demonstrated that the overexpression of ZEB1 in glioma confers the
downregulation of TET2, suggesting a novel mechanism for ZEB1 in
the progression of glioma.
Taken together, the results of the present study
demonstrated the expression pattern of TET2 in glioma, and
established TET2 as a regulator of growth and invasion. The
elucidation of the ZEB1-TET2 axis provides novel insights into the
molecular mechanisms underlying the progression of glioma and
provides a rationale for the development of clinical anticancer
intervention strategies targeting the ZEB1-TET2 axis.
References
|
1
|
Ohgaki H and Kleihues P: The definition of
primary and secondary glioblastoma. Clin Cancer Res. 19:764–772.
2013. View Article : Google Scholar : PubMed/NCBI
|
|
2
|
Huse JT and Holland EC: Targeting brain
cancer: Advances in the molecular pathology of malignant glioma and
medulloblastoma. Nat Rev Cancer. 10:319–331. 2010. View Article : Google Scholar : PubMed/NCBI
|
|
3
|
Wen PY and Kesari S: Malignant gliomas in
adults. N Engl J Med. 359:492–507. 2008. View Article : Google Scholar : PubMed/NCBI
|
|
4
|
Lee KH, Ahn EJ, Oh SJ, Kim O, Joo YE, Bae
JA, Yoon S, Ryu HH, Jung S, Kim KK, et al: KITENIN promotes glioma
invasiveness and progression, associated with the induction of EMT
and stemness markers. Oncotarget. 6:3240–3253. 2015. View Article : Google Scholar : PubMed/NCBI
|
|
5
|
Tahiliani M, Koh KP, Shen Y, Pastor WA,
Bandukwala H, Brudno Y, Agarwal S, Iyer LM, Liu DR, Aravind L and
Rao A: Conversion of 5-methylcytosine to 5-hydroxymethylcytosine in
mammalian DNA by MLL partner TET1. Science. 324:930–935. 2009.
View Article : Google Scholar : PubMed/NCBI
|
|
6
|
He YF, Li BZ, Li Z, Liu P, Wang Y, Tang Q,
Ding J, Jia Y, Chen Z, Li L, et al: Tet-mediated formation of
5-carboxylcytosine and its excision by TDG in mammalian DNA.
Science. 333:1303–1307. 2011. View Article : Google Scholar : PubMed/NCBI
|
|
7
|
Ito S, Shen L, Dai Q, Wu SC, Collins LB,
Swenberg JA, He C and Zhang Y: Tet proteins can convert
5-methylcytosine to 5-formylcytosine and 5-carboxylcytosine.
Science. 333:1300–1303. 2011. View Article : Google Scholar : PubMed/NCBI
|
|
8
|
Pastor WA, Aravind L and Rao A: TETonic
shift: Biological roles of TET proteins in DNA demethylation and
transcription. Nat Rev Mol Cell Biol. 14:341–356. 2013. View Article : Google Scholar : PubMed/NCBI
|
|
9
|
Dawlaty MM, Breiling A, Le T, Raddatz G,
Barrasa MI, Cheng AW, Gao Q, Powell BE, Li Z, Xu M, et al: Combined
deficiency of Tet1 and Tet2 causes epigenetic abnormalities but is
compatible with postnatal development. Dev Cell. 24:310–323. 2013.
View Article : Google Scholar : PubMed/NCBI
|
|
10
|
Ko M, Bandukwala HS, An J, Lamperti ED,
Thompson EC, Hastie R, Tsangaratou A, Rajewsky K, Koralov SB and
Rao A: Ten-Eleven-Translocation 2 (TET2) negatively regulates
homeostasis and differentiation of hematopoietic stem cells in
mice. Proc Natl Acad Sci USA. 108:14566–14571. 2011. View Article : Google Scholar : PubMed/NCBI
|
|
11
|
Costa Y, Ding J, Theunissen TW, Faiola F,
Hore TA, Shliaha PV, Fidalgo M, Saunders A, Lawrence M, Dietmann S,
et al: NANOG-dependent function of TET1 and TET2 in establishment
of pluripotency. Nature. 495:370–374. 2013. View Article : Google Scholar : PubMed/NCBI
|
|
12
|
Quivoron C, Couronné L, Della Valle V,
Lopez CK, Plo I, Wagner-Ballon O, Do Cruzeiro M, Delhommeau F,
Arnulf B, Stern MH, et al: TET2 inactivation results in pleiotropic
hematopoietic abnormalities in mouse and is a recurrent event
during human lymphomagenesis. Cancer Cell. 20:25–38. 2011.
View Article : Google Scholar : PubMed/NCBI
|
|
13
|
Delhommeau F, Dupont S, Della Valle V,
James C, Trannoy S, Massé A, Kosmider O, Le Couedic JP, Robert F,
Alberdi A, et al: Mutation in TET2 in myeloid cancers. N Engl J
Med. 360:2289–2301. 2009. View Article : Google Scholar : PubMed/NCBI
|
|
14
|
Wang Y, Xiao M, Chen X, Chen L, Xu Y, Lv
L, Wang P, Yang H, Ma S, Lin H, et al: WT1 recruits TET2 to
regulate its target gene expression and suppress leukemia cell
proliferation. Mol Cell. 57:662–673. 2015. View Article : Google Scholar : PubMed/NCBI
|
|
15
|
Zhao Z, Chen L, Dawlaty MM, Pan F, Weeks
O, Zhou Y, Cao Z, Shi H, Wang J, Lin L, et al: Combined Loss of
Tet1 and Tet2 Promotes B Cell, but Not Myeloid Malignancies, in
Mice. Cell Rep. 13:1692–1704. 2015. View Article : Google Scholar : PubMed/NCBI
|
|
16
|
Takayama K, Misawa A, Suzuki T, Takagi K,
Hayashizaki Y, Fujimura T, Homma Y, Takahashi S, Urano T and Inoue
S: TET2 repression by androgen hormone regulates global
hydroxymethylation status and prostate cancer progression. Nat
Commun. 6:82192015. View Article : Google Scholar : PubMed/NCBI
|
|
17
|
Dzitoyeva S, Chen H and Manev H: Effect of
aging on 5-hydroxymethylcytosine in brain mitochondria. Neurobiol
Aging. 33:2881–2891. 2012. View Article : Google Scholar : PubMed/NCBI
|
|
18
|
Hahn MA, Qiu R, Wu X, Li AX, Zhang H, Wang
J, Jui J, Jin SG, Jiang Y, Pfeifer GP and Lu Q: Dynamics of
5-hydroxymethylcytosine and chromatin marks in Mammalian
neurogenesis. Cell Rep. 3:291–300. 2013. View Article : Google Scholar : PubMed/NCBI
|
|
19
|
Livak KJ and Schmittgen TD: Analysis of
relative gene expression data using real-time quantitative PCR and
the 2(−Delta Delta C(T)) Method. Methods. 25:402–408. 2001.
View Article : Google Scholar : PubMed/NCBI
|
|
20
|
Branco MR, Ficz G and Reik W: Uncovering
the role of 5-hydroxymethylcytosine in the epigenome. Nat Rev
Genet. 13:7–13. 2011.PubMed/NCBI
|
|
21
|
Spruijt CG, Gnerlich F, Smits AH,
Pfaffeneder T, Jansen PW, Bauer C, Münzel M, Wagner M, Müller M,
Khan F, et al: Dynamic readers for 5-(hydroxy)methylcytosine and
its oxidized derivatives. Cell. 152:1146–1159. 2013. View Article : Google Scholar : PubMed/NCBI
|
|
22
|
Ko M, Huang Y, Jankowska AM, Pape UJ,
Tahiliani M, Bandukwala HS, An J, Lamperti ED, Koh KP, Ganetzky R,
et al: Impaired hydroxylation of 5-methylcytosine in myeloid
cancers with mutant TET2. Nature. 468:839–843. 2010. View Article : Google Scholar : PubMed/NCBI
|
|
23
|
Solary E, Bernard OA, Tefferi A, Fuks F
and Vainchenker W: The Ten-Eleven Translocation-2 (TET2) gene in
hematopoiesis and hematopoietic diseases. Leukemia. 28:485–496.
2014. View Article : Google Scholar : PubMed/NCBI
|
|
24
|
Kraus TF, Globisch D, Wagner M, Eigenbrod
S, Widmann D, Münzel M, Müller M, Pfaffeneder T, Hackner B, Feiden
W, et al: Low values of 5-hydroxymethylcytosine (5hmC), the ‘sixth
base,’ are associated with anaplasia in human brain tumors. Int J
Cancer. 131:1577–1590. 2012. View Article : Google Scholar : PubMed/NCBI
|
|
25
|
Kraus TF, Greiner A, Steinmaurer M,
Dietinger V, Guibourt V and Kretzschmar HA: Genetic
characterization of ten-eleven-translocation methylcytosine
dioxygenase alterations in human glioma. J Cancer. 6:832–842. 2015.
View Article : Google Scholar : PubMed/NCBI
|
|
26
|
Zhang Q, Zhao K, Shen Q, Han Y, Gu Y, Li
X, Zhao D, Liu Y, Wang C, Zhang X, et al: Tet2 is required to
resolve inflammation by recruiting Hdac2 to specifically repress
IL-6. Nature. 525:389–393. 2015. View Article : Google Scholar : PubMed/NCBI
|
|
27
|
Kim YH, Pierscianek D, Mittelbronn M,
Vital A, Mariani L, Hasselblatt M and Ohgaki H: TET2 promoter
methylation in low-grade diffuse gliomas lacking IDH1/2 mutations.
J Clin Pathol. 64:850–852. 2011. View Article : Google Scholar : PubMed/NCBI
|
|
28
|
Schmalhofer O, Brabletz S and Brabletz T:
E-cadherin, beta-catenin, and ZEB1 in malignant progression of
cancer. Cancer Metastasis Rev. 28:151–166. 2009. View Article : Google Scholar : PubMed/NCBI
|
|
29
|
Wellner U, Schubert J, Burk UC,
Schmalhofer O, Zhu F, Sonntag A, Waldvogel B, Vannier C, Darling D,
zur Hausen A, et al: The EMT-activator ZEB1 promotes tumorigenicity
by repressing stemness-inhibiting microRNAs. Nat Cell Biol.
11:1487–1495. 2009. View
Article : Google Scholar : PubMed/NCBI
|
|
30
|
Zhang P, Sun Y and Ma L: ZEB1: At the
crossroads of epithelial-mesenchymal transition, metastasis and
therapy resistance. Cell Cycle. 14:481–487. 2015. View Article : Google Scholar : PubMed/NCBI
|
|
31
|
Edwards LA, Woolard K, Son MJ, Li A, Lee
J, Ene C, Mantey SA, Maric D, Song H, Belova G, et al: Effect of
brain- and tumor-derived connective tissue growth factor on glioma
invasion. J Natl Cancer Inst. 103:1162–1178. 2011. View Article : Google Scholar : PubMed/NCBI
|
|
32
|
Siebzehnrubl FA, Silver DJ, Tugertimur B,
Deleyrolle LP, Siebzehnrubl D, Sarkisian MR, Devers KG, Yachnis AT,
Kupper MD, Neal D, et al: The ZEB1 pathway links glioblastoma
initiation, invasion and chemoresistance. EMBO Mol Med.
5:1196–1212. 2013. View Article : Google Scholar : PubMed/NCBI
|