Introduction
Manganese (Mn) is both an essential and a toxic
trace element, mainly depending on its levels in human tissues and
its speciation. As a component of enzymes such as superoxide
dismutase (SOD), Mn is involved in oxidative stress response and it
is also important for the maintenance of a normal bone structure
(1). On the other hand, elevated
Mn levels may induce neurotoxic effects, including a Parkison-like
disease called manganism (2). Mn
is a natural component of the environment and one of the main
exposure routes is through the diet. Mn is primarily absorbed in
the gastrointestinal tract, followed by the lung (3). The main dietary sources are cereals
and tubers, fruits and vegetables, followed by meat, fish and
seafood (4). Other foods with high
Mn content include nuts, dried fruits and seeds, chocolate and tea
leaves (3,5). Moreover, intestinal absorption
(generally <10% of the ingested Mn) is influenced by iron
storage status and intake (6),
calcium or phosphorus intake (7),
and by the use of dietary supplements (8), including soy formula (9). Besides dietary intake, Mn exposure
may arise from its release into the air, soil and water from
industries manufacturing products containing Mn such as pesticides
and Mn alloys, from mining activities, and from automobile
exhausts, leading to environmental contamination of potential
public health concern (10,11).
Among the toxic metals associated with fine particulate matter (PM)
in the ambient air (12), there
are Mn residues depending on the season and on the sampling site,
residential, industrial or rural (13). Finally, tobacco smoke, including
second-hand smoke, may expose to Mn at levels higher than those not
exposed (14), although not all
results are consistent (15).
The attempt to identify reliable biomarkers of Mn
exposure yielded conflicting results, since whole blood levels seem
to be very variable and of limited value as biomarker of intake
(7). Serum and plasma levels could
be more sensitive to variations of dietary intake and have
half-life ranging between 13–37 days, thus being short-term
indicators of exposure (3). A more
recent and accurate approach to address the issue of Mn exposure
includes analysis of the different Mn species, namely Mn-ferritin
(Mn-Fer), Mn-transferrin (Mn-Tf), Mn-citrate (Mn-Cit) and
inorganic-Mn (Inorg-Mn) (10,16).
In this cross-sectional study we aimed to assess the
influence on serum total levels of Mn and its species of foods
known as major contributors of Mn intake, personal life style and
habits, and air pollution, and to investigate the relation between
serum Mn and other dietary elements such as iron, calcium and
phosphorus.
Materials and methods
Study participants
The methodology for the recruitment of the study
population was previously described (17,18).
Briefly, by accessing the databases of the Modena Municipality
General Registry Office and following the approval of the local
Ethics Committee, we recruited a random sample of 50 subjects
residing in Modena, a municipality located in the Emilia-Romagna
region (~180,000 inhabitants). To do that, we randomly selected a
list of eligible subjects from each gender- and age-specific
subgroup of the Modena adult population, using the ‘sample’ routine
of the Stata-11 statistical software (Stata Corp., College Station,
TX, USA). We contacted these subjects by phone asking for their
participation in the study. The 34% of subjects who accepted to
participate were invited in the morning to the Modena Health Unit
for collection of a fasting blood sample after they gave their
written consent.
Laboratory analyses
Blood samples were collected in a plastic tube,
immediately centrifuged at 1,000 × g for 10 min and stored as serum
aliquots of 1 ml at −15°C until use. We determined serum Mn
concentrations at the laboratory of the Research Center for
Environmental Health (Research Unit Analytical BioGeoChemistry,
Neuherberg, Germany), where a 1 ml aliquot for each study subject
was transferred frozen in dry ice, using the previously described
methodology (19,20).
Total Mn determination: briefly, we slowly thawed
the samples in a refrigerator at 4°C, vortexed and subsequently
diluted 500 µl aliquots of samples 1:10 with Milli-Q water
(Millipore, Bedford, MA, USA), containing 103Rh as
internal standard. The final 103Rh concentration in the
diluted serum samples was 1 µg/l. An ELEMENT 2 [Thermo Fisher
Scientific, Bremen, Germany] inductively coupled plasma-sector
field mass spectrometry (ICP-SFMS) instrument was employed for
55Mn determination in medium resolution mode. Sample
introduction was carried out using a peristaltic pump connected to
a SeaSpray™ Nebulizer with a cyclon spray chamber
(Perkin-Elmer Inc., Waltham, MA, USA). The RF power was set to
1,200 W, the plasma gas was 15 l/min Ar, whereas the nebuliser gas
was ~0.9 l/min Ar after daily optimization.
Mn species determination: Mn speciation was
performed as previously described (16) using size-exclusion chromatography
(SEC) coupled to ICP-dynamic rection cell (DRC)-MS. In short terms,
SEC (mass vs. retention time calibrated) was performed with a
Knauer 1100 Smartline inert series gradient HPLC system with a 100
µl injection loop (Knauer, Berlin, Germany) and further to two
serially installed SEC columns separation ranges ca. 200-10 kDa and
2-0.1 kDa. This column combination provided separation of various
Mn-proteins from each other and from Mn-Cit as well as the latter
clearly from Inorg-Mn. Tris-HAc (10 mM, pH 7.4) + 250 mM
NH4Ac was used as the eluent at a flow-rate of 0.75
ml/min. The column effluent was directly provided to ICP-DRC-MS. A
PerkinElmer NexION ICP-MS (Sciex, Toronto, ON, Canada) with dynamic
reaction cell capability was employed for on-line determination of
55Mn in the graphic mode. For SEC coupling the column
effluent was passing the UV detector and then directed to a
Meinhard® nebulizer (Meinhard Co., Golden, CO, USA)
(which was mounted to a cyclone spray chamber) using a PEEK
transfer tube (ID 100 µm; Perkin-Elmer Inc.). The RF power was set
to 1,250 W, the plasma gas was 15 l/min Ar. The nebulizer gas was
optimized and finally set to 0.98 ml/min Ar. The dwell time was 500
msec. The dynamic reaction cell (DRC) was operated using
NH3 as DRC gas, finally at a flow rate of 0.58 ml/min.
The DRC band pass (q) was set to 0.45 LOD for Mn-peaks in
SEC-ICP-DRC-MS were calculated as 3 σ-criterion and found between
28–35 ng/l, thus, uniformly set to 35 ng/l.
Exposure assessment
We collected from study participants general
information including smoking habits, education, occupational
history and the use of dietary supplements during the last year. We
also assessed their dietary habits through a semi-quantitative food
frequency questionnaire used for the Central-Northern Italian
population within the EPIC study (21). This questionnaire assessed the
frequency and amount of consumption of 188 food items over the
previous year, and allowed to estimate frequency and quantity of
consumption of the individual foodstuff and related intake of
nutrients and contaminants through an ad hoc software (22,23).
With regard to the intake of such nutrients, we selected only those
previously reported to influence Mn content, i.e., iron, calcium
and phosphorus (6,7). Finally, foodstuff giving the major
contribution of Mn intake were selected according to the Mn EFSA
scientific opinion and the Italian Total Diet Study (4,5). The
food categories included were cereals, meat, fish and seafood,
dairy products, chocolate, fruits, vegetables, legumes, nuts and
tea consumption.
We also considered the participants exposure to
traffic contaminants as a proxy of outdoor Mn exposure, by
estimating the concentration of particulate matter <10 µm
(PM10) at their residences as described elsewhere
(18,24,25).
Previous studies showed that motor vehicle emissions are important
sources of ambient Mn (26,27).
We implemented this approach since traffic was expected to be by
far the main source of exposure for this population, also for the
absence of major industrial emissions in the study area. To do
that, we took into account the road distribution and the location
of the municipal solid waste incinerator and its modeled emissions
(28). Briefly, we used Google
Earth to geocode the home address of all study subjects and we
modeled the average ambient air PM10 concentration at
these locations for 2006, using the CAlifornia LINE version 4
(CALINE4 air quality dispersion model; CALTRANS 1989, California
Department of Transportation) air quality dispersion model for
roads and other linear sources (29). The 2006 assessment carried out in
Modena (24) was generated by a
model including: ⅰ) demographic and occupational information for
all residents of the provinces; ⅱ) detailed personal mobility
information collected by the National Institute of Statistics 2001
Census; and ⅲ) validated through ad hoc surveys and automatic
vehicle counters. The model yielded a matrix of vehicle movements
for each road, based on daily movements estimated for the residents
of Modena considering their age, gender, family structure and
occupation (30). This model was
validated in the study area by comparing measured and modeled
PM10 levels in the air monitoring stations (24). Limited changes occurred in the
municipal area with respect to circulating vehicles (from
117,310–115,887) and to the census of adult population (from
152,372–155,998), since the year of exposure assessment (2006)
until the beginning of the study (2011), according to the data
released by the Modena municipality (www.comune.modena.it/serviziostatistica/pubblicazioni/annuari/annuario2012/inciden-ti2012/inci_tav2012.shtml).
Data analysis
We calculated median and interquartile range (IQR)
for total Mn and for all Mn species. Since we found a subject
showing an extremely high level of total Mn (22.6 µg/l), we
considered this sample as an outlier and removed it from data
analyses. Pearsons coefficients and 95% confidence intervals (CI)
were calculated between Mn species and continuous variables (age,
BMI, energy and food and nutrients intake, estimates of
PM10). Influence of several dietary items and nutrients
were tested also using bivariate and multivariate regression
models. In order to reduce the influence of measurement errors that
are frequently produced by food frequency questionnaires, we
adjusted the estimates of dietary nutrients, e.g., iron intake, for
total energy intake, using Willetts residual method (31). In order to test the effect of
outdoor environmental Mn levels on the serum levels of the
different Mn species, we performed bivariate and multivariate
logistic regression analysis using as endpoint the odds ratio (OR)
of being above the median value of the Mn species.
When Mn species had values below the limit of
detection (0.04 µg/l), they were set to 0.02 (=LOD/2). We carried
out sensitivity analyses with different methods, i.e., by replacing
LOD/2 with zero or by dividing it by √2, and/or the use of
log-transformed values, and finally with winsorized values by
setting data exceeding the 5th/95th percentile to the 5th/95th
percentile. Dealing with censored data in some Mn-species, we
tested also the tobit regression (‘tobit’ routine in STATA-14),
which is specifically designed to estimate linear relations between
variables when there is either left or right censoring in the
dependent variable (32,33).
Results
Table I summarizes
the main characteristic of the study population. Age ranged between
35–70 years with mean ± SD value of 52.3 (±10.4), with males and
females equally represented. Eight subjects reported consumption of
dietary supplements containing a mean value of 1.25 mg/day of Mn
(in the form of Mn sulphate monohydrate) at the time of the
sampling. Distribution of total Mn serum levels and specific
species are presented in Table
II. Overall, total Mn ranged from 0.72–8.18 µg/l, with median
value of 2.32 (IQR, 1.81–3.06). Total Mn levels and Mn-Tf show
slightly higher levels in males and in people aged ≥50 years, while
no relevant difference was detected according to BMI categories or
smoking habits independently from supplement use, whereas Mn-Fer,
Mn-Cit and Inorg-Mn showed little variation among the
categories.
 | Table I.Characteristics of study
population. |
Table I.
Characteristics of study
population.
| Study
population | n (%) |
|---|
| All subjects | 50 (100) |
| Gender |
|
|
Males | 26 (52) |
|
Females | 24 (48) |
| Age (years) |
|
|
35–49 | 22 (44) |
|
50–70 | 28 (56) |
| BMI |
|
|
<18.5 | 1 (2) |
|
18.5–24.9 | 21 (42) |
|
>25 | 28 (56) |
| Education |
|
|
Elementary school | 3 (6) |
| Middle
school | 10 (20) |
| High
school | 23 (46) |
| College
or higher | 14 (28) |
| Occupation |
|
|
Agriculture | 0 (0) |
|
Industry | 6 (12) |
|
Servicesa | 27 (53) |
|
Housewife | 2 (4) |
|
Retired | 11 (21) |
|
Other | 5 (10) |
| Smoking habits |
|
| Never
smokes | 25 (50) |
| Former
smokers | 16 (32) |
| Current
smokers | 9 (18) |
| Mn supplement
users |
|
| Not
users | 42 (84) |
|
Users | 8 (16) |
| Table II.Distribution with median (50th) and
interquartile range (IQR) of total serum Mn and its species in
overall population and selected subgroups (values in µg/l). |
Table II.
Distribution with median (50th) and
interquartile range (IQR) of total serum Mn and its species in
overall population and selected subgroups (values in µg/l).
|
| Total Mn | Mn-Fer | Mn-Tf | Mn-Cit | Inorg-Mn |
|---|
|
|
|
|
|
|
|
|---|
| Study subjects
(N) | 50th | IQR | 50th | IQR | 50th | IQR | 50th | IQR | 50th | IQR |
|---|
| All
participants | 2.36 | (1.81–3.06) | 0.33 | (0.13–0.55) | 0.76 | (0.18–1.24) | 0.55 | (0.24–0.84) | 0.20 | (0.02–0.62) |
| Gender |
|
|
|
|
|
|
|
|
|
|
| Males
(26) | 2.47 | (2.06–3.06) | 0.28 | (0.15–0.37) | 0.84 | (0.21–1.32) | 0.55 | (0.27–0.83) | 0.16 | (0.02–0.59) |
| Females
(24) | 2.07 | (1.65–3.39) | 0.40 | (0.11–1.12) | 0.55 | (0.11–1.11) | 0.54 | (0.14–0.88) | 0.24 | (0.10–0.75) |
| Age (years) |
|
|
|
|
|
|
|
|
|
|
| <50
(22) | 2.27 | (1.70–2.68) | 0.29 | (0.15–0.43) | 0.43 | (0.17–1.45) | 0.50 | (0.09–1.12) | 0.19 | (0.15–0.54) |
| ≥50
(28) | 2.42 | (1.97–3.80) | 0.35 | (0.12–0.56) | 0.87 | (0.19–1.23) | 0.56 | (0.27–0.78) | 0.21 | (0.02–1.10) |
| BMI |
|
|
|
|
|
|
|
|
|
|
| <25
(22) | 2.13 | (1.60–2.68) | 0.27 | (0.11–0.55) | 0.64 | (0.18–1.09) | 0.54 | (0.12–0.75) | 0.37 | (0.05–0.62) |
| ≥25
(28) | 2.42 | (1.98–3.80) | 0.35 | (0.14–0.56) | 0.91 | (0.17–1.63) | 0.56 | (0.24–1.12) | 0.17 | (0.02–0.64) |
| Smoking habits |
|
|
|
|
|
|
|
|
|
|
|
Non-smokers (25) | 2.32 | (2.05–3.18) | 0.35 | (0.12–0.56) | 0.76 | (0.26–1.45) | 0.53 | (0.24–1.30) | 0.21 | (0.02–0.64) |
|
Ex-smokers (16) | 2.29 | (1.71–3.03) | 0.37 | (0.11–0.51) | 0.24 | (0.09–1.13) | 0.56 | (0.17–0.89) | 0.47 | (0.02–1.08) |
| Smokers
(9) | 2.10 | (1.78–2.63) | 0.23 | (0.22–0.35) | 0.91 | (0.18–1.24) | 0.57 | (0.26–0.71) | 0.16 | (0.02–0.29) |
| Mn supplement
users |
|
|
|
|
|
|
|
|
|
|
| No
(42) | 2.29 | (1.93–3.18) | 0.32 | (0.14–0.56) | 0.68 | (0.17–1.28) | 0.56 | (0.24–0.84) | 0.21 | (0.02–0.64) |
| Yes
(8) | 2.39 | (1.73–2.45) | 0.35 | (0.11–0.55) | 0.82 | (0.24–0.96) | 0.46 | (0.06–0.93) | 0.16 | (0.02–0.58) |
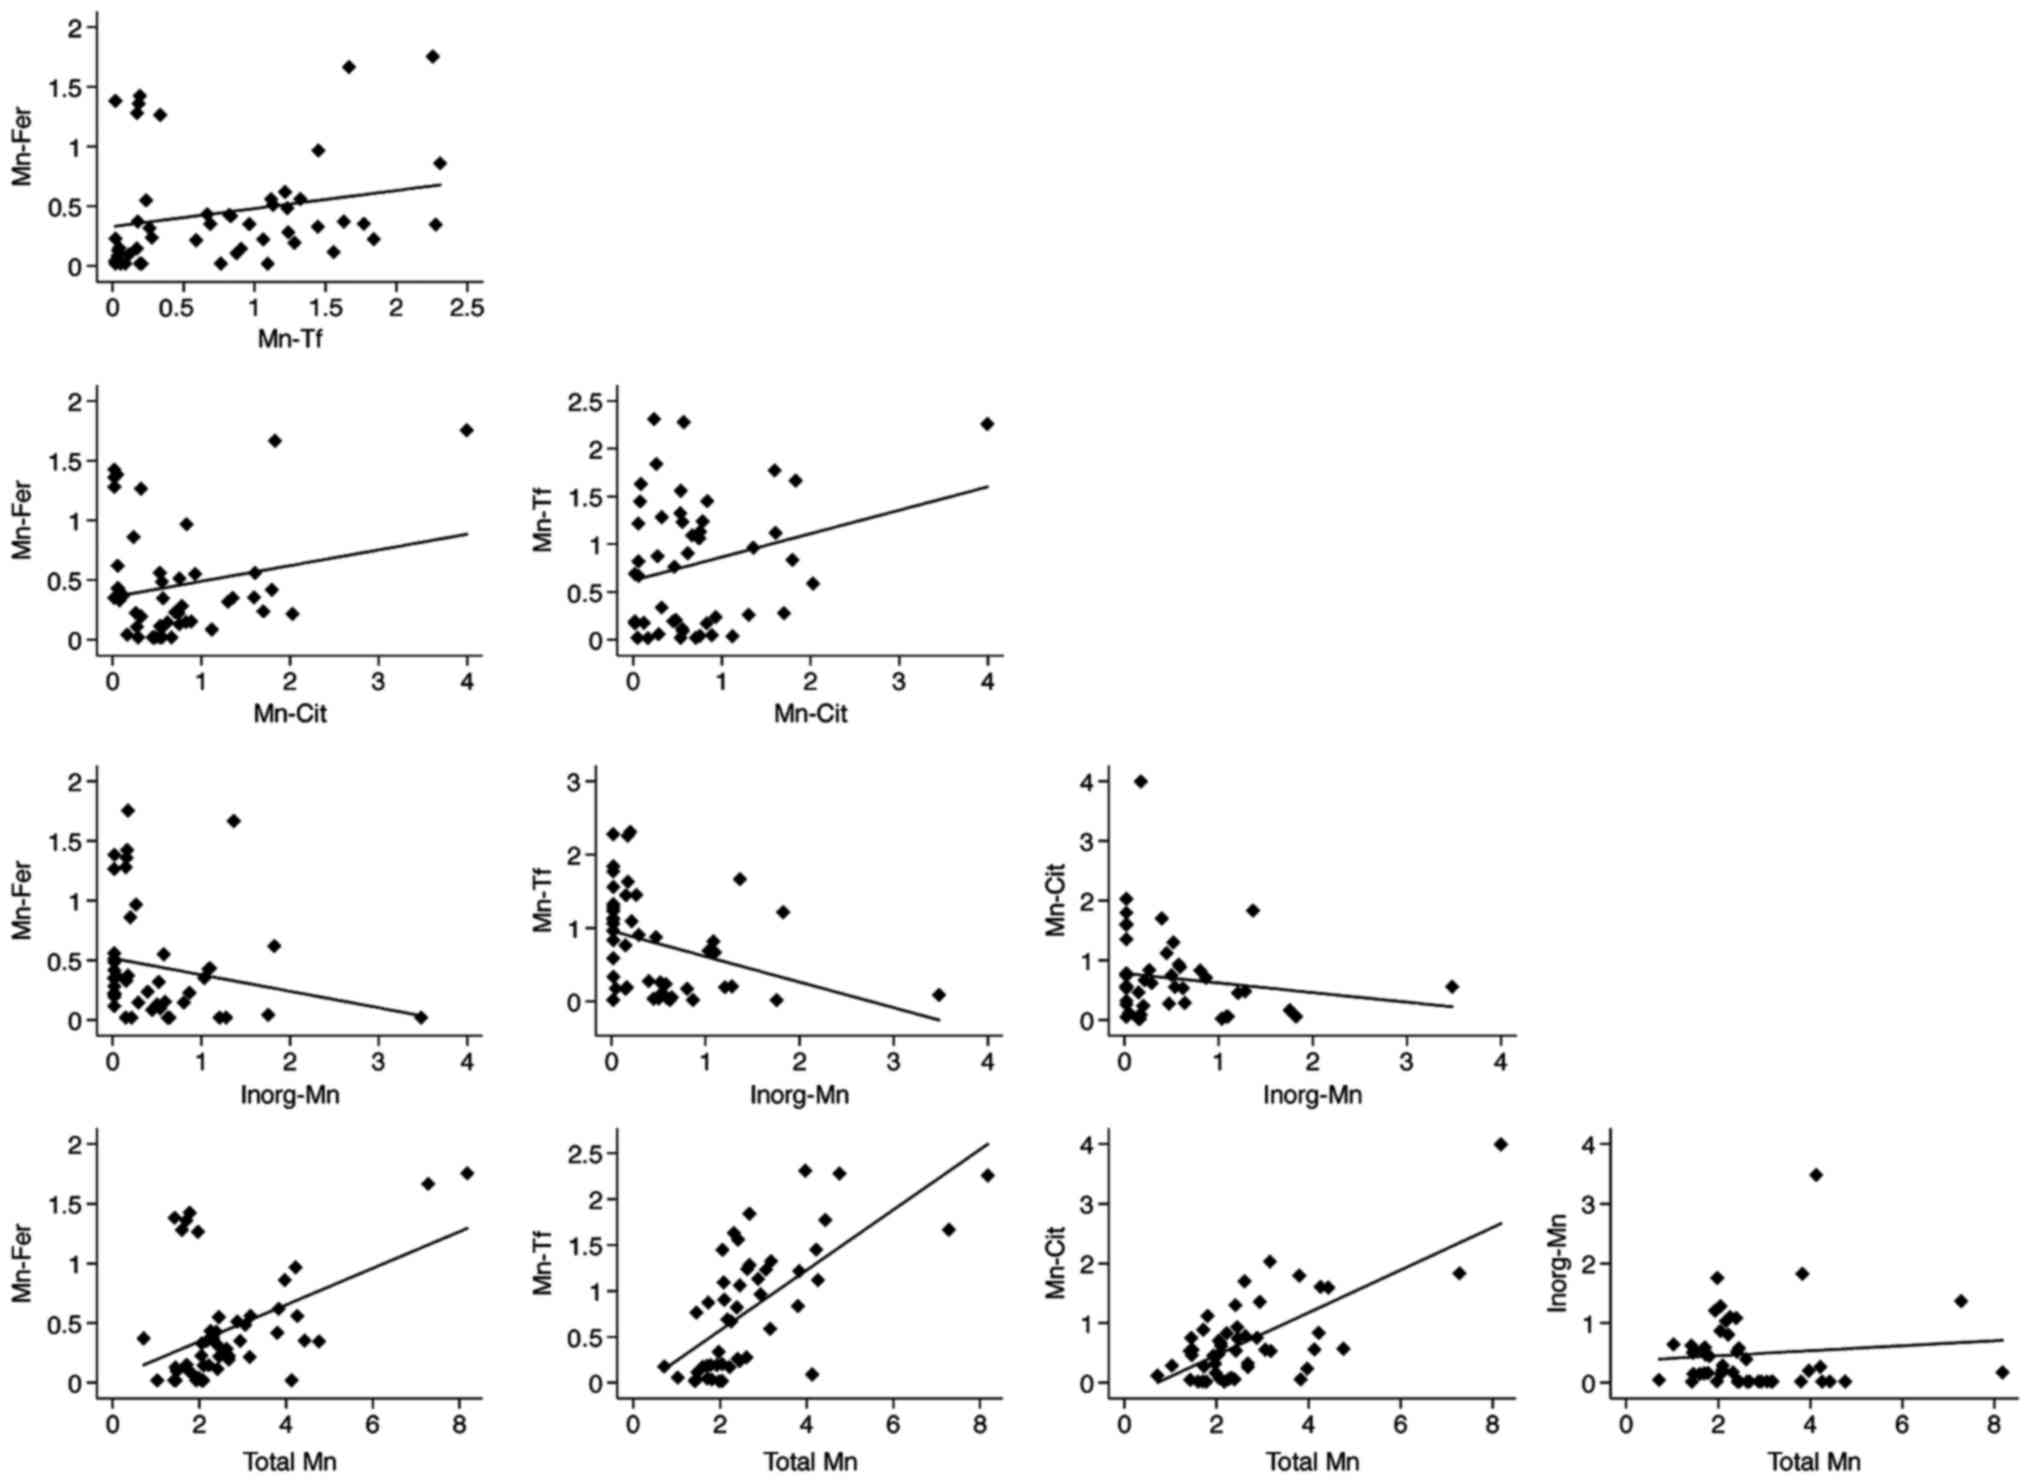
Mn total level positively correlated with individual
Mn species except for Inorg-Mn, which demonstrated a negative
correlation with Total Mn and with the other species. Moreover,
Mn-Cit shows a positive correlation with both Mn-Fer and Mn-Tf,
which in turn directly correlated with each other (Table III, Fig. 1). Sensitivity analyses, using a
different substitution method for values below the LOD, or log or
winsorized transformation did not alter the results (data not
shown).
| Table III.Pearsons correlation coefficients (r)
and 95% confidence intervals (CI) between total serum Mn and its
species. |
Table III.
Pearsons correlation coefficients (r)
and 95% confidence intervals (CI) between total serum Mn and its
species.
|
| Mn-Fer | Mn-Tf | Mn-Cit | Inorg-Mn |
|---|
| Mn-Fer | 1 |
|
|
|
| Mn-Tf | 0.222 | 1 |
|
|
|
| (−0.063 to
0.473) |
|
|
|
|
| P=0.126 |
|
|
|
| Mn-Cit | 0.204 | 0.259 | 1 |
|
|
| (−0.082 to
0.459) | (−0.024 to
0.504) |
|
|
|
| P=0.160 | P=0.072 |
|
|
| Inorg-Mn | −0.193 | −0.332 | −0.145 | 1 |
|
| (−0.449 to
0.094) | (−0.561 to
−0.056) | (−0.409 to
0.142) |
|
|
| P=0.185 | P=0.020 | P=0.314 |
|
| Total Mn | 0.462 | 0.676 | 0.694 | 0.091 |
|
| (0.208 to
0.658) | (0.487 to
0.804) | (0.512 to
0.816) | (−0.195 to
0.363) |
|
| P<0.001 | P<0.001 | P<0.001 | P=0.534 |
Correlations of Mn species with individual
characteristics and dietary factors are reported in Table IV. Generally, age demonstrated a
strong positive relation with all but one Mn species, while no
association emerged for BMI. Total energy intake showed a strong
correlation only with Inorg-Mn, while among nutrients, iron intake
showed an inverse relation with Mn-Fer and a positive one with
Inorg-Mn. Phosphate was slightly inversely associated with all
Mn-species except Mn-Tf, while calcium did not show such strong
correlation. Finally, Table V
showed Pearsons correlation coefficients of Mn with the main food
items. Generally, cereals and dairy products intake did not
correlate with Mn serum levels. Meat consumption demonstrated an
inverse relation with Mn-Fer levels, while a positive one emerged
for Inorg-Mn. Also fish and seafood showed an inverse relation with
total Mn, mainly for Mn-Cit and Mn-Tf. Fruit intake demonstrated a
positive correlation with all Mn species, except with Inorg-Mn.
Similar results were found for vegetable intake, showing a positive
relation with Mn-Tf and Mn-Cit and an inverse one with Inorg-Mn.
Pulse and nut intake positively correlated with quite all
Mn-species, mainly with Mn-Cit. Finally chocolate and tea
consumption demonstrated little correlation with Mn-species. In
general, this was true both for linear and tobit regression
analyses, and in both bivariate and multivariate analyses, adjusted
for age, gender and total energy intake (data not shown).
| Table IV.Pearsons correlation coefficients (r)
and 95% confidence intervals (CI) between Mn serum species and
characteristic and nutrients intake of study subjects. |
Table IV.
Pearsons correlation coefficients (r)
and 95% confidence intervals (CI) between Mn serum species and
characteristic and nutrients intake of study subjects.
|
| r | 95% CI | P-value |
|---|
| Age |
|
|
|
| Total
Mn | 0.307 | (0.028 to
0.541) | 0.032 |
|
Mn-Fer | 0.235 | (−0.049 to
0.485) | 0.126 |
|
Mn-Tf | 0.194 | (−0.092 to
0.451) | 0.181 |
|
Mn-Cit | 0.146 | (−0.141 to
0.410) | 0.319 |
|
Inorg-Mn | 0.097 | (−0.189 to
0.368) | 0.508 |
| Total energy
intake |
|
|
|
| Total
Mn | 0.038 | (−0.246 to
0.315) | 0.798 |
|
Mn-Fer | −0.179 | (−0.438 to
0.107) | 0.217 |
|
Mn-Tf | −0.170 | (−0.431 to
0.116) | 0.242 |
|
Mn-Cit | 0.072 | (−0.213 to
0.347) | 0.621 |
|
Inorg-Mn | 0.376 | (0.106 to
0.595) | 0.008 |
| Calcium intake |
|
|
|
| Total
Mn | −0.104 | (−0.375 to
0.182) | 0.476 |
|
Mn-Fer | −0.112 | (−0.381 to
0.175) | 0.443 |
|
Mn-Tf | 0.164 | (−0.123 to
0.425) | 0.262 |
|
Mn-Cit | −0.121 | (−0.390 to
0.165) | 0.404 |
|
Inorg-Mn | −0.156 | (−0.419 to
0.131) | 0.285 |
| BMI |
|
|
|
| Total
Mn | 0.029 | (−0.254 to
0.308) | 0.843 |
|
Mn-Fer | 0.026 | (−0.258 to
0.304) | 0.862 |
|
Mn-Tf | −0.041 | (−0.318 to
0.243) | 0.783 |
|
Mn-Cit | 0.110 | (−0.176 to
0.380) | 0.451 |
|
Inorg-Mn | 0.035 | (−0.249 to
0.313) | 0.811 |
| Iron intake |
|
|
|
| Total
Mn | 0.047 | (−0.238 to
0.324) | 0.751 |
|
Mn-Fer | −0.188 | (−0.445 to
0.099) | 0.196 |
|
Mn-Tf | −0.046 | (−0.323 to
0.239) | 0.756 |
|
Mn-Cit | 0.001 | (−0.281 to
0.282) | 0.997 |
|
Inorg-Mn | 0.255 | (−0.028 to
0.501) | 0.077 |
| Phosphate
intake |
|
|
|
| Total
Mn | −0.203 | (−0.458 to
0.083) | 0.162 |
|
Mn-Fer | −0.230 | (−0.480 to
0.055) | 0.112 |
|
Mn-Tf | 0.002 | (−0.279 to
0.283) | 0.988 |
|
Mn-Cit | −0.199 | (−0.455 to
0.087) | 0.171 |
|
Inorg-Mn | −0.017 | (−0.297 to
0.265) | 0.906 |
| Table V.Pearsons coefficients coefficients
(r) and 95% confidence intervals (CI) between total serum Mn and
its species with food intake of study subjects. |
Table V.
Pearsons coefficients coefficients
(r) and 95% confidence intervals (CI) between total serum Mn and
its species with food intake of study subjects.
|
| r | 95% CI | P-value |
|---|
| Cereal |
|
|
|
| Total
Mn | 0.122 | (−0.165 to
0.390) | 0.404 |
|
Mn-Fer | 0.088 | (−0.198 to
0.360) | 0.547 |
|
Mn-Tf | 0.038 | (−0.246 to
0.316) | 0.795 |
|
Mn-Cit | 0.077 | (−0.209 to
0.350) | 0.600 |
|
Inorg-Mn | 0.050 | (−0.235 to
0.327) | 0.733 |
| Meat |
|
|
|
| Total
Mn | 0.082 | (−0.204 to
0.355) | 0.574 |
|
Mn-Fer | −0.238 | (−0.487 to
0.046) | 0.099 |
|
Mn-Tf | −0.064 | (−0.339 to
0.222) | 0.665 |
|
Mn-Cit | 0.059 | (−0.226 to
0.335) | 0.687 |
|
Inorg-Mn | 0.306 | (0.027 to
0.541) | 0.032 |
| Fish and
seafood |
|
|
|
| Total
Mn | −0.217 | (−0.470 to
0.068) | 0.134 |
|
Mn-Fer | 0.059 | (−0.226 to
0.334) | 0.688 |
|
Mn-Tf | −0.197 | (−0.453 to
0.090) | 0.176 |
|
Mn-Cit | −0.207 | (−0.461 to
0.079) | 0.154 |
|
Inorg-Mn | −0.036 | (−0.314 to
0.248) | 0.806 |
| Milk and dairy |
|
|
|
| products |
|
|
|
| Total
Mn | −0.087 | (−0.359 to
0.199) | 0.552 |
|
Mn-Fer | −0.071 | (−0.345 to
0.215) | 0.629 |
|
Mn-Tf | −0.075 | (−0.348 to
0.211) | 0.611 |
|
Mn-Cit | −0.040 | (−0.317 to
0.244) | 0.786 |
|
Inorg-Mn | −0.011 | (−0.291 to
0.271) | 0.943 |
| Chocolate |
|
|
|
| Total
Mn | −0.110 | (−0.380 to
0.176) | 0.451 |
|
Mn-Fer | −0.161 | (−0.423 to
0.126) | 0.270 |
|
Mn-Tf | 0.015 | (−0.267 to
0.295) | 0.919 |
|
Mn-Cit | −0.194 | (−0.267 to
0.295) | 0.182 |
|
Inorg-Mn | 0.082 | (−0.204 to
0.355) | 0.574 |
| Fruit |
|
|
|
| Total
Mn | 0.139 | (−0.148 to
0.404) | 0.341 |
|
Mn-Fer | 0.134 | (−0.153 to
0.400) | 0.361 |
|
Mn-Tf | 0.020 | (−0.263 to
0.299) | 0.892 |
|
Mn-Cit | 0.148 | (−0.139 to
0.412) | 0.311 |
|
Inorg-Mn | −0.023 | (−0.302 to
0.260) | 0.875 |
| Vegetables |
|
|
|
| Total
Mn | 0.342 | (0.067 to
0.568) | 0.016 |
|
Mn-Fer | 0.157 | (−0.130 to
0.420) | 0.282 |
|
Mn-Tf | 0.246 | (−0.038 to
0.493) | 0.089 |
|
Mn-Cit | 0.388 | (0.120 to
0.603) | 0.006 |
|
Inorg-Mn | −0.192 | (−0.449 to
0.095) | 0.187 |
| Legumes |
|
|
|
| Total
Mn | 0.316 | (0.038 to
0.548) | 0.027 |
|
Mn-Fer | 0.175 | (−0.112 to
0.434) | 0.230 |
|
Mn-Tf | 0.120 | (−0.167 to
0.388) | 0.412 |
|
Mn-Cit | 0.302 | (0.022 to
0.537) | 0.035 |
|
Inorg-Mn | 0.182 | (−0.105 to
0.441) | 0.211 |
| Nuts |
|
|
|
| Total
Mn | 0.140 | (−0.147 to
0.405) | 0.337 |
|
Mn-Fer | 0.158 | (−0.129 to
0.420) | 0.279 |
|
Mn-Tf | 0.099 | (−0.188 to
0.370) | 0.499 |
|
Mn-Cit | 0.252 | (−0.031 to
0.498) | 0.081 |
|
Inorg-Mn | −0.144 | (−0.409 to
0.143) | 0.324 |
| Tea |
|
|
|
| Total
Mn | −0.045 | (−0.322 to
0.239) | 0.760 |
|
Mn-Fer | 0.049 | (−0.235 to
0.326) | 0.737 |
|
Mn-Tf | 0.039 | (−0.245 to
0.317) | 0.791 |
|
Mn-Cit | −0.074 | (−0.348 to
0.212) | 0.613 |
|
Inorg-Mn | −0.108 | (−0.378 to
0.178) | 0.458 |
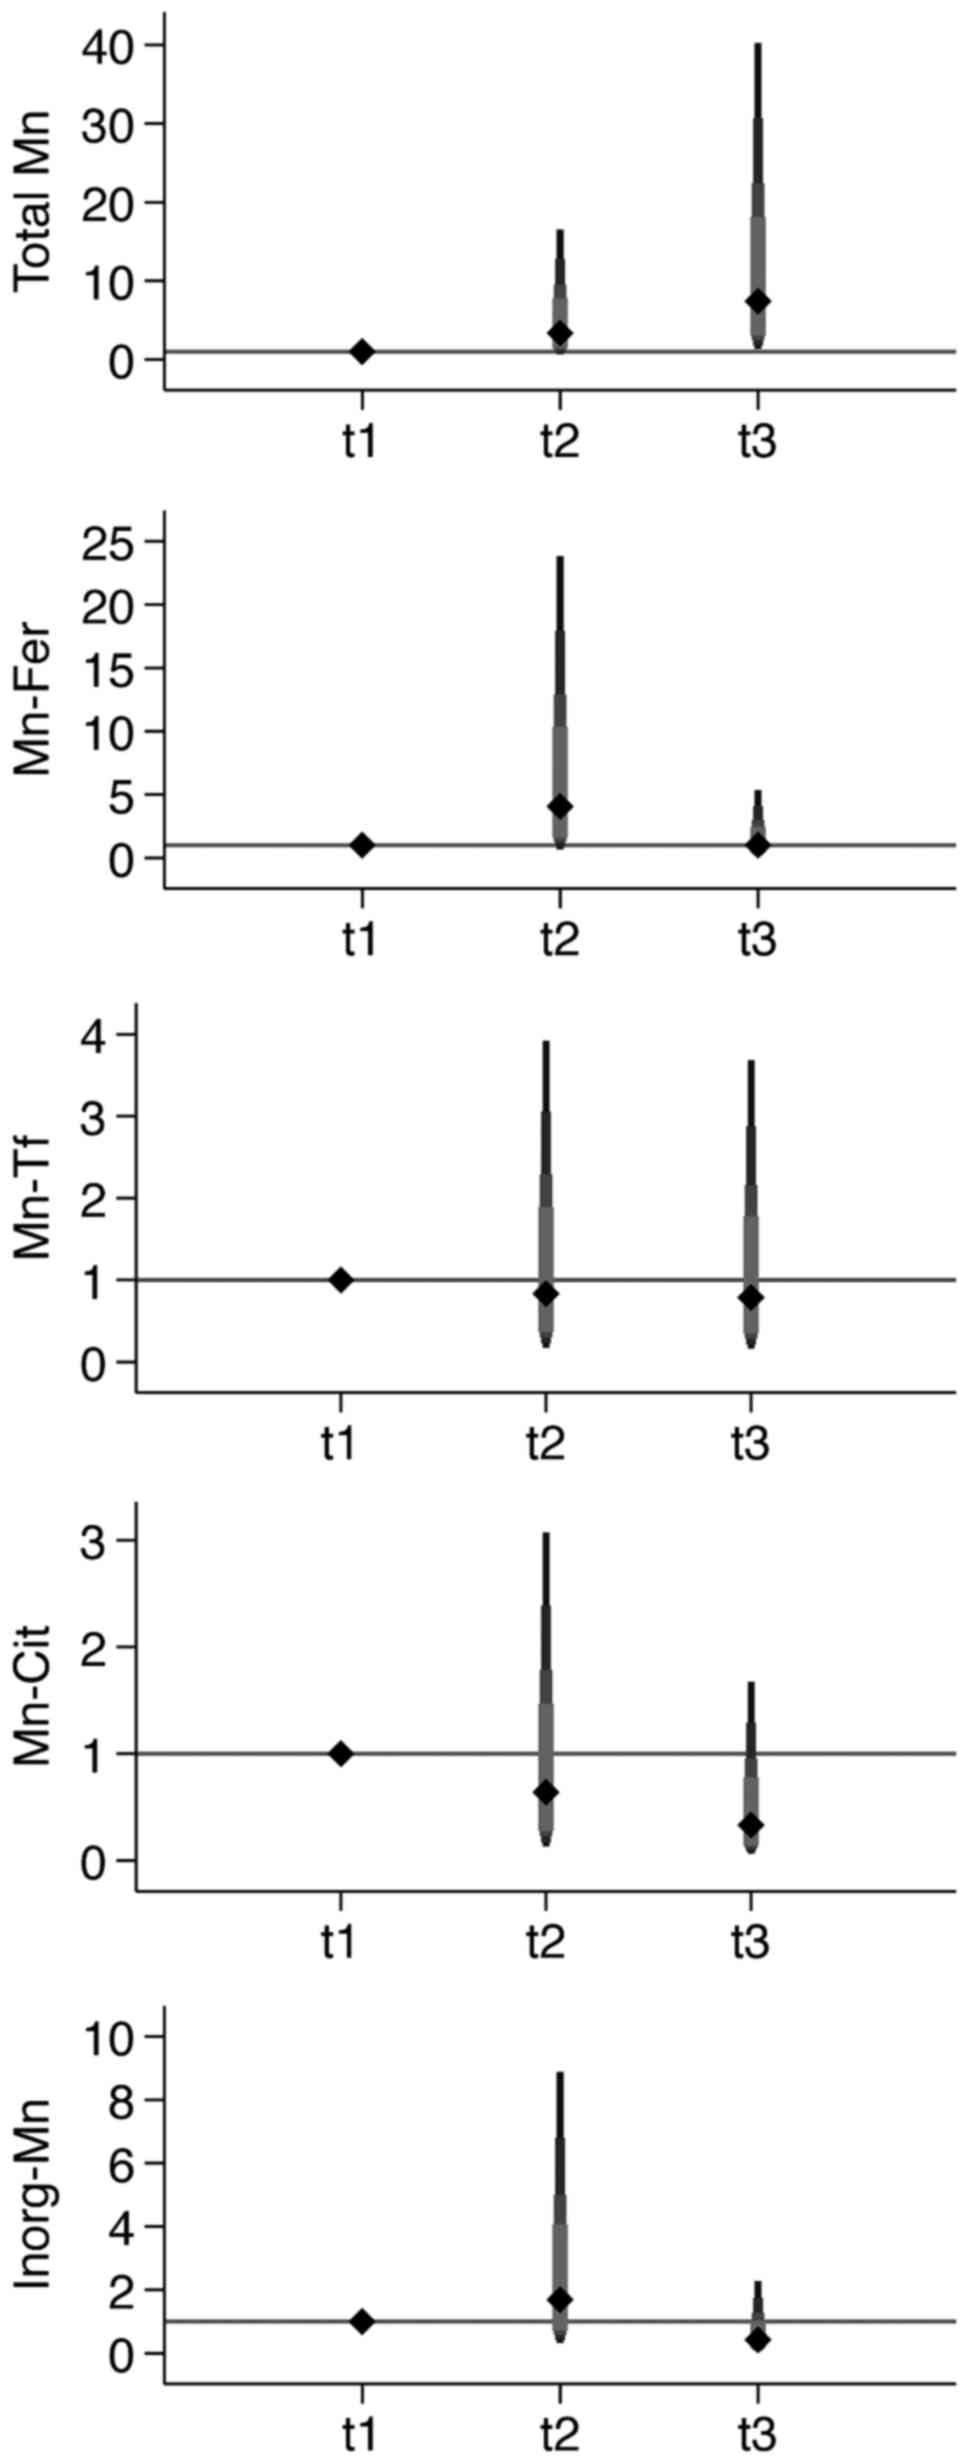
OR of having serum levels of Mn species above the
median value for increasing PM10 tertile are shown in
Table VI, Fig. 2. For total Mn, OR increased with
increasing PM10 tertiles. When Mn species were
considered, Mn-Fer and Inorg-Mn showed an increased OR in the
intermediate category, but a decreased risk in the highest
category, while Mn-Tf and Mn-Cit showed a decreased OR in both
intermediate and highest categories.
| Table VI.Odds ratios (ORs) and 95% confidence
intervals (CI) for having Mn species above the median value and
increasing tertiles of estimated PM10. Median estemated
PM10 values (µg/m3) for each tertile and
median value (µg/l) for each Mn species is reported for each
tertile. |
Table VI.
Odds ratios (ORs) and 95% confidence
intervals (CI) for having Mn species above the median value and
increasing tertiles of estimated PM10. Median estemated
PM10 values (µg/m3) for each tertile and
median value (µg/l) for each Mn species is reported for each
tertile.
|
| PM10
tertiles (median) |
|
|---|
|
|
|
|
|---|
|
| I (11.06) | II (14.22) | III (18.37) | P
trende |
|---|
| Total Mn |
|
|
|
|
|
Median | 2.05 | 2.37 | 2.46 |
| Crude
model | 1.00 | 3.09
(0.73–12.98) | 5.28
(1.20–23.32) | 0.105 |
|
Adjusted modela | 1.00 | 2.78
(0.60–12.90) | 5.43
(1.15–25.91) | 0.124 |
|
Adjusted modelb | 1.00 | 2.91
(0.62–13.76) | 5.47
(1.15–25.91) | 0.118 |
|
Adjusted modelc | 1.00 | 3.46
(0.69–17.26) | 7.54
(1.37–41.57) | 0.085 |
|
Adjusted modeld | 1.00 | 3.35
(0.68–16.53) | 7.40
(1.36–40.25) | 0.094 |
| Mn-Fer |
|
|
|
|
|
Median | 0.23 | 0.40 | 0.25 |
| Crude
model | 1.00 | 1.87
(0.47–7.53) | 0.87
(0.22–3.45) | 0.101 |
|
Adjusted modela | 1.00 | 3.07
(0.61–15.48) | 0.80
(0.17–3.83) | 0.200 |
|
Adjusted modelb | 1.00 | 3.21
(0.63–16.37) | 0.80
(0.16–3.88) | 0.203 |
|
Adjusted modelc | 1.00 | 3.76
(0.70–20.15) | 0.97
(0.19–5.04) | 0.262 |
|
Adjusted modeld | 1.00 | 4.06
(0.69–23.82) | 1.01
(0.19–5.35) | 0.268 |
| Mn-Tf |
|
|
|
|
|
Median | 0.76 | 0.79 | 0.75 |
| Crude
model | 1.00 | 0.89
(0.23–3.49) | 0.89
(0.23–3.49) | 0.996 |
|
Adjusted modela | 1.00 | 0.88
(0.20–4.00) | 0.86
(0.20–3.74) | 0.713 |
|
Adjusted modelb | 1.00 | 0.96
(0.20–4.54) | 0.85
(0.19–3.82) | 0.636 |
|
Adjusted modelc | 1.00 | 0.90
(0.18–4.42) | 0.76
(0.16–3.74) | 0.704 |
|
Adjusted modeld | 1.00 | 0.83
(0.18–3.92) | 0.79
(0.17–3.68) | 0.754 |
| Mn-Cit |
|
|
|
|
|
Median | 0.71 | 0.54 | 0.49 |
| Crude
model | 1.00 | 0.70
(0.18–2.77) | 0.54
(0.14–2.17) | 0.117 |
|
Adjusted modela | 1.00 | 0.81
(0.19–3.50) | 0.52
(0.12–2.19) | 0.099 |
|
Adjusted modelb | 1.00 | 0.72
(0.16–3.26) | 0.51
(0.12–2.21) | 0.081 |
|
Adjusted modelc | 1.00 | 0.59
(0.13–2.79) | 0.35
(0.07–1.73) | 0.030 |
|
Adjusted modeld | 1.00 | 0.64
(0.13–3.07) | 0.33
(0.07–1.67) | 0.022 |
| Inorg-Mn |
|
|
|
|
|
Median | 0.45 | 0.23 | 0.08 |
| Crude
model | 1.00 | 0.90
(0.23–3.58) | 0.42
(0.10–1.70) | 0.312 |
|
Adjusted modela | 1.00 | 1.43
(0.30–6.76) | 0.34
(0.07–1.64) | 0.240 |
|
Adjusted modelb | 1.00 | 1.34
(0.27–6.53) | 0.33
(0.07–1.60) | 0.207 |
|
Adjusted modelc | 1.00 | 1.66
(0.32–8.68) | 0.46
(0.09–2.42) | 0.400 |
|
Adjusted modeld | 1.00 | 1.69
(0.32–8.88) | 0.42
(0.08–2.29) | 0.339 |
Discussion
An adequate assessment of Mn exposure is an
important public health issue, for which evidence is still rather
limited (34–36). Serum total Mn distribution in our
random sample of Modena municipality is similar or slightly higher
than those reported in previous Italian (37–40)
and European adult populations (41–48),
as we found a median/mean value of 2.32/2.68 µg/l, while other
studies reported median/mean values ranging from 0.18 to 3.30 µg/l.
These results also allow to rule out any contamination of our
samples during their collection and management, as frequently
occurred when using serum specimens (49,50),
also taking into account the results of a recent study on healthy
subjects (51).
Interestingly, similarly to our previous findings
(16), we observed a switch in
Mn-carrier from Mn-Tf to Mn-Cit at increasing concentration of
Total Mn (data not shown). Moreover, Mn-Tf demonstrated a stronger
correlation for values below the cut point of 4 µg/l, whereas above
this value it no longer increased, while Mn-Cit showed an opposite
behavior. In accordance with previous studies, the present results
show no significant gender-related difference in serum Mn levels,
despite a slightly higher concentration in males. Similarly to
other studies, no relevant differences in Mn levels were detected
according to age (41,43), BMI (52) or smoking habits of study
participants (41,46,53).
Conversely, the use of Mn-containing supplements seems not to
affect the Mn serum levels, differently from what was expected
(8).
Our study subjects were fasting because the blood
samples were taken in the morning, however, to our knowledge, no
author has described either any influence of an omitted meal on Mn
serum concentration or a circadian variation for the element. In
contrast to the high variation demonstrated by Mn whole blood
concentrations that seemed to be extremely variable which may
preclude it as a viable status indicator (7), serum Mn concentration appeared to be
somewhat sensitive to large variations in Mn intake and response to
dietary intake (8). Moreover,
among the several biomarkers investigated in human studies, only
hair (54,55) and plasma or serum were
representative of Mn average exposure, with corresponding half-life
between 13–37 days of serum Mn levels (3).
The regulation of Mn absorption is very efficient
and appears to be one of the adaptive responses to dietary Mn
intake, and such regulation allows Mn homeostasis to be maintained
over a wide range of intakes (7).
The main food contributors (>5% of the total intake) to Mn
intake in European population and in particular in Northern Italy,
are cereal-based products, vegetables, fruits, fruit products and
beverages (coffee, tea, alcoholic beverages) (4,5). In
our population we did not clearly identify a positive relation
between Mn levels and cereal consumption, while vegetable intake,
especially legumes, and partially dry fruits (nuts), showed a
positive relation. Interestingly, we observed an inverse relation
of Mn serum levels with meat and fish and seafood consumption,
possibly reflecting the influence of iron intake. Consistently,
when we performed a regression model between meat intake and Mn
levels, the inclusion of iron intake in the model toned down the
observed inverse relation (data not shown). Also, serum ferritin
has been noted to be inversely associated with blood Mn
concentration (56). Finally, in
out study tea and chocolate consumption was not associated with the
serum Mn levels, although about one third of the study participants
reported no tea consumption, so weakening our possibility to find
any association.
The assessment of air-Mn in order to evaluate the
influence of air pollution on human Mn exposure and the related
health implications is of relevant and growing interest. Previous
Italian studies, which assessed levels of PM10 air-Mn
using a 24-h personal sampling, reported deficits in olfactory and
motor neuron function in the higher exposed group of both elderly
(57) and adolescents (58), as well an increased risk of asthma
only in the youngest population (35). More recently, in the absence of
facility emissions data for individual study subjects, a US study
used the long-term air measurements available from local air
monitoring stations in order to derive receptor-specific
concentrations of respirable air Mn through total suspended
particulates (TSP), PM10 and PM2.5 (59).
Our results indicate that increasing tertiles of
PM10 exposure are likely to be associated with Mn serum
levels above the median, but only when total Mn is considered.
Similarly, a study carried out in Canada showed that geographic
regions with higher levels of airborne Mn contributed positively to
total Mn blood levels (60) and a
recent study carried out in welders showed that plasma Mn
correlates with air-Mn during occupational exposure (61). However, in the present study the
relation between increasing PM10 tertiles and serum Mn
was less evident when Mn species were considered, especially for
Mn-Cit and Mn-Tf which demonstrated an inverse trend with respect
to total Mn, while Mn-Fer and Inorg-Mn analyses yielded some
evidence of a direct relation but no clear dose-response
association. A possible explanation of these conflicting results
could be associated to the fact that total Mn is not simply the sum
of considered Mn carriers, but it includes additional Mn chemical
forms. Actually, overall Mn in serum could be bound to
α-2-macroglobulin and also to albumin fraction, thus other
non-measured Mn species could be influenced by airborne-Mn and may
explain the positive association highlighted only for total Mn.
A strength of our study for Mn exposure assessment
was the analysis of various Mn species in serum (16). The switch from the overall content
of a trace element to the single speciation analysis is of growing
interest in medicine, due to the different, and in some cases
opposite effects that could be yielded on target tissues by
different species, as previously demonstrated for other trace
elements, i.e., aluminium, lead and selenium (17,62–64)
and recently for Mn (65,66). Finally, the reliability of results
did not appear to be affected by the values below the LOD, as shown
by the sensitivity analyses.
This study has some limitations. First, dietary
information was collected with self-administered questionnaires
that although validated for the Northern Italian population
(67), may still carry some
inaccuracies and induce some exposure misclassification. Secondly,
our sample size was small, due to difficulties in recruiting
‘healthy’ volunteers from the general population despite our
efforts, thus, reducing the statistical power of the study,
especially in subgroup analyses, as reflected by the generally wide
CI of the point estimates. However, despite the limited sample
size, the selection of study participants is unlikely to be biased
as extraction was randomly performed and characteristics of
included subjects appeared to be similar to those of the general
Italian population (68,69). Finally, we relied on PM assessment
in outdoor air and not directly on airborne or deposited Mn levels.
However, in a study carried out in Greece, the analysis of size
distribution and composition of airborne particulate matter and
associated Mn in the roadside environment showed that ~1/3 of Mn
content is detected in coarse (i.e., PM10) particles
(70). Furthermore, a similar
study in the Paris region, demonstrated a higher contribution of Mn
in the PM10 fraction, due to road dust resuspension,
break and tire wear, and road wear abrasion (26).
In conclusion, our study is one of the few to assess
the relation between total Mn levels and its species in serum, and
the influence of different sources of exposure. In particular, the
inverse correlation is of interest between meat intake and serum Mn
concentrations, mainly Mn-Fer, probably due to the associated
changes in iron intake. Another interesting finding was the
positive correlation between vegetable and fruit intake and Mn
levels, especially Mn-Cit. Finally, results suggest that
PM10 exposure increases total Mn serum levels, while its
relation with the single Mn species was inconsistent.
References
|
1
|
Guo T, Zhang L, Konermann A, Zhou H, Jin F
and Liu W: Manganese superoxide dismutase is required to maintain
osteoclast differentiation and function under static force. Sci
Rep. 5:80162015. View Article : Google Scholar : PubMed/NCBI
|
|
2
|
Lucchini RG, Martin CJ and Doney BC: From
manganism to manganese-induced parkinsonism: A conceptual model
based on the evolution of exposure. Neuromolecular Med. 11:311–321.
2009. View Article : Google Scholar : PubMed/NCBI
|
|
3
|
Williams M, Todd GD, Roney N, Crawford J,
Coles C, McClure PR, Garey JD, Zaccaria K and Citra M:
Toxicological Profile for ManganeseAgency for Toxic Substances and
Disease Registry. Atlanta, GA: 2012
|
|
4
|
Turconi G, Minoia C, Ronchi A and Roggi C:
Dietary exposure estimates of twenty-one trace elements from a
Total Diet Study carried out in Pavia, Northern Italy. Br J Nutr.
101:1200–1208. 2009. View Article : Google Scholar : PubMed/NCBI
|
|
5
|
Carlo Agostoni, Roberto Berni Canani,
Susan Fairweather-Tait, Marina Heinonen, Hannu Korhonen, La
Sébastien Vieille, Rosangela Marchelli, Ambroise Martin, Androniki
Naska, Monika Neuhäuser-Berthold, et al: EFSA NDA Panel (EFSA Panel
on Dietetic Products NaA: Scientific opinion on dietary reference
values for manganese. EFSA J. 11:34192013.
|
|
6
|
Meltzer HM, Brantsaeter AL, Borch-Iohnsen
B, Ellingsen DG, Alexander J, Thomassen Y, Stigum H and Ydersbond
TA: Low iron stores are related to higher blood concentrations of
manganese, cobalt and cadmium in non-smoking, Norwegian women in
the HUNT 2 study. Environ Res. 110:497–504. 2010. View Article : Google Scholar : PubMed/NCBI
|
|
7
|
Institute of Medicine (US) Panel on
Micronutrients (eds): ManganeseDietary Reference Intakes for
Vitamin A, Vitamin K, Arsenic, Boron, Chromium, Copper, Iodine,
Iron, Manganese, Molybdenum, Nickel, Silicon, Vanadium, and Zinc.
National Academies Press; Washington, DC: 2001
|
|
8
|
Greger JL, Davis CD, Suttie JW and Lyle
BJ: Intake, serum concentrations, and urinary excretion of
manganese by adult males. Am J Clin Nutr. 51:457–461.
1990.PubMed/NCBI
|
|
9
|
Cockell KA, Bonacci G and Belonje B:
Manganese content of soy or rice beverages is high in comparison to
infant formulas. J Am Coll Nutr. 23:124–130. 2004. View Article : Google Scholar : PubMed/NCBI
|
|
10
|
Michalke B and Fernsebner K: New insights
into manganese toxicity and speciation. J Trace Elem Med Biol.
28:106–116. 2014. View Article : Google Scholar : PubMed/NCBI
|
|
11
|
Pavilonis BT, Lioy PJ, Guazzetti S,
Bostick BC, Donna F, Peli M, Zimmerman NJ, Bertrand P, Lucas E,
Smith DR, et al: Manganese concentrations in soil and settled dust
in an area with historic ferroalloy production. J Expo Sci Environ
Epidemiol. 25:443–450. 2015. View Article : Google Scholar : PubMed/NCBI
|
|
12
|
Schroeder WH, Dobson M, Kane DM and
Johnson ND: Toxic trace elements associated with airborne
particulate matter: A review. JAPCA. 37:1267–1285. 1987. View Article : Google Scholar : PubMed/NCBI
|
|
13
|
Canepari S, Astolfi ML, Farao C, Maretto
M, Frasca D, Marcoccia M and Perrino C: Seasonal variations in the
chemical composition of particulate matter: A case study in the Po
Valley. Part II: concentration and solubility of micro- and
trace-elements. Environ Sci Pollut Res Int. 21:4010–4022. 2014.
View Article : Google Scholar : PubMed/NCBI
|
|
14
|
Pappas RS, Gray N, Gonzalez-Jimenez N,
Fresquez M and Watson CH: Triple Quad-ICP-MS measurement of toxic
metals in mainstream cigarette smoke from spectrum research
cigarettes. J Anal Toxicol. 40:43–48. 2016.PubMed/NCBI
|
|
15
|
Freire C, Koifman RJ, Fujimoto D, de
Oliveira Souza VC, Barbosa F Jr and Koifman S: Reference values of
cadmium, arsenic and manganese in blood and factors associated with
exposure levels among adult population of Rio Branco, Acre, Brazil.
Chemosphere. 128:70–78. 2015. View Article : Google Scholar : PubMed/NCBI
|
|
16
|
Michalke B, Aslanoglou L,
Ochsenkühn-Petropoulou M, Bergström B, Berthele A, Vinceti M, Lucio
M and Lidén G: An approach for manganese biomonitoring using a
manganese carrier switch in serum from transferrin to citrate at
slightly elevated manganese concentration. J Trace Elem Med Biol.
32:145–154. 2015. View Article : Google Scholar : PubMed/NCBI
|
|
17
|
Vinceti M, Grill P, Malagoli C, Filippini
T, Storani S, Malavolti M and Michalke B: Selenium speciation in
human serum and its implications for epidemiologic research: A
cross-sectional study. J Trace Elem Med Biol. 31:1–10. 2015.
View Article : Google Scholar : PubMed/NCBI
|
|
18
|
Filippini T, Michalke B, Malagoli C, Grill
P, Bottecchi I, Malavolti M, Vescovi L, Sieri S, Krogh V, Cherubini
A, et al: Determinants of serum cadmium levels in a Northern Italy
community: A cross-sectional study. Environ Res. 150:219–226. 2016.
View Article : Google Scholar : PubMed/NCBI
|
|
19
|
Ebrahim AM, Eltayeb MH, Khalid H, Mohamed
H, Abdalla W, Grill P and Michalke B: Study on selected trace
elements and heavy metals in some popular medicinal plants from
Sudan. J Nat Med. 66:671–679. 2012. View Article : Google Scholar : PubMed/NCBI
|
|
20
|
Jünemann AG, Stopa P, Michalke B, Chaudhri
A, Reulbach U, Huchzermeyer C, Schlötzer-Schrehardt U, Kruse FE,
Zrenner E and Rejdak R: Levels of aqueous humor trace elements in
patients with non-exsudative age-related macular degeneration: A
case-control study. PLoS One. 8:e567342013. View Article : Google Scholar : PubMed/NCBI
|
|
21
|
Pala V, Sieri S, Palli D, Salvini S,
Berrino F, Bellegotti M, Frasca G, Tumino R, Sacerdote C, Fiorini
L, et al: Diet in the Italian EPIC cohorts: Presentation of data
and methodological issues. Tumori. 89:594–607. 2003.PubMed/NCBI
|
|
22
|
Malavolti M, Malagoli C, Fiorentini C,
Longo C, Farnetani F, Ricci C, Albertini G, Lanzoni A, Reggiani C,
Virgili A, et al: Association between dietary vitamin C and risk of
cutaneous melanoma in a population of Northern Italy. Int J Vitam
Nutr Res. 83:291–298. 2013. View Article : Google Scholar : PubMed/NCBI
|
|
23
|
Malagoli C, Malavolti M, Agnoli C, Crespi
CM, Fiorentini C, Farnetani F, Longo C, Ricci C, Albertini G,
Lanzoni A, et al: Diet quality and risk of melanoma in an Italian
population. J Nutr. 145:1800–1807. 2015. View Article : Google Scholar : PubMed/NCBI
|
|
24
|
Vinceti M, Rothman KJ, Crespi CM, Sterni
A, Cherubini A, Guerra L, Maffeis G, Ferretti E, Fabbi S, Teggi S,
et al: Leukemia risk in children exposed to benzene and
PM10 from vehicular traffic: A case-control study in an
Italian population. Eur J Epidemiol. 27:781–790. 2012. View Article : Google Scholar : PubMed/NCBI
|
|
25
|
Vinceti M, Malagoli C, Malavolti M,
Cherubini A, Maffeis G, Rodolfi R, Heck JE, Astolfi G, Calzolari E
and Nicolini F: Does maternal exposure to benzene and
PM10 during pregnancy increase the risk of congenital
anomalies? A population-based case-control study. Sci Total
Environ. 541:444–450. 2016. View Article : Google Scholar : PubMed/NCBI
|
|
26
|
Poulakis E, Theodosi C, Bressi M, Sciare
J, Ghersi V and Mihalopoulos N: Airborne mineral components and
trace metals in Paris region: Spatial and temporal variability.
Environ Sci Pollut Res Int. 22:14663–14672. 2015. View Article : Google Scholar : PubMed/NCBI
|
|
27
|
Li Z, Hopke PK, Husain L, Qureshi S,
Dutkiewicz VA, Schwab JJ, Drewnick F and Demerjian KL: Sources of
fine particle composition in New York city. Atmos Environ.
38:6521–6529. 2004. View Article : Google Scholar
|
|
28
|
Vinceti M, Malagoli C, Teggi S, Fabbi S,
Goldoni C, De Girolamo G, Ferrari P, Astolfi G, Rivieri F and
Bergomi M: Adverse pregnancy outcomes in a population exposed to
the emissions of a municipal waste incinerator. Sci Total Environ.
407:116–121. 2008. View Article : Google Scholar : PubMed/NCBI
|
|
29
|
Benson PE: Caline 4 - A dispersion model
for predicting air pollution concentration near roadwaysDepartment
of Transportation, Division of New Technology and Research.
Sacramento, CA: 1989
|
|
30
|
Drufuca A, Battaiotto S, Bengo I, Rossi D
and Torriani L: Variante Generale al Piano Territoriale di
Coordinamento Provinciale. Procedura di simulazione della mobilità
delle personeProvincia di Modena-Polinomia. Milan: 2007, (In
Italian).
|
|
31
|
Willett WC: Nutritional epidemiology. 3rd.
Oxford University Press; New York: 2013
|
|
32
|
Long JS: Regression models for categorical
and limited dependent variables. 7. Sage Publications, Inc.;
Thousand Oaks: 1997
|
|
33
|
Helsel DR: More than obvious: Better
methods for interpreting nondetect data. Environ Sci Technol.
39:419A–423A. 2005. View Article : Google Scholar : PubMed/NCBI
|
|
34
|
Zoni S and Lucchini RG: Manganese
exposure: Cognitive, motor and behavioral effects on children: A
review of recent findings. Curr Opin Pediatr. 25:255–260. 2013.
View Article : Google Scholar : PubMed/NCBI
|
|
35
|
Rosa MJ, Benedetti C, Peli M, Donna F,
Nazzaro M, Fedrighi C, Zoni S, Marcon A, Zimmerman N, Wright R, et
al: Association between personal exposure to ambient metals and
respiratory disease in Italian adolescents: A cross-sectional
study. BMC Pulm Med. 16:62016. View Article : Google Scholar : PubMed/NCBI
|
|
36
|
Vollet K, Haynes EN and Dietrich KN:
Manganese exposure and cognition across the lifespan: Contemporary
review and argument for biphasic dose-response health effects. Curr
Environ Health Rep. 3:392–404. 2016. View Article : Google Scholar : PubMed/NCBI
|
|
37
|
Minoia C, Sabbioni E, Apostoli P, Pietra
R, Pozzoli L, Gallorini M, Nicolaou G, Alessio L and Capodaglio E:
Trace element reference values in tissues from inhabitants of the
European community. I. A study of 46 elements in urine, blood and
serum of Italian subjects. Sci Total Environ. 95:89–105. 1990.
View Article : Google Scholar : PubMed/NCBI
|
|
38
|
Caroli S, Alimonti A, Coni E, Petrucci F,
Senofonte O and Violante N: The assessment of reference values for
elements in human biological tissues and fluids: A systematic
review. Crit Rev Anal Chem. 24:363–398. 1994. View Article : Google Scholar
|
|
39
|
Alimonti A, Bocca B, Mannella E, Petrucci
F, Zennaro F, Cotichini R, DIppolito C, Agresti A, Caimi S and
Forte G: Assessment of reference values for selected elements in a
healthy urban population. Ann Ist Super Sanita. 41:181–187.
2005.PubMed/NCBI
|
|
40
|
Bocca B, Mattei D, Pino A and Alimonti A:
Italian network for human biomonitoring of metals: Preliminary
results from two regions. Ann Ist Super Sanita. 46:259–265.
2010.PubMed/NCBI
|
|
41
|
Adamska-Dyniewska H, Trela R, Trojanowska
B and Kowalska G: Serum manganese concentration in healthy
population of the city of Lódź. Acta Physiol Pol. 34:299–303.
1983.PubMed/NCBI
|
|
42
|
Iyengar V and Woittiez J: Trace elements
in human clinical specimens: Evaluation of literature data to
identify reference values. Clin Chem. 34:474–481. 1988.PubMed/NCBI
|
|
43
|
Nève J and Leclercq N: Factors affecting
determinations of manganese in serum by atomic absorption
spectrometry. Clin Chem. 37:723–728. 1991.PubMed/NCBI
|
|
44
|
Kapaki E, Zournas C, Kanias G, Zambelis T,
Kakami A and Papageorgiou C: Essential trace element alterations in
amyotrophic lateral sclerosis. J Neurol Sci. 147:171–175. 1997.
View Article : Google Scholar : PubMed/NCBI
|
|
45
|
Rükgauer M, Klein J and Kruse-Jarres JD:
Reference values for the trace elements copper, manganese,
selenium, and zinc in the serum/plasma of children, adolescents,
and adults. J Trace Elem Med Biol. 11:92–98. 1997. View Article : Google Scholar : PubMed/NCBI
|
|
46
|
Díaz C, López F, Henríquez P, Rodríguez E
and Serra-MaJem L: Serum manganese concentrations in a
representative sample of the Canarian population. Biol Trace Elem
Res. 80:43–51. 2001. View Article : Google Scholar : PubMed/NCBI
|
|
47
|
Forrer R, Gautschi K and Lutz H:
Simultaneous measurement of the trace elements Al, As, B, Be, Cd,
Co, Cu, Fe, Li, Mn, Mo, Ni, Rb, Se, Sr, and Zn in human serum and
their reference ranges by ICP-MS. Biol Trace Elem Res. 80:77–93.
2001. View Article : Google Scholar : PubMed/NCBI
|
|
48
|
Torra M, Rodamilans M and Corbella J:
Biological monitoring of environmental exposure to manganese in
blood samples from residents of the city of Barcelona, Spain. Sci
Total Environ. 289:237–241. 2002. View Article : Google Scholar : PubMed/NCBI
|
|
49
|
Baruthio F, Guillard O, Arnaud J, Pierre F
and Zawislak R: Determination of manganese in biological materials
by electrothermal atomic absorption spectrometry: A review. Clin
Chem. 34:227–234. 1988.PubMed/NCBI
|
|
50
|
Yiin SJ, Lin HY, Yang MH, Shih TS and Lin
TH: Pre-analytical for biological monitoring of manganese.
Kaohsiung J Med Sci. 14:161–167. 1998.PubMed/NCBI
|
|
51
|
Hodnett D, Wood DM, Raja K, Dargan PI and
Shah AD: A healthy volunteer study to investigate trace element
contamination of blood samples by stainless steel venepuncture
needles. Clin Toxicol (Phila). 50:99–107. 2012. View Article : Google Scholar : PubMed/NCBI
|
|
52
|
Sánchez C, López-Jurado M, Aranda P and
Llopis J: Plasma levels of copper, manganese and selenium in an
adult population in southern Spain: Influence of age, obesity and
lifestyle factors. Sci Total Environ. 408:1014–1020. 2010.
View Article : Google Scholar : PubMed/NCBI
|
|
53
|
Meltzer HM, Alexander J, Brantsæter AL,
Borch-Iohnsen B, Ellingsen DG, Thomassen Y, Holmen J and Ydersbond
TA: The impact of iron status and smoking on blood divalent metal
concentrations in Norwegian women in the HUNT2 Study. J Trace Elem
Med Biol. 38:165–173. 2016. View Article : Google Scholar : PubMed/NCBI
|
|
54
|
Eastman RR, Jursa TP, Benedetti C,
Lucchini RG and Smith DR: Hair as a biomarker of environmental
manganese exposure. Environ Sci Technol. 47:1629–1637.
2013.PubMed/NCBI
|
|
55
|
Reiss B, Simpson CD, Baker MG, Stover B,
Sheppard L and Seixas NS: Hair manganese as an exposure biomarker
among welders. Ann Occup Hyg. 60:139–149. 2016. View Article : Google Scholar : PubMed/NCBI
|
|
56
|
Kim Y, Lobdell DT, Wright CW, Gocheva VV,
Hudgens E and Bowler RM: Blood metal concentrations of manganese,
lead, and cadmium in relation to serum ferritin levels in Ohio
residents. Biol Trace Elem Res. 165:1–9. 2015. View Article : Google Scholar : PubMed/NCBI
|
|
57
|
Lucchini RG, Guazzetti S, Zoni S,
Benedetti C, Fedrighi C, Peli M, Donna F, Bontempi E, Borgese L,
Micheletti S, et al: Neurofunctional dopaminergic impairment in
elderly after lifetime exposure to manganese. Neurotoxicology.
45:309–317. 2014. View Article : Google Scholar : PubMed/NCBI
|
|
58
|
Lucchini RG, Guazzetti S, Zoni S, Donna F,
Peter S, Zacco A, Salmistraro M, Bontempi E, Zimmerman NJ and Smith
DR: Tremor, olfactory and motor changes in Italian adolescents
exposed to historical ferro-manganese emission. Neurotoxicology.
33:687–696. 2012. View Article : Google Scholar : PubMed/NCBI
|
|
59
|
Colledge MA, Julian JR, Gocheva VV,
Beseler CL, Roels HA, Lobdell DT and Bowler RM: Characterization of
air manganese exposure estimates for residents in two Ohio towns. J
Air Waste Manag Assoc. 65:948–957. 2015. View Article : Google Scholar : PubMed/NCBI
|
|
60
|
Baldwin M, Mergler D, Larribe F, Bélanger
S, Tardif R, Bilodeau L and Hudnell K: Bioindicator and exposure
data for a population based study of manganese. Neurotoxicology.
20:343–353. 1999.PubMed/NCBI
|
|
61
|
Hoet P, Vanmarcke E, Geens T, Deumer G,
Haufroid V and Roels HA: Manganese in plasma: A promising biomarker
of exposure to Mn in welders. A pilot study. Toxicol Lett.
213:69–74. 2012. View Article : Google Scholar : PubMed/NCBI
|
|
62
|
Michalke B, Halbach S and Nischwitz V: JEM
spotlight: Metal speciation related to neurotoxicity in humans. J
Environ Monit. 11:939–954. 2009. View Article : Google Scholar : PubMed/NCBI
|
|
63
|
Vinceti M, Solovyev N, Mandrioli J, Crespi
CM, Bonvicini F, Arcolin E, Georgoulopoulou E and Michalke B:
Cerebrospinal fluid of newly diagnosed amyotrophic lateral
sclerosis patients exhibits abnormal levels of selenium species
including elevated selenite. Neurotoxicology. 38:25–32. 2013.
View Article : Google Scholar : PubMed/NCBI
|
|
64
|
Vinceti M, Ballotari P, Steinmaus C,
Malagoli C, Luberto F, Malavolti M and Rossi Giorgi P: Long-term
mortality patterns in a residential cohort exposed to inorganic
selenium in drinking water. Environ Res. 150:348–356. 2016.
View Article : Google Scholar : PubMed/NCBI
|
|
65
|
Neth K, Lucio M, Walker A, Kanawati B,
Zorn J, Schmitt-Kopplin P and Michalke B: Diverse serum manganese
species affect brain metabolites depending on exposure conditions.
Chem Res Toxicol. 28:1434–1442. 2015. View Article : Google Scholar : PubMed/NCBI
|
|
66
|
Michalke B: Review about the manganese
speciation project related to neurodegeneration: An analytical
chemistry approach to increase the knowledge about manganese
related parkinsonian symptoms. J Trace Elem Med Biol. 37:50–61.
2016. View Article : Google Scholar : PubMed/NCBI
|
|
67
|
Pasanisi P, Berrino F, Bellati C, Sieri S
and Krogh V: Validity of the Italian EPIC questionnaire to assess
past diet. IARC Sci Publ. 156:41–44. 2002.PubMed/NCBI
|
|
68
|
Ferrante G, Minardi V, Possenti V,
Quarchioni E, Masocco M, Salmaso S, Braggion M, Campostrini S and
Baldissera S: Gruppo Tecnico PASSI: Smoke: Prevalence is
decreasing, but the gap between socioeconomic categories remains.
Epidemiol Prev. 36:3712012.PubMed/NCBI
|
|
69
|
Gruppo Tecnico PASSI Emilia-Romagna:
Sovrappeso e obesità in Emilia-Romagna: dati del sistema di
sorveglianza PASSI (anni 2008–2011). 2012.http://www.epicentro.iss.it/passi/pdf2012/EccessoPond_PassiER_08_11.pdf(In
Italian).
|
|
70
|
Samara C and Voutsa D: Size distribution
of airborne particulate matter and associated heavy metals in the
roadside environment. Chemosphere. 59:1197–1206. 2005. View Article : Google Scholar : PubMed/NCBI
|