Introduction
Chronic myelogenous leukemia (CML) is a type of
myeloproliferative neoplasm predominantly characterized by
uncontrolled growth of myeloid cells in the bone marrow and blood.
It has an incidence of 1–2 cases per 100,000 adults, and accounts
for ~15% of all adult leukemia (1,2). CML
is composed of three distinct disease phases: An initial chronic
phase (CP), an intermediate accelerated phase, and a terminal blast
phase (BP) (3). In total, ~90% of
patients are diagnosed during the CP. The transition from CP to BP
may occur as quickly as 3 years. The median survival rate is 3–6
months for CML patients in the BP without any treatment (4). The pathogenesis of CML has been
well-described since 1960 (5). It
is caused by a chromosomal translocation known as the Philadelphia
chromosome (Ph). This genetic translocation occurs between the
Abelson murine leukemia (ABL) gene located in chromosome 9
and the breakpoint cluster region (BCR) gene in chromosome
22, resulting in a fusion gene called BCR-ABL (6). The fused gene expresses an
oncoprotein with a constitutively active tyrosine kinase that
promotes cell growth and replication via regulating downstream
pathways, including RAS, rapidly accelerated fibrosarcoma kinases,
c-Jun N-terminal kinases, v-myc avian myelocytomatosis viral
oncogene homolog and signal transducer and activator of
transcription (STAT), resulting in the development of disease
(7–11). Additional complex translocations
have been reported in 5–8% patients with CML, excluding chromosomes
9 and 22. A t(3;9;22) 3-way translocation has been observed in
patients with CML, who tend to have an aggressive stage and a poor
outcome (12).
Patients with CML have multiple treatment options,
including commercially available tyrosine kinase inhibitors (TKIs),
omacetaxine, which inhibits protein synthesis, and several
conventional anti-cancer agents (13). Allogeneic stem cell transplantation
is a potential final option prior to CML progression, despite a
high risk of mortality. However, its implementation depends on the
status of patients and the identification of an appropriate stem
cell donor (14). These
therapeutic methods have improved the 10-year overall survival rate
to 80–90% (1,15). The majority of patients respond to
first-line drug therapy; however, treatment failure still occurs in
certain cases due to resistance and intolerance (16). Therefore, drug resistance is a
current challenge faced by scientists and patients. It is critical
to continue the identification of novel drug targets for patients
with CML. Understanding the underlying mechanisms of drug
resistance is also an emergent issue for researchers.
In the present study, the critical genes responsible
for resistance of a conventional drug named cyclophosphamide were
identified in patients with CML. Cyclophosphamide remains one of
the most commonly used chemotherapy drug, 50 years subsequent to
its synthesis. It is used as a single agent or in combination with
other agents for multiple diseases, including solid tumors,
hematologic malignancies, autoimmune disorders, stem-cell
mobilization, and immunosuppression for blood and marrow
transplantation (17). In spite of
its wide therapeutic application, little is known about the
mechanisms underlying the acquired resistance that is frequently
observed in patients. In the present study, an Affymetrix microchip
was used to identify differentially expressed genes between
sensitive and resistant cells in response to treatment with
cyclophosphamide. Analysis of KEGG pathways and protein-protein
interactions was subsequently performed to reveal the potential
factors mediating cyclophosphamide resistance in CML.
Materials and methods
Data collection
The Gene Expression Omnibus (GEO) database
(www.ncbi.nlm.nih.gov/geo) was searched
and microarray expression data (GSE7114) was obtained for two
groups of chronic myelogenous leukemia cell lines that are either
sensitive or resistant to cyclophosphamide treatment. The parental
sensitive cell line was KBM-7/B5 and its
4-hydroperoxycyclophosphamide (4-HC)-resistant subline was B5-180.
Each group had 5 biological replicates. Unprocessed data sets (.cel
files) were collected for further analysis. The Affymetrix Human
Genome U95 Version 2 Array was used in the experiments (Affymetrix;
Thermo Fisher Scientific, Inc., Waltham, MA, USA). The probe
annotation files were downloaded accordingly for further
research.
Data processing and filtering
Several algorithms have been developed to quantify
the microarray signal. GCRMA (version 2.36.0) (18) was used in the present study. The
normalization process consisted of three steps: Model-based
background correction, quantile normalization and summarizing.
In order to filter out uninformative data including
control probe sets and other internal controls, as well as removing
genes which were expressed uniformly close to background detection
levels, the nsFilter function of the genefilter package (19) in R language was used. However, this
filter does not remove probe sets without Entrez Gene identifiers
or that have identical Entrez Gene identifiers.
Differentially-expressed gene (DEG)
analysis
Statistical comparisons were performed between the
sensitive and the resistant groups in response to cyclophosphamide
treatment. Limma (20) in R
language was applied to identify the differential expression of the
comparison. For probes with identical Entrez Gene identifiers, only
those probes that occupied the largest variance were kept for
further DEG analysis. Only those genes with a log2 (fold
change) >1 and adjusted P-value <0.01 were recognized as
significantly differentially expressed between the two sample
groups. The adjusted P-value was obtained through applying
Benjamini and Hochberg's (BH) false discovery rate correction on
the original P-value, and the fold change threshold was selected
based on the focus of the present study on significantly DEGs.
Hierarchical clustering
Hierarchical clustering (21) was performed to classify the
analyzed samples based on the gene expression profiles.
Hierarchical clustering was performed using DEGs to observe the
global gene expression patterns. The DEGs, which were classified in
specific biological processes (GO terms) and KEGG pathway analysis,
were further extracted and the expression pattern of those DEGs was
characterized. The resultant heatmaps for the DEGs were classified
as targeted biological processes or KEGG pathways using R
package.
GO and KEGG pathway analysis
The R packages GO.db (22), KEGG.db (23) and KEGGREST (24) were utilized to detect Gene Ontology
categories and KEGG pathways with significant overrepresentation in
DEGs compared with the whole genome. The significantly enriched
biological processes were identified as P<0.01. For KEGG pathway
analysis, the P-value was set to <0.05.
Construction of biological
network
Protein-protein interaction (PPI) databases were
downloaded from the HPRD (25),
BIOGRID (26), and PIP (27) databases. The pair interactions,
which were included in any of the three databases, were selected to
be included in the curated PPI database of the present study. As a
result, 561,405 pair interactions were collected in this database.
Cytoscape (28) was utilized to
construct a PPI network. Interacting gene pairs existing in this
curated PPI database were imported as a stored network. Following
functional enrichment analysis, DEGs specified in dramatically
altered biological processes (GO terms) and KEGG pathways were
mapped to the corresponding networks to analyze the
interactions.
Reverse transcription-quantitative
polymerase chain reaction (RT-qPCR)
A total of 5 genes were selected for RT-qPCR, in
order to validate the microarray data. The human CML cell lines
K-562 and KU812, cultured following ATCC's methods, were treated
with 0, 10 or 100 µg/ml 4-HC for 30 min. K-562 was cultured in
ATCC-formulated Iscove's modified Dulbecco's medium (catalog no.
30-2005) supplemented with 10% fetal bovine serum (FBS) and KU812
was cultured in ATCC-formulated RPMI-1640 medium (ATCC 30-2001)
supplemented with 10% FBS. Total RNA was isolated using the RNeasy
Mini kit (Qiagen, Inc., Valencia, CA, USA) according to the
manufacturer's protocol. Following the manufacturer's protocol,
reverse transcription and qPCR were performed using the
High-Capacity cDNA Reverse Transcription kit and SYBR Green PCR
kit, respectively (both Invitrogen; Thermo Fisher Scientific,
Inc.). Results were quantified using the delta Cq method (29). The thermocycling conditions were as
follows: 50°C for 2 min, 1 cycle; 95°C for 10 min, 1 cycle; 95°C 15
sec-> 60°C 30 sec-> 72°C 30 sec, 40 cycles; and finally 72°C
10 min, 1 cycle.
The primer sequences used for PCR amplification were
as follows: Spleen associated tyrosine kinase (SYK) forward,
5′-GTGTCATTCAATCCGTATGAGCC-3′ and reverse,
5′-TTTCGGTCCAGGTAAACCTCC-3′; aldehyde dehydrogenase 2 family
(mitochondrial; ALDH2) forward, 5′-ATGGCAAGCCCTATGTCATCT-3′,
and reverse, 5′-CCGTGGTACTTATCAGCCCA-3′; midkine (neurite
growth-promoting factor 2; MDK) forward,
5′-CGCGGTCGCCAAAAAGAAAG-3′ and reverse,
5′-TACTTGCAGTCGGCTCCAAAC-3′; signal transducer and activator of
transcription 5a (STAT5A) forward,
5′-GCAGAGTCCGTGACAGAGG-3′, and reverse,
5′-CCACAGGTAGGGACAGAGTCT-3′; S100 calcium binding protein A4
(S100A4) forward, 5′-GATGAGCAACTTGGACAGCAA-3′, and reverse,
5′-CTGGGCTGCTTATCTGGGAAG-3′; human 18s forward primer:
5′-GTAACCCGTTGAACCCCATT-3′ and reverse, 5′-CCATCCAATCGGTAGTAGCG-3′.
Gene expression was normalized to 18s.
RNA interference
To investigate the effect of the STAT5A and
S100A4 genes on sensitivity to 4-HC in K-562 cells,
expression of the STAT5A and S100A4 genes was
inhibited by small interfering RNA (siRNA). K-562 cells were seeded
into 6-well plates at 1×10⁵ cells per well and cultured
in medium without antibiotics following ATCC methods. Cells were
transfected following 24 h culture with siRNAs at a final
concentration of 40 nM using Lipofectamine RNAiMAX (Ambion; Thermo
Fisher Scientific, Inc.). Commercially available Silencer Select
Pre-designed siRNAs for STAT5A, S100A4 and a negative
control (Ambion; Thermo Fisher Scientific, Inc.) were used. The
sequences of siRNAs for STAT5A and S100A4 were
5′-ATGGTTTCAGGTTCCACAG-3′ and 5′-TGAGCTTGAACTTGTCACC-3′,
respectively. The sequence for the Control-siRNA was
5′-UAAGGCUAUGAAGAGAUAC-3′. Cells were subsequently collected for
mRNA isolation following transfection for 36 h.
In vitro 4-HC treatment assay
To investigate the inhibition of STAT5A and
S100A4 on sensitivity to 4-HC, K-562 cells (5×10⁴
cells/ml) from each experimental group (siControl, siSTAT5A,
siS100A4) were treated with 0, 10 or 15 µg/ml 4-HC and incubated
for 30 min at 37°C. Following 4-HC treatment, cells were washed
twice with chilled culture medium (RPMI; ATCC 30-2001) with 10%
fetal bovine serum (FBS; ATCC 30-2020), then plated. K-562 cells
were plated in methylcellulose containing 25% FBS or in liquid
culture in RPMI containing 10% FBS. Colonies were counted on day 7
of methylcellulose cultures with an inverted microscope (IX53;
Olympus Corporation, Tokyo, Japan) under ×10 magnification. A total
of three fields were assessed from each group using Olympus
CellSens™ Microscope Imaging Software (Olympus Corporation) to
count the number of cells. The total number of viable cells in
liquid cultures was determined twice within a 7-day period.
Viability was determined using trypan blue exclusion criteria.
Statistical analysis
Data are presented as the mean ± standard deviation.
The statistical significance of the differences between
experimental groups was calculated using GraphPad Instat 3
(GraphPad Software, Inc., La Jolla, CA, USA). A paired t-test was
used for difference analysis between two groups and one-way
analysis of variance was used for the comparison of three or more
groups. P<0.05 was considered to indicate a statistically
significant difference.
Results
DEG analysis
The publicly available microarray dataset GSE7114
was obtained from the GEO database. Comparative analysis was
performed between sensitive groups and resistant groups to identify
genes with significantly differential expression. At
log2 (fold change) >1 and adjusted P-value <0.01,
a total of 258 DEGs were identified, among which 139 DEGs were
upregulated and 119 DEGs were downregulated (Table I). The top 50 upregulated and
downregulated DEGs were listed in Tables II and III, respectively. Several potential
genes connected with cyclophosphamide resistance were identified
from these DEGs, including aldehyde dehydrogenase 1 family member 1
(ALDH1A1), ALDH2, aldo-keto reductase family 1 member B (AKR1B1),
MDK, S100A4 and TIMP metallopeptidase inhibitor 1 (TIMP1). All of
these were previously known to be associated with drug-resistance,
and were primarily functionally linked to drug metabolism, cell
proliferation and the anti-apoptotic process.
 | Table I.Statistical distribution of DEGs. |
Table I.
Statistical distribution of DEGs.
| DEGs | Probe | Gene |
|---|
| Total DEGs | 5885 | 4824 |
| Significantly
DEGsa | 300
(167/133)b | 258
(139/119)b |
| Table II.Top 50 upregulated genes
[log2 (fold change) >1 and adjusted P-value
<0.01]. |
Table II.
Top 50 upregulated genes
[log2 (fold change) >1 and adjusted P-value
<0.01].
| Gene symbol | Log2
(fold change) | Adj. P-value | P-value |
|---|
| ALDH1A1 | 175.23 |
2.12×10⁻¹¹ |
3.38×10⁻¹⁵ |
| LGALS1 | 25.05 |
2.14×10−07 |
6.13×10⁻¹⁰ |
| CTSH | 24.08 |
7.97×10−08 |
1.65×10⁻¹⁰ |
| ALDH2 | 17.36 |
1.20×10⁻¹⁰ |
3.81×10⁻¹⁴ |
| MARCKS | 11.73 |
8.73×10⁻¹⁰ |
4.17×10⁻¹³ |
| RAPGEF2 | 11.72 |
4.00×10−06 |
3.03×10−08 |
| MDK | 11.08 |
1.42×10−05 |
1.89×10−07 |
| ID1 | 10.68 |
4.72×10−07 |
2.18×10−09 |
| FSCN1 | 8.30 |
6.66×10−06 |
6.66×10−08 |
| PMP22 | 8.23 |
1.80×10−07 |
4.29×10⁻¹⁰ |
| SIGLEC6 | 8.19 |
5.37×10−07 |
2.65×10−09 |
| GLRB | 8.06 |
2.62×10−07 |
9.35×10⁻¹⁰ |
| CTSL | 7.66 |
1.27×10−09 |
8.09×10⁻¹³ |
| ANGPT1 | 7.31 |
2.81×10−09 |
3.13×10⁻¹² |
| ITGA2B | 6.93 |
1.07×10−05 |
1.32×10−07 |
| RAB31 | 6.71 |
7.81×10−09 |
9.95×10⁻¹² |
| RUNDC3B | 6.69 |
2.81×10−09 |
3.10×10⁻¹² |
| DUSP6 | 6.30 |
1.07×10−05 |
1.31×10−07 |
| ICAM2 | 6.04 |
4.62×10−06 |
3.87×10−08 |
| KLF1 | 5.91 |
4.66×10−06 |
4.01×10−08 |
| IFI44 | 5.77 |
2.52×10−08 |
4.01×10⁻¹¹ |
| S100A4 | 5.50 |
1.16×10−05 |
1.48×10−07 |
| ACSM3 | 5.47 |
7.74×10−03 |
8.22×10−04 |
| PAX6 | 5.42 |
5.92×10−06 |
5.42×10−08 |
| FYN | 5.40 |
4.00×10−06 |
2.95×10−08 |
| CPVL | 5.17 |
1.04×10−05 |
1.23×10−07 |
| RRAS2 | 5.08 |
1.64×10−08 |
2.35×10⁻¹¹ |
| DLC1 | 5.04 |
4.62×10−06 |
3.90×10−08 |
| YES1 | 5.02 |
4.81×10−05 |
9.20×10−07 |
| LCP2 | 4.89 |
7.20×10−07 |
4.01×10−09 |
| LAT | 4.87 |
2.06×10−06 |
1.35×10-08 |
| TPST2 | 4.84 |
2.59×10−07 |
8.25×10⁻¹⁰ |
| STEAP1 | 4.53 |
6.42×10−06 |
6.03×10−08 |
| KAZN | 4.26 |
7.52×10−07 |
4.53×10−09 |
| CD48 | 4.07 |
1.27×10−04 |
3.48×10−06 |
| IL2RA | 4.04 |
2.84×10−03 |
2.20×10−04 |
| COL2A1 | 4.03 |
3.37×10−04 |
1.28×10−05 |
| TAL1 | 3.98 |
2.82×10−04 |
1.03×10−05 |
| PRAME | 3.96 |
8.47×10−05 |
2.04×10−06 |
| TNFSF10 | 3.91 |
2.71×10−03 |
2.06×10−04 |
| ASS1 | 3.80 |
1.28×10−04 |
3.52×10−06 |
| GUSBP11 | 3.72 |
8.09×10−03 |
8.71×10−04 |
| TIMP1 | 3.61 |
3.34×10−05 |
5.64×10−07 |
| ZHX2 | 3.60 |
6.98×10−05 |
1.60×10−06 |
| STAR | 3.59 |
4.52×10−04 |
1.92×10−05 |
| PHLDA2 | 3.52 |
9.21×10−06 |
1.03×10−07 |
| TSC22D1 | 3.46 |
4.05×10−07 |
1.68×10−09 |
| ID3 | 3.43 |
4.57×10−05 |
8.37×10−07 |
| AKR1B1 | 3.32 |
3.67×10−04 |
1.47×10−05 |
| PICALM | 3.30 |
1.22×10−04 |
3.17×10−06 |
| Table III.Top 50 downregulated genes
[log2 (fold change) <-1 and adjusted P-value
<0.01]. |
Table III.
Top 50 downregulated genes
[log2 (fold change) <-1 and adjusted P-value
<0.01].
| Gene symbol | Log2
(fold change) | Adj. P-value | P-value |
|---|
| PRG2 | 152.01 |
3.48×10−07 |
1.33×10−09 |
| CA2 | 40.15 |
2.14×10−07 |
5.50×10⁻¹⁰ |
| MS4A3 | 33.15 |
6.47×10−07 |
3.30×10−09 |
| PRTN3 | 28.69 |
2.23×10−07 |
6.75×10⁻¹⁰ |
| CST7 | 28.36 |
8.19×10−08 |
1.83×10⁻¹⁰ |
| IL32 | 21.11 |
1.83×10−05 |
2.59×10−07 |
| RNASE2 | 19.05 |
1.51×10−05 |
2.07×10−07 |
| COX7A2 | 17.67 |
3.53×10−07 |
1.41×10−09 |
| CEBPE | 12.49 |
5.32×10−08 |
9.71×10⁻¹¹ |
| EPB41L2 | 8.47 |
4.17×10−07 |
1.86×10−09 |
| AZU1 | 8.13 |
1.84×10−04 |
5.76×10−06 |
| GBE1 | 7.72 |
1.72×10−05 |
2.42×10−07 |
| CCR8 | 7.45 |
1.85×10−05 |
2.66×10−07 |
| CFD | 6.59 |
1.37×10−04 |
3.87×10−06 |
| S100P | 6.49 |
2.31×10−03 |
1.64×10−04 |
| ALOX5AP | 5.59 |
3.28×10−03 |
2.67×10−04 |
| RRAGA | 5.48 |
7.09×10−07 |
3.72×10−09 |
| SRGN | 5.36 |
1.25×10−04 |
3.34×10−06 |
| NDRG1 | 5.06 |
1.28×10−03 |
7.55×10−05 |
| BNIP3 | 4.89 |
3.95×10−03 |
3.44×10−04 |
| TEX30 | 4.81 |
4.00×10−06 |
3.01×10−08 |
| CORO2A | 4.76 |
7.20×10−07 |
4.13×10−09 |
| BPI | 4.75 |
4.71×10−04 |
2.03×10−05 |
| KBTBD11 | 4.35 |
3.92×10−05 |
6.75×10−07 |
| EBP | 4.23 |
1.32×10−05 |
1.74×10−07 |
| SERINC5 | 4.21 |
4.01×10−06 |
3.13×10−08 |
| P4HB | 4.12 |
4.83×10−07 |
2.31×10−09 |
| ITM2A | 4.12 |
6.50×10−05 |
1.45×10−06 |
| RXRA | 4.07 |
4.43×10−04 |
1.87×10−05 |
| ICAM3 | 3.97 |
2.36×10−06 |
1.58×10−08 |
| ATF5 | 3.75 |
2.53×10−04 |
8.87×10−06 |
| WWP1 | 3.60 |
1.26×10−04 |
3.40×10−06 |
| ARFGEF1 | 3.52 |
3.00×10−05 |
4.91×10−07 |
| PRDX2 | 3.42 |
7.52×10−07 |
4.55×10−09 |
| SYK | 3.42 |
2.38×10−05 |
3.67×10−07 |
| MX2 | 3.35 |
2.03×10−05 |
2.97×10−07 |
| LMO2 | 3.25 |
2.78×10−04 |
1.00×10−05 |
| CCNE2 | 3.23 |
3.00×10−03 |
2.39×10−04 |
| DGAT1 | 3.22 |
4.64×10−05 |
8.77×10−07 |
| EFR3A | 3.13 |
7.20×10−07 |
4.11×10−09 |
| PTDSS1 | 3.06 |
1.29×10−05 |
1.69×10−07 |
| HLA-A | 3.00 |
1.92×10−05 |
2.78×10−07 |
| CYB5A | 2.95 |
3.29×10−04 |
1.24×10−05 |
| TNFAIP8 | 2.92 |
2.62×10−07 |
9.34×10⁻¹⁰ |
| PEX2 | 2.92 |
2.45×10−04 |
8.42×10−06 |
| MAD1L1 | 2.88 |
1.72×10−05 |
2.38×10−07 |
| SAT1 | 2.87 |
1.25×10−03 |
7.31×10−05 |
| NCALD | 2.83 |
2.61×10−03 |
1.95×10−04 |
| CEBPD | 2.82 |
6.66×10−06 |
6.54×10−08 |
| IKZF1 | 2.80 |
2.23×10−03 |
1.56×10−04 |
Construction of the biological
network
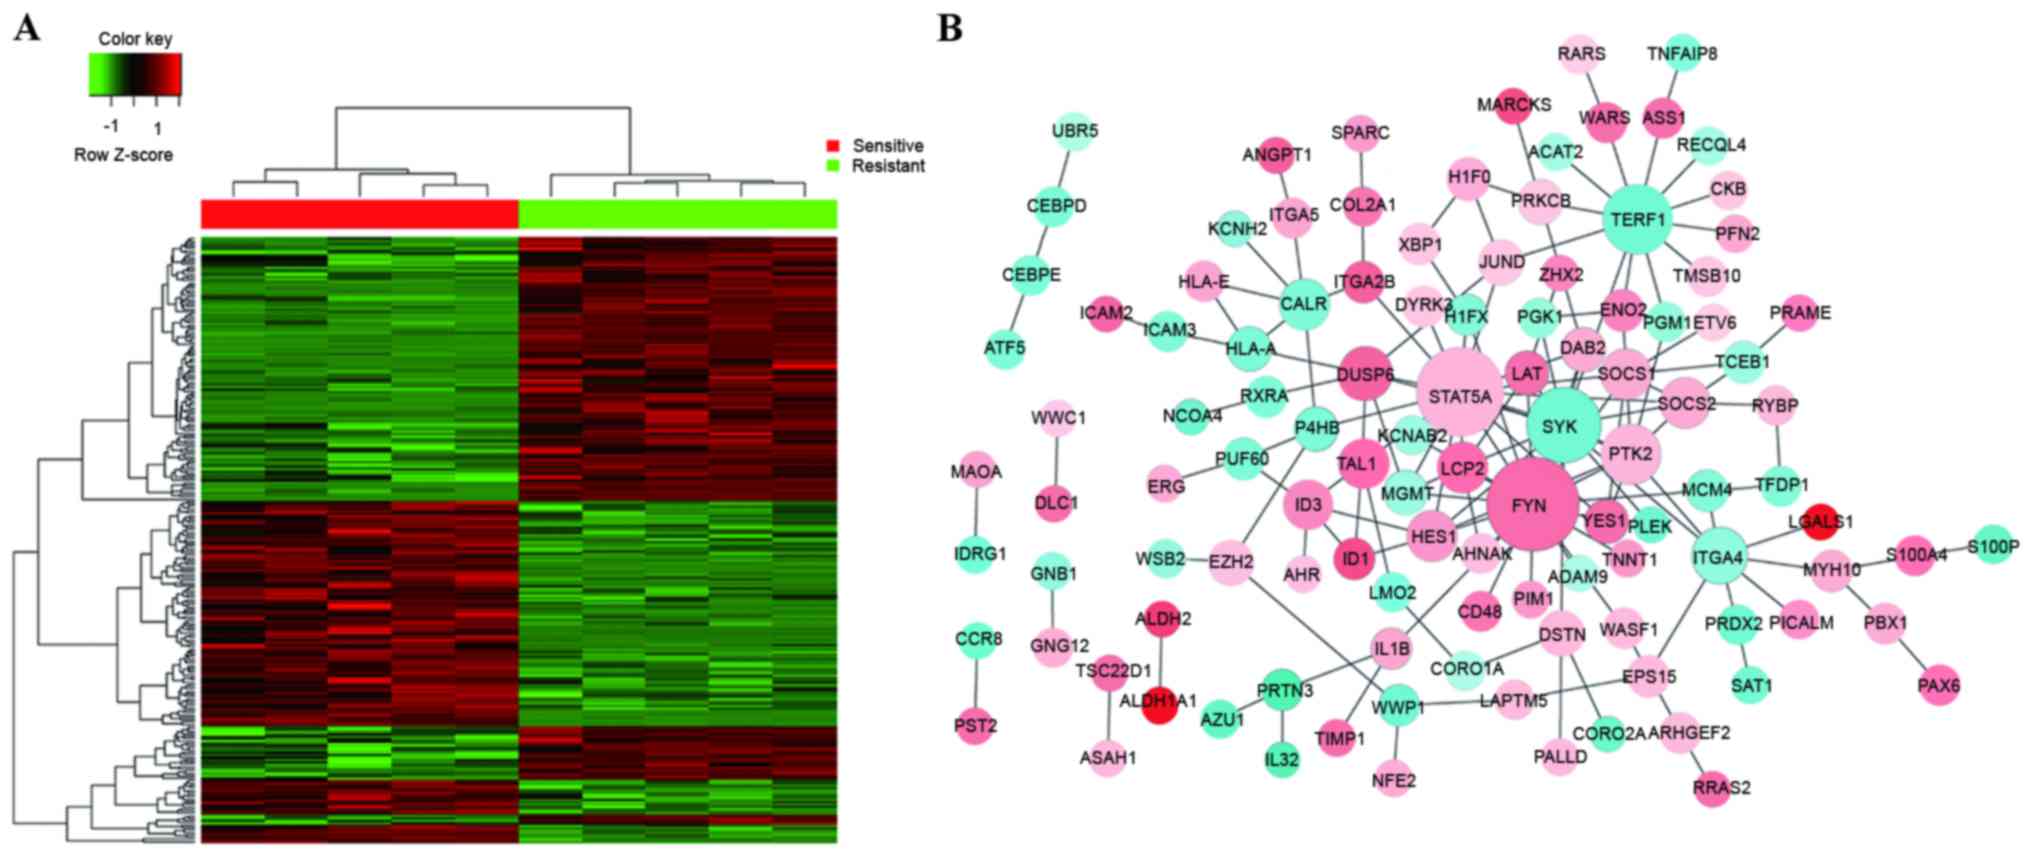
A heatmap of hierarchical clustering of all DEGs was
generated to visualize differential gene expression status between
the sensitive groups and resistant groups (Fig. 1A). In order to further verify the
biological networks, all significantly regulated PPIs identified
from the HPRD, BIOGRID, and PIP databases were utilized to
construct a biological network using cytoscape software. Several
sub-networks were indicated (Fig.
1B). The majority of the proteins were involved in one or more
sub-networks. The three central genes that constituted the hubs of
the network were STAT5A, FYN proto-oncogene, Src family
tyrosine kinase (FYN) and SYK, suggesting that these
may be involved in cyclophosphamide resistance in patients with
CML. As the network of all DEGs was too complex to successfully
elucidate the function of sub-networks, detailed analysis was
required.
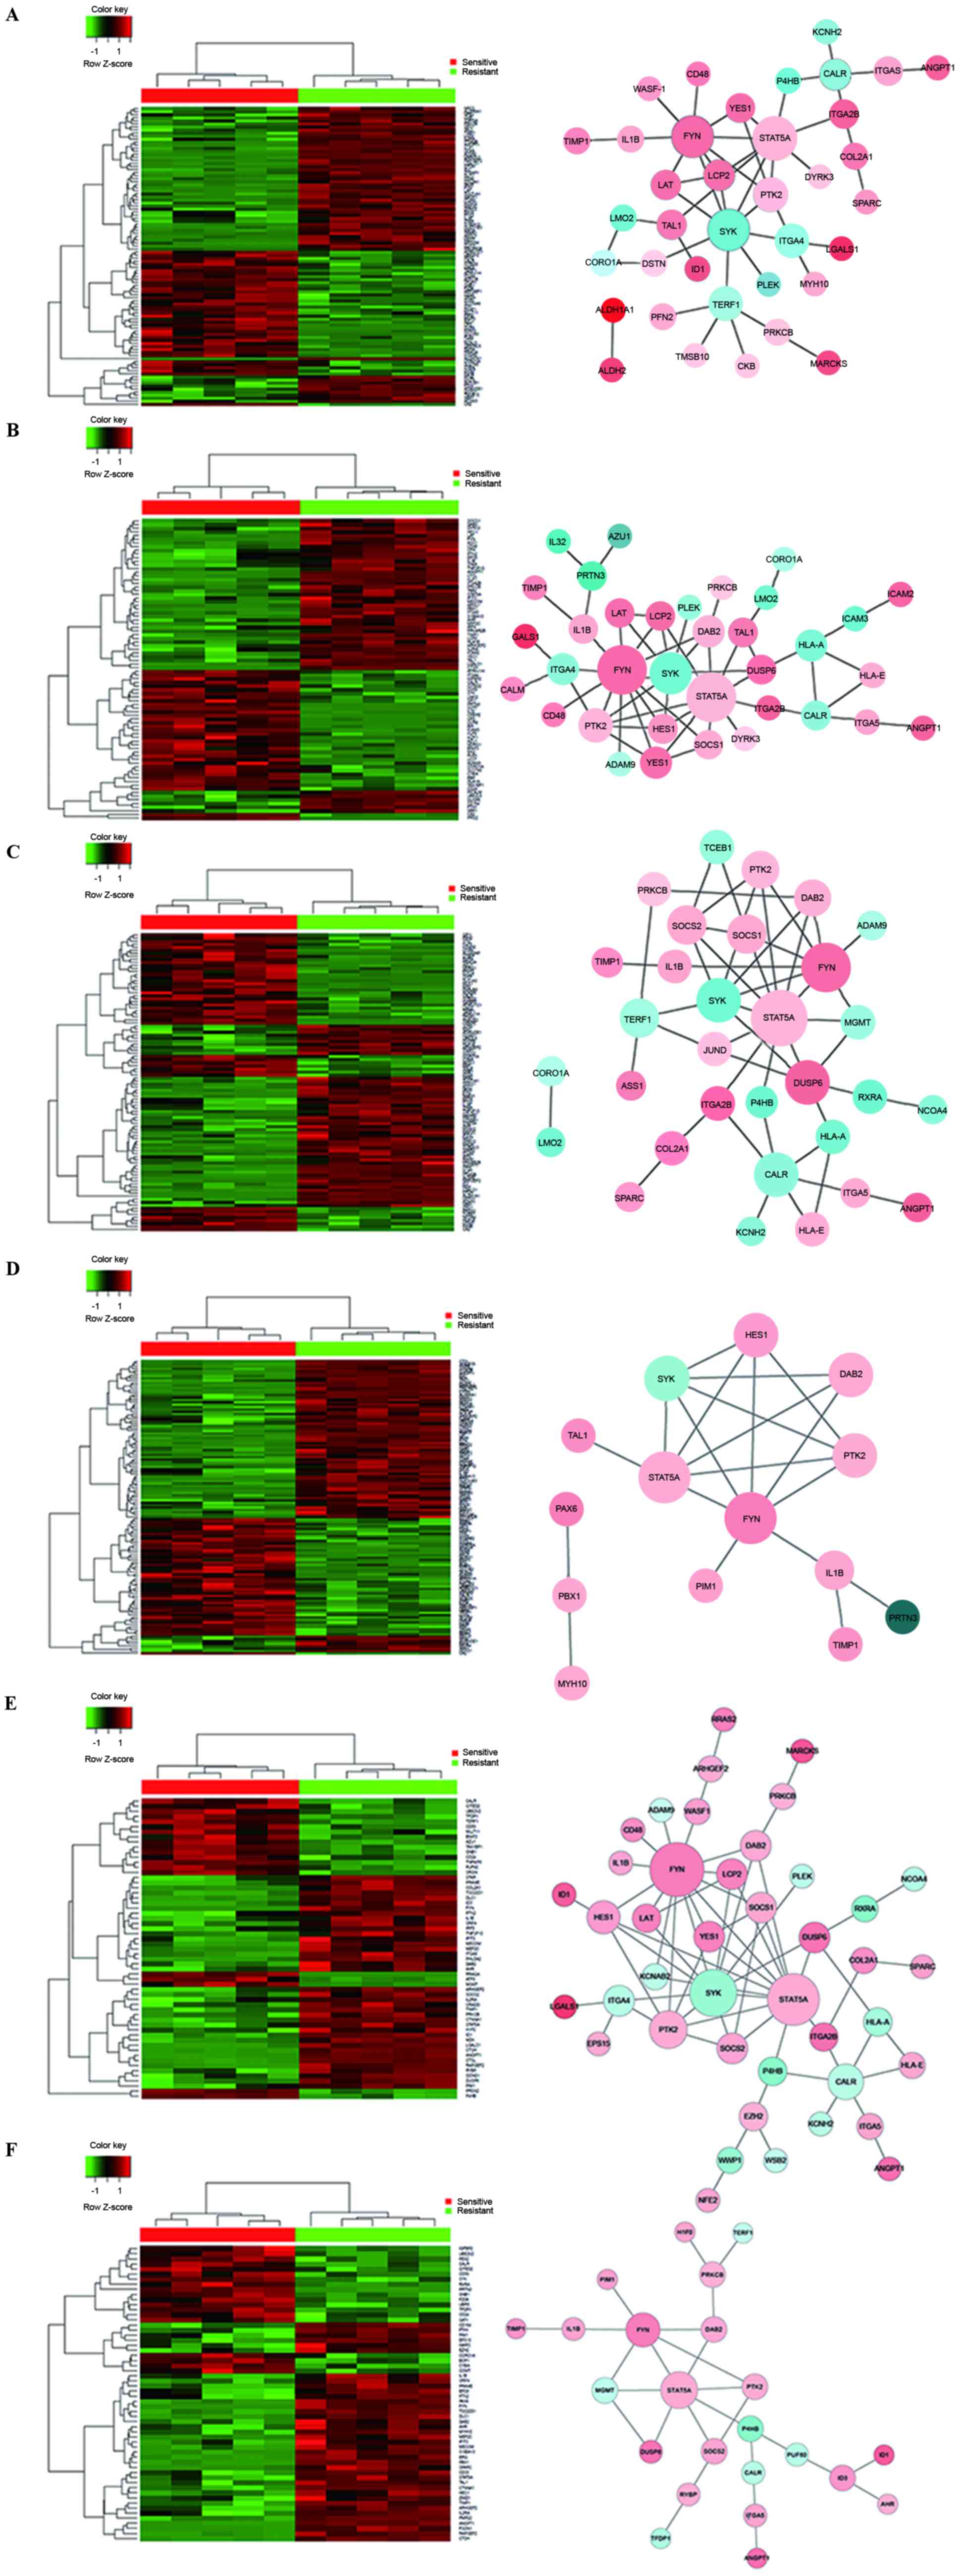
Biological processes analysis
The differentially expressed genes determined by
microarray analysis were subjected to GO and KEGG pathway analysis.
The data were generated based on GO terms with P-values <0.01 to
identify biological processes. A total of 487 biological processes
that were overrepresented by DEGs were identified (Table IV). Table V lists the top six significantly
enriched biological processes, including regulation of biological
quality, immune system process, response to chemicals, apoptotic
process, signaling pathways and cell proliferation. Heatmaps and
biological networks of the six significant biological processes
were generated: Biological quality (Fig. 2A), immune system process (Fig. 2B), response to chemicals (Fig. 2C), signaling pathways (Fig. 2D), apoptotic process (Fig. 2E) and cell proliferation (Fig. 2F). This network analysis identified
a number of potential genes that may be associated with
cyclophosphamide resistance. Therefore, GO analysis provided a
valuable mechanistic insight into cyclophosphamide resistance in
CML cells.
| Table IV.Obtained GO biological processes and
KEGG pathways. |
Table IV.
Obtained GO biological processes and
KEGG pathways.
| Analysis | P-value | No. |
|---|
| GO biological
process | <0.01 | 487 |
| KEGG pathway | <0.05 | 17 |
| Table V.Top six significantly altered GO
biological processes. |
Table V.
Top six significantly altered GO
biological processes.
| GO-BP-ID | P-value | Count | Term |
|---|
| GO:0065008 |
4.09×10⁻¹⁵ | 98 | Regulation of
biological quality |
| GO:0002376 |
4.82×10⁻¹⁵ | 82 | Immune system
process |
| GO:0042221 |
1.70×10⁻¹² | 98 | Response to
chemical |
| GO:0006915 |
2.45×10−09 | 59 | Apoptotic
process |
| GO:0023052 |
1.08×10−08 | 123 | Signaling
pathway |
| GO:0008283 |
1.32×10−08 | 58 | Cell
proliferation |
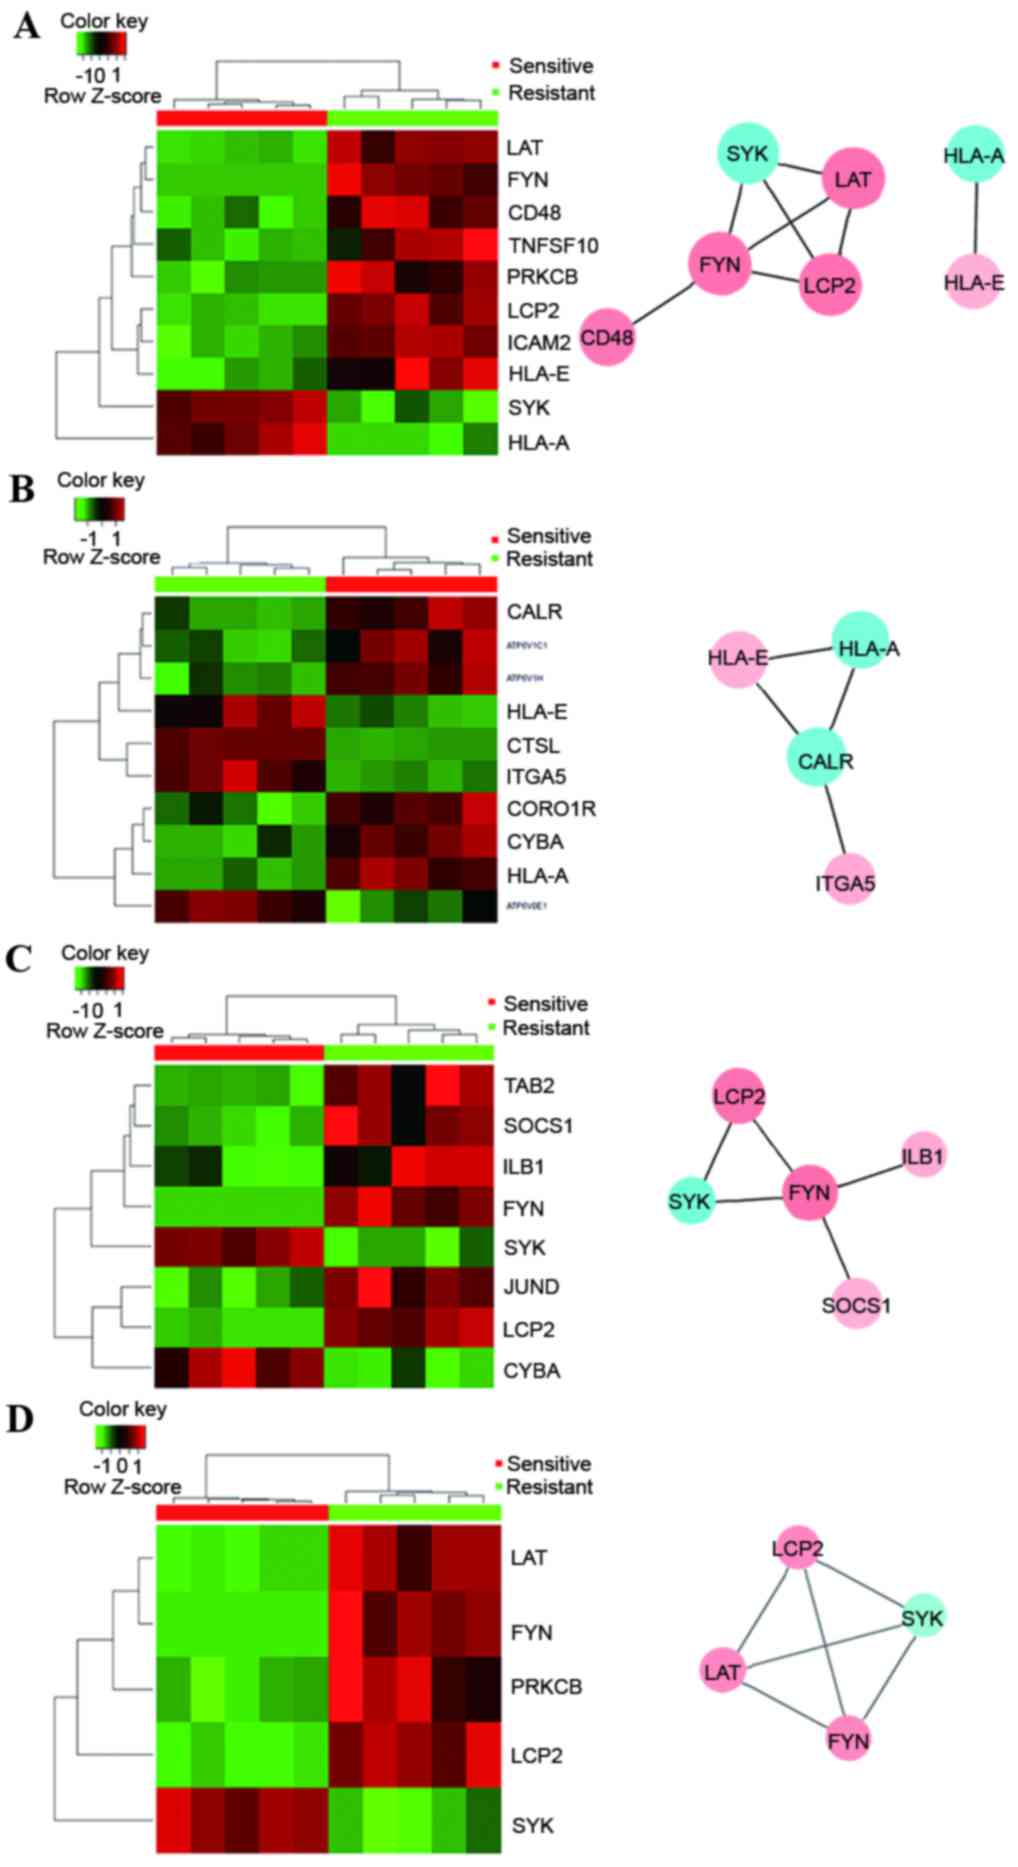
KEGG pathway enrichment of DEGs
For KEGG pathway enrichment analysis, a count >4
and a P-value <0.05 were set as the threshold, and 17 KEGG
pathways were identified (Table
IV). The top significant KEGG pathways were hematopoietic cell
lineage, natural killer cell mediated cytotoxicity, arginine and
proline metabolism, lysosome, phagosome, osteoclast differentiation
and Fc epsilon RI signaling pathway (Table VI). Heatmaps and biological
networks of KEGG pathways were generated, including natural killer
cell mediated cytotoxicity (Fig.
3A), phagosome (Fig. 3B),
osteoclast differentiation (Fig.
3C) and the Fc epsilon RI signaling pathway (Fig. 3D). The major genes identified from
these networks were those involved in the cell cycle,
proliferation, signaling transduction, cell adhesion and the immune
response.
| Table VI.Significantly altered KEGG
pathways. |
Table VI.
Significantly altered KEGG
pathways.
| KEGG-ID | P-value | Count | Term |
|---|
| 04640 |
6.78×10⁻⁴ | 8 | Hematopoietic cell
lineage |
| 04650 |
8.02×10⁻⁴ | 10 | Natural killer cell
mediated Cytotoxicity |
| 00330 |
1.14×10⁻³ | 6 | Arginine and
proline metabolism |
| 04142 |
1.35×10⁻³ | 9 | Lysosome |
| 04145 |
1.97×10⁻³ | 10 | Phagosome |
| 04380 |
7.22×10⁻³ | 8 | Osteoclast
differentiation |
| 04664 |
3.02×10⁻² | 5 | Fc epsilon RI
signaling pathway |
Identification of central genes from
signal networks
The analysis of networks for biological processes
and KEGG pathways permitted the identification of genes involved in
these processes and pathways, as well as associations between
upstream and downstream signaling transduction. The results
revealed that three genes (STAT5A, FYN and SYK) were
frequently present as hubs of corresponding networks, highlighting
their functions as important markers for cyclophosphamide
resistance.
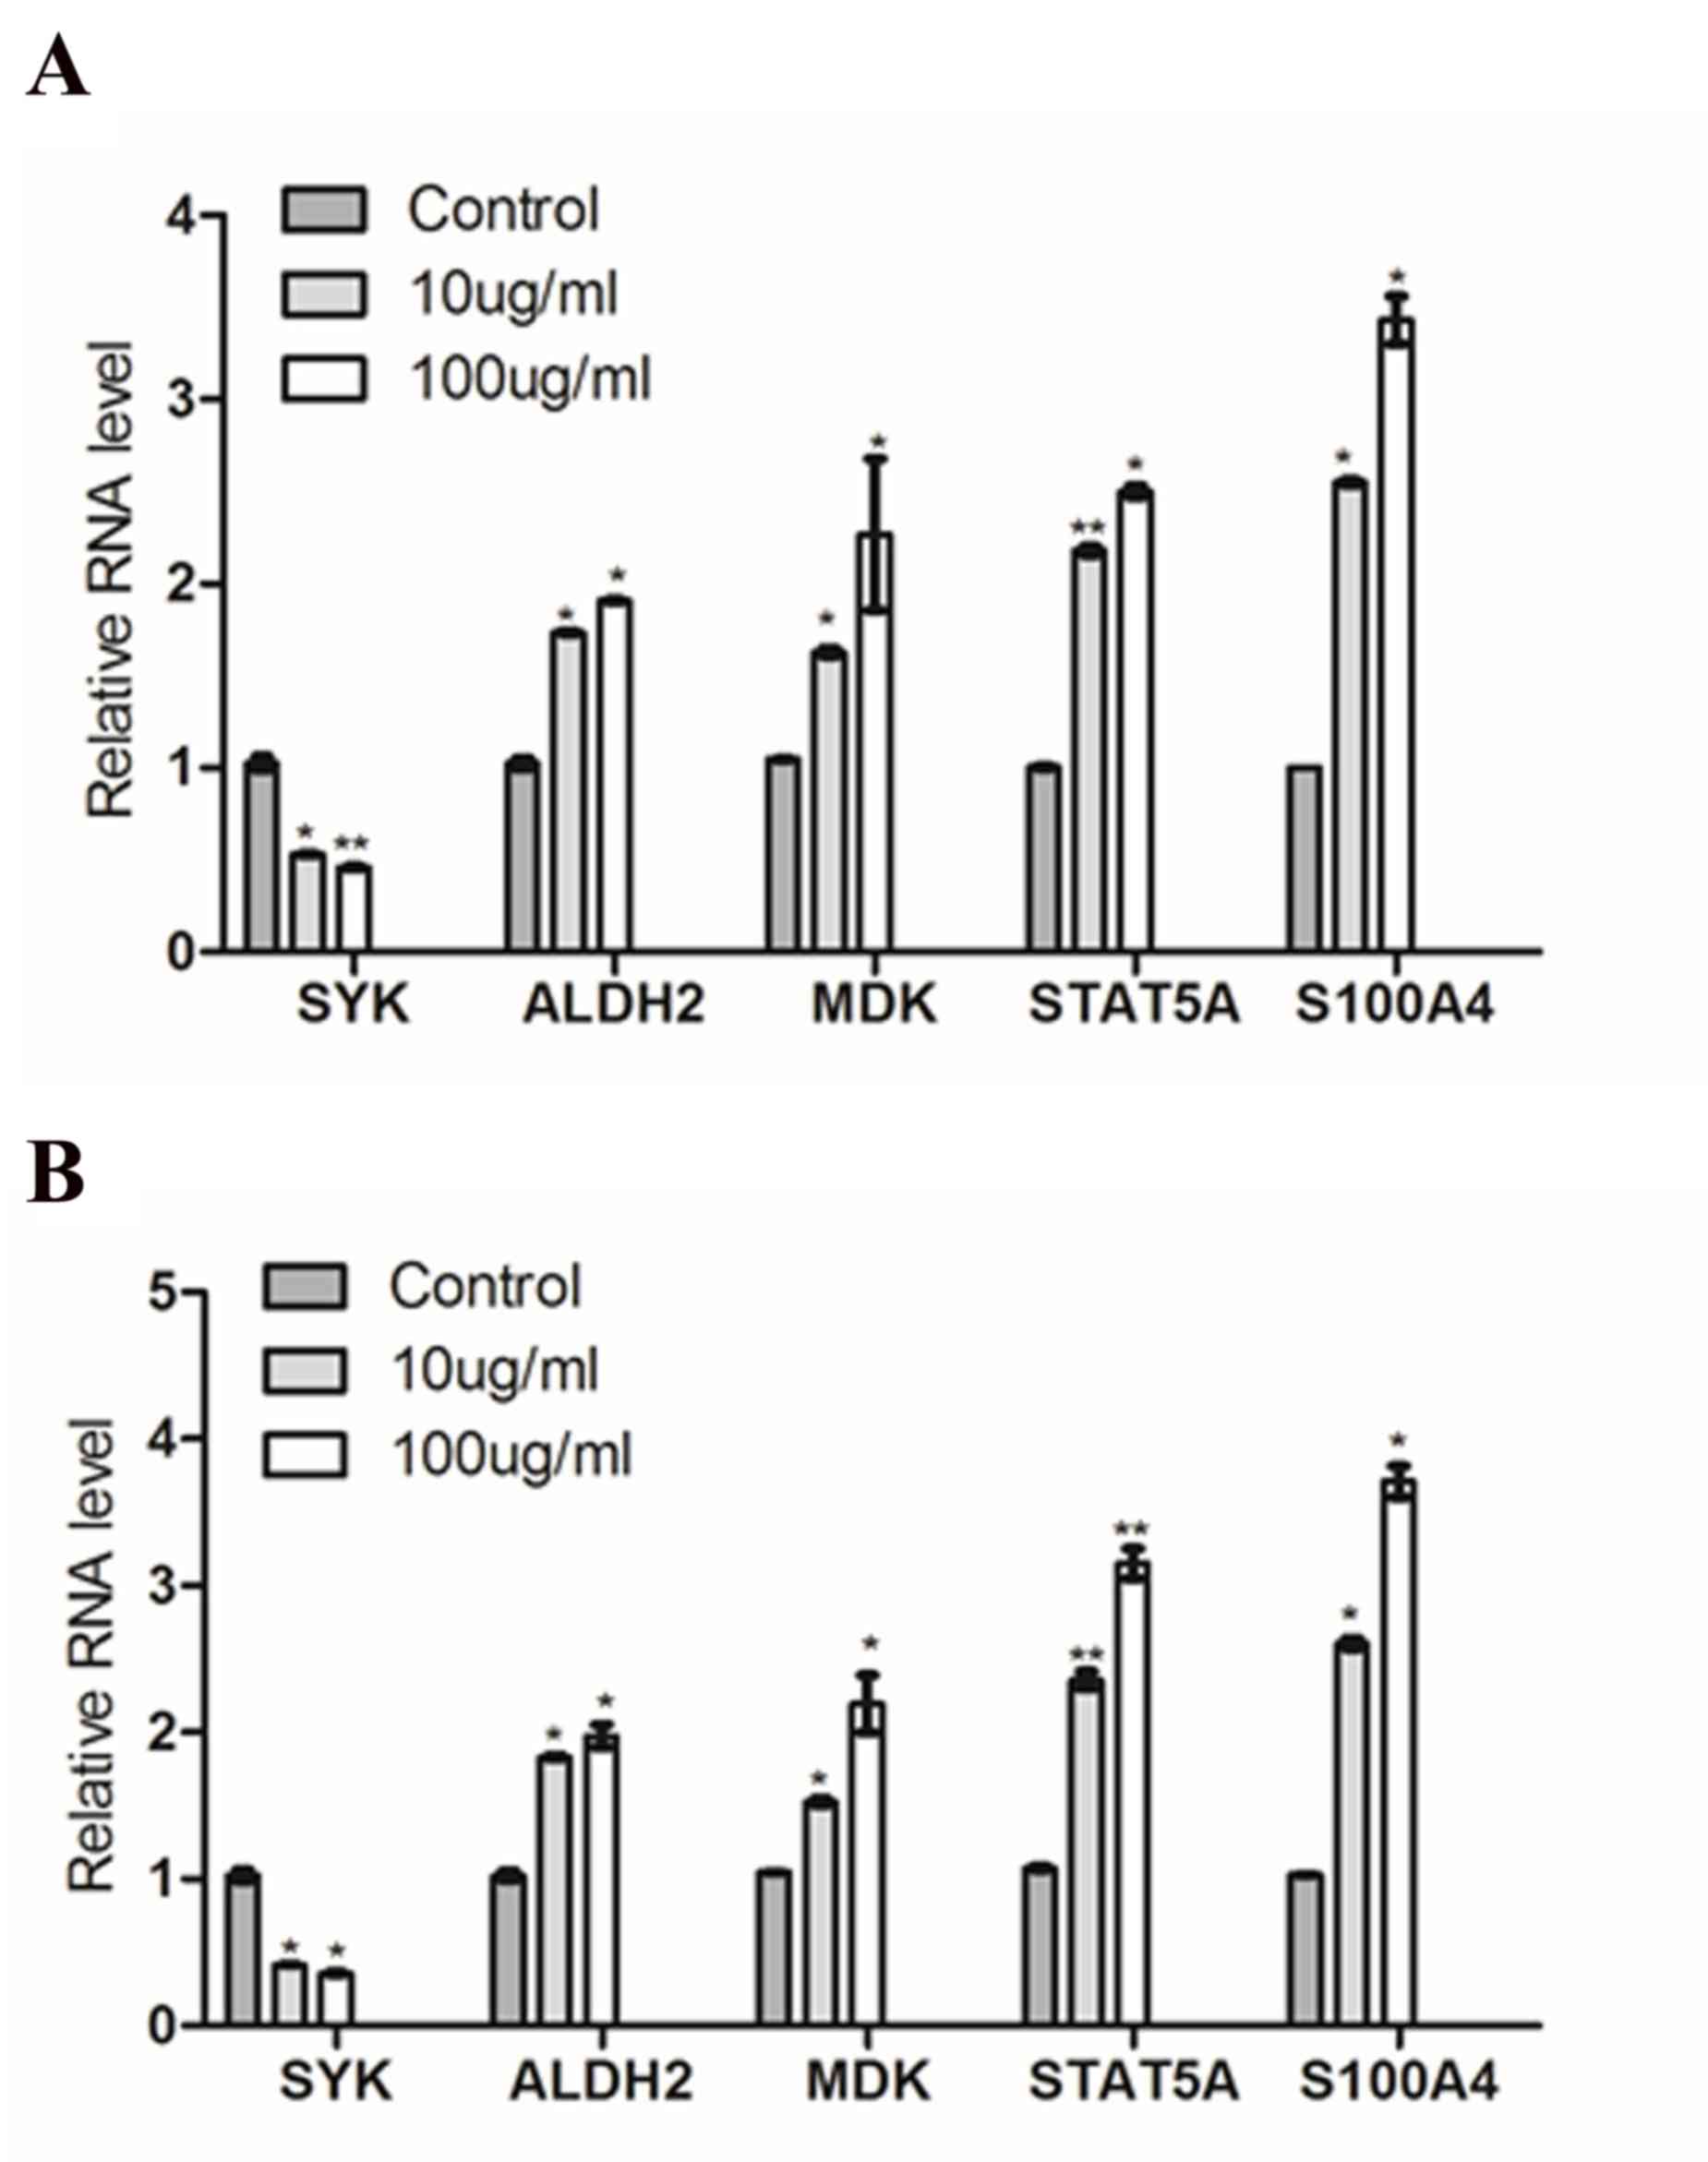
Validation of microarray data
To verify the expression of the DEGs identified in
microarray experiments, RT-qPCR was performed using two human CML
cell lines (K-562 and KU812). The expression levels of 5 genes were
tested (SYK, ALDH2, MDK, STAT5A and S100A4), and mRNA
expression levels of SYK were significantly decreased and mRNA
expression levels of ALDH2, MDK, STAT5A and S100A4 were
significantly increased following 4-HC treatment in K-562 (Fig. 4A) and KU812 cells (Fig. 4B). These results were in agreement
with and supported the microarray data.
Effect of STAT5A and S100A4 on
sensitivity to 4-HC
To further determine whether high expression of
resistance-associated genes conferred decreased sensitivity to
4-HC, the genes STAT5A and S100A4, which were highly
expressed in K-562 cells following treatment with 4-HC, were used
to assess their potentially drug resistant function in
vitro. The mRNA expression levels of STAT5A and
S100A4 were efficiently inhibited by interference with siRNA
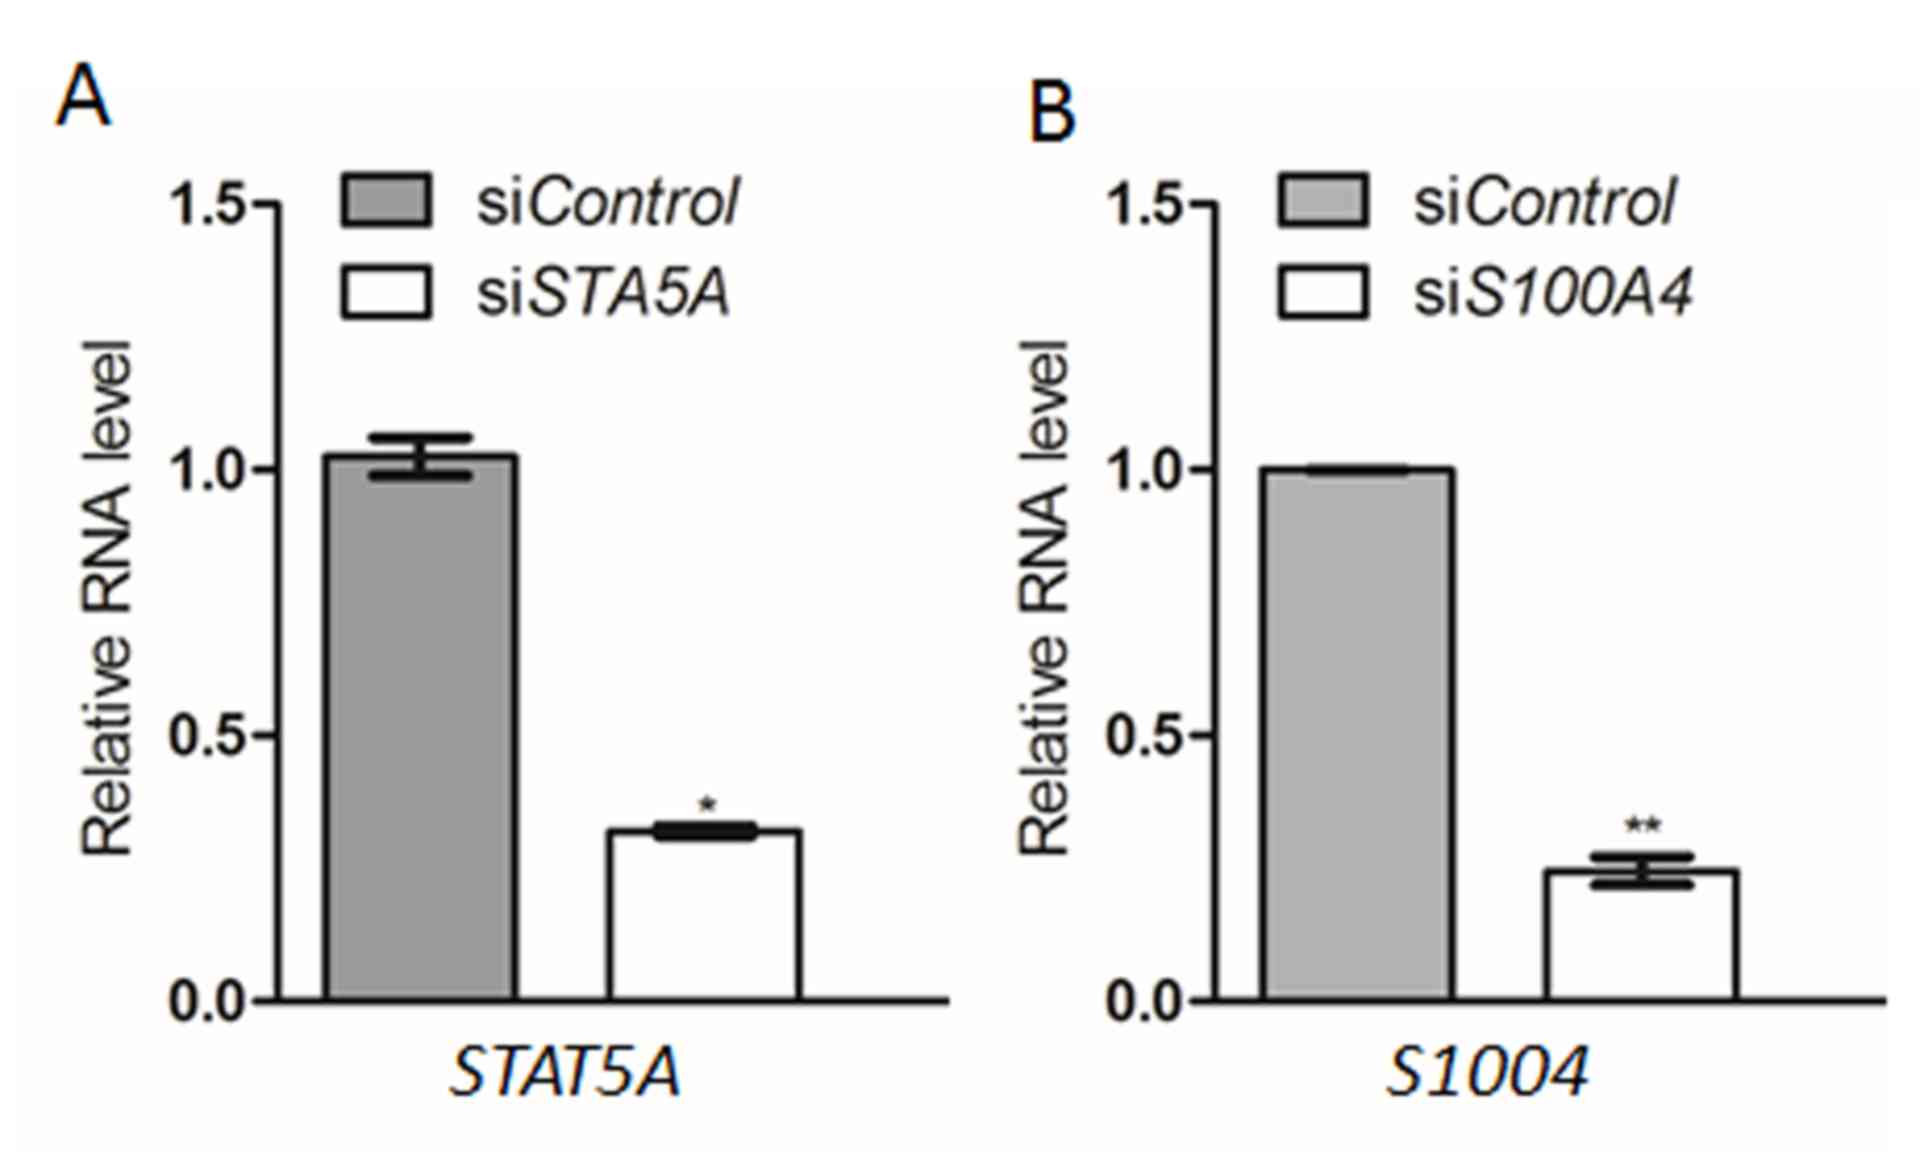
method, when compared with the control (Fig. 5A and B, respectively). Following
transfection, cells were treated with 0, 10 or 15 µg/ml 4-HC and
cultured in methylcellulose culture or liquid culture. Table VII presents the results as the
mean number of total colonies counted in 5 replicate experiments.
K-562 cells expressing lower levels of the STAT5A gene were
more sensitive to 4-HC when compared with the control. Similar
results were observed for the S100A4 gene following
transfection, which also increased the sensitivity of K-562 cells
to 4-HC.
| Table VII.Effect of inhibition of STAT5A
and S100A4 genes on the sensitivity of K-562 cells to
4-HC. |
Table VII.
Effect of inhibition of STAT5A
and S100A4 genes on the sensitivity of K-562 cells to
4-HC.
| 4-HC dose
(µg/ml) | si
Control | si
STAT5A | si
S100A4 |
|---|
| 10 | 116±12a | 65±5b | 56±4b |
|
| (1.15) | (0.43) | (0.38) |
| 15 | 30± 3 | 8±2b | 5±1b |
|
| (0.297) | (0.053) | (0.034) |
Discussion
Cyclophosphamide is an alkylating agent that exists
as an inactive prodrug that requires enzymatic and chemical
activation to release active phosphoramide mustard. Phosphoramide
mustard alkylates DNA to produce interstrand and intrastrand DNA
crosslinks, thus resulting in inhibition of DNA synthesis and cell
death (30). Although the aldehyde
dehydrogenase (ALDH) family has been reported to confer resistance
to cyclophosphamide in multiple tumor cell lines (31), explaining cases with
cyclophosphamide resistance remains difficult. In particular,
patients with leukemia and lymphoma with low levels of ALDH
isozymes are relatively resistant to cyclophosphamide (32). Therefore, it is urgent to improve
understanding of the mechanisms of cyclophosphamide resistance, in
order to use it in a more efficient way.
In the present study, the Affymetrix Human Genome
U95 Version 2 microarray was used to analyze the global gene
expression profile between sensitive and resistant CML cells in
response to cyclophosphamide. A total of 258 DEGs demonstrated
significantly differential regulation, of which 139 DEGs were
upregulated and 119 DEGs were downregulated. A biological network
was subsequently constructed according to PPIs obtained from the
HPRD, BIOGRID, and PIP databases. GO and KEGG pathway enrichment
analysis were also performed to reveal the altered biological
events associated with cyclophosphamide resistance.
Among the DEGs, several potential genes that may be
responsible for cyclophosphamide resistance were identified. For
example, ALDH1A1 was the top upregulated gene with a
log2 fold change of 175.23, and its expression has been
the major determinant of cellular sensitivity to cyclophosphamide
(31,33). Another ALDH family member,
ALDH2, was also revealed to be upregulated in resistant CML
cells, highlighting the critical function of the ALDH family as a
predictive marker for drug resistance. The ALDH family mediates
detoxification of cyclophosphamide by catalyzing the oxidation of
its intermediate metabolite aldophosphamide to carboxyphosphamide,
resulting in inactivation of cyclophosphamide (17,32).
Another upregulated enzyme that may be involved in
drug resistance was AKR1B1, an aldose reductase.
Overexpression of three reductases (carbonyl reductase 1, aldo-keto
reductase family 1 member A1 and AKR1B1) has been
demonstrated to inactivate the anti-cancer drug daunorubicin,
resulting in elevation of chemoresistance in tumor cells (34).
MDK is another DEG that demonstrated
upregulation in cyclophosphamide-resistant CML cells when compared
with sensitive cells. It is a heparin-binding growth factor
involved in cancer development, the promotion of cell growth and
survival, angiogenesis and anti-apoptosis (35). Notably, over-expression of
MDK has been demonstrated to be associated with resistance
to different chemotherapeutic agents, including fluorouracil,
doxorubicin, cisplatin and adriamycin (36,37).
Therefore, acquired upregulation of MDK in CML cells may
contribute to cyclophosphamide resistance.
S100A4 is a member of the S100 family of
calcium-binding proteins and is involved in a number of cellular
processes, including cell proliferation, differentiation,
apoptosis, tumorigenesis and cancer metastasis (38). In addition, knockdown of
S100A4 has been demonstrated to result in an increased
sensitivity to gemcitabine in pancreatic cancer cells, suggesting
that overexpression of S100A4 is associated with
chemoresistance (39). Therefore,
the upregulation of S100A4 observed in the present study may
explain the resistance to cyclophosphamide in CML cells.
TIMP1 is another gene with a potential
involvement in drug resistance. High TIMP1 expression levels
are related with poor prognosis and poor response to chemotherapy
in patients with breast cancer (40). Similar to this previous study,
TIMP1 was increased in cyclophosphamide-resistant CML cells
in the present study, supporting the use of TIMP1 as a
marker for drug sensitivity.
It is possible to use GO analysis to identify
over-representation of biological processes, providing insights
into mechanisms of chemoresistance in response to cyclophosphamide.
Similar to the effects discussed previously, significant biological
processes including the apoptotic process and cell proliferation
were considered to be associated with drug resistance. It is
reasonable to infer that the apoptosis processes induced in
sensitive cells was inactive in resistant cells, thus promoting
cell proliferation. The challenge is to dissect the key molecular
mechanisms that drive these biological processes that occur in
resistant cells. Response to chemical stimuli was another important
biological event in the acquisition of drug resistance. The ALDH
family was involved in the process of response to chemicals. The
results of the present study suggested that
cyclophosphamide-resistant CML cells may respond more effectively
to external drug stimuli due to high levels of enzymes associated
with clearance or inactivation of drugs, including the ALDH
family.
KEGG enrichment analysis helps identify significant
pathways that DEGs participate in, providing a comprehensive
understanding of interactive genes. The pathway analysis performed
in the present study revealed that 17 KEGG pathways appeared with a
high frequency. The most significant pathways were involved in the
immune response, including natural killer cell mediated
cytotoxicity, lysosome, phagosome and Fc epsilon RI signaling
pathway. These findings confirmed those of the GO analysis,
confirming that the immune system process was one of the
significantly enriched biological processes. The Fc epsilon RI
complex forms a high affinity cell-surface receptor that interacts
the Fc region of antigen-specific immunoglobulin E molecules. Fc
epsilon RI aggregation by antigen induces activation of several
down-stream signaling pathways, including LYN proto-oncogene, Src
family tyrosine kinase, SYK, linker for activation of T
cells, extracellular signal related kinases, c-Jun N-terminal
kinases and p38 MAP kinase cascades, resulting in activation of the
immune response (41). The
involvement of the immune response in treatment with
cyclophosphamide has been previously reported. Cyclophosphamide
possesses dual anti-cancer and immunosuppressive properties and so
it is also used in a variety of autoimmune disorders to inhibit
graft rejection and graft-versus-host disease (17). When compared with sensitive CML
cells, over-representation of immune response in resistant cells
suggested its potential involvement in cyclophosphamide resistance.
Other enrichment pathways, which at first appear irrelevant to
cyclophosphamide, may also have a function in cyclophosphamide
resistance. This requires further investigation.
Further signal transduction network analysis
revealed that multiple genes were involved in significant
biological processes and pathways. Notably, STAT5A,
FYN and SYK, identified from biological process and
KEGG pathway analysis, were the primary genes with the highest
frequency at the center of the network. STAT5A is a member
of the signal transducers and activators of transcription (STAT)
family that is located in the cytoplasm and activated by a variety
of cytokines. STATs are hypothesized to be important in multiple
signaling pathways and thus involved in a number of cellular
processes, including cell survival, proliferation, angiogenesis and
immune evasion. They are frequently over-activated in solid tumor
and blood malignancies. In particular, STAT5A and
STAT5B are directly activated by oncogenic BCR-ABL tyrosine
kinase (42,43). Previous studies have demonstrated
that inhibition of STAT5A restored the sensitivity of
colorectal cancer cells to the cytotoxic drugs cisplatin and
5-fluorouracil (44). Therefore,
the high levels of STAT5A observed in the present study may
be involved in cyclophosphamide resistance in CML cells. FYN
is an Src family kinase and a non-receptor tyrosine kinase.
Therefore, FYN is able to phosphorylate tyrosine residues on
key targets associated with multiple signaling pathways. The
initial biological functions of FYN are focused on immune
and neurological function. However, FYN is also involved in
cell cycle, growth, proliferation, cell-cell adhesion and cell
migration. FYN is overexpressed in a variety of cancers,
including glioblastoma, melanoma and prostate cancer. Dasatinib is
known to inhibit FYN activation and has been tested in
pre-clinical and clinical trials for cancer treatment (45). A previous study has demonstrated
the involvement of FYN in tamoxifen resistance in breast
tumors. Overexpression of FYN in tamoxifen-sensitive cells
impaired sensitivity in response to tamoxifen treatment (46). In addition, siRNA-mediated
knockdown of FYN restored sensitivity to imatinib, a tyrosine
kinase inhibitor, in CML cells (47). These reports supported the results
of the present study, that highlighted FYN as one of the
targets responsible for cyclophosphamide resistance. SYK is
also a non-receptor tyrosine kinase, and is involved in
intracellular signal transduction processes. It is important for
immune and inflammatory responses, as well as cell survival in
multiple cancers. SYK has been considered an interesting
molecular target, and development of SYK inhibitors has been
used to treat these pathologies (48). There remain no reports confirming
the involvement of SYK in cyclophosphamide resistance, but
SYK has been demonstrated to be associated with nilotinib
resistance in CML cells (49).
This network analysis provides valuable information on several
potential genes that may be involved in cyclophosphamide
resistance.
In addition, 5 genes were selected to validate their
mRNA expression levels in 2 human CML cell lines (K-562 and KU812).
The expression levels of the 5 genes were in line with those from
the microarray experiments in the present study, including
SYK, ALDH2, MDK, STAT5A and
S100A4, further confirming the important association between
expression of these genes and drug resistance.
To further evaluate whether increased levels of
these genes was functionally important for cyclophosphamide
resistance, siRNA was used to inhibit the expression of two highly
expressed genes, STAT5A and S100A4, in K-562 cells.
The survival of cells following treatment with 4-HC was
subsequently determined. The results demonstrated that 4-HC
significantly decreased cell survival in the siSTAT5A and
siS100A4 group, while the siControl group exhibited
relative resistance to 4-HC treatment. Therefore, high expression
of STAT5A or S100A4 in CML cells was important for
cyclophosphamide resistance.
In conclusion, microarray technologies were used to
comprehensively analyze simultaneous changes in gene expression
between cyclophosphamide-sensitive and resistant CML cells, and
several potential genes related with cyclophosphamide resistance
were identified. Further functional validations were also
performed, and revealed that STAT5A and S100A4
conferred resistance to cyclophosphamide to CML cells. These
findings provide novel insights into cyclophosphamide resistance in
CML cells. The genes identified in the present study may also help
to predict resistant mechanisms for other drugs, as biomarkers. It
may be possible to use inhibitors of resistance genes in
combination with drugs to enhance therapeutic efficacy in the
future, resulting in improved chemotherapy strategies for patients
with cancer.
References
|
1
|
Jemal A, Siegel R, Xu J and Ward E: Cancer
Statistics, 2010. CA Cancer J Clin. 60:277–300. 2010. View Article : Google Scholar : PubMed/NCBI
|
|
2
|
Ramchandren R and Schiffer C: Dasatinib in
the treatment of imatinib refractory chronic myeloid leukemia.
Biologics. 3:205–214. 2009.PubMed/NCBI
|
|
3
|
Sawyers CL: Chronic Myeloid Leukemia. N
Engl J Med. 340:1330–1340. 1999. View Article : Google Scholar : PubMed/NCBI
|
|
4
|
Jabbour E, Cortes J and Kantarjian H:
Treatment selection after imatinib resistance in chronic myeloid
leukemia. Target Oncol. 4:3–10. 2009. View Article : Google Scholar : PubMed/NCBI
|
|
5
|
Nowell PC and Hungerford DA: A minute
chromosome in human chronic granulocytic leukemia. Science.
142:14971960.
|
|
6
|
Rowley JD: Letter: A new consistent
chromosomal abnormality in chronic myelogenous leukaemia identified
by quinacrine fluorescence and Giemsa staining. Nature.
243:290–293. 1973. View
Article : Google Scholar : PubMed/NCBI
|
|
7
|
Mandanas R, Leibowitz D, Gharehbaghi K,
Tauchi T, Burgess G, Miyazawa K, Jayaram H and Boswell H: Role of
p21 RAS in p210 bcr-abl transformation of murine myeloid cells.
82:1838–1847. 1993.
|
|
8
|
Okuda K, Matulonis U, Salgia R, Kanakura
Y, Druker B and Griffin J: Factor independence of human myeloid
leukemia cell lines is associated with increased phosphorylation of
the proto-oncogene Raf-1. Exp Hematol. 22:1111–1117.
1994.PubMed/NCBI
|
|
9
|
Raitano AB, Halpern JR, Hambuch TM and
Sawyers CL: The Bcr-Abl leukemia oncogene activates Jun kinase and
requires Jun for transformation. Proc Natl Acad Sci USA.
92:11746–11750. 1995. View Article : Google Scholar : PubMed/NCBI
|
|
10
|
Sawyers CL, Callahan W and Witte ON:
Dominant negative MYC blocks transformation by ABL oncogenes. Cell.
70:901–910. 1992. View Article : Google Scholar : PubMed/NCBI
|
|
11
|
Shuai K, Halpern J, ten Hoeve J, Rao X and
Sawyers CL: Constitutive activation of STAT5 by the BCR-ABL
oncogene in chronic myelogenous leukemia. Oncogene. 13:247–254.
1996.PubMed/NCBI
|
|
12
|
Tan J, Cang S, Seiter K, Primanneni S,
Ahmed N, Mathews T and Liu D: t(3;9;22) 3-way chromosome
translocation in chronic myeloid leukemia is associated with poor
prognosis. Cancer Invest. 27:718–722. 2009. View Article : Google Scholar : PubMed/NCBI
|
|
13
|
Quintás-Cardama A and Cortes JE: Chronic
myeloid leukemia: Diagnosis and treatment. Mayo Clin Proc.
81:973–988. 2006. View
Article : Google Scholar : PubMed/NCBI
|
|
14
|
Jabbour E and Kantarjian H: Chronic
myeloid leukemia: 2014 update on diagnosis, monitoring, and
management. Am J Hematol. 89:547–556. 2014. View Article : Google Scholar : PubMed/NCBI
|
|
15
|
Angstreich GR, Smith BD and Jones RJ:
Treatment options for chronic myeloid leukemia: Imatinib versus
interferon versus allogeneic transplant. Curr Opin Oncol. 16:95–99.
2004. View Article : Google Scholar : PubMed/NCBI
|
|
16
|
Gora-Tybor J and Robak T: Targeted drugs
in chronic myeloid leukemia. Curr Med Chem. 15:3036–3051. 2008.
View Article : Google Scholar : PubMed/NCBI
|
|
17
|
Emadi A, Jones RJ and Brodsky RA:
Cyclophosphamide and cancer: Golden anniversary. Nat Rev Clin
Oncol. 6:638–647. 2009. View Article : Google Scholar : PubMed/NCBI
|
|
18
|
Wu J and Gentry R: gcrma: Background
adjustment using sequence information. R package. version
2.46.0.
|
|
19
|
Gentleman R, Carey V, Huber W and Hahne F:
genefilter: genefilter: Methods for filtering genes from microarray
experiments. R package. version 1.56.0.
|
|
20
|
Smyth GK: Limma: Linear models for
microarray data. Gentleman R, Carey V, Dudoit S, Irizarry R and
Huber W: Bioinformatics and Computational Biology Solutions Using R
and Bioconductor New York: Springer; pp. 397–420. 2005, View Article : Google Scholar
|
|
21
|
Tavazoie S, Hughes JD, Campbell MJ, Cho RJ
and Church GM: Systematic determination of genetic network
architecture. Nat Genet. 22:281–285. 1999. View Article : Google Scholar : PubMed/NCBI
|
|
22
|
Carlson M: GO.db: A set of annotation maps
describing the entire Gene Ontology. R package. version 3.0.0.
|
|
23
|
Carlson M: KEGG.db: A set of annotation
maps for KEGG. R package. version 3.2.3.
|
|
24
|
Tenenbaum D: KEGGREST: Client-side REST
access to KEGG. R package. version 1.14.1.
|
|
25
|
Prasad Keshava TS, Goel R, Kandasamy K,
Keerthikumar S, Kumar S, Mathivanan S, Telikicherla D, Raju R,
Shafreen B, Venugopal A, et al: Human protein reference
database-2009 update. Nucleic Acids Res. 37:(Database Issue).
D767–D772. 2009. View Article : Google Scholar : PubMed/NCBI
|
|
26
|
Chatr-aryamontri A, Breitkreutz BJ,
Heinicke S, Boucher L, Winter A, Stark C, Nixon J, Ramage L, Kolas
N, O'Donnell L, et al: The BioGRID interaction database: 2013
update. Nucleic Acids Res. 41:(Database Issue). D816–D823. 2013.
View Article : Google Scholar : PubMed/NCBI
|
|
27
|
McDowall MD, Scott MS and Barton GJ: PIPs:
Human protein-protein interaction prediction database. Nucleic
Acids Res. 37:(Database Issue). D651–D656. 2009. View Article : Google Scholar : PubMed/NCBI
|
|
28
|
Smoot ME, Ono K, Ruscheinski J, Wang PL
and Ideker T: Cytoscape 2.8: New features for data integration and
network visualization. Bioinformatics. 27:431–432. 2011. View Article : Google Scholar : PubMed/NCBI
|
|
29
|
Livak KJ and Schmittgen TD: Analysis of
relative gene expression data using real-time quantitative PCR and
the 2(−Delta Delta C(T)) Method. Methods. 25:402–408. 2001.
View Article : Google Scholar : PubMed/NCBI
|
|
30
|
Colvin O: An overview of cyclophosphamide
development and clinical applications. Curr Pharm Des. 5:555–560.
1999.PubMed/NCBI
|
|
31
|
Sládek NE: Leukemic cell insensitivity to
cyclophosphamide and other oxazaphosphorines mediated by aldehyde
dehydrogenase(s). Clinically Relevant Resistance in Cancer
Chemotherapy. Springer; pp. 161–175. 2002, View Article : Google Scholar
|
|
32
|
Russo JE, Hilton J and Colvin OM: The role
of aldehyde dehydrogenase isozymes in cellular resistance to the
alkylating agent cyclophosphamide. Prog Clin Biol Res. 290:65–79.
1989.PubMed/NCBI
|
|
33
|
Moreb J, Muhoczy D, Ostmark B and Zucali
J: RNAi-mediated knockdown of aldehyde dehydrogenase class-1A1 and
class-3A1 is specific and reveals that each contributes equally to
the resistance against 4-hydroperoxycyclophosphamide. Cancer
Chemother Pharmacol. 59:127–136. 2007. View Article : Google Scholar : PubMed/NCBI
|
|
34
|
Plebuch M, Soldan M, Hungerer C, Koch L
and Maser E: Increased resistance of tumor cells to daunorubicin
after transfection of cDNAs coding for anthracycline inactivating
enzymes. Cancer Lett. 255:49–56. 2007. View Article : Google Scholar : PubMed/NCBI
|
|
35
|
Kadomatsu K and Muramatsu T: Midkine and
pleiotrophin in neural development and cancer. Cancer Lett.
204:127–143. 2004. View Article : Google Scholar : PubMed/NCBI
|
|
36
|
Kang HC, Kim IJ, Park HW, Jang SG, Ahn SA,
Yoon SN, Chang HJ, Yoo BC and Park JG: Regulation of MDK expression
in human cancer cells modulates sensitivities to various anticancer
drugs: MDK overexpression confers to a multi-drug resistance.
Cancer Lett. 247:40–47. 2007. View Article : Google Scholar : PubMed/NCBI
|
|
37
|
Xu YY, Mao XY, Song YX, Zhao F, Wang ZN,
Zhang WX, Xu HM and Jin F: Midkine confers Adriamycin resistance in
human gastric cancer cells. Tumor Biol. 33:1543–1548. 2012.
View Article : Google Scholar
|
|
38
|
Mishra S, Siddique H and Saleem M: S100A4
calcium-binding protein is key player in tumor progression and
metastasis: Preclinical and clinical evidence. Cancer Metastasis
Rev. 31:163–172. 2012. View Article : Google Scholar : PubMed/NCBI
|
|
39
|
Mahon PC, Baril P, Bhakta V, Chelala C,
Caulee K, Harada T and Lemoine NR: S100A4 Contributes to the
suppression of BNIP3 expression, chemoresistance and inhibition of
apoptosis in pancreatic cancer. Cancer Res. 67:6786–6795. 2007.
View Article : Google Scholar : PubMed/NCBI
|
|
40
|
Hekmat O, Munk S, Fogh L, Yadav R,
Francavilla C, Horn H, Würtz SØ, Schrohl AS, Damsgaard B, Rømer MU,
et al: TIMP-1 increases expression and phosphorylation of proteins
associated with drug resistance in breast cancer cells. J Proteome
Res. 12:4136–4151. 2013. View Article : Google Scholar : PubMed/NCBI
|
|
41
|
Rivera J and Olivera A: A current
understanding of Fc epsilon RI-dependent mast cell activation. Curr
Allergy Asthma Rep. 8:14–20. 2008. View Article : Google Scholar : PubMed/NCBI
|
|
42
|
Yu H and Jove R: The STATs of cancer-new
molecular targets come of age. Nat Rev Cancer. 4:97–105. 2004.
View Article : Google Scholar : PubMed/NCBI
|
|
43
|
Schaller-Schönitz M, Barzan D, Williamson
AJ, Griffiths JR, Dallmann I, Battmer K, Ganser A, Whetton AD,
Scherr M and Eder M: BCR-ABL Affects STAT5A and STAT5B
differentially. PLoS One. 9:e972432014. View Article : Google Scholar : PubMed/NCBI
|
|
44
|
Hong X, Chen G, Wang M, Lou C, Mao Y, Li Z
and Zhang Y: STAT5a-targeting miRNA enhances chemosensitivity to
cisplatin and 5-fluorouracil in human colorectal cancer cells. Mol
Med Rep. 5:1215–1219. 2012.PubMed/NCBI
|
|
45
|
Saito YD, Jensen AR, Salgia R and Posadas
EM: Fyn: A novel molecular target in cancer. Cancer. 116:1629–1637.
2010. View Article : Google Scholar : PubMed/NCBI
|
|
46
|
Elias D, Vever H, Lankholm AV, Gjerstorff
MF, Yde CW, Lykkesfeldt AE and Ditzel HJ: Gene expression profiling
identifies FYN as an important molecule in tamoxifen resistance and
a predictor of early recurrence in patients treated with endocrine
therapy. Oncogene. 34:1919–1927. 2015. View Article : Google Scholar : PubMed/NCBI
|
|
47
|
Fenouille N, Puissant A, Dufies M, Robert
G, Jacquel A, Ohanna M, Deckert M, Pasquet JM, Mahon FX, Cassuto
JP, et al: Persistent activation of the Fyn/ERK kinase signaling
axis mediates imatinib resistance in chronic myelogenous leukemia
cells through upregulation of intracellular SPARC. Cancer Res.
70:9659–9670. 2010. View Article : Google Scholar : PubMed/NCBI
|
|
48
|
Riccaboni M, Bianchi I and Petrillo P:
Spleen tyrosine kinases: Biology, therapeutic targets and drugs.
Drug Discov Today. 15:517–530. 2010. View Article : Google Scholar : PubMed/NCBI
|
|
49
|
Gioia R, Leroy C, Drullion C, Lagarde V,
Etienne G, Dulucq S, Lippert E, Roche S, Mahon FX and Pasquet JM:
Quantitative phosphoproteomics revealed interplay between Syk and
Lyn in the resistance to nilotinib in chronic myeloid leukemia
cells. Blood. 118:2211–2221. 2011. View Article : Google Scholar : PubMed/NCBI
|