Introduction
Hepatocellular carcinoma (HCC) is one of the leading
causes of cancer-associated mortality worldwide, particularly in
men, being the second most frequent cause of cancer-associated
mortality (1). Viral hepatitis,
including hepatitis B virus (HBV) and hepatitis C virus (HCV), is a
common risk factor for HCC (2,3). The
majority of patients with HCC present at an advanced stage, and are
refractory to chemotherapy and radiotherapy (4,5).
Understanding the mechanism of carcinogenesis is pivotal for the
diagnosis of HCC (6). It has been
shown that using screening procedures for diagnosing HCC results in
improved survival rates for patients, compared with those with
symptomatic disease at presentation (7).
Several biomarkers have been investigated for the
diagnosis of HCC, including clinical, radiological and laboratory
modalities, with or without liver biopsy. The majority of patients
with HCC are usually asymptomatic until the late stages. Generally,
it is difficult to make a clinical diagnosis of HCC at an early
stage due to the deep position of the liver within the body. The
most frequently used HCC marker for diagnosis is the serum
concentration level of α fetoprotein (AFP), the level of which is
increased in patients with HCC (8). However, inconsistent sensitivity and
specificity have been reported in AFP-L3 in previous studies
(9), therefore, it may not be a
valuable prognostic biomarker in patients with known HCC.
There has been significant progress in understanding
the mechanism of HCC based on microarray technology, including
differentially expressed genes, which can overcome the limitations
of clinical prognostic factors (10). Several growth factors, including
epidermal growth factor receptor, hepatoma-derived growth factor
and insulin-like growth factor, have been reported to be involved
in the progression of HCC (11,12).
In addition, apoptotic genes, anti-apoptotic genes and tumor
suppressor genes in have been identified in hepatocarcinogenesis
(13,14). However, results have not been
uniform and share only a limited number of potential genes.
To overcome the limitations of a gene-based
approach, pathway analysis was introduced, which provides
biological information to facilitate characterization of the
functional network and the associations between selected
significant genes (15). Until
now, a number of methods have been suggested to identify core
pathways for diagnosis, including individual pathway aberrance
score (iPAS) analysis (16) and
principal component analysis (17). Although HBV- and HCV-infected HCC
are not distinguishable in histological and clinical evaluations,
microarray analyses have shown that different molecular mechanisms
underlie the development of HBV- and HCV-positive HCC (15,17,18).
In the present study, pathway-based iPAS analysis
with Random Forest (RF) classification and Monte Carlo
cross-validation were used to identify pathway-based networks of
HBV- and HCV-positive HCC. The disease datasets of HBV and HCV were
compared with healthy data, generating different networks following
50 runs of Monte Carlo cross-validation. This method aimed to
provide clinical molecular insights into the mechanism of HBV- and
HCV-positive HCC.
Materials and methods
Gene expression data
Microarray gene expression data of E-MTAB-950 and
its annotation files were downloaded from the ArrayExpress database
(http://www.ebi.ac.uk/arrayexpress)
(19). This included 42 normal
samples, 149 HCV samples and 8 HBV samples. All software and
hardware analyses were provided by Honghui Biotech Co., Ltd.
(Jinan, China). The gene expression profile data was generated from
the A-AFFY-44-Affymetrix GeneChip Human Genome U133 Plus 2.0
platform (Affymetrix, Inc., Santa Clara, CA, USA), and the platform
title was ‘Transcription profiling by array of human normal liver,
HBV, HCV liver samples’. According to the platform annotation
files, the probes were mapped to gene symbols. If more than one
probe was mapped to a single gene, the average level of the probes
was used as the final gene expression value. In total, 20,545 genes
were obtained, and the gene expression levels were normalized with
quantile normalization using the preprocess Core package version
1.36.0 (https://github.com/bmbolstad/preprocessCore) (20).
Pathway data
Ingenuity Pathways Analysis (IPA) is a pathway
database (http://www.ingenuity.com/), and
pathways were downloaded from this database in the present study.
In total, 589 biological pathways were obtained, including 5,169
genes. The genes in the expression profile were mapped to the IPA
pathways, from which 4,929 genes were obtained. With gene
expression values in each pathway, Fisher's exact test was applied
to evaluate the enrichment. P-values of the pathways were corrected
by the false discovery rate of Benjamini-Hochberg (21).
Gene level statistics
The mean and standard deviation of gene expression
levels in the normal group were calculated following normalization
(20). For the disease group, the
genes in the pathways were normalized using the quantile
normalization method on combining a single disease case with all
normal samples. The gene level statistics of each gene in a disease
case were standardized as the mean ± standard deviation.
Pathway level statistics
For each pathway, the gene level statistics of all
the genes in the pathway were extracted. The mean gene level
statistic was considered the pathway level statistic. The following
formula was used, in which n represents the number of genes
belonging to the pathway:
iPAS=∑inzin
Assessment of significance
To assess the dysregulated pathways associated with
the lesionedliver, significance was assessed. The mean ± standard
deviation of the pathway level statistics in the normal samples was
calculated. The significance was determined to assess the pathway
level statistics in the disease group, with the normal group as a
reference. The Z value of a specific pathway in each sample was
obtained. Z<0.05 was considered to indicate a dysregulated
pathway.
Discriminating score (DS) of pathway
pairs
To evaluate the associations between pathway pairs,
aDS (22,23) was introduced. The mean ± standard
deviation of the expression level of genes belonging to a pathway
in each sample was calculated. A pathway was randomly combined with
another pathway, generating a pathway pair.
Significance assessment of pathway
pairs
For each pathway pair in the normal sample, the mean
± standard deviation of the DS values was calculated. Significance
was determined to assess differential pathway pairs following
combining a disease sample with all normal samples, generating a Z
value of each pathway pair in an individual sample. Z<0.2 was
considered to indicate a differential pathway pair.
Network construction
Individual networks were constructed by combining
dysregulated pathways and dysregulated pathway pairs in individual
samples. The main network of HCV was constructed from individual
networks in which edges appeared >5 times. The main network of
HBV was constructed from individual networks, the edges of which
appeared >1.
RF classification
In machine learning, RF is an important classifier,
which contains a multi-decision-making tree. RF is an extension of
a classification and regression tree, which builds a class
prediction model using class-labeled input samples (24), and calculates a ranking of input
variables ordered by the extent of association with classification
(25). In the present study, the
RF algorithm was introduced to evaluate the performance of the DS
value in the main network. In this classification, two parameters
were used: Number of variables randomly sampled as candidates at
each split (mtry)= and number of trees grown (ntree)=500. The DS
values of the pathway pairs in the main network were randomly
divided into a training set and test set, followed by RF
classification. The area under the curve (AUC) was estimated using
a 10-fold cross-validation method.
Monte Carlo cross-validation
To obtain the optimal network, Monte Carlo
cross-validation (26) was
performed using the expression profile data. Data were randomly
divided into the training set and test set. The validation was
processed from procedure 2.2 to 2.5 and repeated 50 times. For each
validation, the differential pathways and differential pathway
pairs were identified, which were constructed into a new individual
network and a main network, in addition to the AUC. When all 50
runs were completed, the main networks were ranked by the values of
the AUC. The network with the highest AUC value was considered the
optimal network. The optimal networks of HBV and HCV underwent
contrastive analysis, and an intersection network was obtained.
Results
Pathway enrichment analysis
There were 20,545 genes in the gene expression
profile. When the genes were mapped to 589 IPA pathways, a total of
4,929 genes were identified in the pathways and gene expression
profile. By ranking pathways with gene numbers, the top 4 pathways
with the highest numbers of genes were determined, as listed in
Table I.
 | Table I.Ingenuity pathways analysis pathways
overlapped with genes. Common genes indicated the number of genes
belonging to the pathway and gene expression profile. |
Table I.
Ingenuity pathways analysis pathways
overlapped with genes. Common genes indicated the number of genes
belonging to the pathway and gene expression profile.
| Pathway | Genes in pathway
(n) | P-value | FDR | Common genes (n) |
|---|
| Axonal guidance
signaling | 421 | <0.05 | <0.05 | 408 |
| Protein kinase a
signaling | 365 | <0.05 | <0.05 | 354 |
| Molecular mechanisms
of cancer | 335 | <0.05 | <0.05 | 331 |
| G-protein coupled
receptor signaling | 254 | <0.05 | <0.05 | 248 |
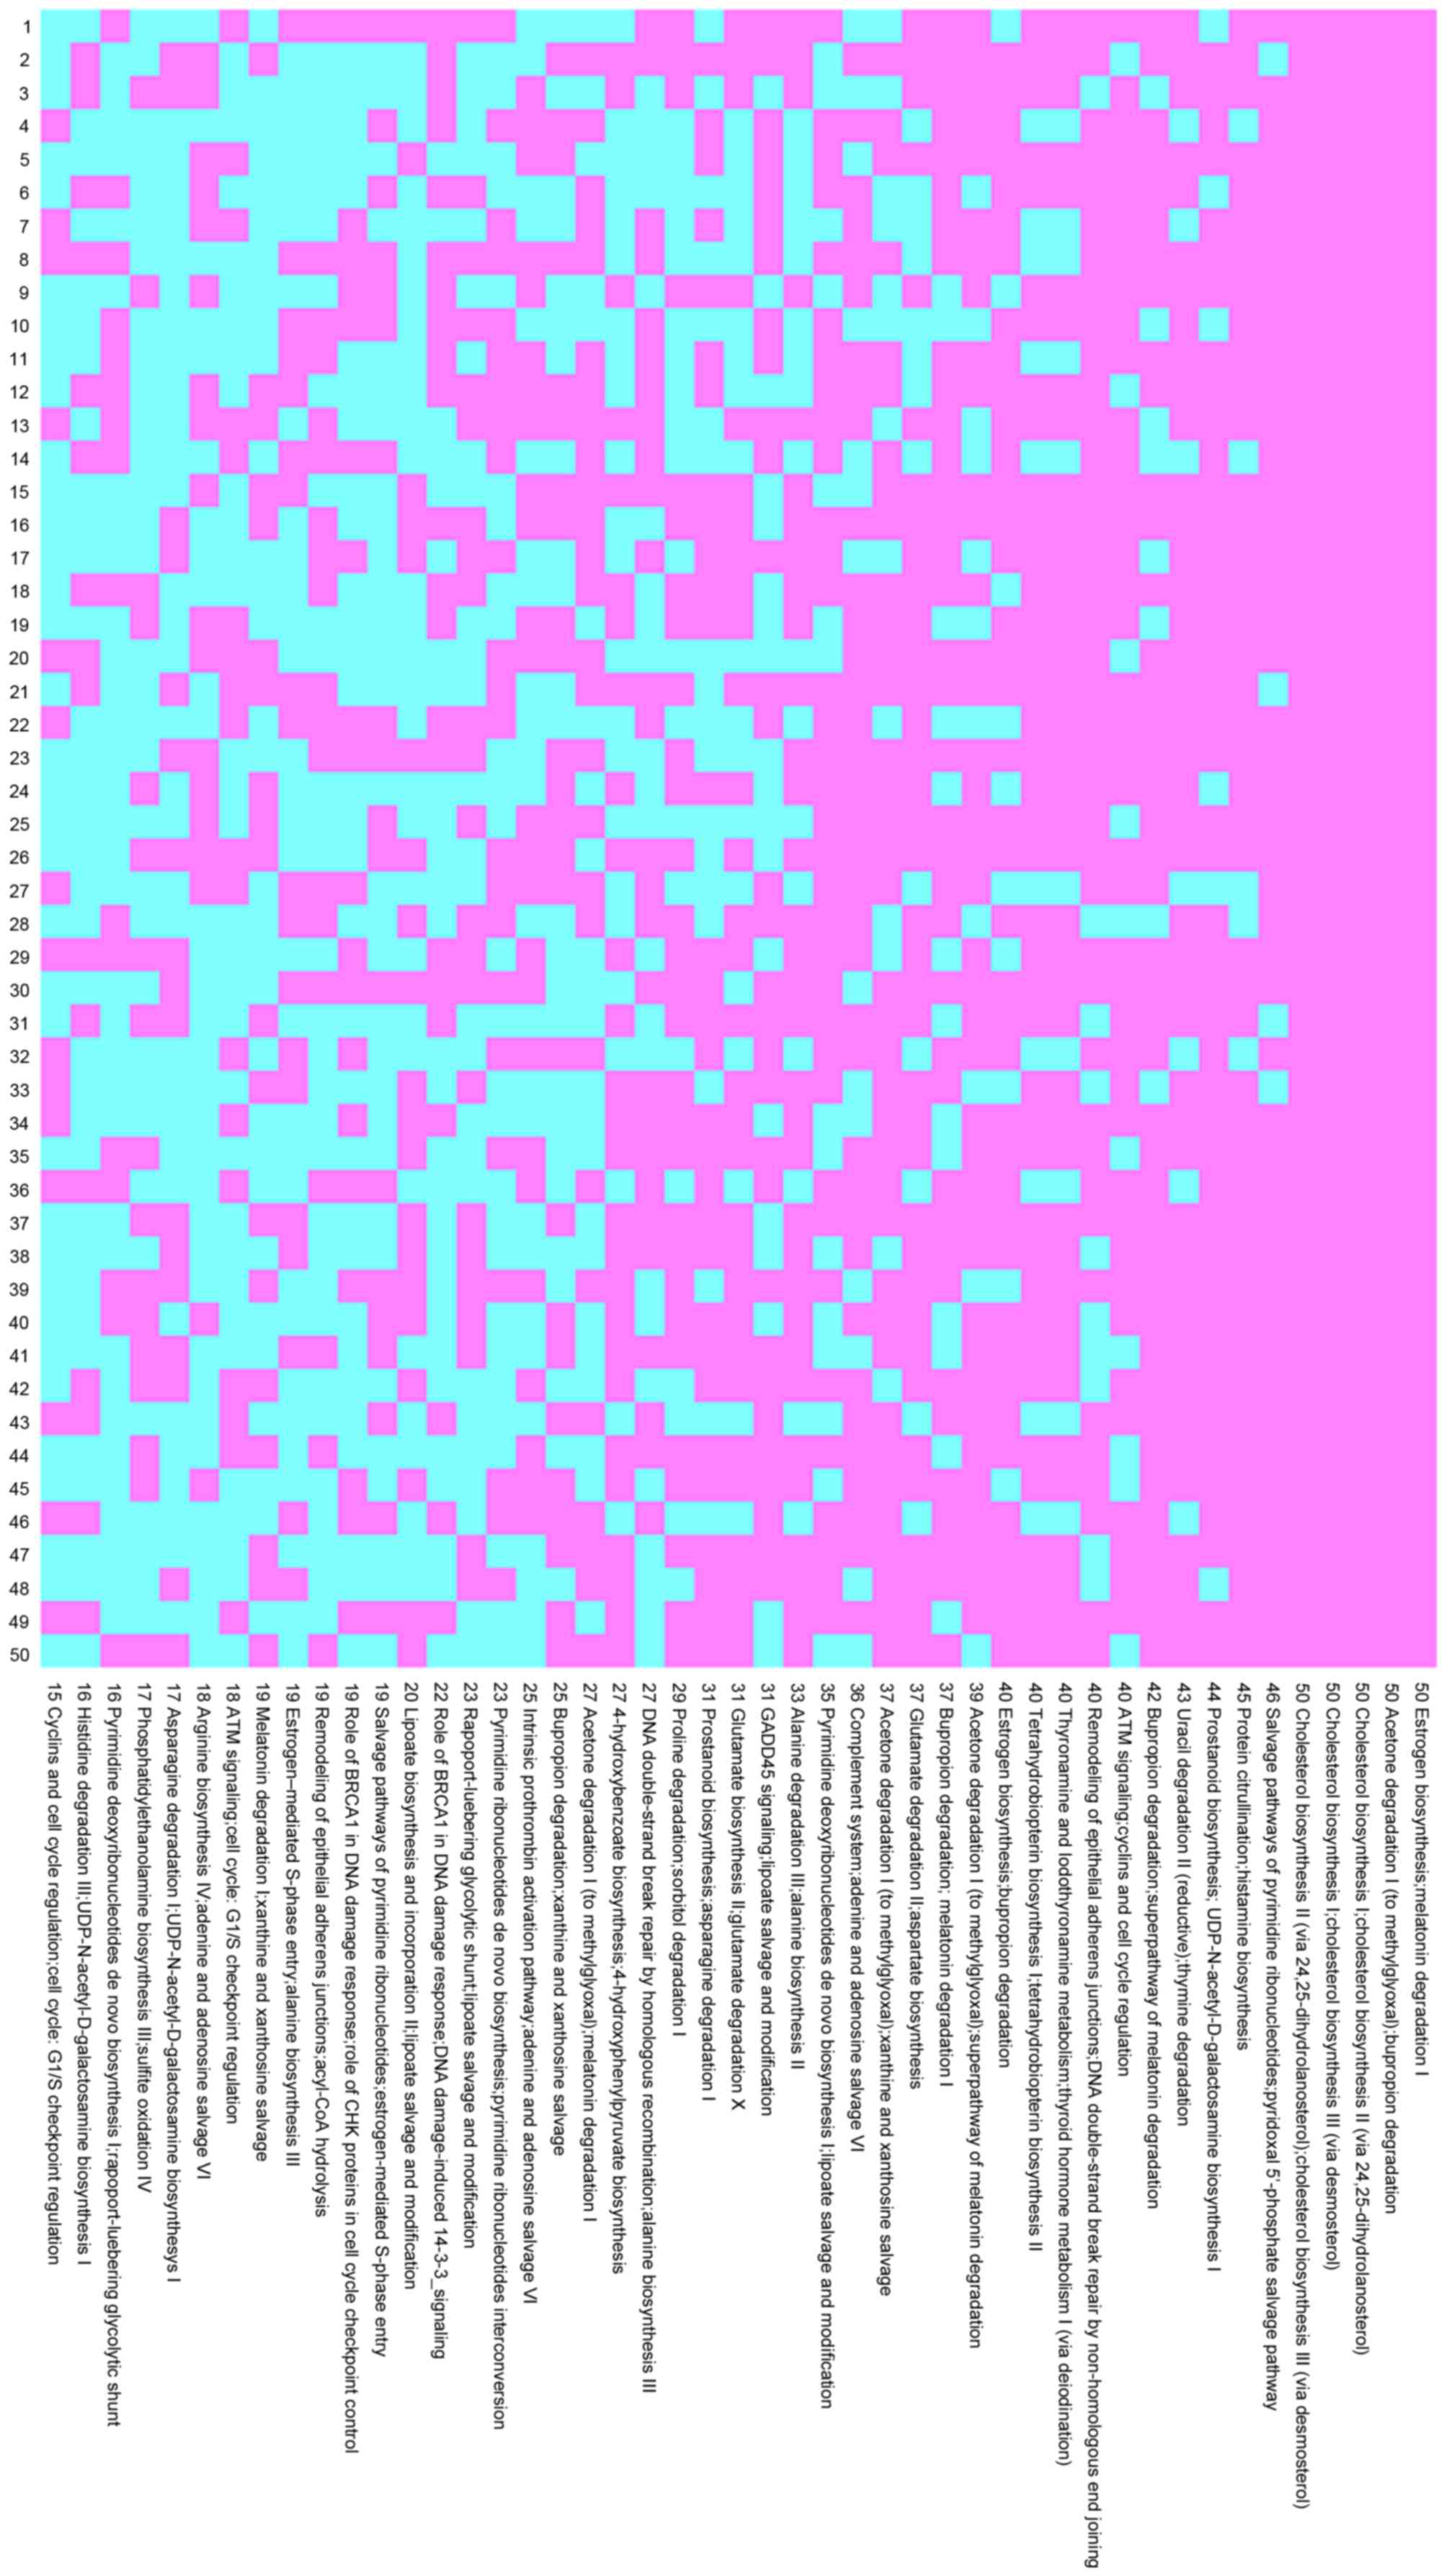
Network analysis
By combining the dysregulated pathways with
Z<0.05 and dysregulated pathway pairs with Z<0.2, individual
networks were constructed. The occurrence number of pathway pairs
in the individual networks was recorded in 50 runs of Monte Carlo
cross-validation. In the HCV group, 15 pathway pairs occurred
>40 times with 5 pathway pairs occurring 50 times, as shown in
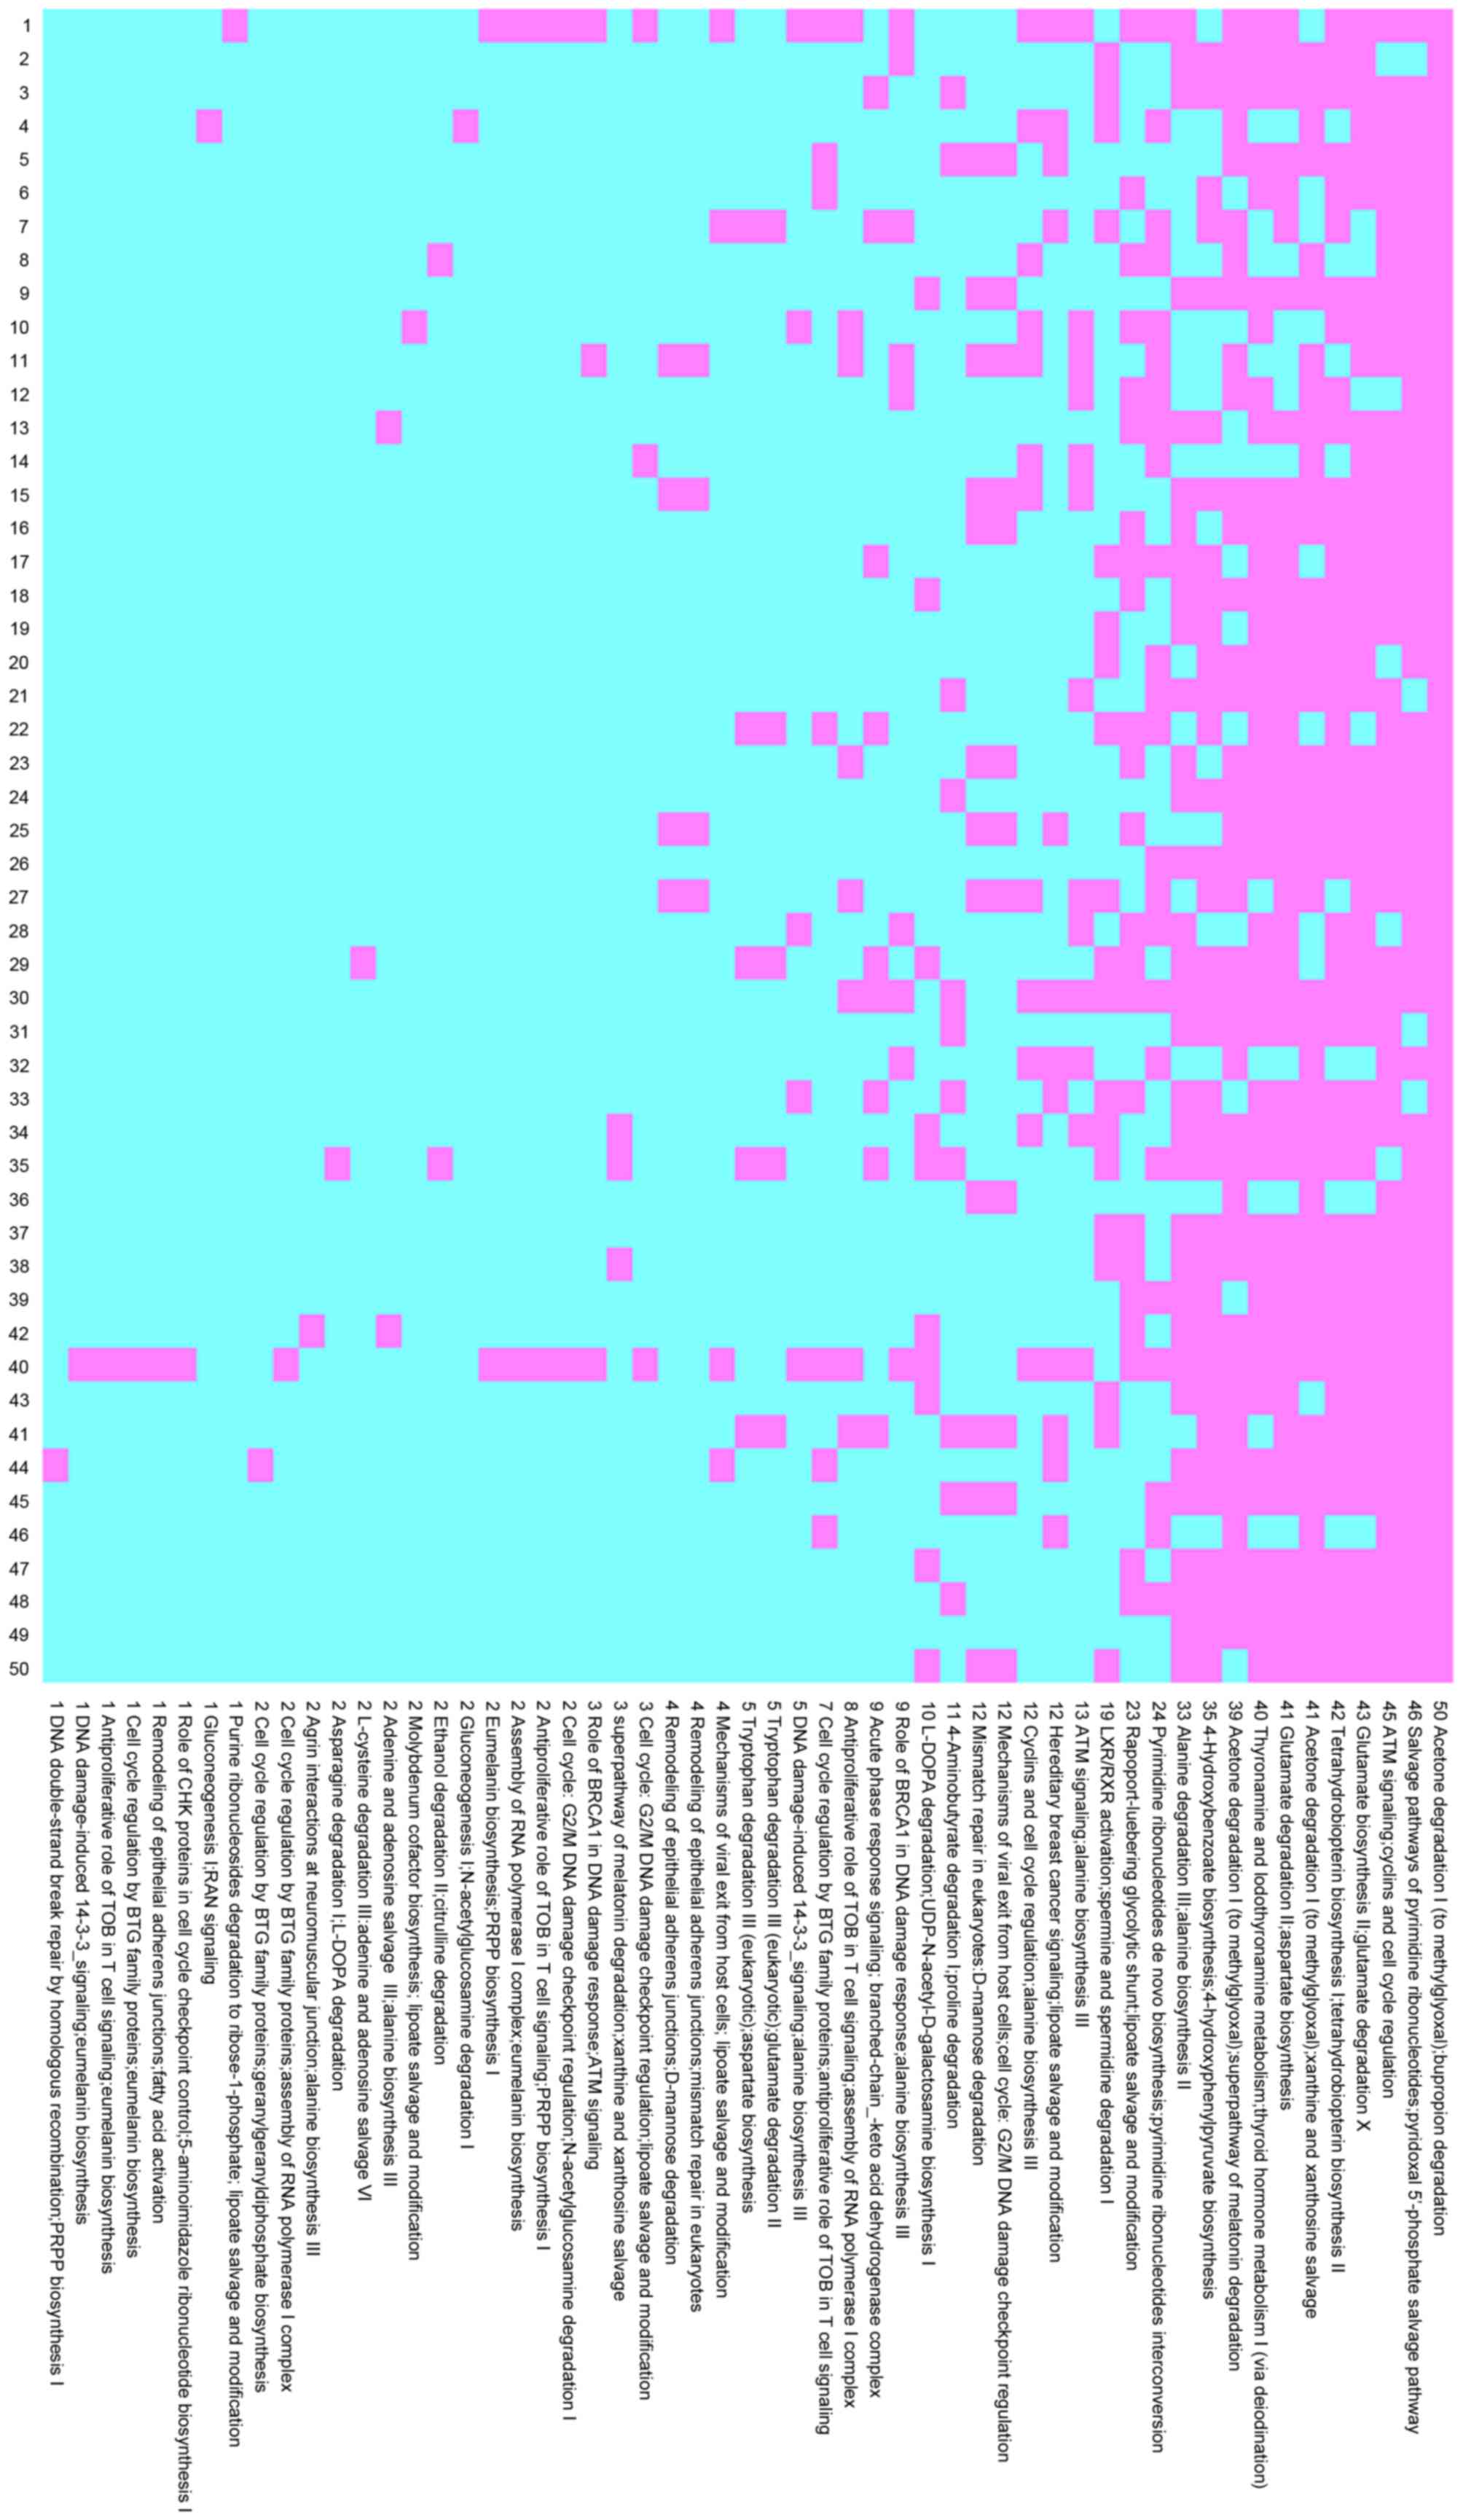
Fig. 1. In the HBV group, 8
pathway pairs occurred >40 times, with 1 pair occurring 50
times, as shown in Fig. 2.
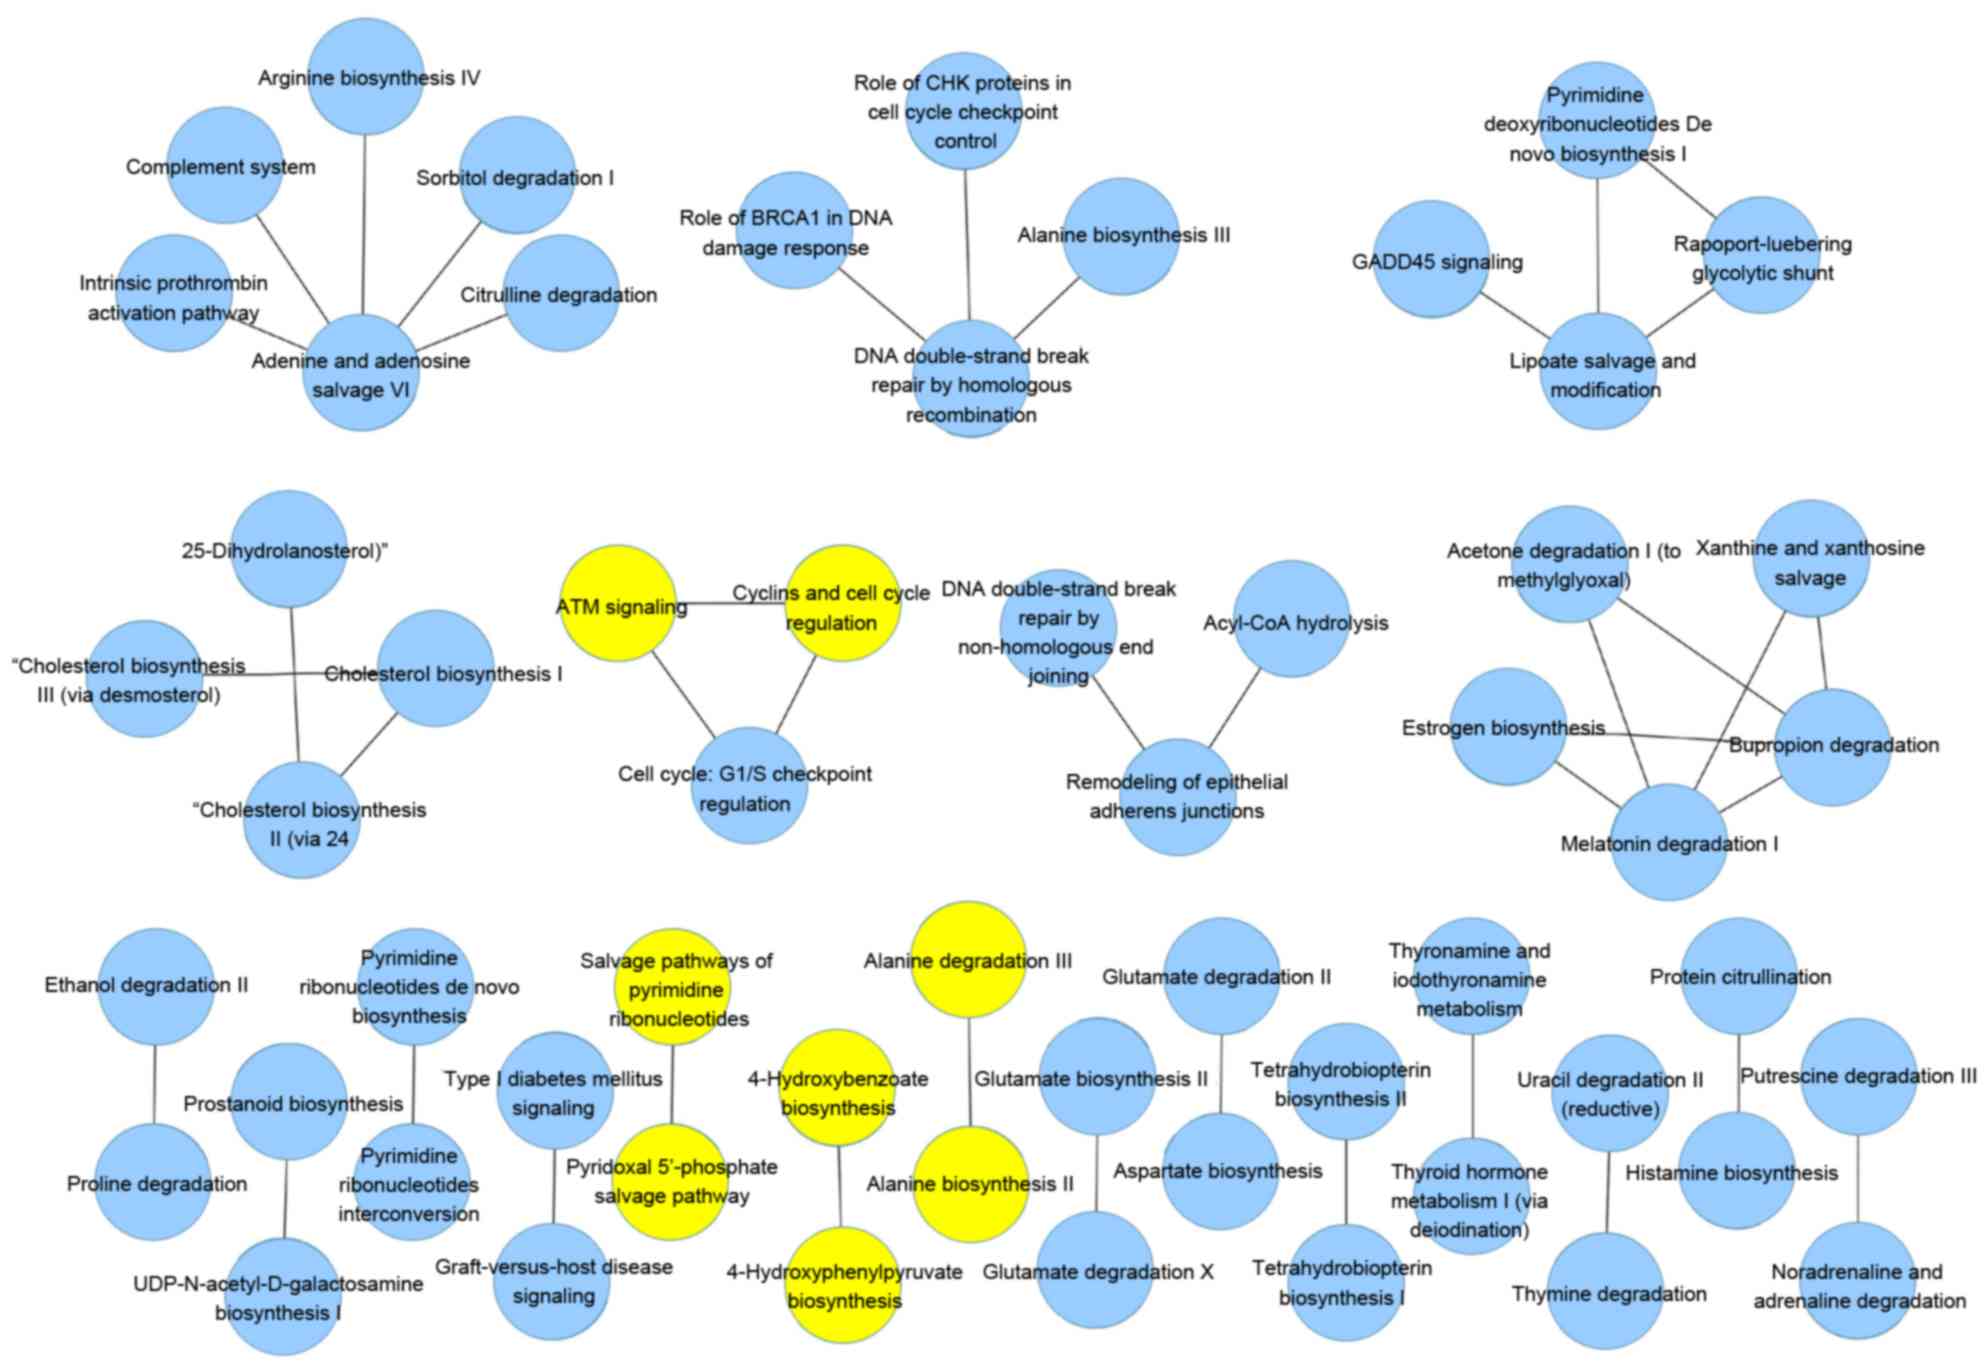
A main network of HCV was constructed from the
individual networks whose edges appeared >5 times, and a main
network of HBV was constructed from individual networks whose edges
appeared >1. Following 50 runs of Monte Carlo cross-validation,
50 networks were constructed. By ranking the networks by their AUC
values, the highest was considered the optimum main network.
In the HCV group, the optimal network contained 41
pairs of pathways, as shown in Fig.
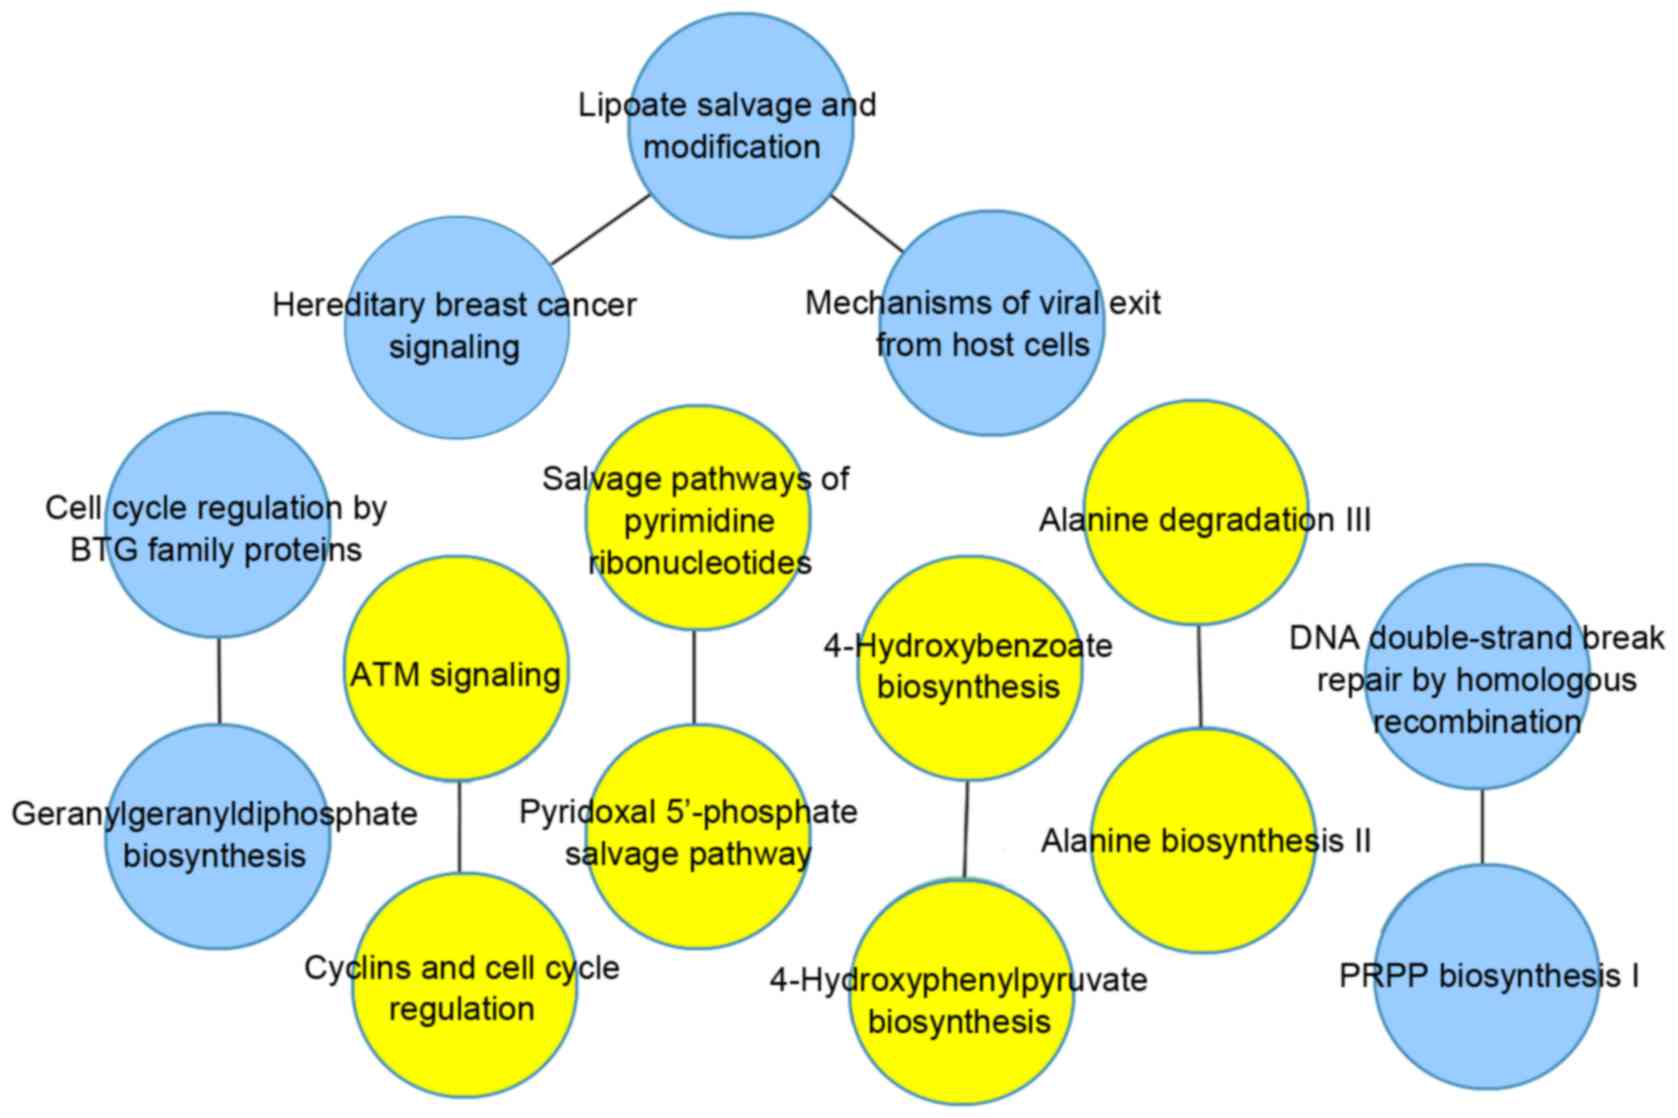
3, and the AUC value was 0.98. In the HBV group, the optimal
network contained 8 pairs of pathways, as shown in Fig. 4, and the AUC value was 0.94.
Following comparative analysis, 4 pathway pairs were identified in
the two groups, which are listed in Table II.
| Table II.Common pathway pairs in the main
networks of HBC and HCV. |
Table II.
Common pathway pairs in the main
networks of HBC and HCV.
| Pathway A | Pathway B | Weight (HCV) | Weight (HBV) |
|---|
| Salvage pathways of
pyrimidine ribonucleotides | Pyridoxal
5′-phosphate Salvage pathway | 0.203549 | 0.19776 |
| ATM signaling | Cyclins and cell
cycle regulation | 0.205993 | 0.205265 |
| Alanine degradation
III | Alanine biosynthesis
II | 0.189711 | 0.191768 |
| 4-hydroxybenzoate
biosynthesis |
4-hydroxyphenylpyruvate biosynthesis | 0.189711 | 0.191768 |
Discussion
Microarray analyses have indicated that different
molecular mechanisms underlie the development of HBV- and
HCV-positive HCC. To identify biomarkers in HBV- and HCV-positive
HCC in the present study, a pathway-based approach was applied by
combining iPAS analysis and Monte Carlo cross-validation.
The data from the present study indicated a similar
mechanism in HCV and HBV. In the results of the Monte Carlo
cross-validation, among pathway pairs, which occurred 50 times, the
pair ‘acetone degradatoin I’ and ‘Bupropion degradation’ was
identified in both the HCV and HBV group. In the optimal main
network, ranked by the AUC values, 4 pathway pairs were present in
the two groups.
There were more differences between HBV- and
HCV-positive HCC at the pathway level. In the heatmap of pathway
pairs, 4 more pairs were identified with an occurrence of 50 times
in the HCV group. In the optimal main networks, with the exception
of the 4 identical pathway pairs, 38 additional pathway pairs were
identified in the HCV group and 4 additional pathway pairs were
identified in the HBV group.
In the HCV group, compared with thenormal control,
HCV induced dysregulated biological pathways, including DNA damage
response, hormone degradation, carbohydrate degradation, cell
cycle, cholesterol biosynthesis, amino acid degradation and
biosynthesis and signaling pathways. The main network with the
highest AUC was considered optimal for diagnosing HCV-positive HCC.
In the main network, the pathways connected with several other
pathways were considered important. It is generally accepted that
cholesterol biosynthesis is important in the production of HCV, and
the targeting enzyme has been suggested as a potential antiviral
strategy against HCV (27). The
pathway of adenine and adenosine salvage VI was connected to 5
other pathways. A cluster of 10 adenines encodes a core protein
from HCV, which is considered to direct programmed ribosomal frame
shifting (28). In 2008, the
involvement of transcriptional slippage in this recoding event was
first demonstrated (29). The
pathway of Melatonin degradation I was linked to 4 pathways. It has
been demonstrated that melatonin has proapoptotic and
antiangiogenic properties in HepG2 liver tumor cells (30), through a molecular mechanism
involving the upregulation of TIMP metallopeptidase inhibitor 1,
and attenuation of the expression and activity of matrix
metalloproteinase-9 via nuclear factor-κB signal pathway
inhibition. Therefore, the present study hypothesized that, in
patients with HCV-positive HCC, its degradation-related pathway is
downregulated. The pathway of bupropion degradation was also found
to link with 4 other pathways. Bupropion is a commonly used an
antidepressant. Previously it was found to exert marked
anti-inflammatory effects via downregulating tumor necrosis
factor-α, interleukin-1β and interferon (IFN)-γ (31). It was demonstrated that bupropion
was effective in treating IFN-α-induced depressive and somatic
symptoms in patients with HCV infection (32).
In the present study, the optimal main network was
screened in the HBV group, which included 8 pathway pairs, of which
4 pairs were also present in the HCV group. In the remaining
pathway pairs, the lipoate salvage and modification pathway had a
higher number of edges, compared with the other pathways. It is
generally accepted that α-lipoic acid has antioxidant and
redox-regulatory properties. Due to these characteristics, it has
been used for the treatment of liver disease (33). In addition, it has been shown to
suppresses the proliferation of different types of tumor cell
through facilitating apoptosis in breast cancer (34). In the present study, the
lipoate-related pathway was closely connected with HBV, which
provided novel insight into the therapy of HBV-positive HCC. In the
networks, certain pathways have been investigated in previous
studies, whereas others have received minimal attention and require
further investigations for verification. In addition, with the
exception of HBV and HCV diseases, network analysis for other liver
associated diseases, including hemochromatosis on a background of
cirrhosis and HCC liver samples, require clarification in future
investigations.
In conclusion, the present study combined iPAS
analysis with the RF classification and Monte Carlo
cross-validation to identify pathway-based networks of HBV- and
HCV-positive HCC. The optimal main networks of the HCV and HBV
groups were identified with the highest AUC values. With these
networks, it may be possible to diagnose patients effectively at an
early stage.
References
|
1
|
Jemal A, Bray F, Center MM, Ferlay J, Ward
E and Forman D: Global cancer statistics. CA Cancer J Clin.
61:69–90. 2011. View Article : Google Scholar : PubMed/NCBI
|
|
2
|
Kumar R, Saraswat MK, Sharma BC, Sakhuja P
and Sarin SK: Characteristics of hepatocellular carcinoma in India:
A retrospective analysis of 191 cases. QJM. 101:479–485. 2008.
View Article : Google Scholar : PubMed/NCBI
|
|
3
|
Wong PY, Xia V, Imagawa DK, Hoefs J and Hu
KQ: Clinical presentation of hepatocellular carcinoma (HCC) in
Asian-Americans versus non-Asian-Americans. J Immigr Minor Health.
13:842–848. 2011. View Article : Google Scholar : PubMed/NCBI
|
|
4
|
Lo CM, Ngan H, Tso WK, Liu CL, Lam CM,
Poon RT, Fan ST and Wong J: Randomized controlled trial of
transarterial lipiodol chemoembolization for unresectable
hepatocellular carcinoma. Hepatology. 35:1164–1171. 2002.
View Article : Google Scholar : PubMed/NCBI
|
|
5
|
Ma S, Jiao B and Liu X, Yi H, Kong D, Gao
L, Zhao G, Yang Y and Liu X: Approach to radiation therapy in
hepatocellular carcinoma. Cancer Treat Rev. 36:157–163. 2010.
View Article : Google Scholar : PubMed/NCBI
|
|
6
|
Abou-Alfa GK: Hepatocellular carcinoma:
Molecular biology and therapy. Semin Oncol. 33:(6 Suppl 11).
S79–S83. 2006. View Article : Google Scholar : PubMed/NCBI
|
|
7
|
Sherman M: Hepatocellular carcinoma:
Epidemiology, risk factors, and screening. Semin Liver Dis.
25:143–154. 2005. View Article : Google Scholar : PubMed/NCBI
|
|
8
|
Attwa MH and El-Etreby SA: Guide for
diagnosis and treatment of hepatocellular carcinoma. World J
Hepatol. 7:1632–1651. 2015. View Article : Google Scholar : PubMed/NCBI
|
|
9
|
Di Bisceglie AM, Sterling RK, Chung RT,
Everhart JE, Dienstag JL, Bonkovsky HL, Wright EC, Everson GT,
Lindsay KL, Lok AS, et al: Serum alpha-fetoprotein levels in
patients with advanced hepatitis C: Results from the HALT-C Trial.
J Hepatol. 43:434–441. 2005. View Article : Google Scholar : PubMed/NCBI
|
|
10
|
Woo HG, Park ES, Cheon JH, Kim JH, Lee JS,
Park BJ, Kim W, Park SC, Chung YJ, Kim BG, et al: Gene
expression-based recurrence prediction of hepatitis B virus-related
human hepatocellular carcinoma. Clin Cancer Res. 14:2056–2064.
2008. View Article : Google Scholar : PubMed/NCBI
|
|
11
|
Tackels-Horne D, Goodman MD, Williams AJ,
Wilson DJ, Eskandari T, Vogt LM, Boland JF, Scherf U and Vockley
JG: Identification of differentially expressed genes in
hepatocellular carcinoma and metastatic liver tumors by
oligonucleotide expression profiling. Cancer. 92:395–405. 2001.
View Article : Google Scholar : PubMed/NCBI
|
|
12
|
Thomas MB, Jaffe D, Choti MM, Belghiti J,
Curley S, Fong Y, Gores G, Kerlan R, Merle P, O'Neil B, et al:
Hepatocellular carcinoma: Consensus recommendations of the National
Cancer Institute Clinical Trials Planning Meeting. J Clin Oncol.
28:3994–4005. 2010. View Article : Google Scholar : PubMed/NCBI
|
|
13
|
Papatheodoridis GV, Chan HL, Hansen BE,
Janssen HL and Lampertico P: Risk of hepatocellular carcinoma in
chronic hepatitis B: Assessment and modification with current
antiviral therapy. J Hepatol. 62:956–967. 2015. View Article : Google Scholar : PubMed/NCBI
|
|
14
|
Yao M, Yao DF, Bian YZ, Wu W, Yan XD, Yu
DD, Qiu LW, Yang JL, Zhang HJ, Sai WL and Chen J: Values of
circulating GPC-3 mRNA and alpha-fetoprotein in detecting patients
with hepatocellular carcinoma. Hepatobiliary Pancreat Dis Int.
12:171–179. 2013. View Article : Google Scholar : PubMed/NCBI
|
|
15
|
Lee SY, Song KH, Koo I, Lee KH, Suh KS and
Kim BY: Comparison of pathways associated with hepatitis B- and
C-infected hepatocellular carcinoma using pathway-based class
discrimination method. Genomics. 99:347–354. 2012. View Article : Google Scholar : PubMed/NCBI
|
|
16
|
Ahn T, Lee E, Huh N and Park T:
Personalized identification of altered pathways in cancer using
accumulated normal tissue data. Bioinformatics. 30:i422–i429. 2014.
View Article : Google Scholar : PubMed/NCBI
|
|
17
|
Kim BY, Choi DW, Woo SR, Park ER, Lee JG,
Kim SH, Koo I, Park SH, Han CJ, Kim SB, et al:
Recurrence-associated pathways in hepatitis B virus-positive
hepatocellular carcinoma. BMC Genomics. 16:2792015. View Article : Google Scholar : PubMed/NCBI
|
|
18
|
Yoon SY, Kim JM, Oh JH, Jeon YJ, Lee DS,
Kim JH, Choi JY, Ahn BM, Kim S, Yoo HS, et al: Gene expression
profiling of human HBV- and/or HCV-associated hepatocellular
carcinoma cells using expressed sequence tags. Int J Oncol.
29:315–327. 2006.PubMed/NCBI
|
|
19
|
Parkinson H, Kapushesky M, Shojatalab M,
Abeygunawardena N, Coulson R, Farne A, Holloway E, Kolesnykov N,
Lilja P, Lukk M, et al: ArrayExpress-a public database of
microarray experiments and gene expression profiles. Nucleic Acids
Res. 35:(Database Issue). D747–D750. 2007. View Article : Google Scholar : PubMed/NCBI
|
|
20
|
Bolstad BM, Irizarry RA, Astrand M and
Speed TP: A comparison of normalization methods for high density
oligonucleotide array data based on variance and bias.
Bioinformatics. 19:185–193. 2003. View Article : Google Scholar : PubMed/NCBI
|
|
21
|
Benjamini Y and Yekutieli D: Quantitative
trait Loci analysis using the false discovery rate. Genetics.
171:783–790. 2005. View Article : Google Scholar : PubMed/NCBI
|
|
22
|
Golub TR, Slonim DK, Tamayo P, Huard C,
Gaasenbeek M, Mesirov JP, Coller H, Loh ML, Downing JR, Caligiuri
MA, et al: Molecular classification of cancer: Class discovery and
class prediction by gene expression monitoring. Science.
286:531–537. 1999. View Article : Google Scholar : PubMed/NCBI
|
|
23
|
Orsetti B, Nugoli M, Cervera N, Lasorsa L,
Chuchana P, Rougé C, Ursule L, Nguyen C, Bibeau F, Rodriguez C and
Theillet C: Genetic profiling of chromosome 1 in breast cancer:
Mapping of regions of gains and losses and identification of
candidate genes on 1q. Br J Cancer. 95:1439–1447. 2006. View Article : Google Scholar : PubMed/NCBI
|
|
24
|
Burgette LF and Reiter JP: Multiple
imputation for missing data via sequential regression trees. Am J
Epidemiol. 172:1070–1076. 2010. View Article : Google Scholar : PubMed/NCBI
|
|
25
|
Tsuji S, Midorikawa Y, Takahashi T, Yagi
K, Takayama T, Yoshida K, Sugiyama Y and Aburatani H: Potential
responders to FOLFOX therapy for colorectal cancer by Random
Forests analysis. Br J Cancer. 106:126–132. 2012. View Article : Google Scholar : PubMed/NCBI
|
|
26
|
Colaprico A, Cava C, Bertoli G, Bontempi G
and Castiglioni I: Integrative analysis with Monte Carlo
Cross-Validation reveals miRNAs regulating pathways Cross-talk in
aggressive breast cancer. Biomed Res Int. 2015:8313142015.
View Article : Google Scholar : PubMed/NCBI
|
|
27
|
Saito K, Shirasago Y, Suzuki T, Aizaki H,
Hanada K, Wakita T, Nishijima M and Fukasawa M: Targeting cellular
squalene synthase, an enzyme essential for cholesterol
biosynthesis, is a potential antiviral strategy against hepatitis C
virus. J Virol. 89:2220–2232. 2015. View Article : Google Scholar : PubMed/NCBI
|
|
28
|
Xu Z, Choi J, Yen TS, Lu W, Strohecker A,
Govindarajan S, Chien D, Selby MJ and Ou J: Synthesis of a novel
hepatitis C virus protein by ribosomal frameshift. EMBO J.
20:3840–3848. 2001. View Article : Google Scholar : PubMed/NCBI
|
|
29
|
Ratinier M, Boulant S, Combet C,
Targett-Adams P, McLauchlan J and Lavergne JP: Transcriptional
slippage prompts recoding in alternate reading frames in the
hepatitis C virus (HCV) core sequence from strain HCV-1. J Gen
Virol. 89:1569–1578. 2008. View Article : Google Scholar : PubMed/NCBI
|
|
30
|
Carbajo-Pescador S, Ordoñez R, Benet M,
Jover R, García-Palomo A, Mauriz JL and González-Gallego J:
Inhibition of VEGF expression through blockade of Hif1α and STAT3
signalling mediates the anti-angiogenic effect of melatonin in
HepG2 liver cancer cells. Br J Cancer. 109:83–91. 2013. View Article : Google Scholar : PubMed/NCBI
|
|
31
|
Brustolim D, Ribeiro-dos-Santos R, Kast
RE, Altschuler EL and Soares MB: A new chapter opens in
anti-inflammatory treatments: The antidepressant bupropion lowers
production of tumor necrosis factor-alpha and interferon-gamma in
mice. Int Immunopharmacol. 6:903–907. 2006. View Article : Google Scholar : PubMed/NCBI
|
|
32
|
Chen WC, Lai HC, Su WP, Palani M and Su
KP: Bupropion for interferon-alpha-induced depression in patients
with hepatitis C viral infection: An open-label study. Psychiatry
Investig. 12:142–145. 2015. View Article : Google Scholar : PubMed/NCBI
|
|
33
|
Packer L, Tritschler HJ and Wessel K:
Neuroprotection by the metabolic antioxidant alpha-lipoic acid.
Free Radic Biol Med. 22:359–378. 1997. View Article : Google Scholar : PubMed/NCBI
|
|
34
|
Na MH, Seo EY and Kim WK: Effects of
alpha-lipoic acid on cell proliferation and apoptosis in MDA-MB-231
human breast cells. Nutr Res Pract. 3:265–271. 2009. View Article : Google Scholar : PubMed/NCBI
|