Introduction
Hepatocellular carcinoma (HCC) is one of the most
common malignancies, worldwide it is the fifth most common cancer
in men and the seventh in women (1). The occurrence and development of HCC
is predominantly associated with chronic hepatitis B virus (HBV)
and/or hepatitis C virus (HCV) infections (2). Surgical resection remains the main
therapy for the majority of HCC cases and only 30–40% of patients
with HCC can be cured by surgical resection following diagnosis
(3). Exploration of an effective
and reliable prediction diagnosis tool for HCC would markedly
improve the prognosis of patients with HCC.
The pathogenesis of HCC has been widely studied.
Multiple mechanisms have been reported to be involved in the
pathogenesis of HCC including tumor suppressor genes, oncogenes,
viral effects and angiogenesis (4). Developing molecular indicators with
improved sensitivity and specificity serves an important role in
the diagnosis of HCC (5). With the
development of high-throughput sequencing technologies, numerous
genetic expression profiles associated with tumorigenesis have been
established and used for classification and diagnostic prediction
of cancer (6,7). However, despite the large quantity of
public gene information available, effective diagnostic methods for
the prediction of the prognosis of HCC are required.
Genetic mutations are the main factors contributing
to tumorigenesis, accompanied by the change of certain critical
biological processes including immune regulation, the cell cycle,
angiogenesis, wound repair and autophagy (8–12).
Differentially expressed genes (DEGs) during tumorigenesis lead to
changes in pathways and biological processes. The pathways were not
independent in function, however were correlated between the
pathways. The cross talk genes shared by the correlated pathways
are potential biomarkers and therapeutic targets for cancer.
Identification of these cross talk genes may provide important
information about HCC.
In the present study, gene expression profile data
regarding HCC was downloaded from the public information database,
in order to try to establish an effective classifier for HCC
prognosis prediction based on the cross talk genes involved in HCC.
The diagnostic performance of the classifier additionally has been
verified in other independent datasets.
Materials and methods
Data source and preprocessing
The mRNA expression profiles of GSE36376 of HCC were
extracted from Gene Expression Omnibus (GEO) (http://www.ncbi.nlm.nih.gov/geo/) using Illumina
Human HT-12 v4.0 expression beadchip (GPL10558-11219; Illumina,
Inc., HCC, including 240 tumor samples and 193 para-cancerous
normal liver tissues. The raw data and probe annotation files were
downloaded for analysis.
The probe-level data were obtained from the CEL
files and converted into expression value. The data were normalized
using the z-score normalization to increase the extent of
differential expression. For each sample, the expression values of
all probes for a given gene were reduced to a single value by
taking the average expression value.
Screening of DEGs
Limma, a microarray analysis program available in
the Bioconductor R package, was used to identify the DEGs in tumor
samples compared to the para-cancerous normal liver tissues
(13). In order to reduce the
information loss caused by multiple-testing adjustment, P-values
without adjustment by the false discovery rate were used to
identify DEGs. P<0.05 and |log fold chance (FC)|>1.5 were set
as thresholds to screen out DEGs.
Construction of protein-protein
interaction (PPI) network
The human PPIs were downloaded from the Biological
General Repository for Interaction Datasets (BioGrid; http://www.thebiogrid.org) and Human Protein Reference
Database (HPRD; http://www.hprd.org/). Subsequent to
merging two sets of data, a total of 14,553 genes and 662,360
interactions were identified. The DEGs identified above were mapped
to the PPI network, in which the non-DEGs that interacted with at
least 3 other DEGs were also included. Subsequent to removing the
isolated nodes, the PPI network of DEGs associated with HCC was
constructed. Subsequently, the network topological properties were
analyzed using the network analysis package in Cytoscape software
version 3.5.0 (http://www.cytoscape.org/). A total of five key
topological indicators were defined to describe the behaviors or
characteristics of the nodes in the PPI network, including degrees,
average shortest path length (ASPL), closeness centrality (CC),
eccentricity (EC) and topological coefficient (TC). Additionally,
the hub node was selected based on the degree of the nodes, which
was calculated by counting the edges launching from a protein in
the PPI network.
Identification of critical genes
Critical genes were selected based on the deviation
score of DEGs and the degree of node in the PPI network. The
deviation score of DEGs was determined by the expression interval
of each gene in para-cancerous normal liver tissue, which was
defined as ‘I’.
I = [min, max], where min indicated the subtraction
of mean value and standard deviation value of gene ‘i’ in
para-cancerous normal liver tissue; max indicated the sum of mean
value and standard deviation value of gene ‘i’ in para-cancerous
normal liver tissue.
Deviation score was calculated using Euclidean
distance based on the value of gene ‘i’ expressing in each sample
beyond the range of I.
Score=∑1n(di–d)2
Where di indicated the expression value
of gene ‘i’. When di<min in the range of I, d=min;
when di>max in the range of I, d=max. A higher
deviation score indicated a bigger deviation of gene ‘i’ in tumor
samples compared with that in non-tumor samples.
Critical genes were selected based on the score of
W, which was calculated as follows:
W=Score*degree
The degree was normalized using the logarithm at the
base of 2. A bigger value of degree indicated more interactions of
gene ‘i’ interacting with other DEGs and a greater importance.
Finally, the W value of each gene was ranked, and the top 100 genes
and the bottom 100 genes were selected as critical genes.
Hierarchical cluster analysis based on
changes of pathways
In order to identify the pathways of these critical
genes involved, analysis of the top 50 critical genes was conducted
using Kyoto encyclopedia of genes and genomes (KEGG) (14) pathways enrichment analysis using
the Database for Annotation, Visualization and Integrated Discovery
database (15). Enrichment
analysis performed on upregulated and downregulated DEGs was
determined using a hypergeometric test with P<0.1. The union of
pathways from enrichment analysis was defined as the important
biological pathways in HCC.
Subsequently, cluster analysis of the samples was
performed based on the enriched pathways. The changes of each
enriched pathway in each sample were determined by the expression
value of DEGs involved in the enriched pathway. The score of
indicated pathway was determined by the following formula:
Pathscore=log∑imω(di–d¯i)2∑jnω(dj–d¯j)2
Where pathscore of indicated the score of pathway P;
m indicated the number of upregulated DEGs in the enriched pathway
of P; n indicated the number of downregulated DEGs in the enriched
pathway of P; di or dj indicated the average
expression value of upregulated gene ‘i’ or the downregulated gene
‘j’ in para-cancerous normal liver tissue. Pathscore >0
indicated the enriched pathway of P was upregulated in HCC tissue
compared with non-cancer tissue, while a pathscore <0 indicated
that the pathway of P was downregulated.
In the end, cluster analysis was performed on all
samples and acquired pathways using hierarchical cluster approach
(16). Data were pre-processed by
logarithmic transformation. All samples and pathways were
normalized through median center and similarity matrix was
calculated by correlation center. The results were visualized using
R package.
Identification of cross talk
genes
Based on the hierarchical cluster results,
significant correlations between several important biological
pathways were identified. Subsequently, the correlation between the
significant pathways was evaluated using Pearson correlation
coefficient in the SciPy.stats library within Python (https://docs.scipy.org/doc/scipy/reference/stats.html)
and identified to be significantly positively or significantly
negatively correlated pathways sets. Based on the DEG distribution
in each pathway, cross talk genes between correlated pathways were
screened out.
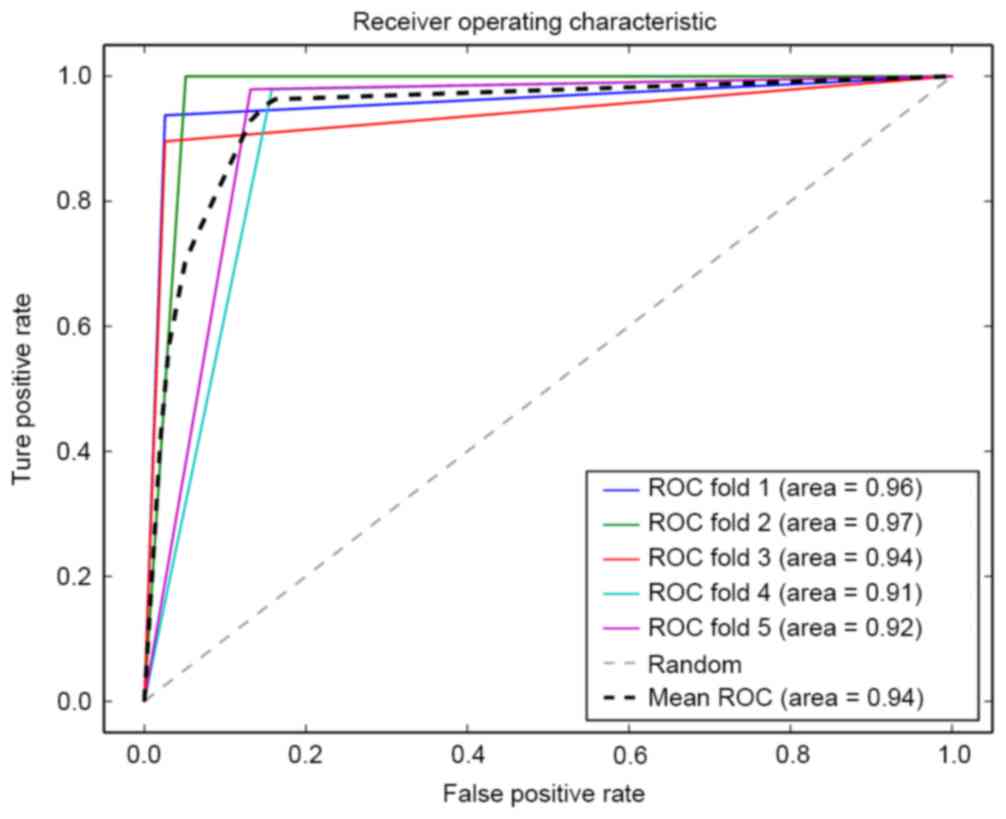
Construction of the classifier
A classifier was constructed based on selected cross
talk genes from several significantly correlated functional
pathways using the random forest algorithm (17). Firstly, all samples were rearranged
stochastically and divided into 5 parts: 4 of 5 parts were used as
training sets to acquire the threshold parameter for training
model, while the other part was used as test set. Following this,
the trained classifier was used to predict the accuracy within the
test set by calculating the false positive rate and false negative
rate. The process was repeated 10 times until all samples regarded
as test set were predicted. Receiver operating characteristic (ROC)
curve analysis was performed to evaluate the classification
performance and robustness of the prediction model.
Validation the prognosis prediction
efficacy in other independent datasets
The expression profile information and clinical data
of HCC samples was downloaded from The Cancer Genome Atlas (TCGA)
and GEO database. Two independent expression profile datasets were
downloaded from GEO, which were E-GEOD-54236 and E-GEOD-27150.
There were 373 HCC samples obtained from TCGA database, 81 samples
in E-GEOD-54236 and 81 samples in E-GEOD-27150. For each sample,
abnormal expression of at least one cross talk gene was defined as
high risk for HCC, while the patients without cross talk genes
changing were considered as low-risk. Next, survival analysis was
performed to compare the survival time between high-risk and
low-risk patients to validate the prognosis prediction efficacy of
identified cross talk genes.
Results
Identification of DEGs
For the database GSE36376 at P=0.05 and |log FC| of
1.5, a total of 249 DEGs were screened between tumor samples and
para-cancerous normal liver tissue. Among these DEGs, 219
upregulated genes and 30 downregulated genes were included.
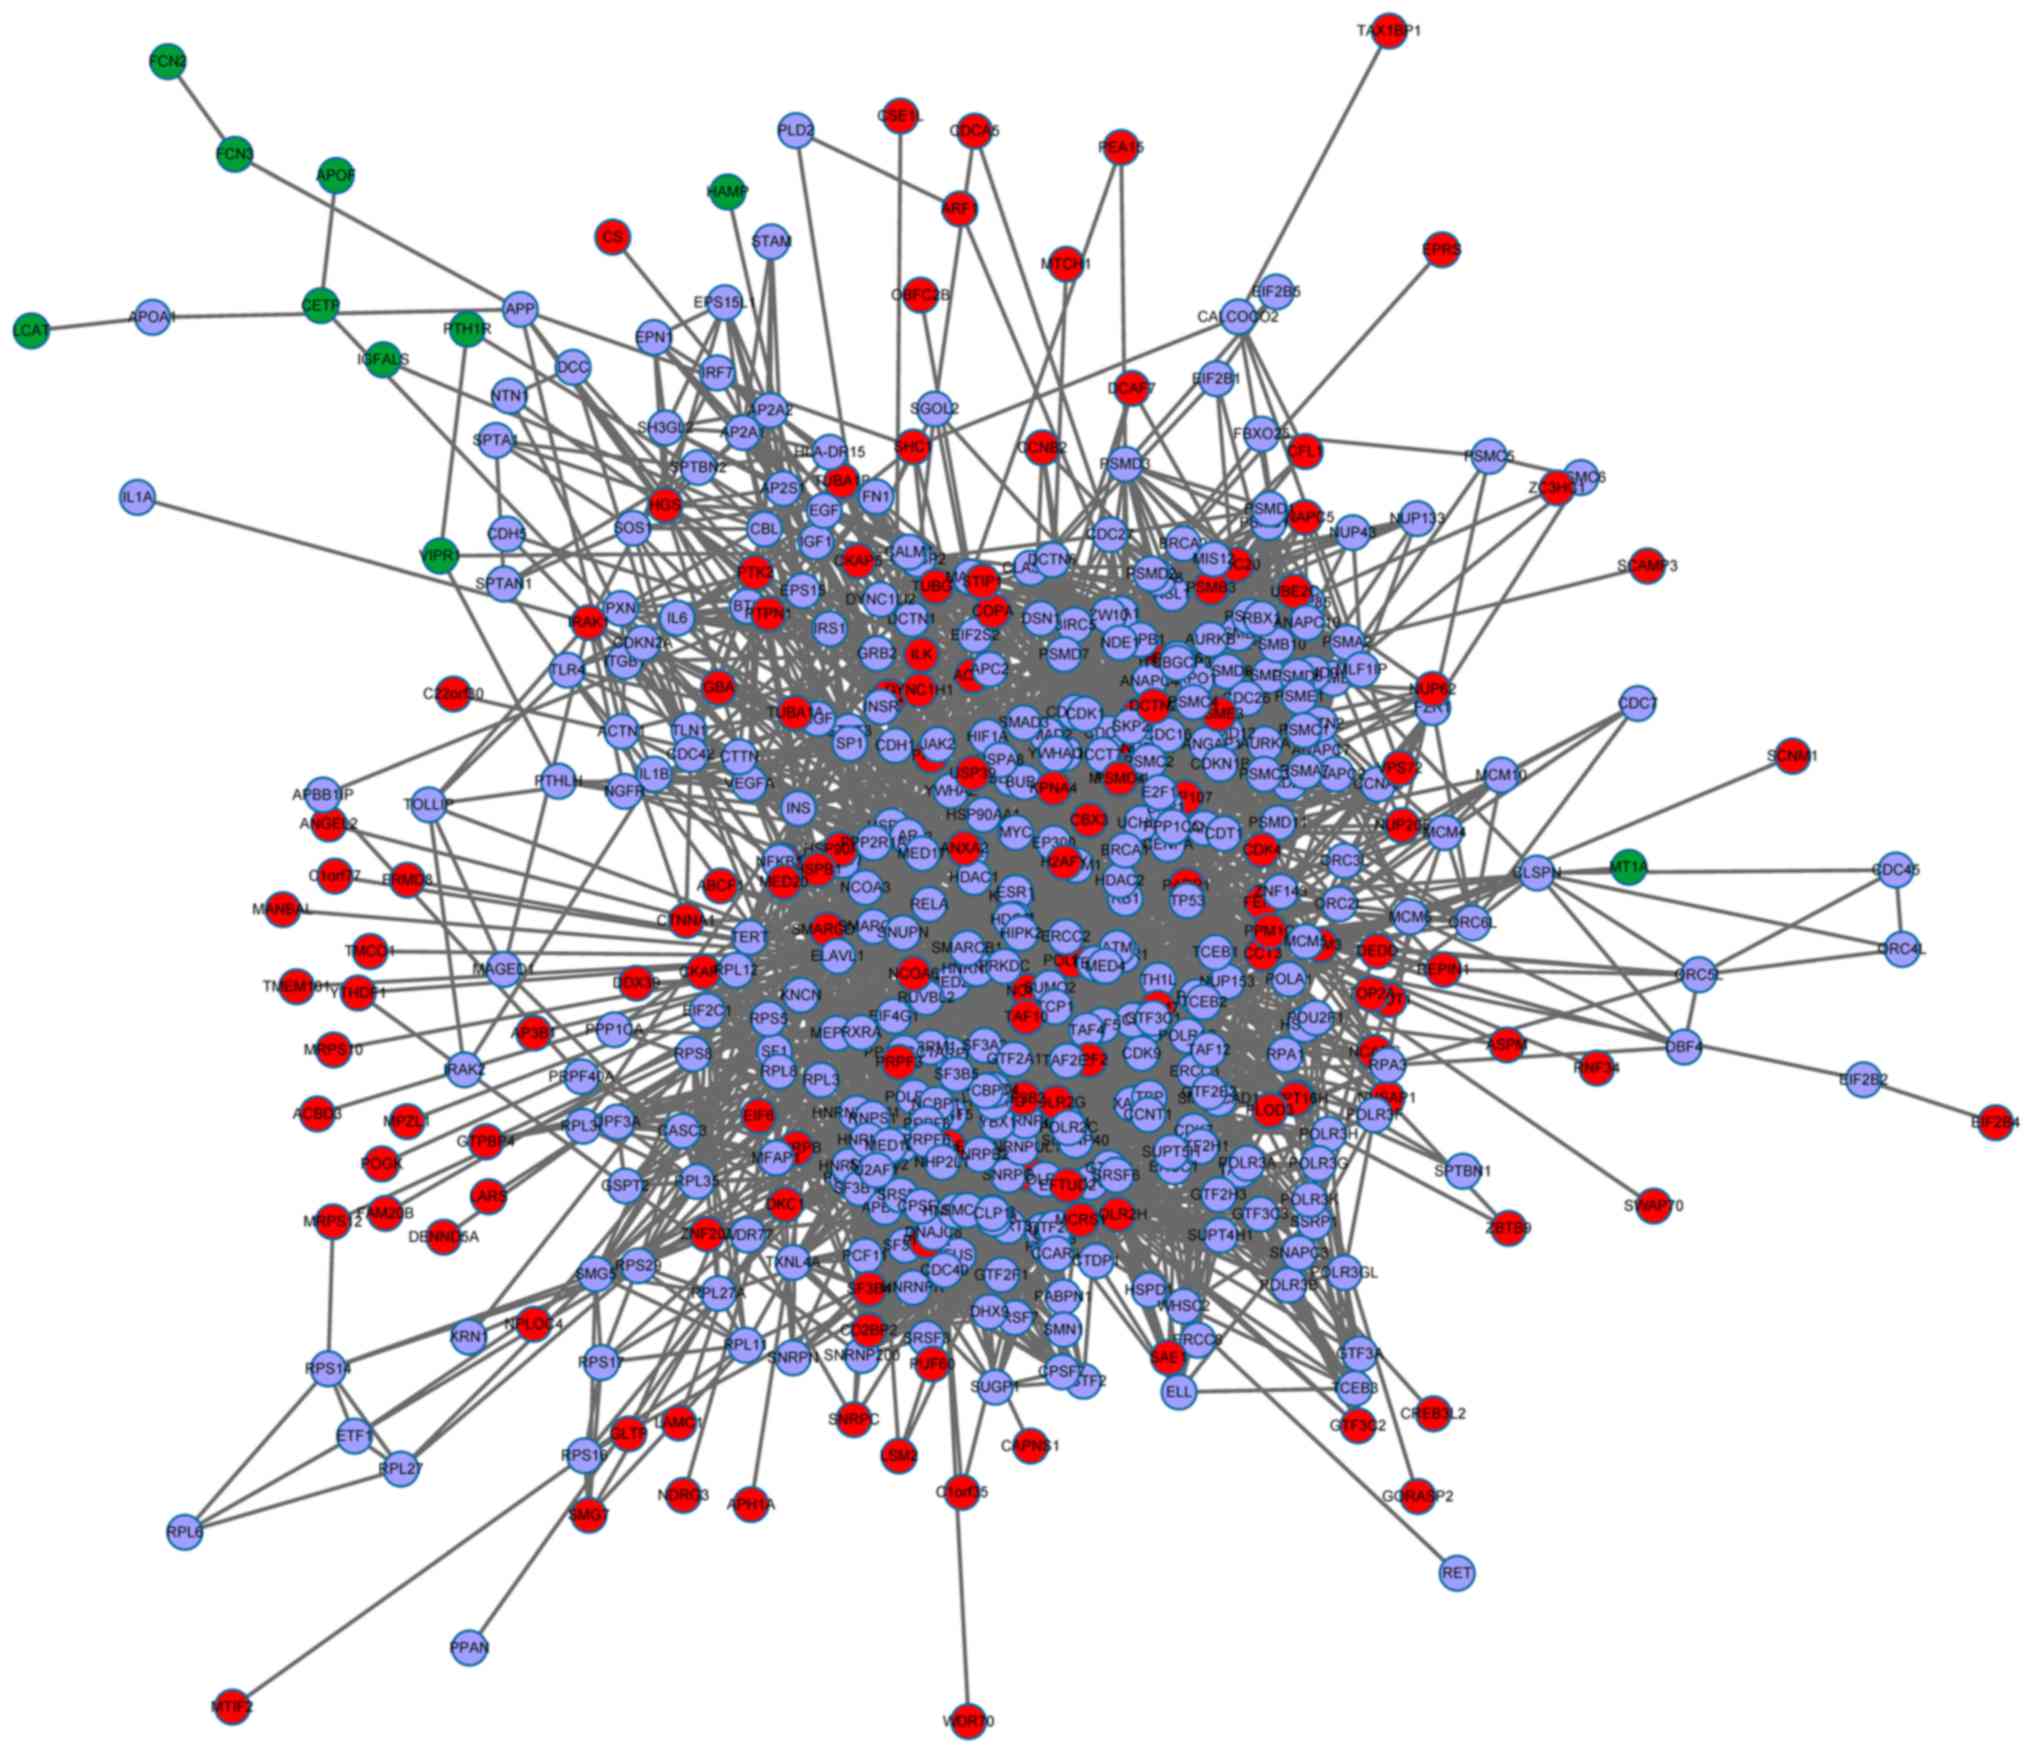
Construction of PPI network
Firstly, the human protein-protein interactions from
the BioGrid and HPRD database were merged, followed by 249
identified DEGs mapped to the PPI network. Subsequent to removing
the isolated nodes, the PPI network was constructed containing 504
nodes and 4,650 edges (Fig.
1).
Analysis of network topological
properties
The average values of key topological indicators
degrees, ASPL, CC, EC and TC were from all genes in the PPI network
were calculated and compared between all genes and DEGs. The
results were presented in Table I.
Compared with those of all genes, DEGs had significantly smaller
value of degree and CC, and larger value of EC, ASPL and TC. The
changes in these five topological indicators indicated that
compared with the background network established based on all
genes, the network efficiency of specific network established based
on DEGs was reduced: Lower value of degrees indicated lower
contribution of each gene to the PPI network; increased values of
ASPL, EC and TC, and a decreased value of CC indicated the
decreased compactness of the PPI network and decreased capacity for
signal transduction between genes.
 | Table I.Key topological indicators of
specific genes and all genes in the protein-protein interaction
network. |
Table I.
Key topological indicators of
specific genes and all genes in the protein-protein interaction
network.
| Feature | Specific genes | All genes | P-value |
|---|
| Degree | 5.23 | 7.01 |
1.46×10⁻² |
| EC | 8.52 | 6.51 |
2.20×10⁻¹⁶ |
| ASPL | 4.17 | 2.97 |
3.87×10⁻¹⁵ |
| CC | 0.24 | 0.35 |
2.44×10⁻³ |
| TC | 0.24 | 0.17 |
8.40×10⁻⁹ |
Identification of critical genes and
pathway enrichment
A total of 200 critical genes including the top 100
genes and the bottom 100 genes were screened out. The expression
value of these genes deviated significantly in HCC tissues. In
addition, these genes are always hub nodes with high degrees in the
PPI network (18). Genes that
interact with multiple DEGs are possibly involved in regulation of
several biological processes (19,20).
KEGG pathway enrichment analysis was performed on
200 critical genes. Following the results, critical genes were
identified to be significantly enriched in 23 pathways including
pathways in cancer, pathways associated with cell cycle and cell
apoptosis.
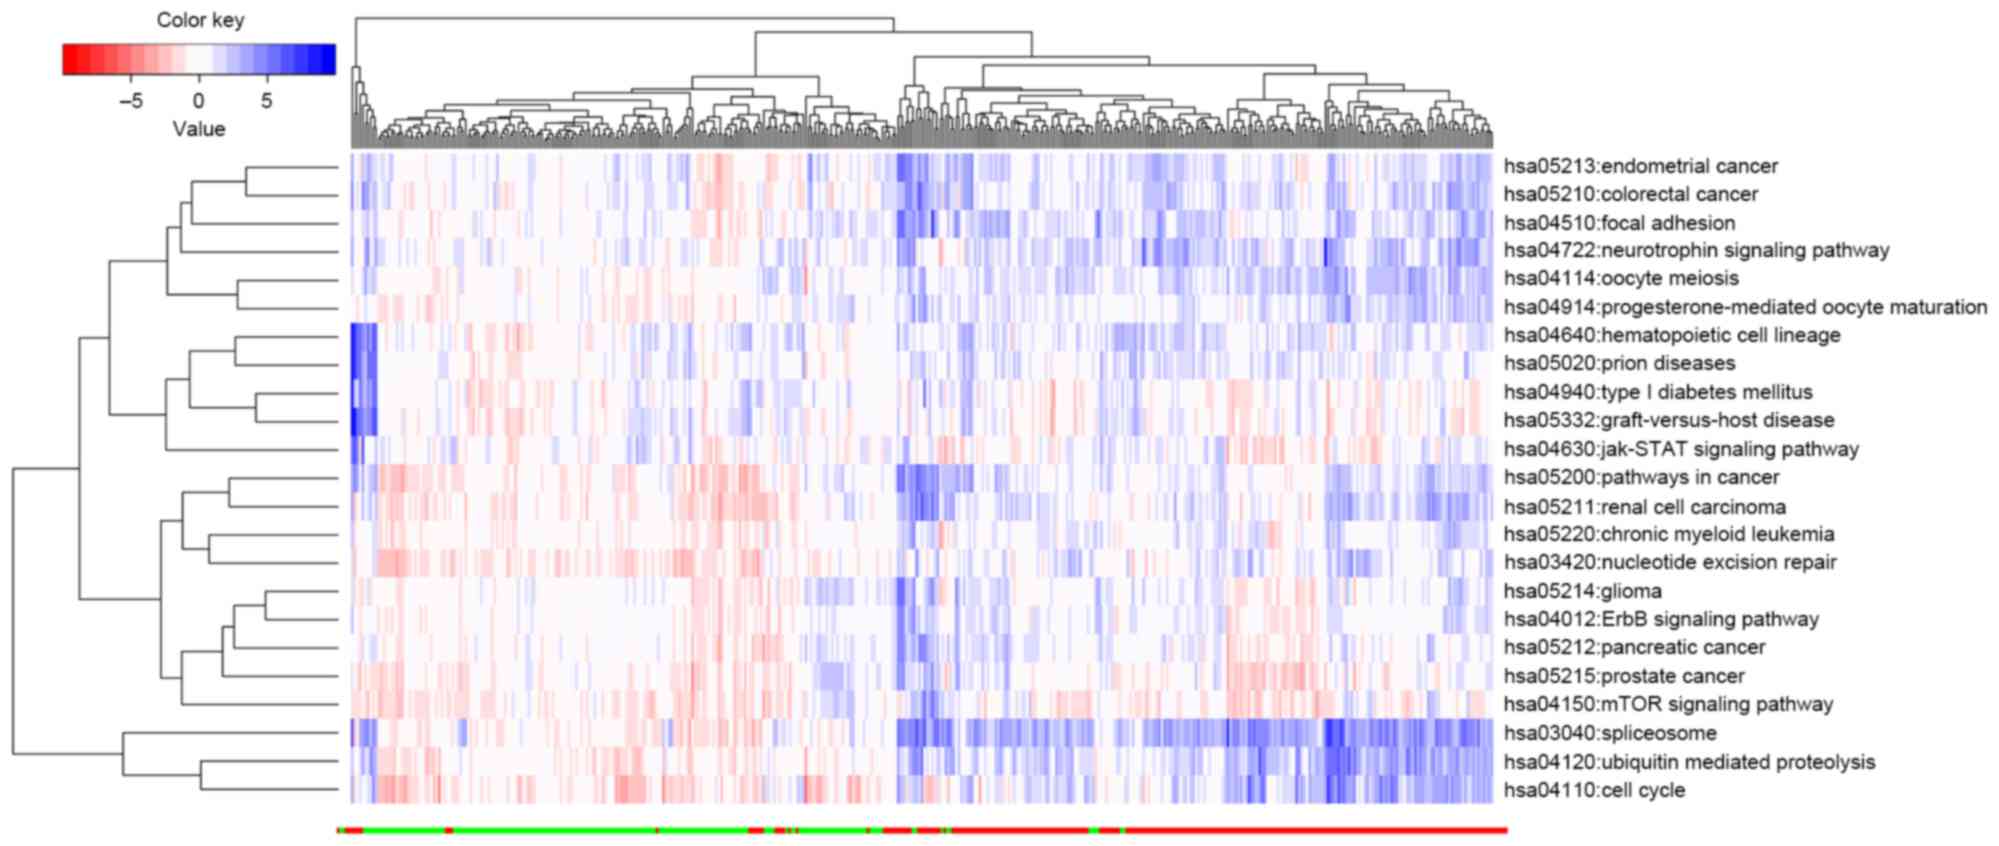
The abnormal expression of upregulated or
downregulated genes leads to an imbalance of the pathway. The
extent of this imbalance is determined by the extent of deviation
of all upregulated or downregulated genes involved in the pathway.
As presented in Fig. 2, the HCC
tissue samples could be effectively distinguished from normal liver
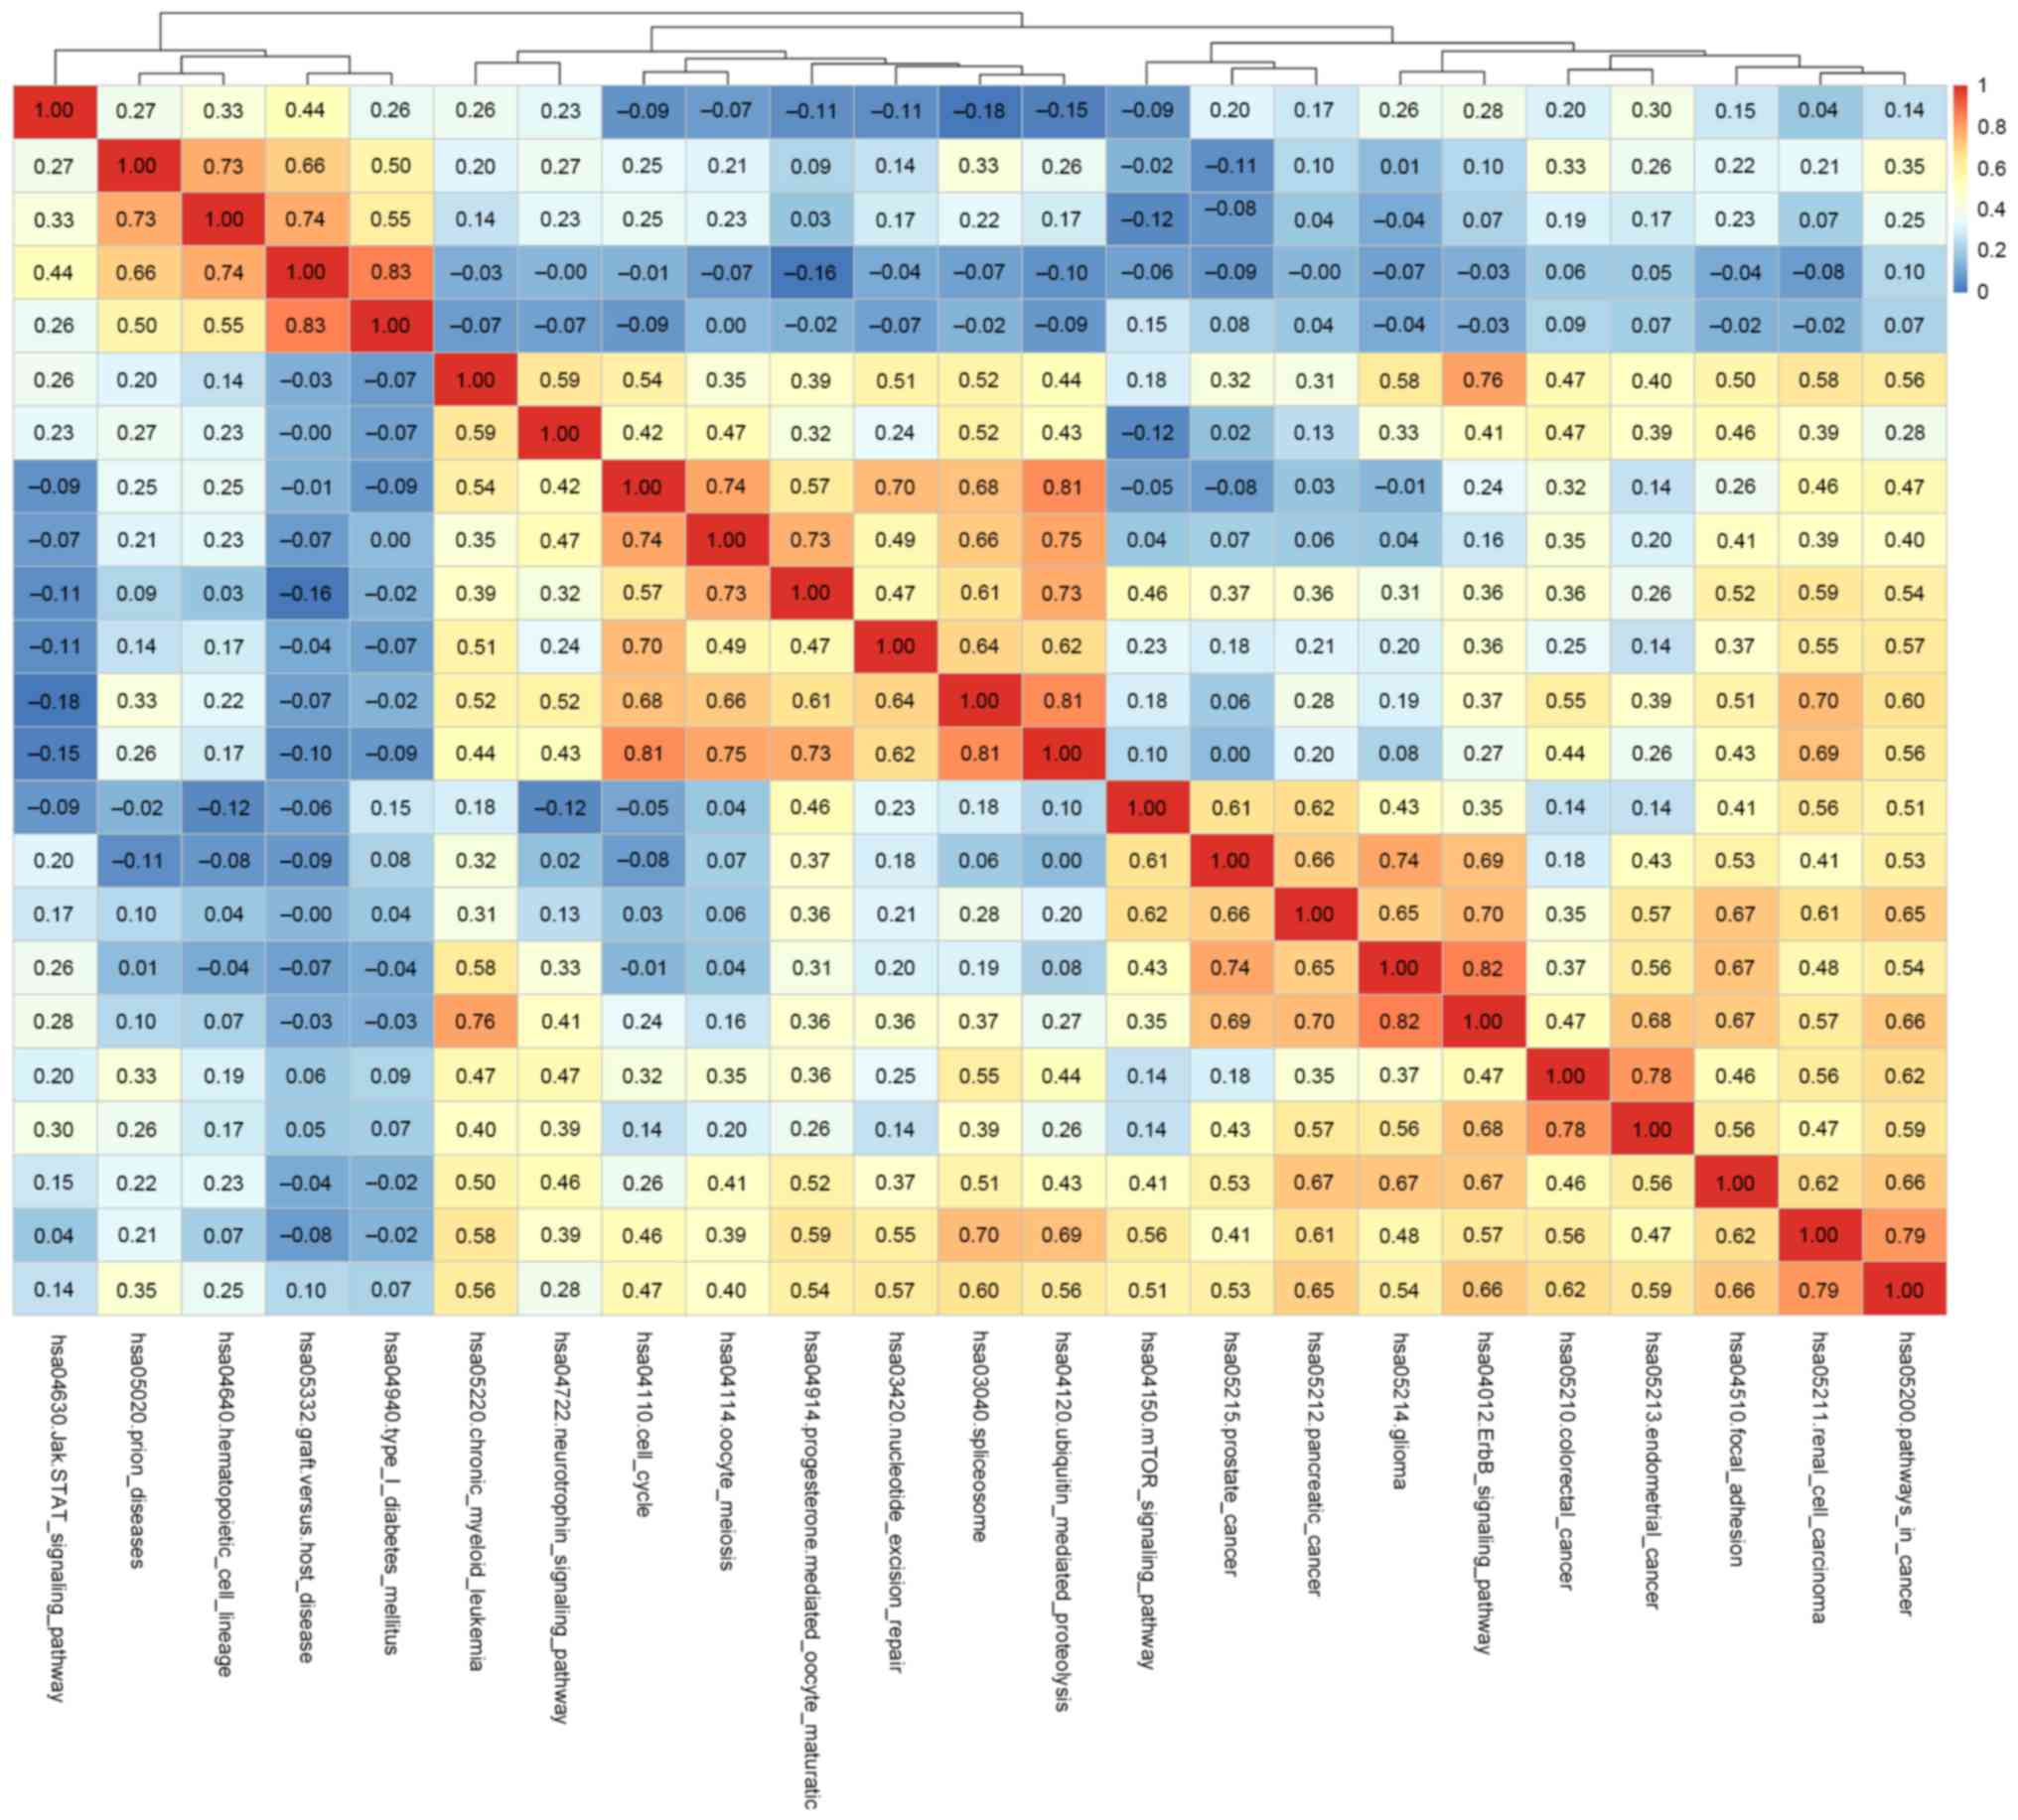
tissue based on the pathscore of the identified 23 pathways. The
correlation between the pathways was evaluated based on the
pathscore using Pearson correlation coefficient in SciPy.stats
library within Python. When the correlation coefficient
−0.5<r>0.5, two pathways were identified as significantly
correlated with each other. Based on the value of r, a heat map was
plotted indicating the correlation between pathways (Fig. 3).
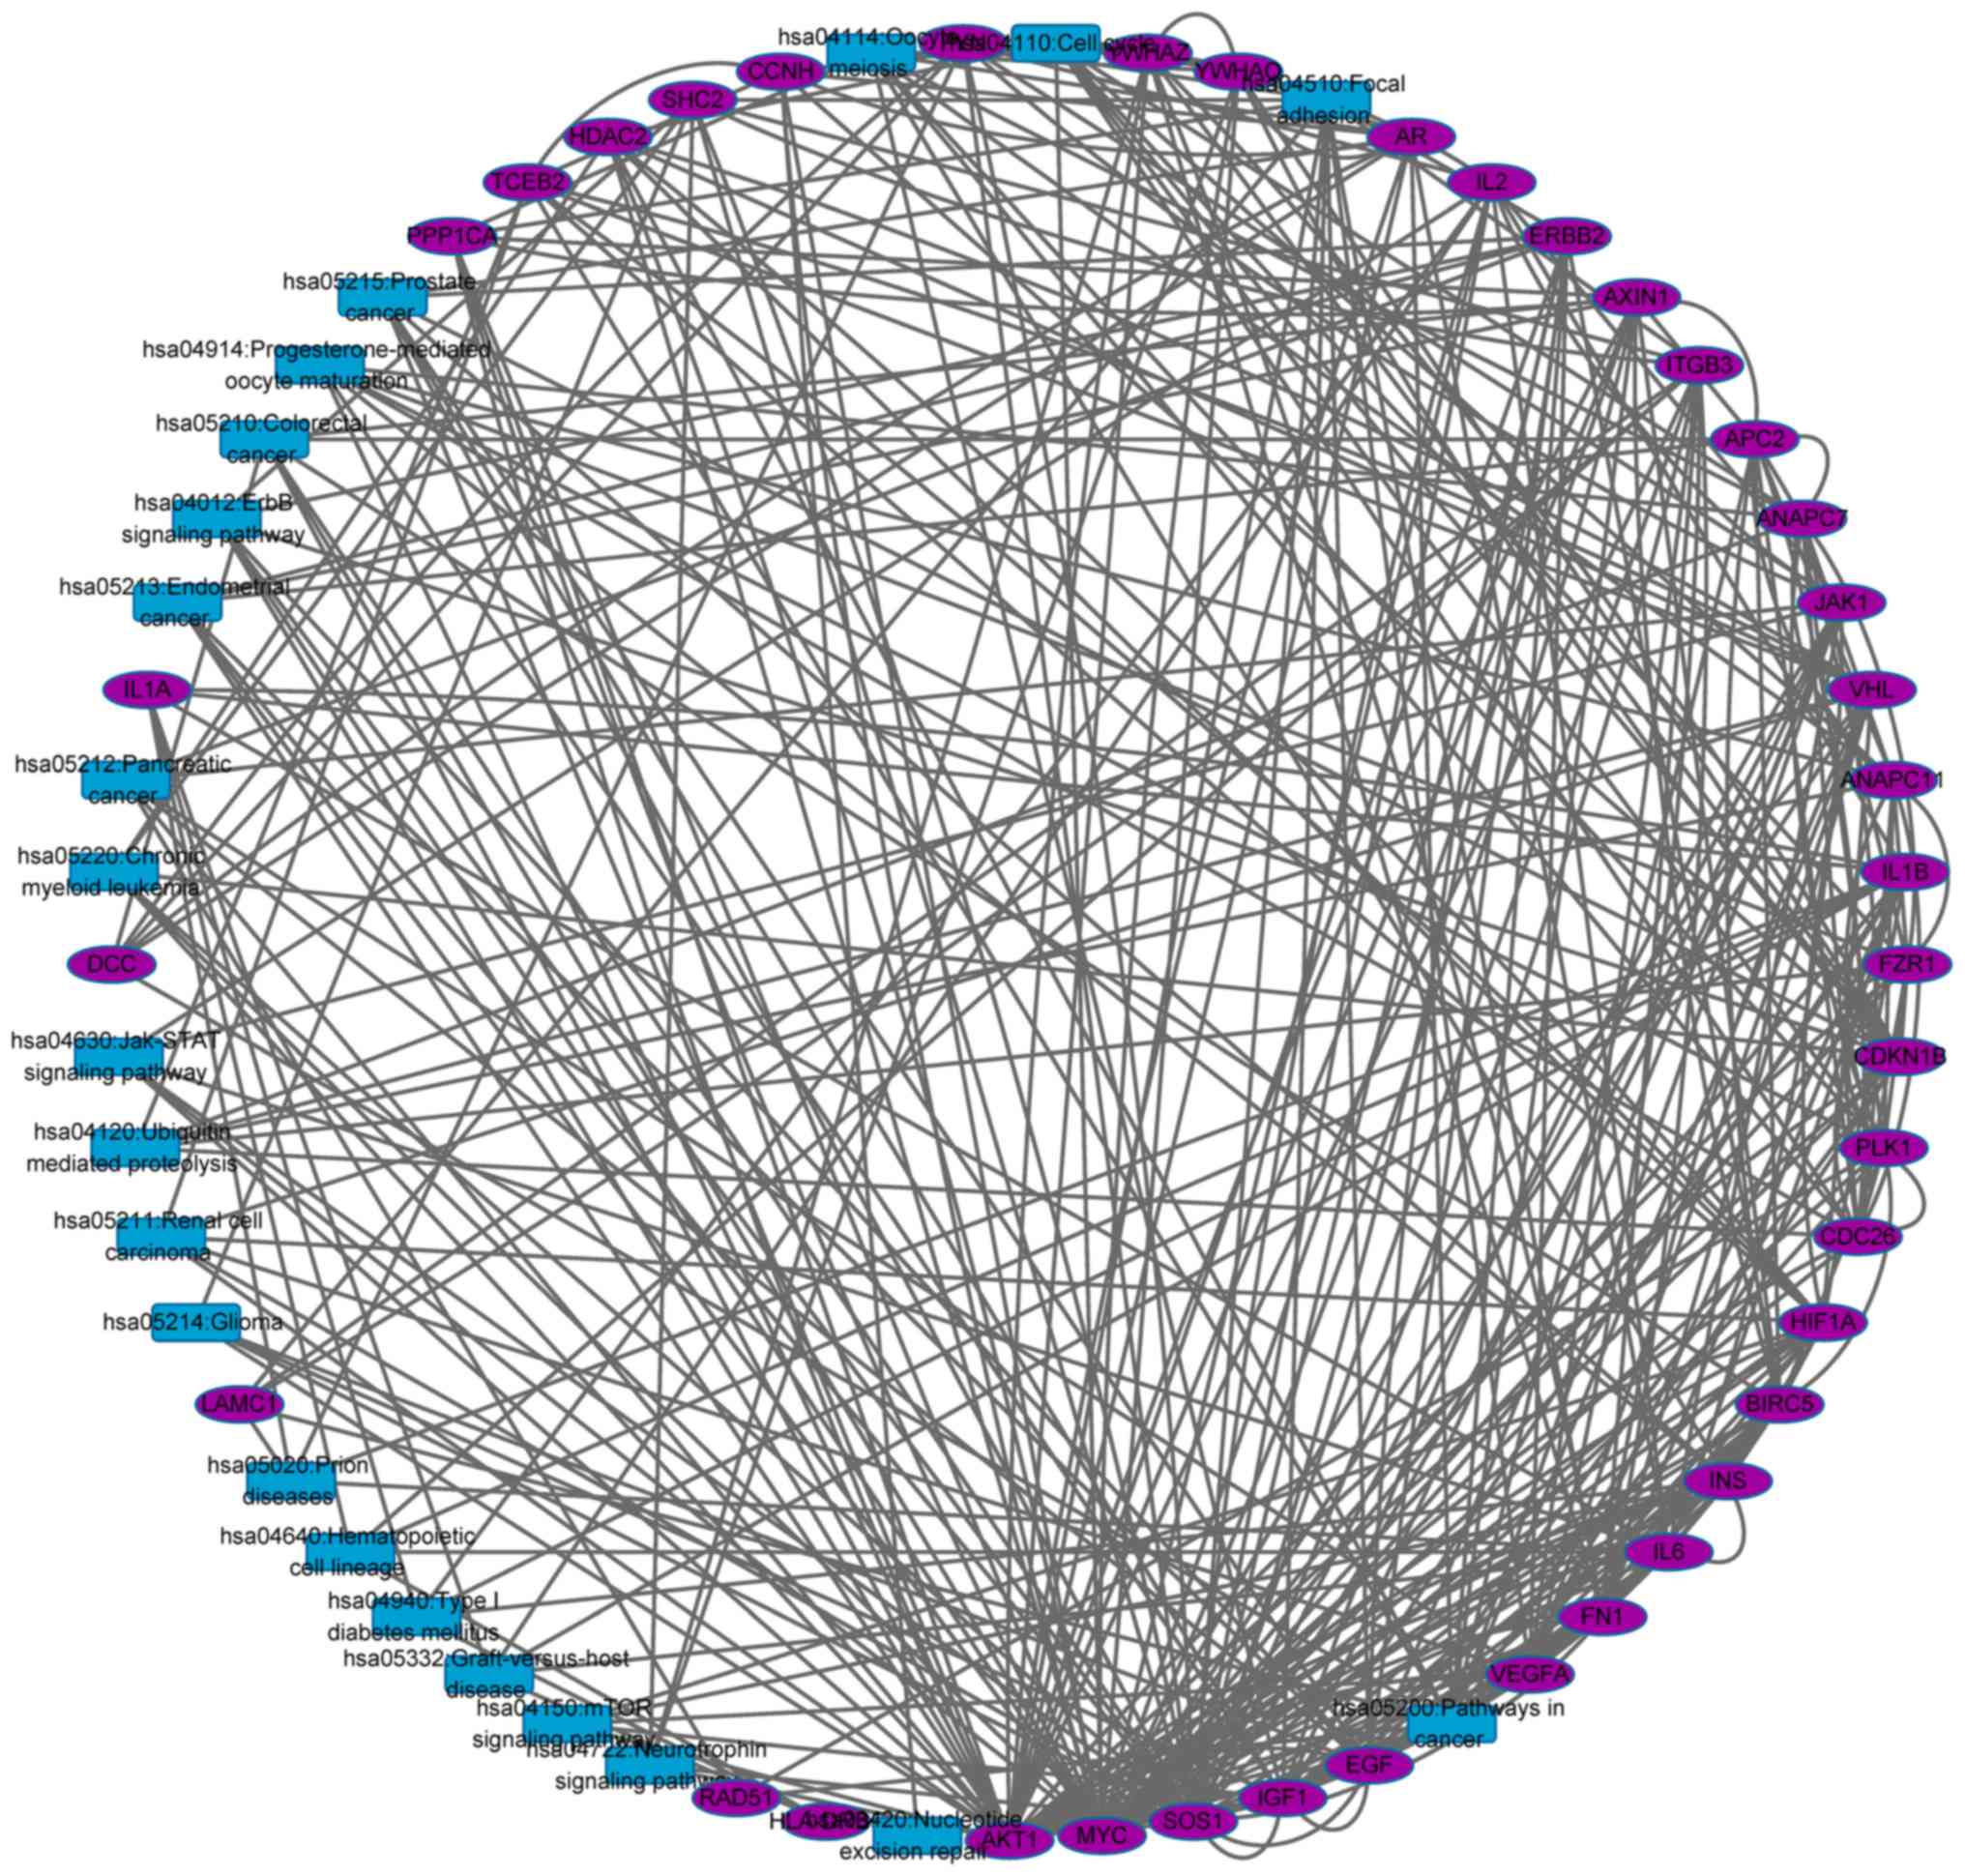
Identification of cross talk
genes
To identify cross talk genes, a network based on the
gene-gene, gene-pathway and pathway-pathway associations was
established (Fig. 4). The network
included 61 nodes and 367 edges. Total of 22 nodes were pathways
and the remaining 39 nodes were genes.
As presented in Fig.
4, there may be more than one cross talk gene between two
pathways. For example, there are seven cross talk genes between
hsa05200: Pathways in cancer and hsa05213: Endometrial cancer,
including ERBB2, AXIN1, SOS1, AKT1, APC2, MYC and EGF. A cross talk
gene could be shared with more than two pathways, which indicated
the cross talk gene participated in multiple important biological
pathways, suggesting the potential biomarker or therapeutic
targets. The top 10 cross talk genes involved in regulating the
maximum of pathways were listed in Table II.
| Table II.Top 10 cross talk genes identified
and number of involved pathways. |
Table II.
Top 10 cross talk genes identified
and number of involved pathways.
| Cross talk
gene | Pathway number |
|---|
| AKT1 | 14 |
| SOS1 | 11 |
| EGF | 7 |
| MYC | 7 |
| IGF1 | 7 |
| ERBB2 | 6 |
| CDKN1B | 5 |
| SHC2 | 5 |
| VEGFA | 5 |
| INS | 5 |
Construction of classifier
The classification performance and robustness of the
classfier were evaluated by ROC analysis. The results are presented
in Fig. 5, which showed high
classification performance with the lowest accuracy 0.91 and the
average accuracy 0.94.
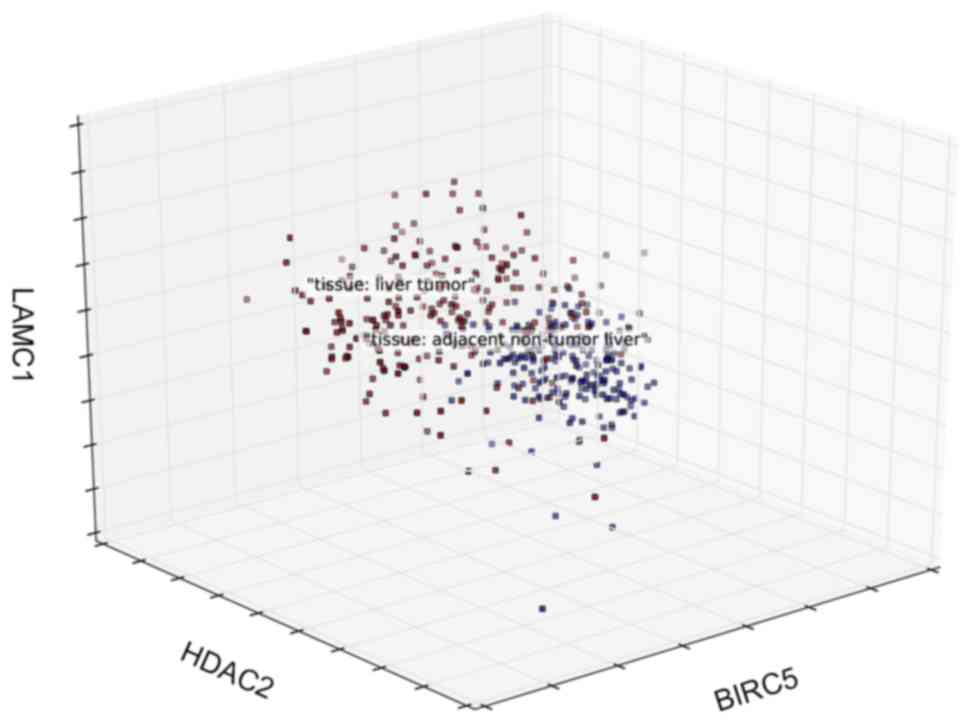
Three-dimension coordinate system was established
and three genes with top contribution were set as coordinate axis
(Fig. 6). Samples from HCC tissue
or normal liver tissue were distinguished with different
colors.
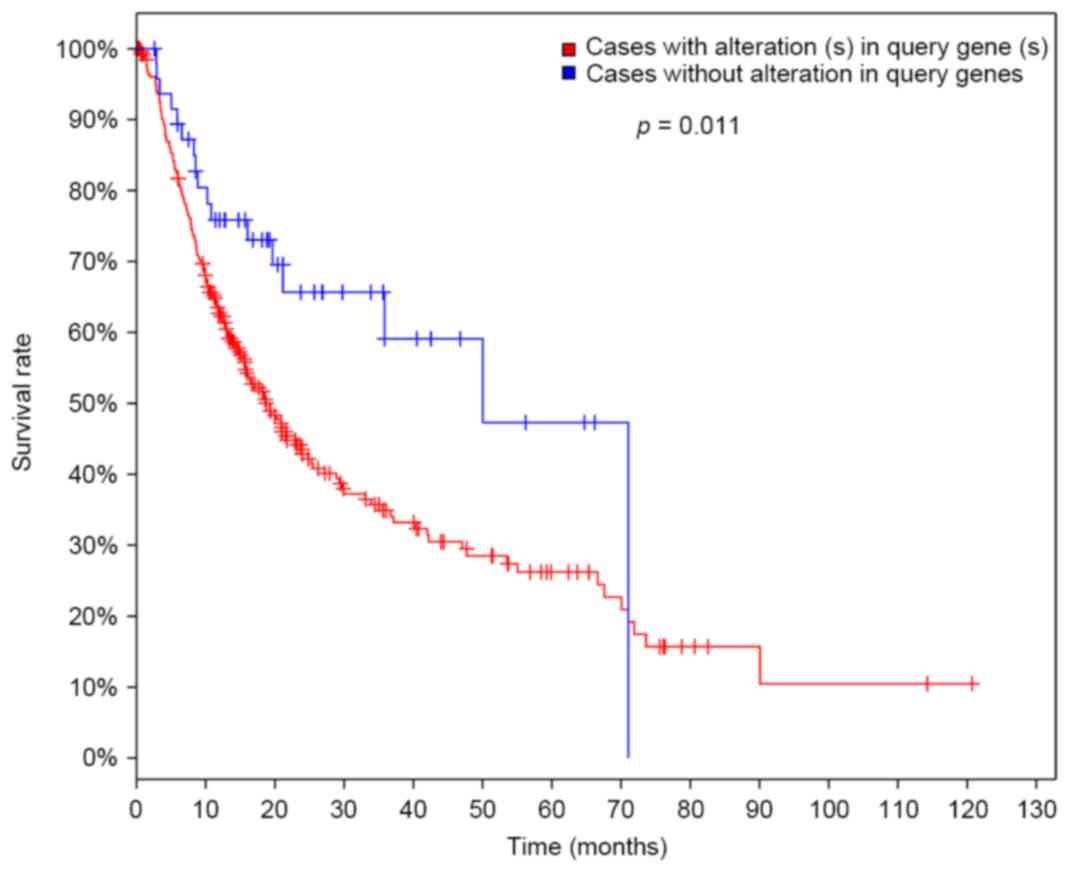
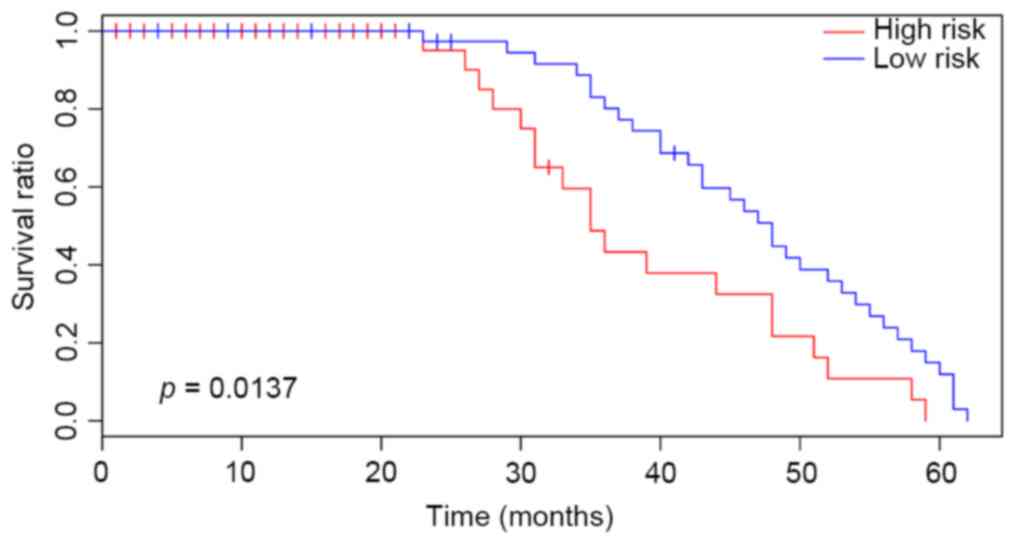
Validation of the prognosis prediction
efficacy in other independent datasets
In the present study, the survival time of patients
with HCC was verified using the TCGA dataset to evaluate the
prediction effects of the classifier. Patients with at least one
differentially expressed cross talk gene were considered high-risk
cases, while patients without differentially expressed cross talk
gene were low-risk cases. Subsequently, the survival time between
high-risk and low-risk cases was compared. The results were
presented in Fig. 7. There was a
significant difference of survival time (P=0.011), indicating the
high sensitivity and stability of the prediction model established
in the present study.
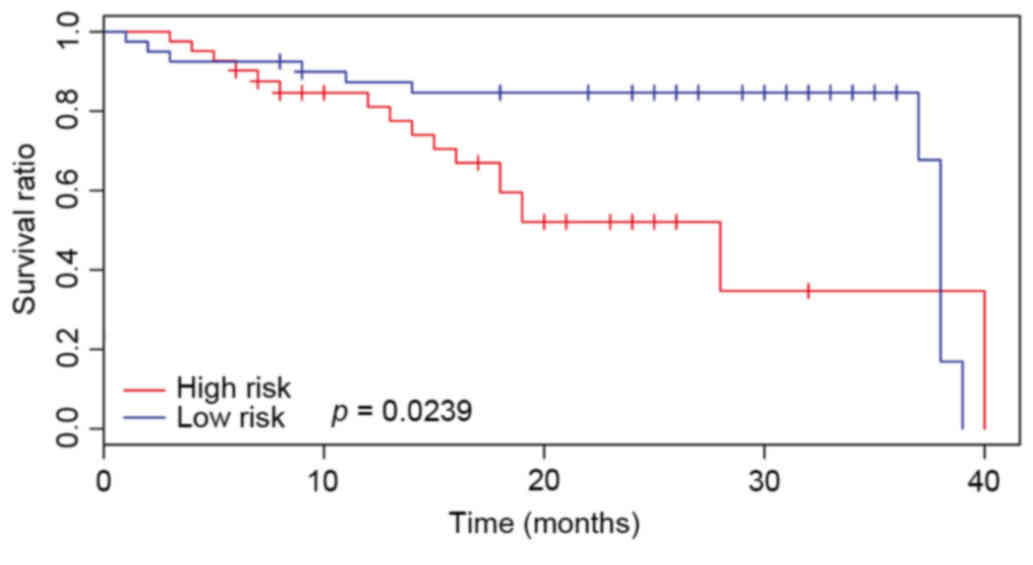
Another two datasets; E-GEOD-54236 and E-GEOD-27150;
were also downloaded and used to compare the survival time of
patients with HCC. The results were displayed in Figs. 8 and 9. There an additional significant
difference in the total survival time (P<0.05) between high- and
low-risk cases. These results indicated that the identified cross
talk genes indicated a relatively poor prognosis in HCC.
Discussion
Discovery of biomarkers associated with HCC
contributes to diagnosis and treatment of HCC, which is beneficial
for the improvement of prognosis in patients with HCC (21). Multiple genetic alternations have
been identified in HCC. These changes may be regulated by global
regulatory mechanisms that control co-operation among various
metabolic and signaling pathways (22). Thus the cross talk genes screened
from these correlated pathways are important biomarkers for
HCC.
In the present study, the mRNA expression profile of
GSE36376 was downloaded and DEGs were screened. A total of 219
upregulated genes and 30 downregulated genes were obtained between
tumor samples and para-cancerous normal liver tissue, which were
mapped to the merged PPI network. Subsequently, the critical genes
were selected based on the deviation score of DEGs and the degree
of node in the PPI network (23).
A total of 200 critical genes were screened out. KEGG pathway
enrichment analysis indicated that these critical genes were
significantly enriched in 23 pathways including pathways in cancer,
pathways associated with cell cycle and cell apoptosis, which have
been reported to be significantly associated with the development
of HCC (10,24). Next, the interactions between
pathways were identified by hierarchical cluster analysis based on
the deviation score. The results indicated that the deviation score
of 23 identified pathways distinguished the HCC tissue samples from
normal liver tissue effectively.
The cross talk genes are interpreted as genes
co-existing in two or more pathways and connecting several
biological pathways. The abnormal expression of cross talk genes
lead to a similar trend of changes between pathways that are
regulated by them. To identify these cross talk genes, a network
based on the gene-gene, gene-pathway and pathway-pathway
associations was constructed. A total of 39 genes were identified
as cross talk genes, in which the top 10 cross talk genes were
protein kinase Bα (AKT1), son of sevenless homolog 1 (SOS1),
epidermal growth factor (EGF), MYC, insulin like growth factor 1
(IGF1), Erb-B2 receptor tyrosine kinase 2 (ERBB2), cyclin dependent
kinase inhibitor 1B (CDKN1B), SHC adaptor protein 2 (SHC2),
vascular endothelial growth factor A (VEGFA) and insulin (INS). All
these identified genes were significantly correlated with the
occurrence and development of HCC.
AKT1 is one of the most important members of the AKT
family, in which phosphorylation has been indicated as a risk
factor for early disease recurrence and poor prognosis in HCC
(25). EGF is an important mitogen
for hepatocytes and its overexpression has been demonstrated to
promote HCC (26). In addition,
targeting the EGF receptor has been observed to be an effective
therapy for treating HCC (27). A
previous study indicated that inactivation of the MYC oncogene is
sufficient to induce sustained regression of invasive liver cancer
including uncovering the pluripotent capacity of tumors to
differentiate into normal cellular lineages and inducing tumors to
a state of tumor dormancy (28).
Previous studies have indicated IGF1 is a promising biomarker for
detection of early HCC (29) and
blockage of IGF signaling has been used in HCC treatment in
clinical trials (30). ERBB2, a
member of the epidermal growth factor receptor family, has been
indicated to be expressed in a significant number of hepatoma
cancer types including HCC, acting as an independent prognostic
factor and a major contributor to carcinogenesis (31). CDKN1B has been reported to a direct
target of miR-22, and downregulation of CDKN1B by miR-22 can
promote growth of HCC cells and affect HCC prognosis (32). SHC2 has been reported to be an
important molecule in cellular signaling pathways in the
pathogenesis of HCC (33). VEGFA,
a member of the VEGF family, is one of the most potent angiogenic
factors expressed in various types of human cancer including HCC
(34). The vascular invasion and
metastasis of HCC is always associated with the expression of VEGFA
(35). Additionally, INS
polymorphisms have been observed to be associated with cancer risk
including that of HCC (36). No
direct evidence has indicated association of SOS1 with HCC, while
enhanced expression of SOS1 has been observed in several other
types of cancer (37,38).
The identified cross talk genes were used as a
classifier to classify the HCC samples from normal tissue, which
was observed to exhibit high accuracy with the lowest accuracy as
0.91, and an average accuracy of 0.94. Finally, the prognosis
prediction effects of the classifier were validated in TCGA and two
other independent GEO datasets. The results indicate a high
sensitivity and stability of the prognosis prediction efficacy for
patients with HCC.
In conclusion, the current study identified 39 cross
talk genes of HCC and a classifier based on the cross talk genes
was constructed, which exhibited high prognosis prediction efficacy
in several independent datasets. The results provide a novel
perspective to develop a multiple gene diagnostic tool for HCC
prognosis, which also provide potential biomarkers or therapeutic
targets for HCC.
Acknowledgements
The present study was supported by Shanghai
Municipal Commission of Health and Family Planning (grant no.
ZYSNXD-CC-ZDYJ032).
References
|
1
|
Torre LA, Bray F, Siegel RL, Ferlay J,
Lortet-Tieulent J and Jemal A: Global cancer statistics, 2012. CA
Cancer J Clin. 65:87–108. 2015. View Article : Google Scholar : PubMed/NCBI
|
|
2
|
Perz JF, Armstrong GL, Farrington LA,
Hutin YJ and Bell BP: The contributions of hepatitis B virus and
hepatitis C virus infections to cirrhosis and primary liver cancer
worldwide. J Hepatol. 45:529–538. 2006. View Article : Google Scholar : PubMed/NCBI
|
|
3
|
Marrero JA, Kudo M and Bronowicki JP: The
challenge of prognosis and staging for hepatocellular carcinoma.
Oncologist. 15:(Suppl 4). S23–S33. 2010. View Article : Google Scholar
|
|
4
|
Farazi PA and DePinho RA: Hepatocellular
carcinoma pathogenesis: From genes to environment. Nat Rev Cancer.
6:674–687. 2006. View
Article : Google Scholar : PubMed/NCBI
|
|
5
|
Li D and Satomura S: Biomarkers for
hepatocellular carcinoma (HCC): An update. Adv Exp Med Biol.
867:179–193. 2015. View Article : Google Scholar : PubMed/NCBI
|
|
6
|
Reuter JA, Spacek DV and Snyder MP:
High-throughput sequencing technologies. Mol Cell. 58:586–597.
2015. View Article : Google Scholar : PubMed/NCBI
|
|
7
|
Schmidt D, Wilson MD, Spyrou C, Brown GD,
Hadfield J and Odom DT: ChIP-seq: Using high-throughput sequencing
to discover protein-DNA interactions. Methods. 48:240–248. 2009.
View Article : Google Scholar : PubMed/NCBI
|
|
8
|
Mathew R, Karantza-Wadsworth V and White
E: Role of autophagy in cancer. Nat Rev Cancer. 7:961–967. 2007.
View Article : Google Scholar : PubMed/NCBI
|
|
9
|
Astolfi A, Landuzzi L, Nicoletti G, De
Giovanni C, Croci S, Palladini A, Ferrini S, Iezzi M, Musiani P,
Cavallo F, et al: Gene expression analysis of immune-mediated
arrest of tumorigenesis in a transgenic mouse model of
HER-2/neu-positive basal-like mammary carcinoma. Am J Pathol.
166:1205–1216. 2005. View Article : Google Scholar : PubMed/NCBI
|
|
10
|
Kamb A, Gruis NA, Weaver-Feldhaus J, Liu
Q, Harshman K, Tavtigian SV, Stockert E, Day RS III, Johnson BE and
Skolnick MH: A cell cycle regulator potentially involved in genesis
of many tumor types. Science. 264:436–440. 1994. View Article : Google Scholar : PubMed/NCBI
|
|
11
|
Bergers G and Benjamin LE: Tumorigenesis
and the angiogenic switch. Nat Rev Cancer. 3:401–410. 2003.
View Article : Google Scholar : PubMed/NCBI
|
|
12
|
Arwert EN, Hoste E and Watt FM: Epithelial
stem cells, wound healing and cancer. Nat Rev Cancer. 12:170–180.
2012. View
Article : Google Scholar : PubMed/NCBI
|
|
13
|
Berkeley C: Linear models and empirical
Bayes methods for assessing differential expression in microarray
experiments. Stat Appl Genet Mol Biol. 3:Article32004.PubMed/NCBI
|
|
14
|
Aoki-Kinoshita K, Kanehisa M and Bergman
N: Comparative genomics. Journal. 2007.
|
|
15
|
Huang DW, Sherman BT, Tan Q, Collins JR,
Alvord WG, Roayaei J, Stephens R, Baseler MW, Lane HC and Lempicki
RA: The DAVID gene functional classification tool: A novel
biological module-centric algorithm to functionally analyze large
gene lists. Genome Biol. 8:R1832007. View Article : Google Scholar : PubMed/NCBI
|
|
16
|
Köhn HF and Hubert LJ: Hierarchical
cluster analysis. Wiley StatsRef: Statistics Reference Online.
2006.
|
|
17
|
Liaw A and Wiener M: Classification and
regression by randomForest. R News. 2:18–22. 2002.
|
|
18
|
Vazquez A, Flammini A, Maritan A and
Vespignani A: Global protein function prediction from
protein-protein interaction networks. Nat Biotechnol. 21:697–700.
2003. View
Article : Google Scholar : PubMed/NCBI
|
|
19
|
Colcombet J and Hirt H: Arabidopsis MAPKs:
A complex signalling network involved in multiple biological
processes. Biochem J. 413:217–226. 2008. View Article : Google Scholar : PubMed/NCBI
|
|
20
|
Stuart JM, Segal E, Koller D and Kim SK: A
gene-coexpression network for global discovery of conserved genetic
modules. Science. 302:249–255. 2003. View Article : Google Scholar : PubMed/NCBI
|
|
21
|
Zinkin NT, Grall F, Bhaskar K, Otu HH,
Spentzos D, Kalmowitz B, Wells M, Guerrero M, Asara JM, Libermann
TA and Afdhal NH: Serum proteomics and biomarkers in hepatocellular
carcinoma and chronic liver disease. Clin Cancer Res. 14:470–477.
2008. View Article : Google Scholar : PubMed/NCBI
|
|
22
|
Lodish H, Berk A, Kaiser CA, Krieger M,
Bretscher A, Ploegh H and Amon A: Molecular Cell Biology. 7th. W H
Freeman and Company; New York: 2012
|
|
23
|
Przulj N, Wigle DA and Jurisica I:
Functional topology in a network of protein interactions.
Bioinformatics. 20:340–348. 2004. View Article : Google Scholar : PubMed/NCBI
|
|
24
|
Fabregat I: Dysregulation of apoptosis in
hepatocellular carcinoma cells. World J Gastroenterol. 15:513–520.
2009. View Article : Google Scholar : PubMed/NCBI
|
|
25
|
Nakanishi K, Sakamoto M, Yamasaki S, Todo
S and Hirohashi S: Akt phosphorylation is a risk factor for early
disease recurrence and poor prognosis in hepatocellular carcinoma.
Cancer. 103:307–312. 2005. View Article : Google Scholar : PubMed/NCBI
|
|
26
|
Borlak J, Meier T, Halter R, Spanel R and
Spanel-Borowski K: Epidermal growth factor-induced hepatocellular
carcinoma: Gene expression profiles in precursor lesions, early
stage and solitary tumours. Oncogene. 24:1809–1819. 2005.
View Article : Google Scholar : PubMed/NCBI
|
|
27
|
Höpfner M, Sutter AP, Huether A, Schuppan
D, Zeitz M and Scherübl H: Targeting the epidermal growth factor
receptor by gefitinib for treatment of hepatocellular carcinoma. J
Hepatol. 41:1008–1016. 2004. View Article : Google Scholar : PubMed/NCBI
|
|
28
|
Shachaf CM, Kopelman AM, Arvanitis C,
Karlsson A, Beer S, Mandl S, Bachmann MH, Borowsky AD, Ruebner B,
Cardiff RD, et al: MYC inactivation uncovers pluripotent
differentiation and tumour dormancy in hepatocellular cancer.
Nature. 431:1112–1117. 2004. View Article : Google Scholar : PubMed/NCBI
|
|
29
|
Marrero JA and Lok AS: Newer markers for
hepatocellular carcinoma. Gastroenterology. 127:(5 Suppl 1).
S113–S119. 2004. View Article : Google Scholar : PubMed/NCBI
|
|
30
|
Tovar V, Alsinet C, Villanueva A, Hoshida
Y, Chiang DY, Solé M, Thung S, Moyano S, Toffanin S, Mínguez B, et
al: IGF activation in a molecular subclass of hepatocellular
carcinoma and pre-clinical efficacy of IGF-1R blockage. J Hepatol.
52:550–559. 2010. View Article : Google Scholar : PubMed/NCBI
|
|
31
|
Bekaii-Saab T, Williams N, Plass C, Calero
MV and Eng C: A novel mutation in the tyrosine kinase domain of
ERBB2 in hepatocellular carcinoma. BMC Cancer. 6:2782006.
View Article : Google Scholar : PubMed/NCBI
|
|
32
|
Fornari F, Gramantieri L, Ferracin M,
Veronese A, Sabbioni S, Calin GA, Grazi GL, Giovannini C, Croce CM,
Bolondi L and Negrini M: MiR-221 controls CDKN1C/p57 and CDKN1B/p27
expression in human hepatocellular carcinoma. Oncogene.
27:5651–5661. 2008. View Article : Google Scholar : PubMed/NCBI
|
|
33
|
Whittaker S, Marais R and Zhu AX: The role
of signaling pathways in the development and treatment of
hepatocellular carcinoma. Oncogene. 29:4989–5005. 2010. View Article : Google Scholar : PubMed/NCBI
|
|
34
|
Kerbel RS: Tumor angiogenesis. N Engl J
Med. 358:2039–2049. 2008. View Article : Google Scholar : PubMed/NCBI
|
|
35
|
Kaseb AO, Hanbali A, Cotant M, Hassan MM,
Wollner I and Philip PA: Vascular endothelial growth factor in the
management of hepatocellular carcinoma: A review of literature.
Cancer. 115:4895–4906. 2009. View Article : Google Scholar : PubMed/NCBI
|
|
36
|
Nischalke HD, Coenen M, Berger C,
Aldenhoff K, Müller T, Berg T, Krämer B, Körner C, Odenthal M,
Schulze F, et al: The toll-like receptor 2 (TLR2)-196 to −174
del/ins polymorphism affects viral loads and susceptibility to
hepatocellular carcinoma in chronic hepatitis C. Int J Cancer.
130:1470–1475. 2012. View Article : Google Scholar : PubMed/NCBI
|
|
37
|
Timofeeva OA, Zhang X, Ressom HW, Varghese
RS, Kallakury BV, Wang K, Ji Y, Cheema A, Jung M, Brown ML, et al:
Enhanced expression of SOS1 is detected in prostate cancer
epithelial cells from African-American men. Int J Oncol.
35:751–760. 2009.PubMed/NCBI
|
|
38
|
De S, Dermawan JK and Stark GR: EGF
receptor uses SOS1 to drive constitutive activation of NFκB in
cancer cells. Proc Natl Acad Sci USA. 111:11721–11726. 2014.
View Article : Google Scholar : PubMed/NCBI
|