Introduction
Colorectal cancer (CRC) is one of the most common
malignant digestive tumors in China. In recent years, the global
incidence of CRC has increased by 2% every year, while the
incidence rate in China has increased by 4.2% each year (1,2). As
patients are more likely to be asymptomatic during the early stages
of the disease, the majority of patients are already at advanced
stages at the time of diagnosis. Therefore, their prognosis is poor
and risk of mortality is higher (3). The comprehensive treatment for CRC
primarily involves surgical resection combined with a variety of
therapeutic measures, such as chemotherapy and radiotherapy.
Chemotherapy remains one of the most essential approaches to CRC
treatment. However, although chemotherapeutic drugs, including
irinotecan, oxaliplatin and fluoropyrimidines, increase the
efficacy of advanced CRC treatment, the median survival time of
patients remains <2 years (4).
Therefore, investigating novel and effective strategies to treat
CRC is particularly important.
During the 1960s, Elwood V. Jensen and colleagues
were the first to experimentally confirm the existence of the
estrogen receptor (ER) (5). In the
early 1970s, physicians began to use the ER as an indicator for the
use of endocrine therapy in patients with breast cancer (6). The efficacy of endocrine therapy for
ER-positive cancers was greater than that for ER-negative cancers.
Starting in the mid-1970s, the ER was used as a prognostic
indicator for patients with breast cancer, and gradually became the
most effective therapeutic target (7). In 1997, investigators discovered a
novel ER, known as ERβ (8,9). The distribution of this receptor is
different to that of the classic ERα. In addition, this receptor
demonstrates different specificities and affinities for ligands.
ERβ is highly expressed in the gonads, uterus, colon and brain
(10–12); however, its function in cancer has
not yet been fully elucidated (13,14).
Similar to breast cancer, previous studies have demonstrated that
CRC is a hormone-dependent cancer. The majority of CRC tissues and
cell lines do not express ERα, whereas they do express ERβ to a
high level (15,16). Using the semi-quantitative
polymerase chain reaction (sqPCR) method, Arai et al
(16) demonstrated that five human
CRC cell lines expressed ERβ and not ERα. As an anticancer hormonal
therapy, tamoxifen (TAM) has been applied in hormone therapies
targeting breast cancer. TAM is a chemically synthesized,
nonsteroidal, anti-estrogen, antitumor drug. The precise mechanisms
underlying the anticancer effects of TAM are currently unclear. TAM
may compete with the intracellular ER to inhibit estradiol
absorption in the body, thus inhibiting estrogen-dependent cancer
growth (17). The main member of
the estrogen family, 17β-estradiol (E2), is a corticosteroid
hormone that is primarily synthesized by ovarian follicles, the
corpus luteum and the placenta during pregnancy (18). Epidemiological studies have
demonstrated that the incidence of CRC in females is lower than
that in males (19,20), and additional studies have
indicated that patients undergoing hormone replacement therapy,
usually in the form of estrogen supplements, were less prone to
suffer from CRC (21,22). Therefore, the aim of the present
study was to investigate the anticancer effects of combined TAM and
E2 treatment on human DLD-1 CRC cells, in order to provide a
theoretical and experimental basis for the clinical treatment of
CRC using these agents.
Materials and methods
Cell culture
DLD-1 cells (Sun Yat-sen University Cancer Centre,
Guangdong, China) were cultured in RPMI-1640 medium (Gibco; Thermo
Fisher Scientific, Inc., Waltham, MA, USA) containing 10% fetal
bovine serum (FBS; Hyclone; GE Healthcare Life Sciences, Logan, UT,
USA), 100 units/ml penicillin and 100 mg/ml streptomycin (both
Gibco; Thermo Fisher Scientific, Inc.). Cells were maintained at
37°C in a humidified atmosphere containing 5% CO2.
Effects of TAM and/or E2 on cell
growth
DLD-1 cells were dissociated with trypsin and were
re-suspended in culture medium containing 10% FBS to produce a
single-cell suspension. The cells were seeded onto 96-well plates
at 5×10³ cells/well with 100 µl in each well. Following
incubation at 37°C in 5% CO2 for 24 h, the cells were
treated with varying concentrations of the drugs. The
concentrations applied in the group treated with E2 (Sigma-Aldrich;
Merck KGaA, Darmstadt, Germany) only were 0.015625×10⁻³,
0.03125×10⁻³, 0.0625×10⁻³,
0.125×10⁻³, 0.25×10⁻³, 0.5×10⁻³
and 1×10⁻³ M. The concentrations applied in the group
treated with TAM (Yangtze River Pharmaceutical Group Co., Ltd.,
Taizhou, Jiangsu, China) only were 0.015625×10⁻⁴,
0.03125×10⁻⁴, 0.0625×10⁻⁴,
0.125×10⁻⁴, 0.25×10⁻⁴, 0.5×10⁻⁴
and 1×10⁻⁴ M. The concentrations in the
combined-treatment group were those of the lowest to highest
corresponding concentrations in the TAM and E2 groups combined.
Each well was treated with 100 µl of drug. The blank control group
was treated with dimethyl sulfoxide (DMSO). A total of three
replicates for each treatment were included. Following incubation
for 24, 48 and 72 h, 0.05% MTT (Guangzhou Whiga Technology Co.,
Ltd., Guangzhou, Guangdong, China; 20 µl/well) was added, and the
cells were incubated for a further 4 h at 37°C. The supernatant was
then discarded and 150 µl of DMSO was added to each well. Following
vigorous mixing for 10 min, the absorbance of each well was
measured at wavelengths of 490 and 655 nm using a microplate
reader. The rate of cell viability inhibition was then calculated
using the following equation based on optical density (OD):
1-[ODtreatment group/ODcontrol group].
Detection of cell apoptosis by flow
cytometry analysis
DLD-1 cells (~5×10⁵) were seeded onto
60-mm tissue culture plates and cultured for 24 h. The culture
medium was then discarded and fresh culture medium containing TAM
or E2 was added. DMSO was used as a control. The experimental
design was based on the MTT assay results. The concentration of
drug that exhibited a 30% reduction in cell viability
(IC30), which demonstrated a relatively low inhibitory
effect, and the IC70, which demonstrated a greater
inhibitory effect, were used as a basis for grouping. Cells were
treated with the following: DMSO (control); 0.0625×10⁻³
M E2; 0.5×10⁻³ M E2; 0.0625×10⁻⁴ M TAM;
0.25×10⁻⁴ M TAM; 0.0625×10⁻³ M E2 +
0.0625×10⁻⁴ M TAM; 0.5×10⁻³ M E2 +
0.25×10⁻⁴ M TAM. The cells were cultured for 24, 48 or
72 h, then the supernatant was collected and adherent cells were
dissociated with trypsin by centrifuging at 500 × g for 5 min and
4°C for downstream analysis. The cells were then washed with
phosphate-buffered saline (PBS), centrifuged again at 500 × g for 5
min and 4°C and double-stained using the Annexin-V-FLUOS Staining
kit (Roche Diagnostics GmbH, Mannheim, Germany) according to the
manufacturer's instructions in the dark for 5 min. Apoptosis of the
cells was measured using a flow cytometry instrument (Beckman
Coulter, Inc., Brea, CA, US).
sqPCR analysis
DLD-1 cells (~2.5×10⁻⁵) were seeded onto
6-well plates and incubated for 24 h for complete attachment. Cells
were then treated with E2 and TAM, and total cellular RNA was
extracted using TRIzol® reagent (cat. no. 15596;
Invitrogen; Thermo Fisher Scientific, Inc.) according to the
manufacturer's instructions. Total RNA was reverse transcribed
using the RevertAid First Strand cDNA Synthesis kit and DreamTaq
DNA Polymerase (both Fermentas; Thermo Fisher Scientific, Inc.,
Pittsburgh, PA, USA) according to the manufacturer's instructions.
Reverse transcription of RNA was first performed using 1 µg total
RNA, 1 µl random primers and diethyl pyrocarbonate (DEPC)-treated
water to a final volume of 12 µl. Following incubation at 65°C for
5 min, 4 µl Reaction Buffer (5X), 200 units Ribolock RNase
inhibitor, 2 mM dNTP Mix and 200 units Revert Aid Moloney murine
leukemia virus reverse transcriptase were added. Samples (20 µl)
was mixed gently and centrifuged at 500 × g for 5 min and 4°C. The
RT reaction conditions were as follows: 25°C for 5 min, 42°C for 60
min, and reaction termination at 70°C for 5 min. For amplification
of cyclin D1, survivin and β-actin (the internal control) cDNA
sequences, a PCR reaction mixture containing 2 µl DreamTaq Buffer
(10X), 0.2 mM dNTP Mix, 0.05 µM primers, 1 µl cDNA, 0.2 µl DreamTaq
DNA Polymerase and 13.8 µl DEPC-treated water to a final volume of
20 µl was used. PCR was performed in a S1000 Thermal Cycler
(Bio-Rad Laboratories, Inc., Hercules, CA, USA). The reaction
mixture was first heated to 95°C for 5 min, then amplification was
performed for 25 cycles of denaturation at 94°C for 30 sec,
annealing at 60°C for 30 sec and extension at 72°C for 30 sec,
which was followed by a final extension step at 72°C for 7 min. The
primer sequences were as follows: Cyclin D1, forward,
5′-GTCACCTAGCAAGCTGCCGAACC-3′, and reverse,
5′-ACGACAGACAAAGCGTCCCTCAA-3′; survivin, forward,
5′-TCTGGCGTAAGATGATGG-3′, and reverse, 5′-GAAATAAGTGGGTCTGAAGTG-3′;
β-actin, forward, 5′-TTAGTTGCGTTACACCCTTTC-3′, and reverse,
5′-AACCGACTGCTGTCACCTTC-3′. The PCR products were separated on a 2%
agarose gel and visualized using 1% ethidium bromide staining and
ultraviolet illumination. The expected sizes of the amplification
products were 222 bp for cyclin D1, 363 bp for survivin and 164 bp
for β-actin. Target gene expression levels were semi-quantified
based on band intensities using the Bio-Rad GelDoc XR instrument
and Quantify One software version 4.6.9 (both Bio-Rad Laboratories,
Inc.). The following equations were used: Band Intensity = mean OD
× band area; and Relative Quantification of mRNA = band intensity
target gene/band intensity internal
reference.
Western blot analysis
DLD-1 cells (~1×10⁶) were seeded onto
100-mm2 tissue culture plates and incubated for 24 h for
complete attachment. The cells were treated according to the
aforementioned experimental groupings and were harvested following
dissociation with trypsin. Cells were washed twice with PBS,
centrifuged at 500 × g for 5 min and 4°C, and 60 µl ProteoJET
Mammalian Cell Lysis Reagent (Fermentas; Thermo Fisher Scientific,
Inc.) was added. The cells were vortexed for 10 sec and lysed for
30 min with occasional vortexing. Following centrifugation at
16,000 × g for 30 min and 4°C, the supernatant was transferred to a
fresh Eppendorf tube and stored at −80°C. The protein concentration
was determined using a Pierce BCA Protein assay kit (Thermo Fisher
Scientific, Inc.) according to the manufacturer's instructions.
Equal quantities of protein (20 µg) were loaded and separated by
10% SDS-PAGE. The proteins were then electrotransferred onto a
polyvinylidene fluoride membrane. The membrane was blocked with
Tris-buffered saline solution containing 1% Tween-20 (TBS-T) buffer
and 5% skim milk for 1 h at room temperature, followed by
incubation with the following primary antibodies at 4°C overnight:
Anti-cyclin D1 (cat. no. 2926; dilution, 1:1,000; CST Biological
Reagents Company Limited, Shanghai, China), anti-survivin (cat. no.
ab8228; dilution, 1:1,000; Abcam, Cambridge, UK) and anti-β-actin
(cat. no. ms-1295; dilution, 1:5,000; Thermo Fisher Scientific,
Inc.). The membrane was then washed using TBS-T and incubated with
secondary antibodies [Amersham ECL sheep anti-mouse IgG,
horseradish peroxidase (HRP)-linked whole Ab; cat. no. NA931;
dilution, 1:5,000; GE Healthcare Bio-Sciences, Pittsburgh, PA, USA;
and the Amersham ECL donkey anti-rabbit IgG, HRP-linked whole Ab;
cat. no. NA934; dilution, 1:5,000; GE Healthcare Bio-Sciences] at
room temperature for 1 h. The membrane was subsequently washed
three times with TBS-T, and proteins were detected using an
enhanced chemiluminescence reagent kit (cat. no. WBKLS0100; EMD
Millipore, Billerica, MA, US) according to the manufacturer's
instructions. Then the membrane was exposed using X-ray film in a
dark room. The X-ray film was scanned, and protein expression was
quantified by densitometric analysis using Image J v1.46r software
(National Institutes of Health, Bethesda, MD, USA). Three
experimental repeats were performed.
Detection of cell migration ability
using the Transwell assay
Cells were treated for 24 h according to the
aforementioned experimental groupings. The cells were then
dissociated with trypsin, harvested, and counted. The upper
chambers of the Transwell plates (Corning Incorporated, Corning,
NY, USA) containing an 8.0-µm membrane, were seeded with
5×10⁵ cells. Complete medium containing 20% FBS was then
added to the lower chambers, and the Transwell plates were placed
in an incubator at 37°C for 24 h. Non-migrated cells in the upper
chamber were then removed with a cotton swab. Following washing
twice with PBS, the cells were fixed with 75% ethanol for 20 min at
room temperature, stained with 10% Giemsa stain for 10 min at room
temperature, washed with running water, dried and cells in ten
random high-magnification fields of view were counted under a light
microscope. The average number of migrated cells in each group was
then calculated.
Statistical analysis
Data were presented as a percentage or the mean.
Statistical analyses were performed using SPSS software (version
21.0; IBM SPSS, Armonk, NY, USA). Group comparisons of normally
distributed data were performed using Student's t-tests (for two
samples) or one-way analysis of variance (for multiple comparisons
using a Bonferroni post hoc test). All statistical tests used in
this study were two-sided, and P<0.05 was considered to indicate
a statistically significant difference.
Results
The inhibitory effects of TAM and E2
on the viability of DLD-1 CRC cells
As shown in Fig.
1A, the rate of inhibition of DLD-1 cell viability was
positively associated with TAM concentration following 24 h
(P=0.018), 48 h (P=0.016) and 72 h (P=0.017) of treatment. The rate
of inhibition of DLD-1 cell viability was also positively
associated with E2 concentration following 24 h (P=0.024), 48 h
(P=0.028) and 72 h (P=0.021) of treatment (Fig. 1B). In addition, as shown in
Fig. 1C, the rate of inhibition of
DLD-1 cell viability was positively associated with the
concentration of combination-treatment (TAM+E2) following 24 h
(P=0.018), 48 h (P=0.021) and 72 h (P=0.028) of treatment. The
IC50 values for TAM, E2 and combined drug treatment
(TAM+E2) for 24, 48 and 72 h were decreased, respectively (Fig. 1D). Furthermore, the
combination-treatment group exhibited the greatest reduction in
DLD-1 cell viability when compared with the single-drug-treatment
groups (P<0.05). In addition, TAM treatment alone reduced the
viability of DLD-1 cells to a greater extent than E2 treatment
alone (P<0.05; Fig. 1D).
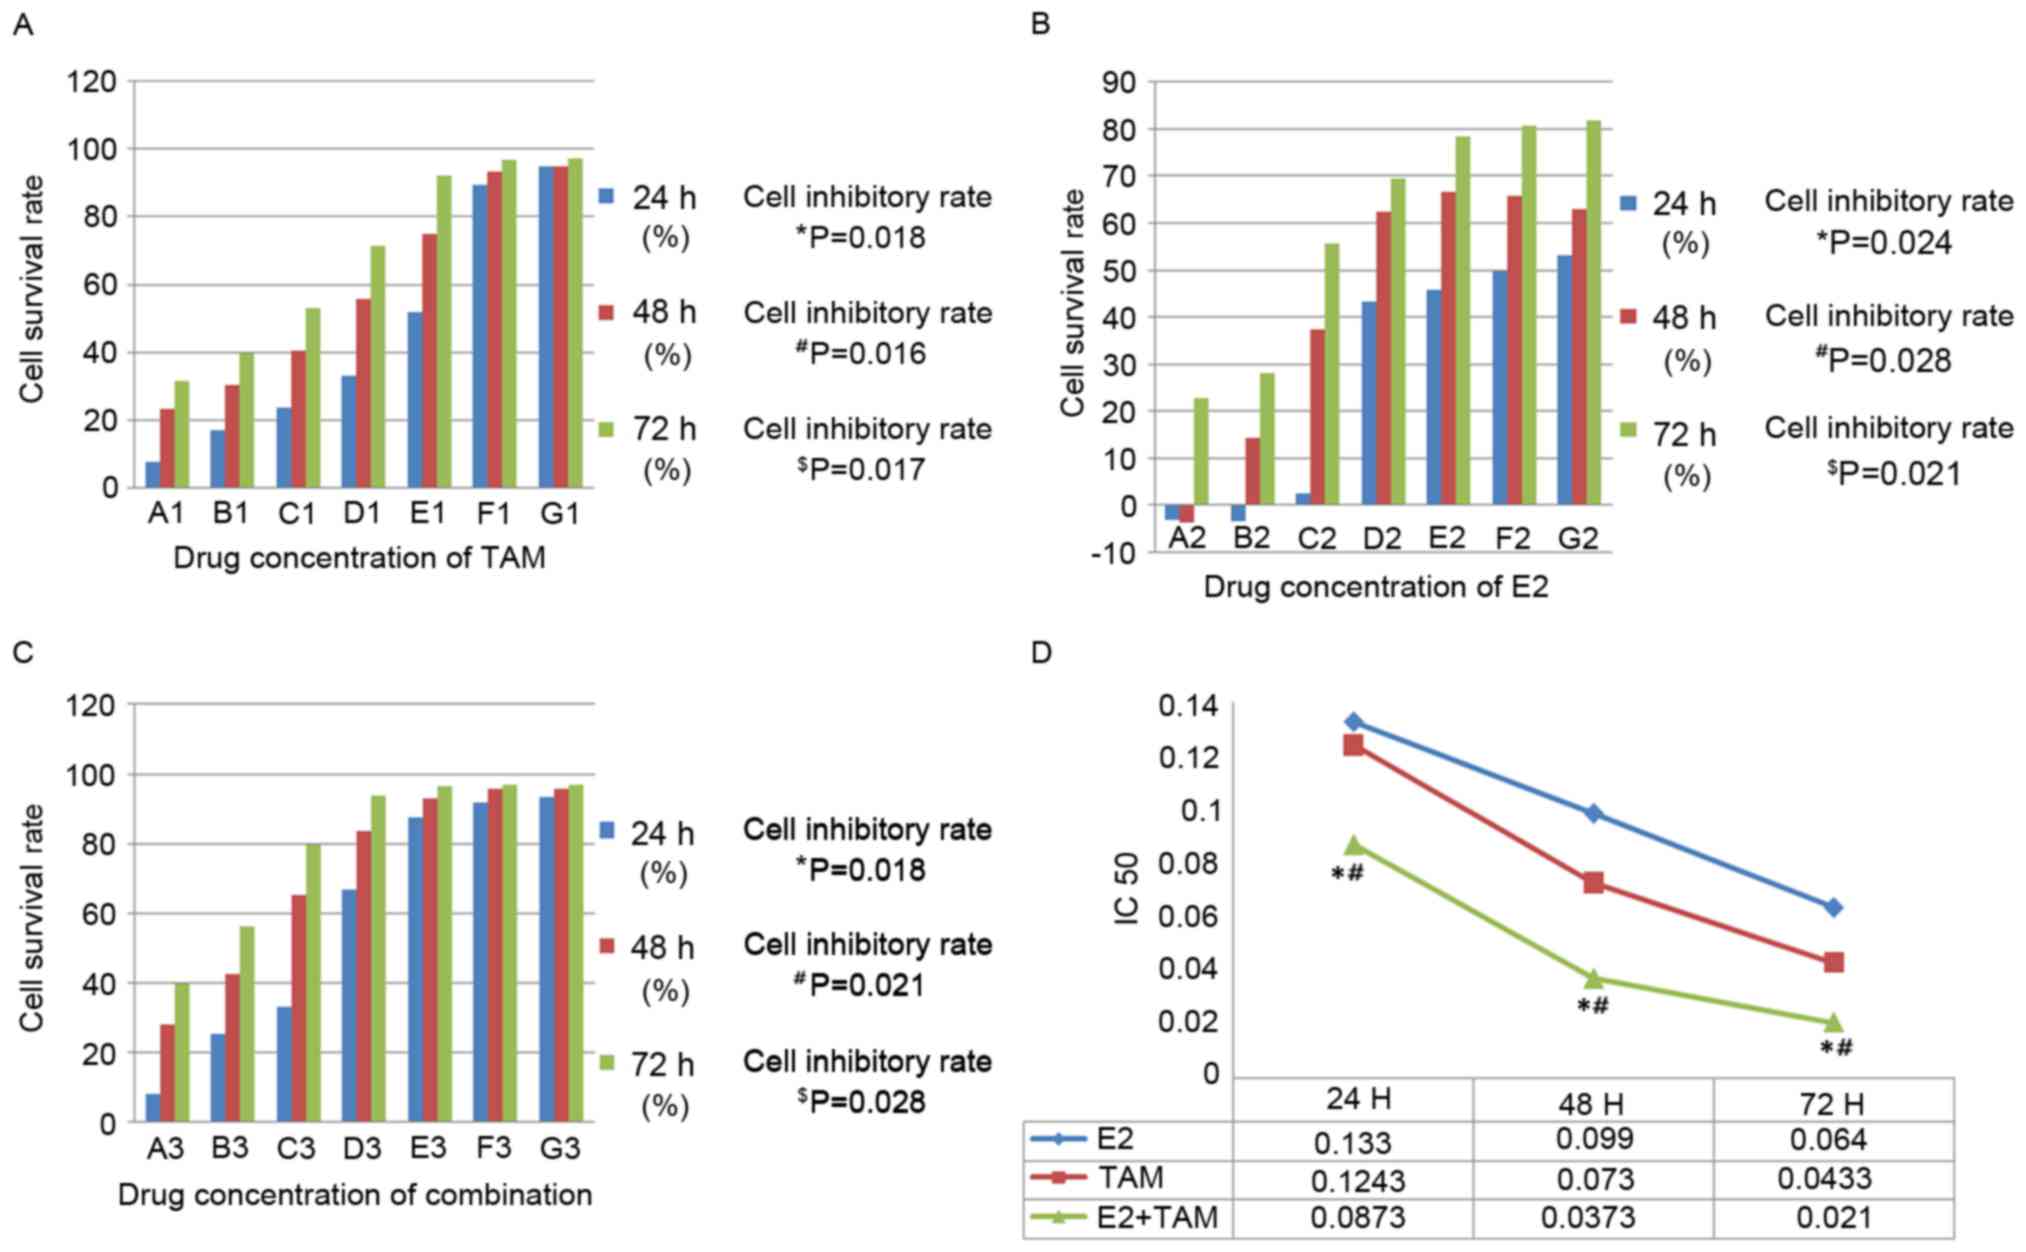 | Figure 1.Inhibitory effects of TAM, E2 or TAM
plus E2 treatment on cell viability, as determined using an MTT
assay. (A) TAM only treatment: A1, 0.015625×10⁻⁴ M; B1,
0.03125×10⁻⁴ M; C1, 0.0625×10⁻⁴ M; D1,
0.125×10⁻⁴ M; E1, 0.25×10⁻⁴ M; F1,
0.5×10⁻⁴ M; G1, 1×10⁻⁴ M. The effect of cell
viability inhibition was positively associated with TAM
concentration (*P<0.05 at 24 h; #P<0.05 at 48 h;
$P<0.05 at 72 h; comparisons were made between all
concentrations at each time point). (B) E2 only treatment: A2,
0.015625×10⁻³ M; B2, 0.03125×10⁻³ M; C2,
0.0625×10⁻³ M; D2, 0.125×10⁻³ M; E2,
0.25×10⁻³ M; F2, 0.5×10⁻³ M; G2,
1×10⁻³ M. The effect of cell viability inhibition was
positively associated with E2 concentration (*P<0.05 at 24 h;
#P<0.05 at 48 h; $P<0.05 at 72 h;
comparisons were made between all concentrations at each time
point). (C) Combination-treatment group: A3, A1+A2; B3, B1+B2; C3,
C1+C2; D3, D1+D2; E3, E1+E2; F3, F1+F2; G3, G1+G2. The effect of
cell viability inhibition was positively associated with
combination-treatment concentration (*P<0.05 at 24 h;
#P<0.05 at 48 h; $P<0.05 at 72 h;
comparisons were made between all concentrations at each time
point). (D) The IC50 results of the three treatments
were determined using an MTT assay. The IC50 results
indicate that the inhibitory effects in these three treatment
groups increased with an increase in treatment duration. The
combination-treatment group exhibited the highest rate of
inhibition. *P<0.05 vs. TAM; #P<0.05 vs. E2. TAM,
tamoxifen; E2, 17AM, tamoxifen; IC50, half maximal
inhibitory concentration. |
Induction of DLD-1 cell apoptosis by
TAM and E2
The results of the quantitative annexin-V/propidium
iodide double-staining assay revealed that TAM, E2 and TAM+E2
significantly induced DLD-1 cell apoptosis when compared to the
control group (TAM: P<0.05; E2: P<0.05; TAM+E2: P<0.05).
In addition, apoptosis rates were positively associated with the
treatment duration and drug concentration (Fig. 2A). The rate of apoptosis was low
following treatment with TAM and E2 for 24 h, while the rate of
apoptosis in the drug-combination treatment group reached 15%
following 24 h (Fig. 2A).
Following 48 h of treatment, the TAM and E2-treated groups
exhibited increased apoptosis. The rate of apoptosis in
0.5×10⁻³ M E2-treated cells was 23.1%, and in
0.25×10⁻⁴ M TAM-treated cells the apoptosis rate was 22%
(Fig. 2). The rate of apoptosis
increased following 72 h, whereby 0.0625×10⁻³ M E2 and
0.5×10⁻³ M E2-treated groups demonstrated apoptosis
rates of 34.7 and 51.6%, respectively, and the rates of apoptosis
for the 0.0625×10⁻⁴ M TAM and 0.25×10⁻⁴ M
TAM-treated groups were 16.4 and 54.9%, respectively. In addition,
the rate of apoptosis for the drug-combination treatment group
reached 32.3% following 72 h (Fig.
2A).
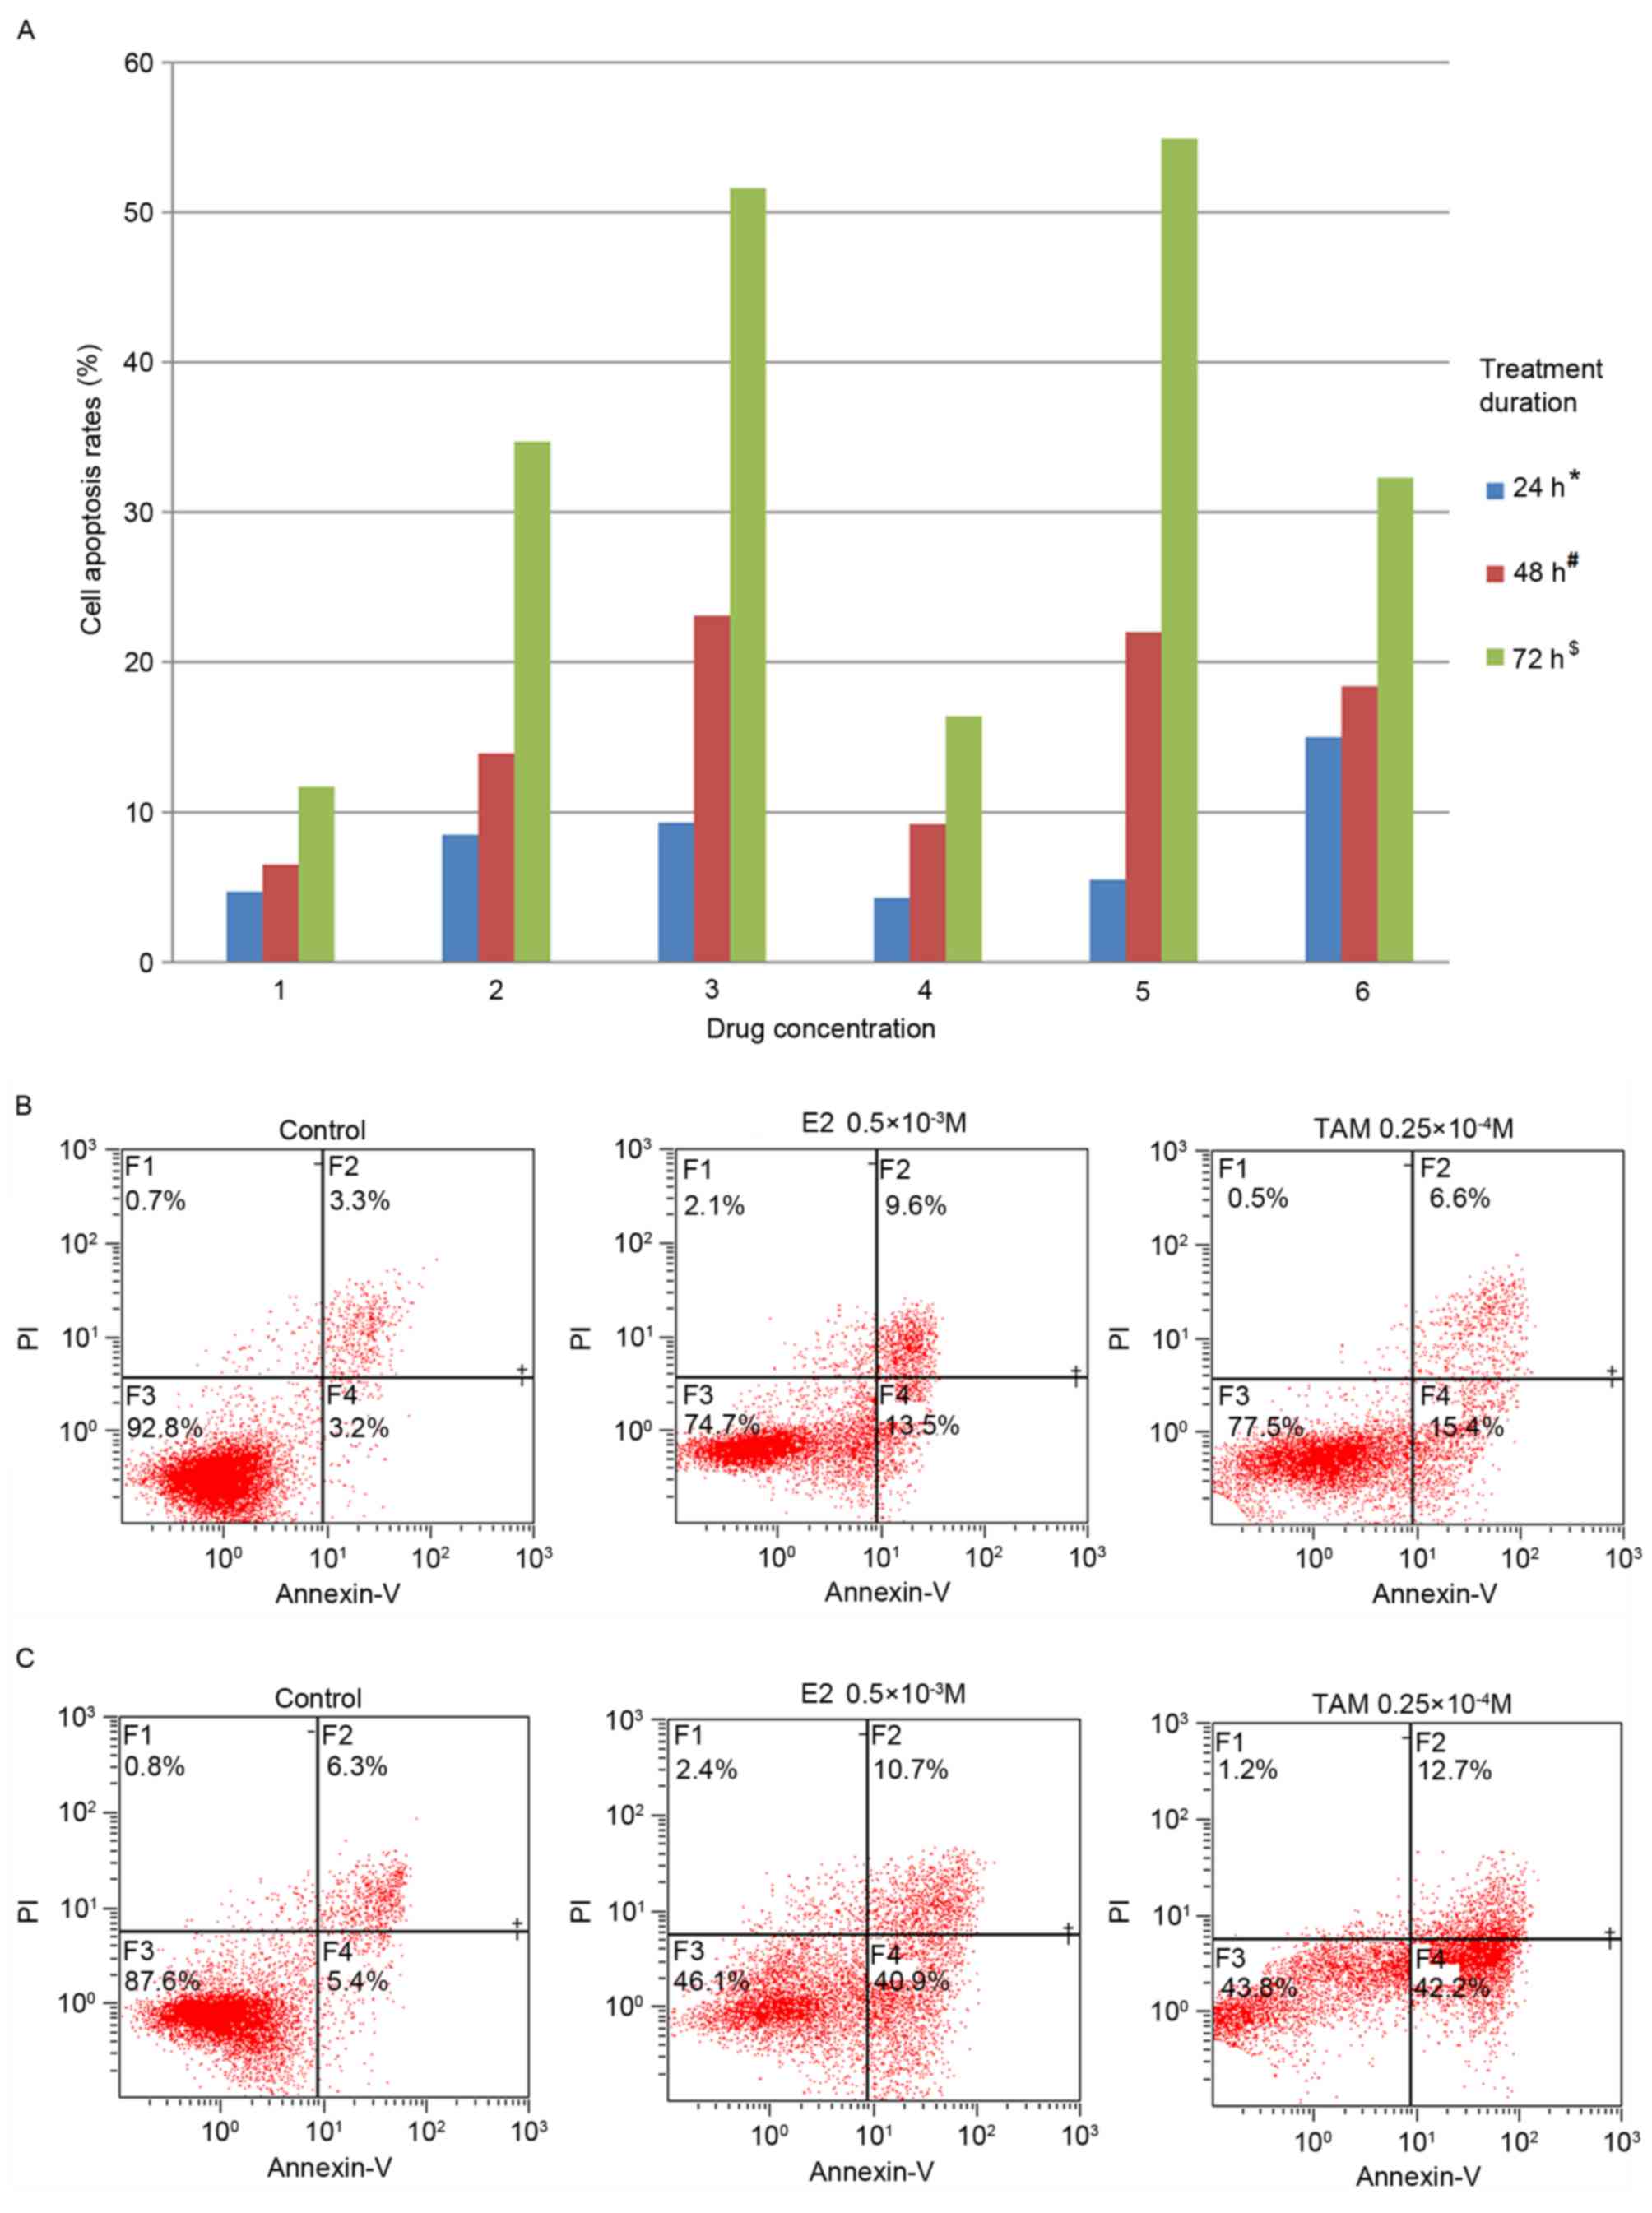 | Figure 2.Induction of DLD-1 cell apoptosis by
TAM and E2. (A) Cell apoptosis rates following treatment with TAM
and/or E2. 1, control; 2, 0.0625×10⁻³ M E2; 3,
0.5×10⁻³ M E2; 4, 0.0625×10⁻⁴ M TAM; 5,
0.25×10⁻⁴ M TAM; 6, 0.0625×10⁻³ M E2 +
0.0625×10⁻⁴ M TAM. With increasing concentrations of
drug and treatment duration, the rate of apoptosis increased in 24
h (*P<0.05), 48 h (#P<0.05) and 72 h
($P<0.05; comparisons were made between all
concentrations at each time point). Following drug treatment for 72
h, high concentrations of E2 and TAM effectively induced DLD-1 cell
apoptosis, and the rate of apoptosis reached 51.6 and 54.9%,
respectively. (B) Apoptosis induced by 0.5×10⁻³ M E2 or
0.25×10⁻⁴ M TAM for 48 h. (C) Apoptosis induced by
0.5×10⁻³ M E2 or 0.25×10⁻⁴ M TAM for 72 h.
TAM, tamoxifen; E2, 17β-estradiol; PI, propidium iodide. |
Effects of TAM and E2 on survivin and
cyclin D1 mRNA expression as determined by sqPCR
DLD-1 cells were treated with
0.015625×10⁻⁴, 0.03125×10⁻⁴,
0.0625×10⁻⁴ and 0.125×10⁻⁴ M TAM,
0.015625×10⁻³, 0.03125×10⁻³,
0.0625×10⁻³, 0.125×10⁻³,
0.25×10⁻³, 0.5×10⁻³ and 1×10⁻³ M
E2, or a combination of these two drugs for 24, 48 and 72 h. The
results indicated that the cyclin D1 mRNA expression levels were
not significantly altered, while the expression of survivin mRNA
was decreased; the degree of which was positively associated with
drug concentration and treatment duration. The combined treatment
markedly decreased the expression of survivin mRNA when compared
with each treatment alone (Fig.
3).
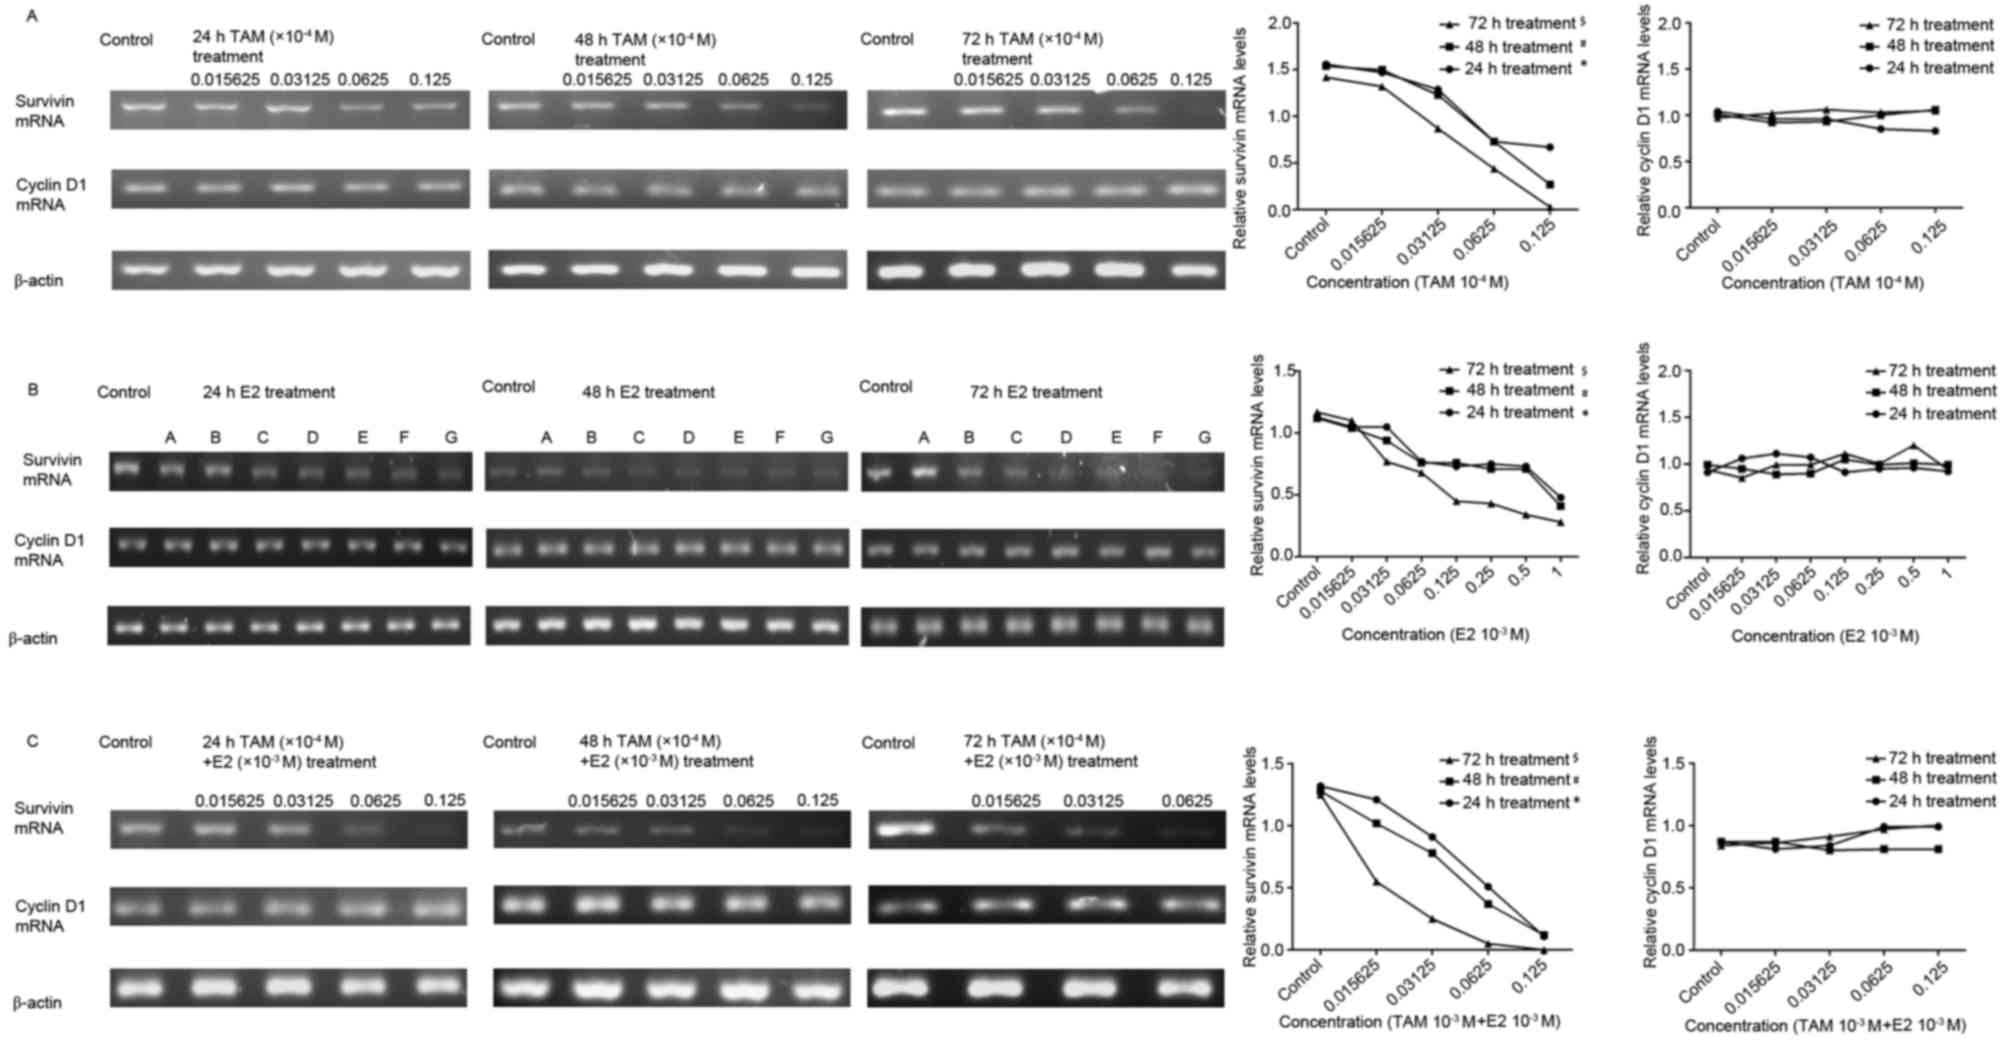 | Figure 3.Effect of TAM and/or E2 treatment on
survivin and cyclin D1 mRNA expression levels, as determined by
sqPCR analysis. Gray-scale band densities of the reverse
transcription-polymerase chain reaction results in each treatment
group were compared and analyzed using ImageJ software. (A)
Following treatment of DLD-1 cells with TAM, cyclin D1 mRNA
expression levels were not significantly altered, while relative
survivin mRNA expression levels were significantly decreased
following treatment with increasing concentrations of TAM at 24 h
(*P<0.05), 48 h (#P<0.05) and 72 h
($P<0.05; comparisons were made between all
concentrations at each time point). (B) The expression of survivin
and cyclin D1 following treatment of DLD-1 cells with E2. A,
0.015625×10⁻³ M; B, 0.03125×10⁻³ M; C,
0.0625×10⁻³ M; D, 0.125×10⁻³ M; E,
0.25×10⁻³ M; F, 0.5×10⁻³ M; G,
1×10⁻³ M. Following treatment, cyclin D1 mRNA expression
levels were not significantly altered, while relative survivin mRNA
expression levels were significantly decreased with increasing
concentrations of E2 at 24 h (*P<0.05), 48 h
(#P<0.05) and 72 h ($P<0.05;
comparisons were made between all concentrations at each time
point). (C) Expression of survivin and cyclin D1 following
treatment of DLD-1 cells with TAM + E2. Cyclin D1 mRNA expression
levels were not significantly altered, while relative survivin mRNA
expression levels were significantly decreased with increasing drug
concentrations at 24 h (*P<0.05), 48 h (#P<0.05)
and 72 h ($P<0.05; comparisons were made between all
concentrations at each time point). The results are presented as
the expression level of survivin relative to that of the β-actin
internal control. TAM, tamoxifen; E2, 17β-estradiol. |
Effect of TAM and E2 on survivin and
cyclin D1 protein expression levels in DLD-1 cells as determined by
western blot analysis
Following treatment of DLD-1 cells with
0.015625×10⁻⁴, 0.03125×10⁻⁴,
0.0625×10⁻⁴ and 0.125×10⁻⁴ M TAM for 24, 48
or 72 h, the level of cyclin D1 protein expression was not
significantly altered, while survivin protein expression levels
were decreased; the degree of which was positively associated with
drug concentration and treatment duration (Fig. 4A). Following treatment with
0.015625×10⁻³, 0.03125×10⁻³,
0.0625×10⁻³, 0.125×10⁻³,
0.25×10⁻³, 0.5×10⁻³ and 1×10⁻³ M
E2, the level of cyclin D1 protein expression was not significantly
altered. In addition, the level of survivin protein expression was
not significantly altered following 24 h of E2 treatment, however,
it was observed to increase with increasing drug concentrations at
48 and 72 h of treatment (Fig.
4B). Higher levels of survivin protein expression were observed
at high and low drug concentrations, and lower levels of expression
were observed at medium drug concentrations (Fig. 4B). In the combination-drug
treatment group, the level of cyclin D1 protein expression was not
significantly altered, while expression of the survivin protein
decreased in a concentration and time-dependent manner (Fig. 4C).
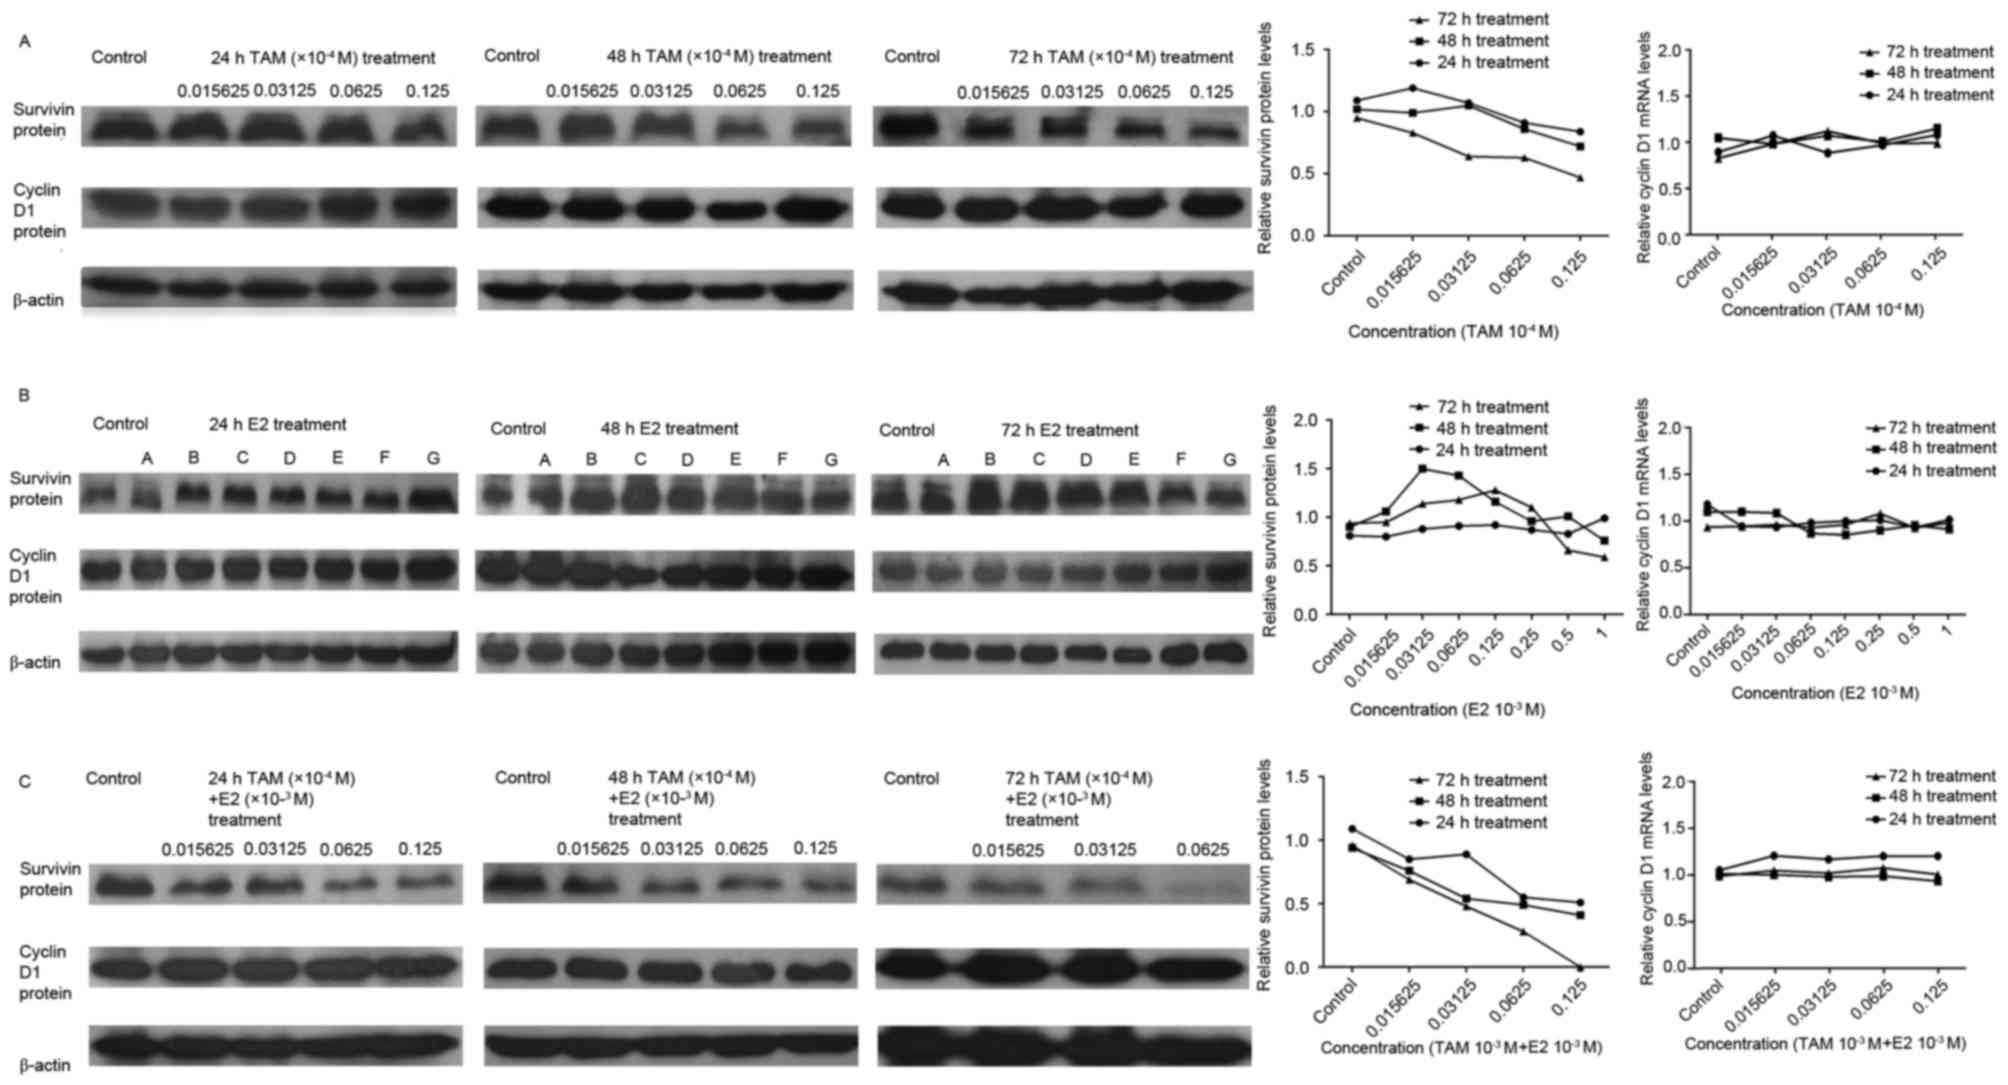 | Figure 4.Effect of TAM and/or E2 treatment on
survivin and cyclin D1 protein expression levels, as determined by
western blotting. Gray-scale band densities were compared and
analyzed using the ImageJ software. (A) DLD-1 cells following
treatment with TAM. Cyclin D1 protein expression levels were not
significantly altered, while relative survivin protein expression
levels exhibited decreased with increasing drug concentrations. (B)
DLD-1 cells following treatment with E2. A,
0.015625×10⁻³ M; B, 0.03125×10⁻³ M; C,
0.0625×10⁻³ M; D, 0.125×10⁻³ M; E,
0.25×10⁻³ M; F, 0.5×10⁻³ M; G,
1×10⁻³ M. Following treatment, cyclin D1 protein
expression levels were not significantly altered. Survivin protein
expression levels were not significantly altered following 24 h
incubation, whereas treatment with >0.03125×10⁻³ M E2
at 48 h and >0.125×10⁻³ M E2 at 72 h was associated
with a reduction in survivin protein expression levels. (C) DLD-1
cells following treatment with TAM + E2. Cyclin D1 protein
expression levels were not significantly altered, while relative
survivin protein expression levels decreased with increasing drug
concentrations. Results are presented as the expression of survivin
relative to the β-actin internal control. TAM, tamoxifen; E2,
17β-estradiol. |
Effects of TAM and/or E2 treatment on
the migration capability of DLD-1 cells
The results of the Transwell migration assay
demonstrated that TAM and/or E2 treatment demonstrated significant
inhibitory effects on the migration capabilities of DLD-1 cells
(Fig. 5). DLD-1 cells were treated
with 0.015625×10⁻³, 0.03125×10⁻³,
0.0625×10⁻³, 0.125×10⁻³,
0.25×10⁻³, 0.5×10⁻³ and 1×10⁻³ M
E2 and the average number of cells that traversed the membrane in
ten random high magnification fields of view was 436±11.1, 330±9.7,
226±8.4, 154±3.9, 54±3.1, 36±2.3 and 20±1.6, respectively (Fig. 5A). Following treatment with
0.015625×10⁻⁴, 0.03125×10⁻⁴,
0.0625×10⁻⁴, 0.125×10⁻⁴ and
0.25×10⁻⁴ M TAM, the average numbers of cells that
traversed the membrane were 217±9.5, 215±8.2, 200±7.6, 65±3.4 and
16±1.4, respectively. Following TAM plus E2 treatment, the
calculated average numbers of migrated cells were 225±7.0, 165±5.5,
106±5.1 and 11±1.0 at increasing concentrations, respectively
(Fig. 5). Treatment with TAM, E2
and the combination-treatment significantly inhibited the migration
capabilities of DLD-1 cells in a dose-dependent manner. The
inhibitory effect of the combined treatment on cell migration was
greater than each treatment alone (P<0.05; Fig. 5).
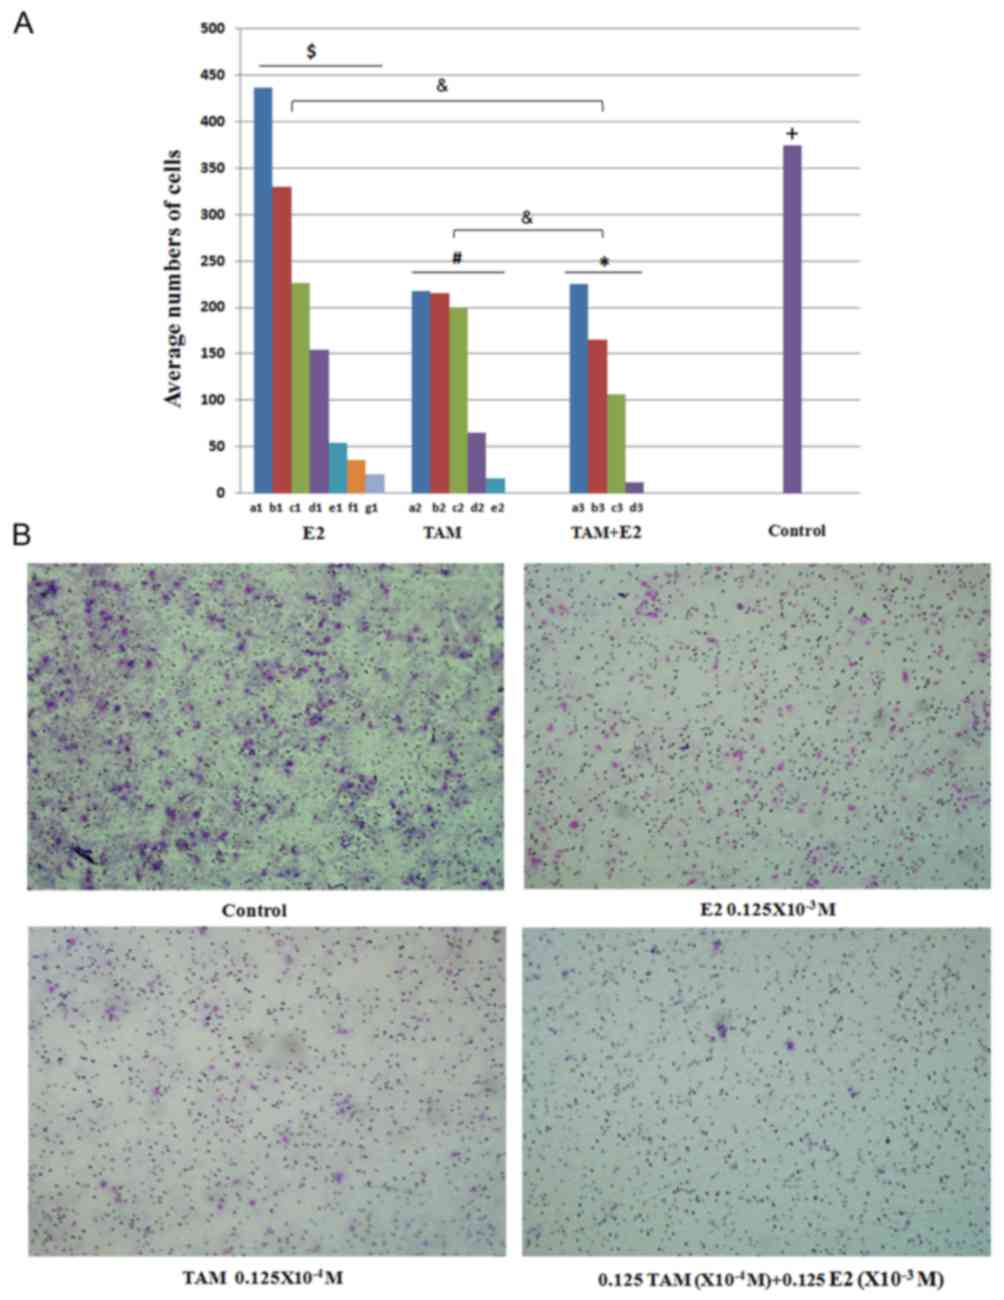 | Figure 5.Effect of TAM and/or E2 treatment on
the migration of DLD-1 cells. (A) The average numbers of cells that
traversed the Transwell membrane in 10 high magnification fields of
view selected at random. E2 significantly inhibited the migration
capabilities of DLD-1 cells in a dose-dependent manner
($P<0.01, comparisons were made between all
concentrations in the E2 group); a1, 0.015625×10⁻⁴ M E2;
b1, 0.03125×10⁻⁴ M E2; c1, 0.0625×10⁻⁴ M E2;
d1, 0.125×10⁻⁴ M E2; e1, 0.25×10⁻⁴ M E2; f1,
0.5×10⁻⁴ M E2; g1, 1×10⁻⁴ M E2. TAM
significantly inhibited the migration capabilities of DLD-1 cells
in a dose-dependent manner (#P<0.05, comparisons were
made between all concentrations in the TAM group); a2,
0.015625×10⁻³ M TAM; b2, 0.03125×10⁻³ M TAM;
c2, 0.0625×10⁻³ M TAM; d2, 0.125×10⁻³ M TAM;
e2, 0.25×10⁻³ M TAM. Combination-treatment significantly
inhibited the migration capabilities of DLD-1 cells in a
dose-dependent manner (*P<0.05, comparisons were made between
all concentrations in the TAM+E2 group); a3, a1+a2; b3, b1+b2; c3,
c1+c2; d3, d1+d2. The inhibitory effect of combined treatment on
cell migration was significantly greater than that observed in each
individual treatment alone [&P<0.05, TAM+E2 vs.
the individual treatment groups (E2 and TAM treatment alone)]. Cell
migration capabilities in the control group were significantly
greater when compared to the E2, TAM and combined treatment,
respectively (+P<0.05, control vs. each treatment
group). (B) Representative light microscope images (magnification,
×40) were used to evaluate the effect of E2, TAM and E2+TAM
combined drug treatments on cell migration. TAM, tamoxifen; E2,
17M, tamoxifen. |
Discussion
Previous studies have demonstrated that estrogen
serves a role in the development of CRC (23,24).
The incidence rates of breast cancer are increased in
postmenopausal women treated with hormone replacement therapy,
while the incidence rate of CRC is significantly decreased
(25,26). The expression of the ERα subtype is
low in the gastrointestinal tract and in gastrointestinal tract
tumors. Therefore, it was hypothesized that the decreased incidence
of CRC in these individuals may be associated with the ERβ subtype
(27). Paruthiyil et al
(28) demonstrated that E2
promoted the proliferation of ERα-positive breast cancer cell
lines, and inhibited the proliferation of ERβ-positive breast
cancer cell lines. Li et al (29) confirmed that low concentrations of
E2 stimulated the proliferation of human colon carcinoma-derived
caco-2 cells, while Arai et al (16) revealed that estrogen did not affect
the proliferation of five human CRC cell lines with ERβ expression
and no ERα expression, however, estrogen did affect the
proliferation of ERα-expressing cell lines. Therefore, it was
hypothesized that the expression of ERα is very important for the
function of estrogen. However, it is possible that the expression
levels of ERβ were low in these cell lines. Hendrickse et al
(30) demonstrated that the level
of the ER in HT-29, Colo320 and Lovo cells was lower than 12
fmol/mg protein, and the transcriptional activity of ERβ was lower
than that of ERα. Therefore, one of the aims of the present study
was to determine the effect of different concentrations of estrogen
on the viability of CRC cells. The present study used DLD-1 cells,
which express the ERβ subtype only. The results revealed that a low
concentration of E2 promoted DLD-1 cell viability following a short
duration of treatment. With an increase in treatment duration and
concentration, E2 exhibited inhibitory effects on DLD-1 cell
viability. The authors hypothesize that this result may be
associated with the lower transcriptional activity of the ERβ
subtype following exposure to low concentrations of estrogen.
Fox et al (31) proposed that ERβ may be suitable as
a therapeutic target for TAM as the affinity of ERβ for TAM is
higher than for E2. In addition, Miller et al (32) observed that TAM treatment was
associated with an increase in ERα and a decrease in ERβ
expression. Arai et al (16) demonstrated that TAM inhibited the
proliferation of MCF-7, HT-29 and Colo320 cells. The results of the
present study indicated that TAM inhibited the viability of DLD-1
cells, and that this effect was positively associated with drug
concentration and treatment duration. TAM belongs to a class of
drugs known as selective ER modulators. TAM competes with estrogen
for binding to the ER. However, the effects of TAM are complex
(33,34). Whether TAM activates or inhibits
the ER following binding depends on the target tissue type.
Krishnan et al (35)
demonstrated that TAM binds to the ERβ subtype to effectively
antagonize the function of estrogen and downregulate ERβ
expression. In the present study, treatment with TAM plus E2
demonstrated inhibitory effects on the viability of DLD-1 cells.
This effect was positively associated with the concentration of
drug and duration of treatment, and was stronger than that of the
single-drug treatments. These results indicate that the
antiestrogenic function of TAM via binding to the ERβ may not be
the only mechanism involved in the inhibition of cell proliferation
by TAM.
The results of the present study demonstrated that
TAM and E2 induce DLD-1 apoptosis. The apoptosis rate was
positively associated with treatment duration and drug
concentration. Induction of apoptosis following TAM plus E2
treatment was greater than that of the single-drug treatments.
Therefore, TAM and E2 may demonstrate synergistic effects in the
regulation of apoptosis. In previous breast cancer studies, Hou
et al (36) revealed that
ERβ promoted the development and metastasis of cancer. In the
present study, the Transwell assay results indicated that TAM, E2
and the combined drug treatment demonstrated significant inhibitory
effects on the migration capabilities of the DLD-1 cells. In
addition, combined treatment had a greater effect on the cell
migration capabilities of DLD-1 cells. Therefore, the authors
speculated that TAM and E2 may exhibit synergistic effects in the
downregulation of ERβ expression, thereby inhibiting proliferation,
infiltration to the surrounding tissues and distal metastasis of
CRC.
Previous studies have demonstrated that CRC is
associated with a variety of genes including k-ras, c-Myc, B-cell
lymphoma-2, p53, survivin and cyclin D1 (37–41).
Among these genes, survivin is a member of the inhibitors of
apoptosis protein family. The survivin gene is localized on human
chromosome 17q25 and is associated with the apoptosis and
proliferation of cells. Downregulation of survivin demonstrates
antitumor effects, which have a therapeutic value (42). Overexpression of cyclin D1, one of
the cell cycle regulators, is a hallmark of a number of primary
human tumors (43). Cyclin D1
expression is very important for the diagnosis and prognosis of
tumors (44). The results of the
present study indicated that TAM possesses apoptosis-promoting
functions. Therefore, the authors investigated whether TAM and E2
may affect the expression of survivin and cyclin D1. Li et
al (29) previously
demonstrated that TAM may inhibit the expression of the survivin
gene to relieve the inhibitory effect of survivin on caspase-3 and
therefore increase caspase-3 activity, which leads to apoptosis
induction in breast cancer cells. In addition, a previous study
demonstrated that TAM decreases the number of cells in S phase by
decreasing the ratio of cells in the G2/M phases of the
cell cycle, thus decreasing the expression of survivin (45). Previous studies have demonstrated
via immunohistochemical analyses, that the normal colorectal mucosa
does not express survivin (46,47).
With the transition from normal colorectal mucosa to low-grade
dysplastic adenoma and highly dysplastic adenoma/CRC, the positive
rate of survivin expression consequently increased. Wang et
al (41) transfected a
recombinant adenovirus containing survivin into SW480 cells, which
led to a significant decrease in survivin mRNA expression. Once
survivin was silenced, the percentage of apoptotic cells was
observed to increase. It has therefore been postulated that
silencing of survivin expression may inhibit cell growth and induce
apoptosis in CRC cells. The results of the present study
demonstrated that survivin protein expression decreased to some
extent following treatment of DLD-1 cells with TAM; the degree of
which was positively associated with drug concentration and
treatment duration. Therefore, the authors hypothesized that the
downregulation of survivin expression induced by TAM occurs in a
time- and dose-dependent manner. TAM downregulated survivin
expression in DLD-1 cells and induced CRC cell apoptosis. It was
speculated that the mechanism underlying the induction of apoptosis
by TAM may have been associated with survivin expression. In
addition, following treatment of DLD-1 cells with different
concentrations of E2, the survivin protein expression levels were
not significantly altered in the 24 h treatment group; however, it
increased with increasing drug concentrations in the 48 and 72 h
groups. Higher levels of survivin protein expression following
treatment with medium concentrations of E2 were observed, whereas
lower levels of expression were observed following treatment with
high and low E2 concentrations. However, following treatment of
cells with E2, survivin mRNA expression levels were reduced. The
extent of this decrease was positively associated with the
concentration of drug and duration of treatment. He et al
(48) demonstrated that estrogen
promotes the G2 to S phase transition in ovarian cancer
cell lines. In addition, with increasing doses of estrogen, the
number of cells in G1 phase was not significantly
altered; however, the number of cells transitioning from
G2 to S phase increased. The apoptosis-inhibition factor
survivin is primarily expressed in the G2 phase. He
et al (48) demonstrated
that, when E2 concentration increased, survivin expression was
decreased accordingly. These results are consistent with the
results of the present study regarding survivin mRNA levels
following E2 treatment, however this is not consistent with the
survivin protein expression levels. A possible explanation for
these conflicting results may be that the expression of the ER is
different among different cell lines. Whether different survivin
expression levels are induced by the expression of different ER
subtypes will be the focus of future studies. Hwang et al
(49) and an additional study
(50) previously demonstrated that
TAM downregulated cyclin D1 expression in vitro in
ER-positive MCF-7 human breast cancer cells and rat breast cancer
cells to inhibit tumor development. However, the present study
indicated that following drug treatment in three different groups,
the expression levels of cyclin D1 mRNA and protein were not
altered. It is possible that, following the interaction of TAM with
ERα, transcription is interrupted and the expression of cyclin D1
mRNA and protein are downregulated, thus blocking the
G1/S transition. However, as the DLD-1 cells employed in
the present study expressed ERβ alone, TAM may have elicited little
effect on cyclin D1 protein expression.
In conclusion, the results of the present study
demonstrated that TAM effectively inhibited the viability and
migration ability of DLD-1 colorectal cells and promoted apoptosis.
A high concentration of E2 demonstrated inhibitory effects on the
viability of the DLD-1 cells, and TAM and E2 may synergistically
inhibit cell viability. The inhibitory effect of TAM plus E2
treatment was greater than that of each agent alone. In addition,
the anticancer effects of TAM and E2 may be associated with the
downregulation of survivin expression. These results provide a
novel experimental basis for hormonal adjuvant therapy in the
treatment of CRC. Based on these results, the authors aim to
conduct in vivo animal studies to provide an experimental
basis for final randomized controlled clinical trials.
Acknowledgements
The present study was supported by the National
Natural Science Foundation of the Republic of China (grant no.
81101861), the Doctoral Fund of the Ministry of Education of China
(grant no. 20110171120100), the Natural Science Foundation of
Guangdong Province (grant no. S2012010011132), the Science and
Technology Planning Project of Guangdong Province (grant no.
2013B021800146) and Guangzhou Science and Technology Plan Projects
(Health Medical Collaborative Innovation Program of Guangzhou)
(grant no. 201400000001-4). The authenticity of this article has
been validated by uploading the key raw data onto the Research Data
Deposit public platform (http://www.researchdata.org.cn), with the approval
number as RDDB 2017000056.
Glossary
Abbreviations
Abbreviations:
|
CRC
|
colorectal cancer
|
|
TAM
|
tamoxifen
|
|
ER
|
estrogen receptor
|
|
E2
|
17β-estradiol
|
|
DEPC
|
diethyl pyrocarbonate
|
References
|
1
|
Pan F, Bao YH, Huang RY, Li J and Zhang Z:
Epidemiological study on the incidence of large intestine cancer in
Wenzhou city from 2001 to 2005. Zhonghua Zhongliu Fangzhi Zazhi.
14:1286–1287. 2007.(In Chinese).
|
|
2
|
Chen WQ, Zheng RS, Zhang SW, Li N, Zhao P,
Li GL, Wu LY and He J: Report of incidence and mortality in China
cancer registries, 2008. Chin J Cancer Res. 24:171–180. 2012.
View Article : Google Scholar : PubMed/NCBI
|
|
3
|
László L: Predictive and prognostric
factors in the complex treatment of patients with colorectal
cancer. Magy Onkol. 54:383–394. 2010. View Article : Google Scholar : PubMed/NCBI
|
|
4
|
Meyerhardt JA and Mayer RJ: Systemic
therapy for colorectal cancer. N Engl J Med. 352:476–487. 2005.
View Article : Google Scholar : PubMed/NCBI
|
|
5
|
Zhang J, Xu J, Zhang RX, Zhang Y, Ou QJ,
Li JQ, Jiang ZZ, Wu XJ, Fang YJ and Zheng L: CD169 identifies an
activated CD8(+) T cell subset in regional lymph nodes that
predicts favorable prognosis in colorectal cancer patients.
Oncoimmunology. 5:e11776902016. View Article : Google Scholar : PubMed/NCBI
|
|
6
|
Jensen EV, Block GE, Smith S, Kyser K and
DeSombre ER: Estrogen receptors and breast cancer response to
adrenalectomy. Natl Cancer Inst Monogr. 34:55–70. 1971.PubMed/NCBI
|
|
7
|
Jordan VC, Gapstur S and Morrow M:
Selective estrogen receptor modulation and reduction in risk of
breast cancer, osteoporosis, and coronary heart disease. J Natl
Cancer Inst. 93:1449–1457. 2001. View Article : Google Scholar : PubMed/NCBI
|
|
8
|
Couse JF, Lindzey J, Grandien K,
Gustafsson JA and Korach KS: Tissue distribution and quantitative
analysis of estrogen receptor-alpha (ERalpha) and estrogen
receptor-beta (ERbeta) messenger ribonucleic acid in the wild-type
and ERalpha-knockout mouse. Endocrinology. 138:4613–4621. 1997.
View Article : Google Scholar : PubMed/NCBI
|
|
9
|
Paech K, Webb P, Kuiper GG, Nilsson S,
Gustafsson J, Kushner PJ and Scanlan TS: Differential ligand
activation of estrogen receptors ERalpha and ERbeta at AP1 sites.
Science. 277:1508–1510. 1997. View Article : Google Scholar : PubMed/NCBI
|
|
10
|
Enmark E, Pelto-Huikko M, Grandien K,
Lagercrantz S, Lagercrantz J, Fried G, Nordenskjöld M and
Gustafsson JA: Human estrogen receptor beta-gene structure,
chromosomal localization, and expression pattern. J Clin Endocrinol
Metab. 82:4258–4265. 1997. View Article : Google Scholar : PubMed/NCBI
|
|
11
|
Campbell-Thompson M, Lynch IJ and Bhardwaj
B: Expression of estrogen receptor (ER) subtypes and ERbeta
isoforms in colon cancer. Cancer Res. 61:632–640. 2001.PubMed/NCBI
|
|
12
|
Takeyama J, Suzuki T, Inoue S, Kaneko C,
Nagura H, Harada N and Sasano H: Expression and cellular
localization of estrogen receptors alpha and beta in the human
fetus. J Clin Endocrinol Metab. 86:2258–2262. 2001. View Article : Google Scholar : PubMed/NCBI
|
|
13
|
Singh S and Langman MJ: Oestrogen and
colonic epithelial cell growth. Gut. 37:737–739. 1995. View Article : Google Scholar : PubMed/NCBI
|
|
14
|
Grodstein F, Newcomb PA and Stampfer MJ:
Postmenopausal hormone therapy and the risk of colorectal cancer: A
review and meta-analysis. Am J Med. 106:574–582. 1999. View Article : Google Scholar : PubMed/NCBI
|
|
15
|
Fiorelli G, Picariello L, Martineti V,
Tonelli F and Brandi ML: Functional estrogen receptor beta in colon
cancer cells. Biochem Biophys Res Commun. 261:521–527. 1999.
View Article : Google Scholar : PubMed/NCBI
|
|
16
|
Arai N, Ström A, Rafter JJ and Gustafsson
JA: Estrogen receptor beta mRNA in colon cancer cells: Growth
effects of estrogen and genistein. Biochem Biophys Res Commun.
270:425–431. 2000. View Article : Google Scholar : PubMed/NCBI
|
|
17
|
Smith CL, Nawaz Z and O'Malley BW:
Coactivator and corepressor regulation of the agonist/antagonist
activity of the mixed antiestrogen, 4-hydroxytamoxifen. Mol
Endocrinol. 11:657–666. 1997. View Article : Google Scholar : PubMed/NCBI
|
|
18
|
Shao R, Feng Y, Zou S, Weijdegård B, Wu G,
Brännström M and Billig H: The role of estrogen in the
pathophysiology of tubal ectopic pregnancy. Am J Transl Res.
4:269–278. 2012.PubMed/NCBI
|
|
19
|
Siegel RL, Miller KD and Jemal A: Cancer
statistics, 2016. CA Cancer J Clin. 66:7–30. 2016. View Article : Google Scholar : PubMed/NCBI
|
|
20
|
Chen W, Zheng R, Baade PD, Zhang S, Zeng
H, Bray F, Jemal A, Yu XQ and He J: Cancer statistics in China,
2015. CA Cancer J Clin. 66:115–132. 2016. View Article : Google Scholar : PubMed/NCBI
|
|
21
|
Chute CG, Willett WC, Colditz GA, Stampfer
MJ, Rosner B and Speizer FE: A prospective study of reproductive
history and exogenous estrogens on the risk of colorectal cancer in
women. Epidemiology. 2:201–207. 1991. View Article : Google Scholar : PubMed/NCBI
|
|
22
|
Calle EE, Miracle-McMahill HL, Thun MJ and
Heath CW Jr: Estrogen replacement therapy and risk of fatal colon
cancer in a prospective cohort of postmenopausal women. J Natl
Cancer Inst. 87:517–523. 1995. View Article : Google Scholar : PubMed/NCBI
|
|
23
|
English MA, Kane KF, Cruickshank N,
Langman MJ, Stewart PM and Hewison M: Loss of estrogen inactivation
in colonic cancer. J Clin Endocrinol Metab. 84:2080–2085. 1999.
View Article : Google Scholar : PubMed/NCBI
|
|
24
|
Oduwole OO, Isomaa VV, Nokelainen PA,
Stenbäck F and Vihko PT: Downregulation of estrogen-metabolizing 17
beta-hydroxysteroid dehydrogenase type 2 expression correlates
inversely with Ki67 proliferation marker in colon-cancer
development. Int J Cancer. 97:1–6. 2002. View Article : Google Scholar : PubMed/NCBI
|
|
25
|
Neuhouser ML, Aragaki AK, Prentice RL,
Manson JE, Chlebowski R, Carty CL, Ochs-Balcom HM, Thomson CA, Caan
BJ, Tinker LF, et al: Overweight, obesity, and postmenopausal
invasive breast cancer risk: A secondary analysis of the women's
health initiative randomized clinical trials. JAMA Oncol.
1:611–621. 2015. View Article : Google Scholar : PubMed/NCBI
|
|
26
|
Chlebowski RT, Wactawski-Wende J,
Ritenbaugh C, Hubbell FA, Ascensao J, Rodabough RJ, Rosenberg CA,
Taylor VM, Harris R, Chen C, et al: Estrogen plus progestin and
colorectal cancer in postmenopausal women. N Engl J Med.
350:991–1004. 2004. View Article : Google Scholar : PubMed/NCBI
|
|
27
|
Rossouw JE, Anderson GL, Prentice RL,
LaCroix AZ, Kooperberg C, Stefanick ML, Jackson RD, Beresford SA,
Howard BV, Johnson KC, et al: Risks and benefits of estrogen plus
progestin in healthy postmenopausal women: Principal results from
the women's health initiative randomized controlled trial. JAMA.
288:321–333. 2002. View Article : Google Scholar : PubMed/NCBI
|
|
28
|
Paruthiyil S, Parmar H, Kerekatte V, Cunha
GR, Firestone GL and Leitman DC: Estrogen receptor beta inhibits
human breast cancer cell proliferation and tumor formation by
causing a G2 cell cycle arrest. Cancer Res. 64:423–428. 2004.
View Article : Google Scholar : PubMed/NCBI
|
|
29
|
Li YH, Wang C, Meng K, Chen LB and Zhou
XJ: Influence of survivin and caspase-3 on cell apoptosis and
prognosis in gastric carcinoma. World J Gastroenterol.
10:1984–1988. 2004. View Article : Google Scholar : PubMed/NCBI
|
|
30
|
Hendrickse CW, Jones CE, Donovan IA,
Neoptolemos JP and Baker PR: Oestrogen and progesterone receptors
in colorectal cancer and human colonic cancer cell lines. Br J
Surg. 80:636–640. 1993. View Article : Google Scholar : PubMed/NCBI
|
|
31
|
Fox EM, Davis RJ and Shupnik MA: ERbeta in
breast cancer-onlooker, passive player, or active protector?
Steroids. 73:1039–1051. 2008. View Article : Google Scholar : PubMed/NCBI
|
|
32
|
Miller WR, Anderson TJ, Dixon JM and
Saunders PT: Oestrogen receptor beta and neoadjuvant therapy with
tamoxifen: Prediction of response and effects of treatment. Br J
Cancer. 94:1333–1338. 2006. View Article : Google Scholar : PubMed/NCBI
|
|
33
|
Rivera-Guevara C and Camacho J: Tamoxifen
and its new derivatives in cancer research. Recent Pat Anticancer
Drug Discov. 6:237–245. 2011. View Article : Google Scholar : PubMed/NCBI
|
|
34
|
Garrido JM, Manuela E, Garrido PJ,
Oliveira-Brett AM and Borges F: An electrochemical outlook on
tamoxifen biotransformation: Current and future prospects. Curr
Drug Metab. 12:372–382. 2011. View Article : Google Scholar : PubMed/NCBI
|
|
35
|
Krishnan K, Campbell S, Abdel-Rahman F,
Whaley S and Stone WL: Cancer chemoprevention drug targets. Curr
Drug Targets. 4:45–54. 2003. View Article : Google Scholar : PubMed/NCBI
|
|
36
|
Hou YF, Yuan ST, Li HC, Wu J, Lu JS, Liu
G, Lu LJ, Shen ZZ, Ding J and Shao ZM: ERbeta exerts multiple
stimulative effects on human breast carcinoma cells. Oncogene.
23:5799–5806. 2004. View Article : Google Scholar : PubMed/NCBI
|
|
37
|
Onozato W, Yamashita K, Yamashita K, Kuba
T, Katoh H, Nakamura T, Sato T, Ihara A, Okayasu I and Watanabe M:
Genetic alterations of K-ras may reflect prognosis in stage III
colon cancer patients below 60 years of age. J Surg Oncol.
103:25–33. 2011. View Article : Google Scholar : PubMed/NCBI
|
|
38
|
Sharrard RM, Royds JA, Rogers S and
Shorthouse AJ: Patterns of methylation of the c-myc gene in human
colorectal cancer progression. Br J Cancer. 65:667–672. 1992.
View Article : Google Scholar : PubMed/NCBI
|
|
39
|
Sun N, Meng Q and Tian A: Expressions of
the anti-apoptotic genes Bag-1 and Bcl-2 in colon cancer and their
relationship. Am J Surg. 200:341–345. 2010. View Article : Google Scholar : PubMed/NCBI
|
|
40
|
Roger L, Jullien L, Gire V and Roux P:
Gain of oncogenic function of p53 mutants regulates E-cadherin
expression uncoupled from cell invasion in colon cancer cells. J
Cell Sci. 123:1295–1305. 2010. View Article : Google Scholar : PubMed/NCBI
|
|
41
|
Wang XH, Fu ZX, Zhao Y, Shen W, Wu X and
Wang C: Survivin: An overexpression protein with notable cellular
localization and multiple roles in colon cancer. Chinese-German J
Clin Oncol. 9:519–523. 2010. View Article : Google Scholar
|
|
42
|
Garg H, Suri P, Gupta JC, Talwar GP and
Dubey S: Survivin: A unique target for tumor therapy. Cancer Cell
Int. 16:492016. View Article : Google Scholar : PubMed/NCBI
|
|
43
|
Scantlebury JB, Luo J, Thorstad WL,
El-Mofty SK and Lewis JS Jr: Cyclin D1-a prognostic marker in
oropharyngeal squamous cell carcinoma that is tightly associated
with high-risk human papillomavirus status. Hum Pathol.
44:1672–1680. 2013. View Article : Google Scholar : PubMed/NCBI
|
|
44
|
El-Hafez AA, El Aaty Shawky A and Hasan B:
Cyclin D1 overexpression associates with favourable prognostic
factors in invasive breast carcinoma. Cancer Biomark. 12:149–154.
2012. View Article : Google Scholar : PubMed/NCBI
|
|
45
|
Zhang GJ, Kimijima I, Onda M, Kanno M,
Sato H, Watanabe T, Tsuchiya A, Abe R and Takenoshita S:
Tamoxifen-induced apoptosis in breast cancer cells relates to
down-regulation of bcl-2, but not bax and bcl-X(L), without
alteration of p53 protein levels. Clin Cancer Res. 5:2971–2977.
1999.PubMed/NCBI
|
|
46
|
Lin LJ, Zheng CQ, Jin Y, Ma Y, Jiang WG
and Ma T: Expression of survivin protein in human colorectal
carcinogenesis. World J Gastroenterol. 9:974–977. 2003. View Article : Google Scholar : PubMed/NCBI
|
|
47
|
Fang YJ, Lu ZH, Wang GQ, Pan ZZ, Zhou ZW,
Yun JP, Zhang MF and Wan DS: Elevated expressions of MMP7, TROP2,
and survivin are associated with survival, disease recurrence, and
liver metastasis of colon cancer. Int J Colorectal Dis. 24:875–884.
2009. View Article : Google Scholar : PubMed/NCBI
|
|
48
|
He Q, Liang CH and Lippard SJ: Steroid
hormones induce HMG1 overexpression and sensitize breast cancer
cells to cisplatin and carboplatin. Proc Natl Acad Sci USA.
97:5768–5772. 2000; View Article : Google Scholar : PubMed/NCBI
|
|
49
|
Hwang TS, Han HS, Hong YC, Lee HJ and Paik
NS: Prognostic value of combined analysis of cyclin D1 and estrogen
receptor status in breast cancer patients. Pathol Int. 53:74–80.
2003. View Article : Google Scholar : PubMed/NCBI
|
|
50
|
Kdroxenidou L, Ohlson LC and
Porsch-Hällström I: Long-term 17 a1pha-ethinyl estradiol treatment
decreses cyclin E and cdlc2 expression, reduces cdk2 kinase
activity and inhibits S phase entry in regenerating rat liver. J
Hepatol. 43:478–484. 2005. View Article : Google Scholar : PubMed/NCBI
|


