Introduction
Glaucoma is a lifelong-progressive irreversible
blinding disease characterized by optic nerve damage and visual
field defects. The World Health Organization listed it as the
world's second most important cause of blindness, with 67 million
people suffering from glaucoma worldwide (1). Binocular blindness caused by glaucoma
accounts for ~50% of the total number of the blind people, and ≥50%
of patients with glaucoma are not diagnosed. The global prevalence
is expected to reach 79.6 million people in 2020 (2).
The pathogenic factors that cause glaucoma vary, but
only high intraocular pressure (IOP) is currently accepted as a
main pathogenic factor (3). High
IOP leads to a progressive and irreversible loss of retinal
ganglion cells (RGCs), predominantly through two paths: i) Ischemia
and hypoxia of the optic papilla and retina organization caused by
a dramatically increasing IOP; and ii) retina ischemia-reperfusion
injury occurring in the process of a rapid IOP decrease. Retina
ischemia-reperfusion injury leads to degenerative damage of nerve
cells caused by active inflammatory cells after a long history of
ischemia and reperfusion of the retina (4).
Because of the unique structure and sieve axoplasmic
transport and the theory stating that the cytoskeleton is involved
in the structure and function of RGCs, optic nerve regeneration,
and axoplasmic transport (5), the
association between blood supply, IOP and the function of glial
cells has not been widely investigated. Indeed, the optic fibers in
the retina have no myelin, but when these unmyelinated nerve fibers
come through the sieve plate, they are immediately wrapped by a
myelin sheath to become myelinated nerve fibers. However, the role
of the myelination of nerve fibers in glaucoma is still poorly
understood.
Therefore, the current study used a rabbit model of
ocular hypertension to simulate the pathological changes of acute
glaucoma, understand the pathological changes in the different
areas of the eye, to observe the characteristics of cell injury of
the various layers of the retina and to understand the
relationships between them. The results of this study may clarify
the pathogenesis of glaucoma and provide theoretical evidence for
novel preventive approaches and treatments of glaucoma.
Materials and methods
Animals
Healthy adult male New Zealand white rabbits (n=18)
weighing 1,800–2,300 g were obtained from Yingen Rabbit Warren
(Shanghai, China) and housed in specific pathogen-free conditions.
Rabbits were maintained in a 12 h light/dark cycle environment with
free access to food and water, temperature at 23±2°C, and humidity
at 60–70%. They were randomized to the hemodynamic group (n=12;
which was used to determine the optimal high IOP for the subsequent
experiments) and the hypertension group (n=6; 70 mmHg hypertension
induced in one eye). The animals were treated in accordance with
the Association for Research in Vision and Ophthalmology Statement
for the Use of Animals in Ophthalmic and Vision Research (6) and the guidelines of the Committee on
Animal Research of Fudan University (Shanghai, China). This study
was approved by the ethics committee of Eye & ENT Hospital of
Fudan University.
Surgical procedures and model
establishment
The rabbits were anesthetized with ketamine (50
mg/kg) and ILIUM XYLAZIL-100 (10 mg/kg). The rabbits were fixed on
a frame with the right eye up. Two 25-gauge cannulae were inserted
in the anterior chamber of the right eye. One cannula was connected
to a pressure transducer (channel-1, PT1) and the other to a
variable-pressure infusion of 0.9% NaCl solution to monitor and
adjust IOP. For the hemodynamic group, images were captured of the
central retinal artery using a single-lens reflex camera connected
to a surgical microscope. Color Doppler ultrasound was used to
measure the ocular artery peak systolic velocity (PSV) and
resistance index (RI) under different intraocular pressures (by
increments of 10 mmHg from 20–120 mmHg). For the hypertension
group, the right eyes were used as the experimental eye and the
left eyes were used as controls. Based on the initial experiments,
an IOP of 70 mmHg steadily maintained for 90 min was used in this
group, with a reperfusion of 2 days. All rabbits were finally
sacrificed with an anesthetic overdose. The eyes were immediately
enucleated and stored in 10% formalin overnight at 4°C for 24–48 h.
The eyes were cut along the equator. The posterior section was
embedded in paraffin.
Immunohistochemistry (IHC) of myelin
basic protein (MBP)
The six pairs of control and experimental eyes were
sectioned (4 µm) and the sections were flat-mounted on
poly-L-lysine-coated slides. The sections were dewaxed and blocked
with 5% goat serum (G9023; Sigma-Aldrich; Merck KGaA, Darmstadt,
Germany) diluted 1:20 in PBS, at room temperature for 20 min, then
exposed to mouse monoclonal anti-MBP (1:500; cat. no. ab24567;
Abcam, Cambridge, MA, USA) prepared in PBS (0.1 M, pH 7.4) for 1.5
h at 37°C. All specimens were subsequently given three washes over
15 min in a 4°C PBS wash solution. Slides were then incubated at
room temperature with the secondary antibody: Supervision
Anti-Mouse Detection Reagent (undiluted; cat. no. D-3001; Kangwei
Biotechnology, Co., Ltd., Beijing, China), for 30 min. Specimens
were washed three times over 15 min in a 4°C PBS wash solution and
the staining was revealed using 0.05% diaminobenzidine at room
temperature for 30 sec. Slides were subsequently mounted in neutral
resin.
Myelin and retina were observed with an optical
microscope at magnifications of ×10 20, and 40. Images were
captured with strictly controlled parameters. Images were analyzed
using the Q500IW image analysis software (Leica Microsystems GmbH,
Wetzlar, Germany). Images were transformed into black-and-white
images. The light intensity was set to a range of 0–100; full
penetration of the light was given a value of 100, whereas full
light obstruction was given a value of 0. The difference in light
intensity between background and myelin was regarded as an indirect
representation of the MBP content.
Terminal deoxynucleotidyl transferase
biotin-dUTP nick end labeling (TUNEL) staining of retinal
sections
Sections were stained using a TUNEL assay
(TdT-FragEL DNA Fragmentation Detection Kit, Merck KGaA) (5) and counterstained with 3% methyl green
at room temperature for 5 min. Apoptotic cells were observed with a
light microscope at a magnification of ×20. Apoptotic cells were
counted in three random fields.
Scanning electron microscopy
(SEM)
One piece of retinal tissue (1×5 mm) from the
myelinated areas, unmyelinated area and macula were extracted, and
ultra-thin sections cut (2 µm). Following staining with 1%
toluidine blue (preheated at 60°C) at room temperature for 20 min,
sections were observed by SEM to observe the retinal
ultrastructure.
Statistical analysis
SAS 8.2 (SAS Institute, Inc., Cary, NY, USA) was
used for data analysis. Continuous data are expressed as the mean ±
standard deviation. The homogeneity of variance was tested. Groups
were compared using analysis of variance with the
Student-Newman-Keuls post hoc test. Two-sided P<0.05 was
considered to indicate a statistically significant difference.
Results
Determination of optimal high IOP of
the hypertension model
The baseline IOP in the hypertension group was 7–14
mmHg. Rising to the 70-mmHg target required <30 sec, limiting
the variations in IOP. The IOP was maintained stable at 70.2±1.0
mmHg for 90 min.
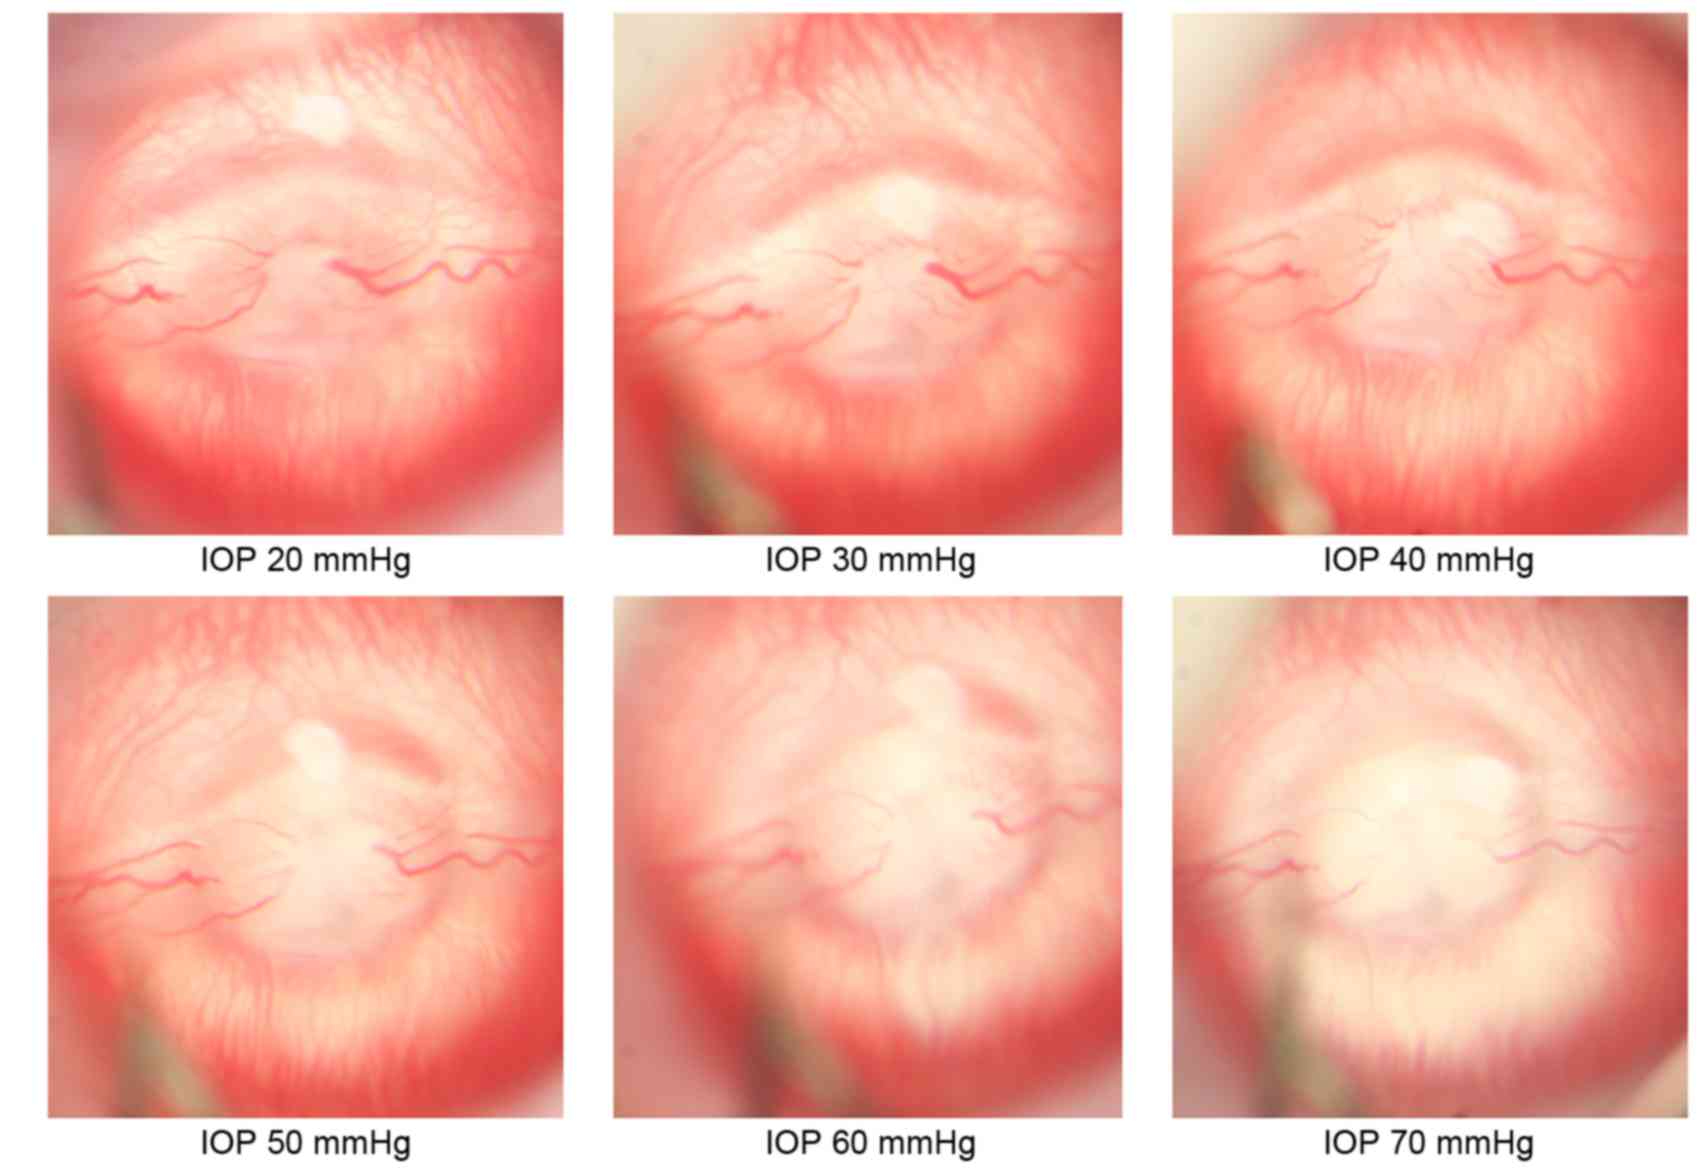
High IOP leads to retina ischemia
With the increase of IOP, a tapering of the diameter
of the central retinal artery and vein supplying the myelinated
nerve fibers was observed. The flow rate slowed down and the flow
decreased, while choroidal vessels supplying the unmyelinated nerve
fibers were closed. The optic papilla and the posterior pole retina
became gradually plain, vessels became stiffer and vascular walls
became thinner. When the intraocular pressure reached 70 mmHg,
tissue ischemia was observed although a weak retinal vascular blood
supply at the optic papilla with fan-shaped capillary zone in the
peripheral choroid was still visible (Fig. 1).
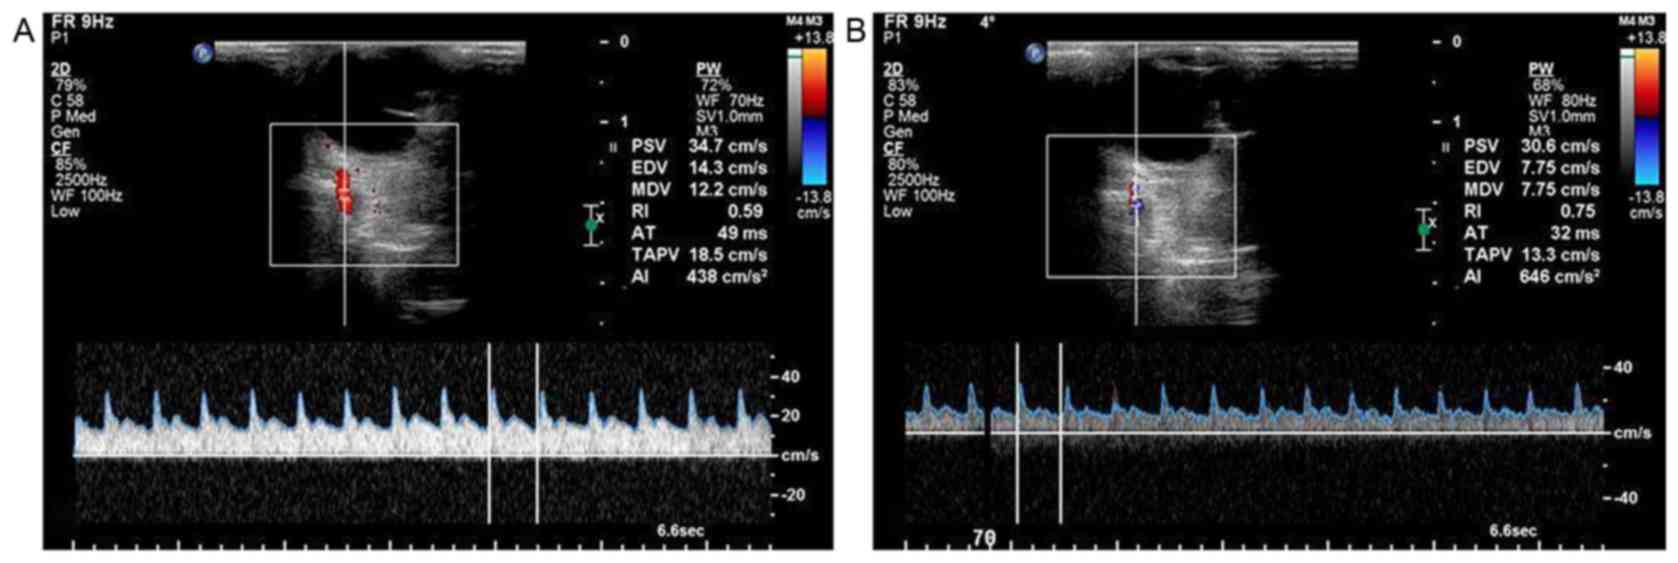
High IOP leads to decreased retina
blood flow
Doppler ultrasound indicated that the retina was of
moderate density, covered with many choroidal capillaries. The
ophthalmic artery blood flow was fast, the artery had a thick
diameter, and it displayed the characteristic sharp-angle waveform
and a unique notch in the descending phase (Fig. 2).
With the increase of IOP, the number of opened
capillaries decreased gradually. When the IOP reached 70 mmHg,
there was no detectable flow on the retinal surface. In addition,
ocular artery PSV decreased and RI increased gradually with
increasing IOP. When IOP reached 70 mmHg, RI reached a peak but PSV
was significantly decreased. There were significant differences
between PSV at 20 and 70 mmHg, and RI between 20 and 70 mmHg (data
not show). Therefore, 70 mmHg was considered to be the threshold
value for IOP in the acute ocular hypertension group.
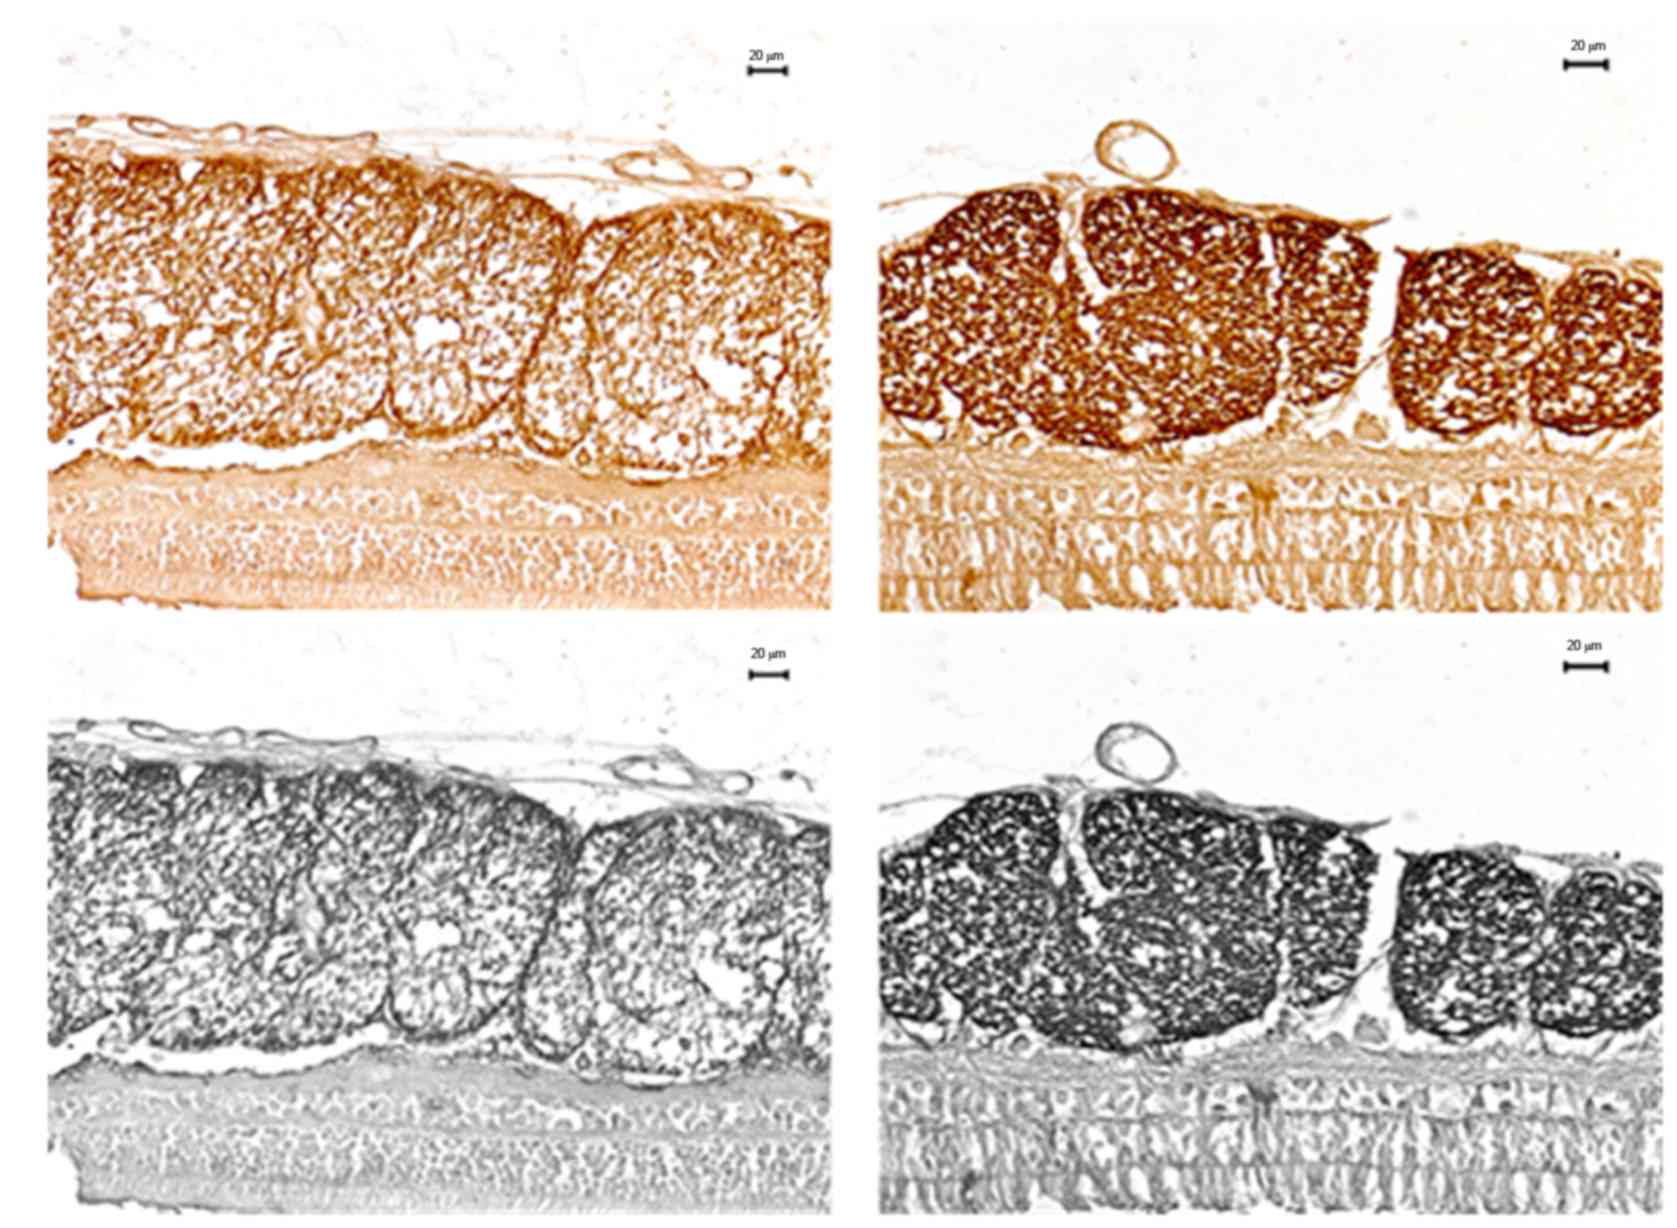
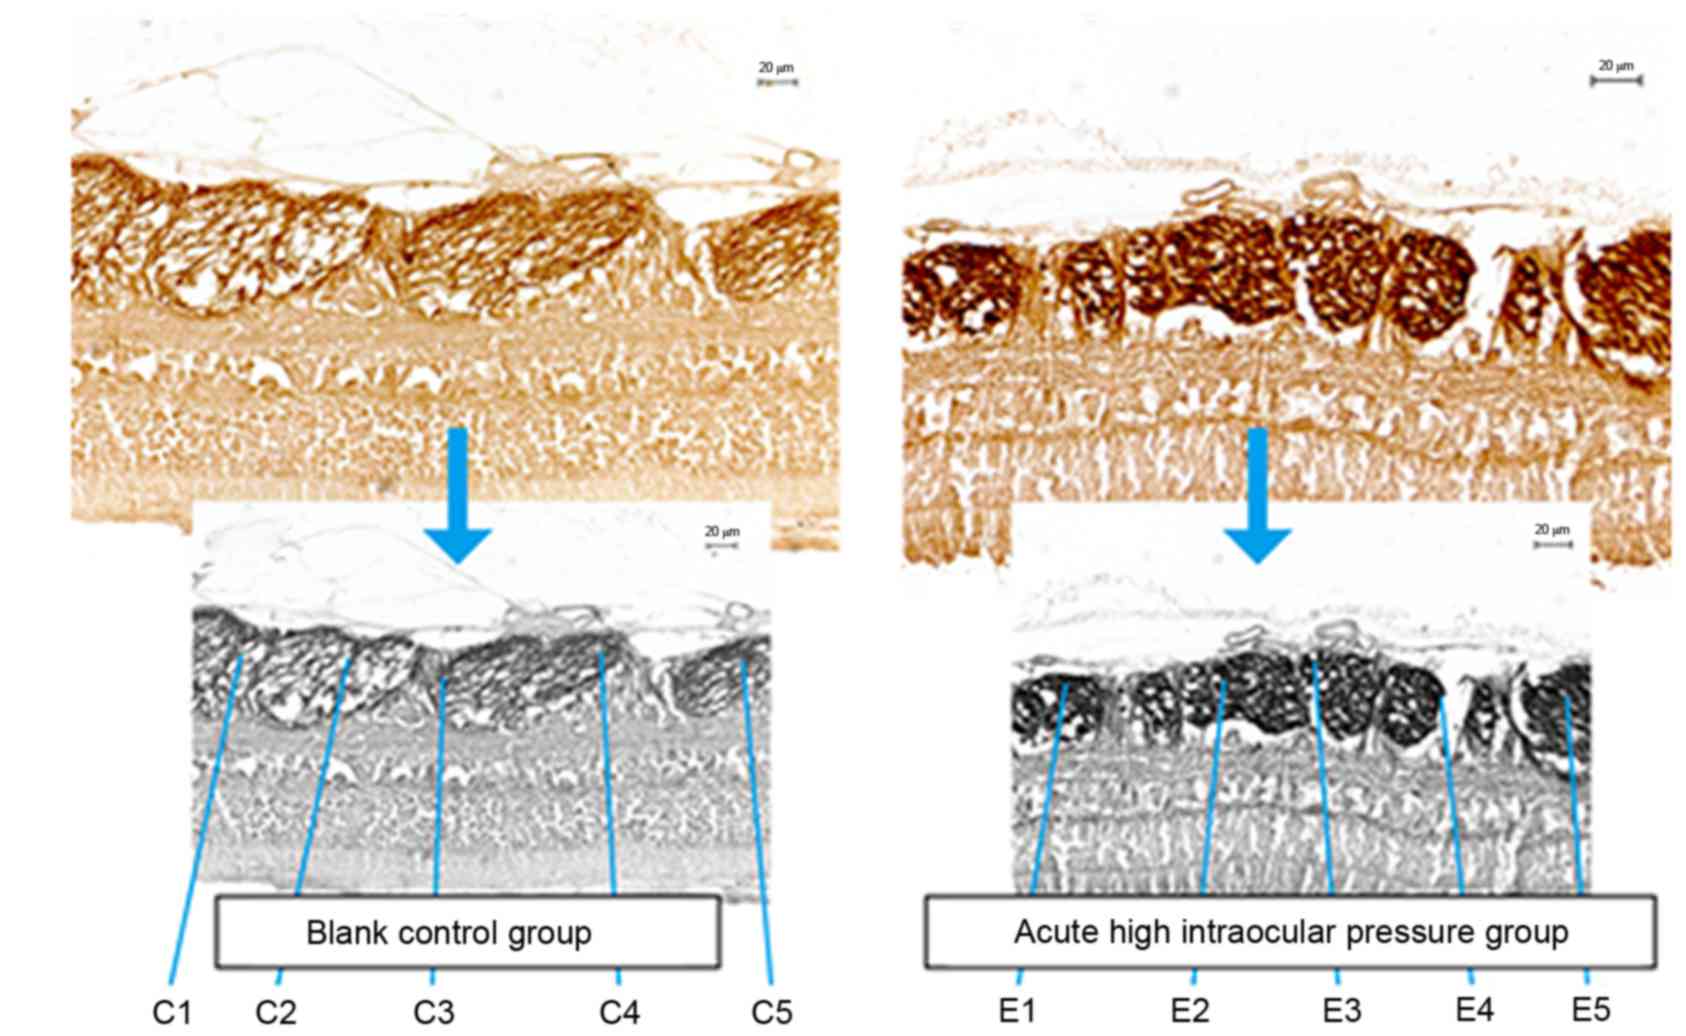
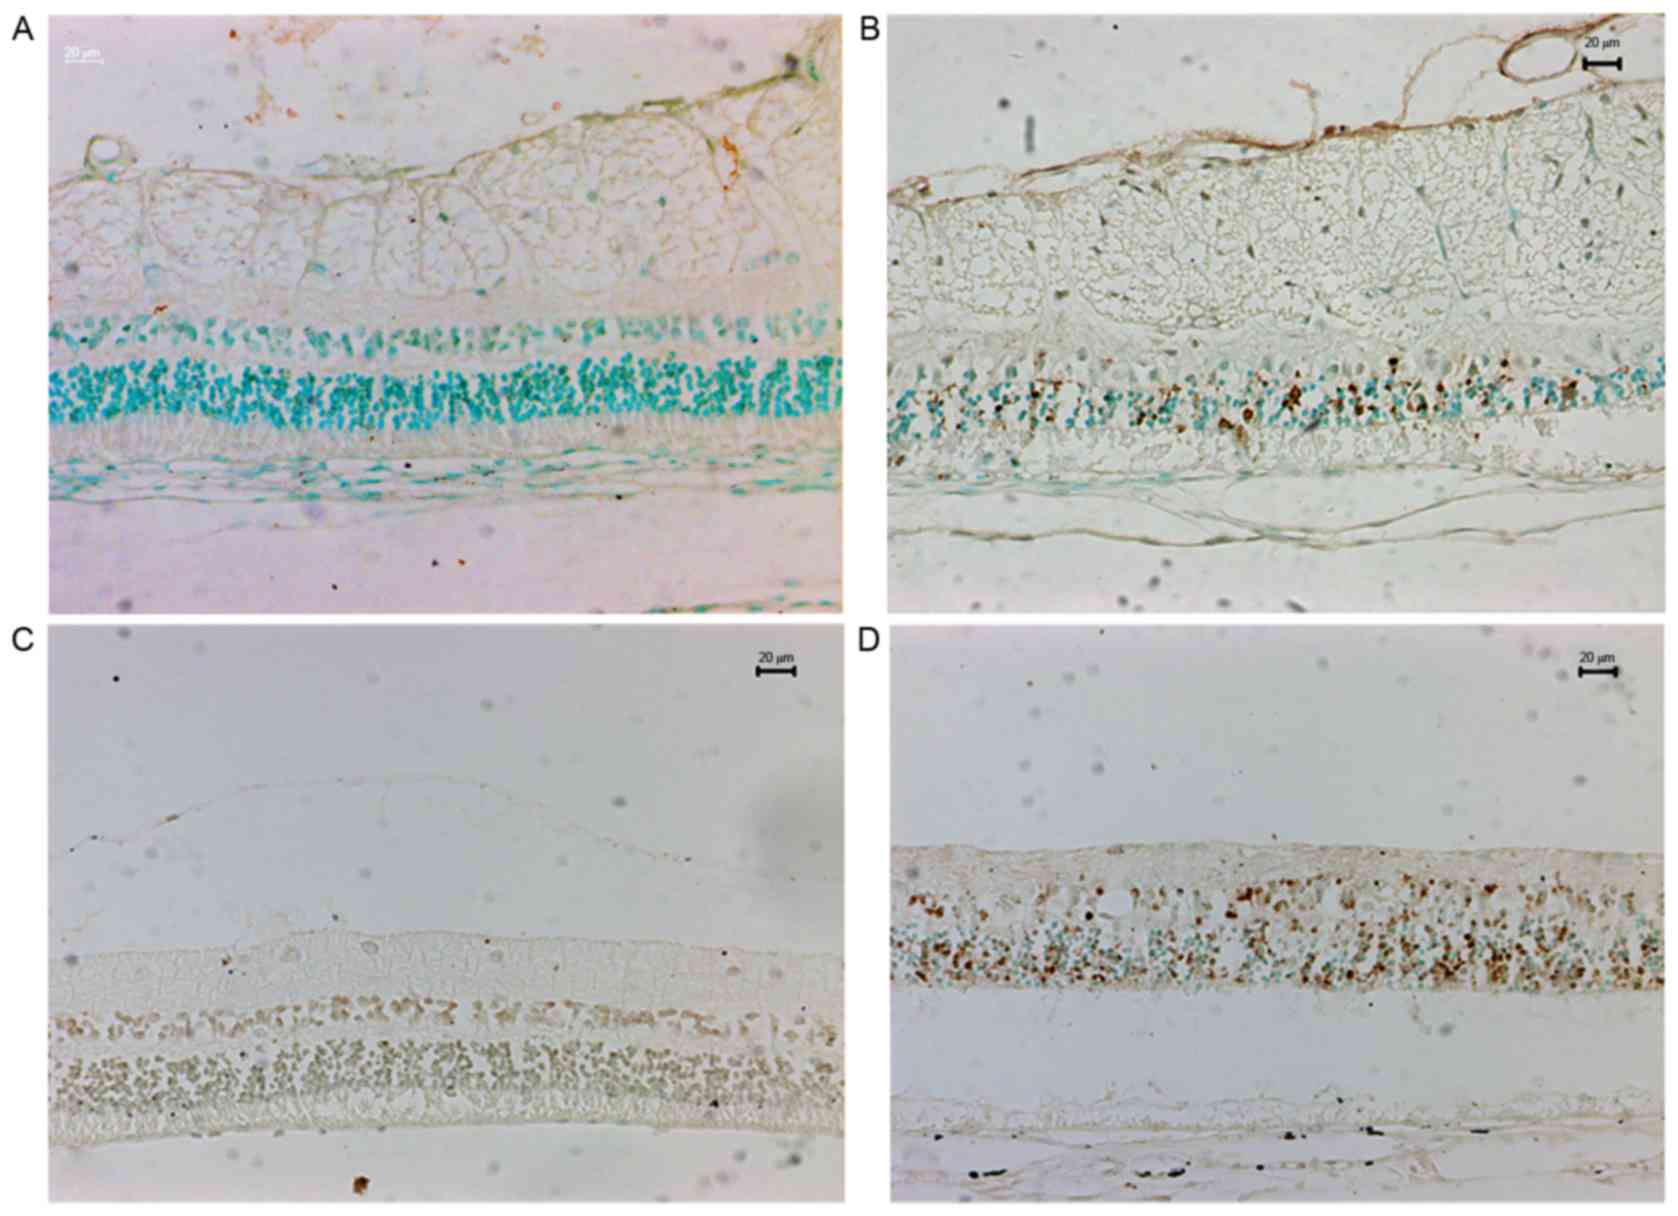
High IOP increases MBP expression
The myelin tissue in the experimental eyes was
stained dark brown and ordered in a fascicular manner, but the
structure between fiber bundles was slightly loose, even cracked.
The retinal tissue below was lightly stained, similar to the
background, and had some differences compared with the myelin
tissue. On the other hand, in control eyes, they were both lightly
stained, almost the same as the background color. There were
differences in light transmittance between the two groups of eyes
(Fig. 3).
Two sets of MBP-stained sections were images at ×20
and five fields were randomly selected in each image to determine
the content of MBP (Fig. 4). The
MBP expression level was higher in the high IOP eyes compared with
control eyes (77±9% vs. 65±9%; P<0.001; Table I).
 | Table I.Differences in myelin basic protein
staining density between the experimental and control eyes. |
Table I.
Differences in myelin basic protein
staining density between the experimental and control eyes.
| A, Experimental
eyes |
|---|
|
|---|
|
| Light
transmittance |
|---|
|
|
|
|---|
| Field | Rabbit 1 | Rabbit 2 | Rabbit 3 | Rabbit 4 | Rabbit 5 | Rabbit 6 |
|---|
| 1 | 71.0843 | 91.0000 | 65.3846 | 92.0000 | 78.0000 | 71.2500 |
| 2 | 75.9036 | 83.0000 | 62.0253 | 93.0000 | 77.0000 | 70.0000 |
| 3 | 81.1765 | 85.0000 | 65.8228 | 93.0000 | 78.0000 | 67.5000 |
| 4 | 73.2558 | 82.0000 | 60.0000 | 88.0000 | 86.0000 | 77.5000 |
| 5 | 75.5814 | 85.0000 | 62.5000 | 78.0000 | 78.0000 | 72.5000 |
|
| B, Control eyes |
|
|
| Light
transmittance |
|
|
|
| Field | Rabbit 1 | Rabbit 2 | Rabbit 3 | Rabbit 4 | Rabbit 5 | Rabbit 6 |
|
| 1 | 67.0455 | 78.0000 | 41.9753 | 73.0000 | 58.0000 | 59.2593 |
| 2 | 67.7778 | 74.0000 | 56.6265 | 69.0000 | 57.0000 | 56.7901 |
| 3 | 66.6667 | 74.0000 | 59.0361 | 79.0000 | 63.0000 | 56.0976 |
| 4 | 69.6629 | 75.0000 | 56.6265 | 80.0000 | 64.0000 | 54.8780 |
| 5 | 67.4157 | 68.0000 | 60.9756 | 75.0000 | 65.0000 | 51.2195 |
High IOP led to increased retinal
apoptosis
Fig. 5 presents
representative TUNEL staining and Table II presents the related
quantitative data. The apoptotic index of each cell layer of the
high IOP eyes was higher than in the corresponding cell layer of
the control group. In the high IOP eyes, the apoptotic index of
each layer in the unmyelinated area was higher than in the
myelinated area. These results were further analyzed using a
factorial analysis of three repeated measurements (Table III). There was a difference in
the cell apoptosis index in the different areas (P=0.003) and the
difference was influenced by the groups. In the control group, the
apoptosis rates of the myelinated and unmyelinated cells were
similar. In the high IOP group, the cell apoptosis rate of the two
areas was significantly different (P<0.0001), suggesting that
the unmyelinated area was more easily injured than the myelinated
area.
| Table II.Cell apoptosis index of different
layers in the experimental and control eyes. |
Table II.
Cell apoptosis index of different
layers in the experimental and control eyes.
| A,
Unmyelinated |
|---|
|
|---|
|
| Apoptosis
index |
|---|
|
|
|
|---|
| Cell layer | Mean | SD | Min | Max |
|---|
| Control |
|
|
|
|
|
RGC | 0.0278 | 0.0280 | 0.0000 | 0.2667 |
|
Bipolar | 0.0179 | 0.0207 | 0.0000 | 0.0425 |
|
Photoreceptor | 0.0042 | 0.0049 | 0.0000 | 0.0124 |
| Experimental |
|
|
|
|
|
RGC | 0.7097 | 0.2064 | 0.4286 | 1.0000 |
|
Bipolar | 0.5851 | 0.1530 | 0.4450 | 0.8508 |
|
Photoreceptor | 0.4238 | 0.1647 | 0.1864 | 0.6636 |
|
| B, Myelinated |
|
| Apoptosis
index |
|
|
|
| Cell layer | Mean | SD | Min | Max |
|
| Control |
|
|
|
|
|
RGC | 0.0278 | 0.0280 | 0.0000 | 0.1667 |
|
Bipolar | 0.0060 | 0.0056 | 0.0000 | 0.0221 |
|
Photoreceptor | 0.0052 | 0.0127 | 0.0000 | 0.0311 |
| Experimental |
|
|
|
|
|
RGC | 0.3306 | 0.1887 | 0.0000 | 0.5000 |
|
Bipolar | 0.3184 | 0.0795 | 0.2008 | 0.4243 |
|
Photoreceptor | 0.3054 | 0.2195 | 0.0513 | 0.6585 |
| Table III.Factorial analysis of injury severity
for retinal ischemia reperfusion of myelinated and unmyelinated
areas. |
Table III.
Factorial analysis of injury severity
for retinal ischemia reperfusion of myelinated and unmyelinated
areas.
| Times | Source | DF | Type III SS | Mean square | F | P-value |
|---|
| 1 | Group | 1 | 3.3389 | 3.3389 | 101.78 | <0.0001 |
| 2 | Position | 1 | 0.3005 | 0.3005 | 15.27 | 0.0029 |
|
| Position*group | 1 | 0.2838 | 0.2838 | 14.42 | 0.0035 |
| 3 | Cell | 2 | 0.0958 | 0.0479 | 2.85 | 0.0815 |
|
| Cell*group | 2 | 0.0534 | 0.0267 | 1.59 | 0.2291 |
| 4 | Position*cell | 2 | 0.0523 | 0.0261 | 4.97 | 0.0177 |
|
|
Position*cell*group | 2 | 0.0506 | 0.0253 | 4.82 | 0.0196 |
In addition, the cell apoptosis index among the
three types of cells was also significantly different (P=0.018) and
the difference was associated with the positions. Indeed, there
were differences in the apoptosis rate of ganglion cells between
the myelinated and unmyelinated areas. The apoptosis rate of the
ganglion cells in unmyelinated area was higher than in myelinated
area. This indicated that myelin has positive effects on ganglion
cells apoptosis.
A factorial analysis was performed for these three
types of cells (Table IV). The
injuries to ganglion and bipolar cell in the unmyelinated area were
more severe than in the myelinated area, and the apoptosis index
was also significantly different (P=0.04, RGC; P=0.02, bipolar
cells), but there were no difference in apoptosis rate of
photoreceptor cells between the unmyelinated and myelinated
area.
| Table IV.Factorial analysis of injury severity
and related factors of different retinal cells. |
Table IV.
Factorial analysis of injury severity
and related factors of different retinal cells.
| Source | DF | Type III SS | Mean square | F | P-value |
|---|
| Ganglion cells |
|
|
|
|
|
|
Position | 1 | 0.2157 | 0.2157 | 5.32 | 0.0415 |
|
Group | 1 | 1.4545 | 1.4545 | 35.89 | <0.0001 |
| ID
(position) | 10 | 0.2072 | 0.0207 | 0.51 | 0.8498 |
| Bipolar cells |
|
|
|
|
|
|
Position | 1 | 0.1165 | 0.1165 | 7.40 | 0.0199 |
|
Group | 1 | 1.1606 | 1.1606 | 73.76 | <0.0001 |
| ID
(position) | 10 | 0.0756 | 0.0076 | 0.48 | 0.8708 |
| Photoreceptors |
|
|
|
|
|
|
Position | 1 | 0.0207 | 0.0207 | 1.09 | 0.3195 |
|
Group | 1 | 0.7772 | 0.7772 | 40.80 | <0.0001 |
| ID
(position) | 10 | 0.1894 | 0.0189 | 0.99 | 0.4996 |
| Overall |
|
|
|
|
|
|
Position | 1 | 0.3005 | 0.3005 | 4.23 | 0.0438 |
|
Cell | 2 | 0.0958 | 0.0479 | 0.67 | 0.5133 |
|
Position*cell | 2 | 0.0523 | 0.0261 | 0.37 | 0.6938 |
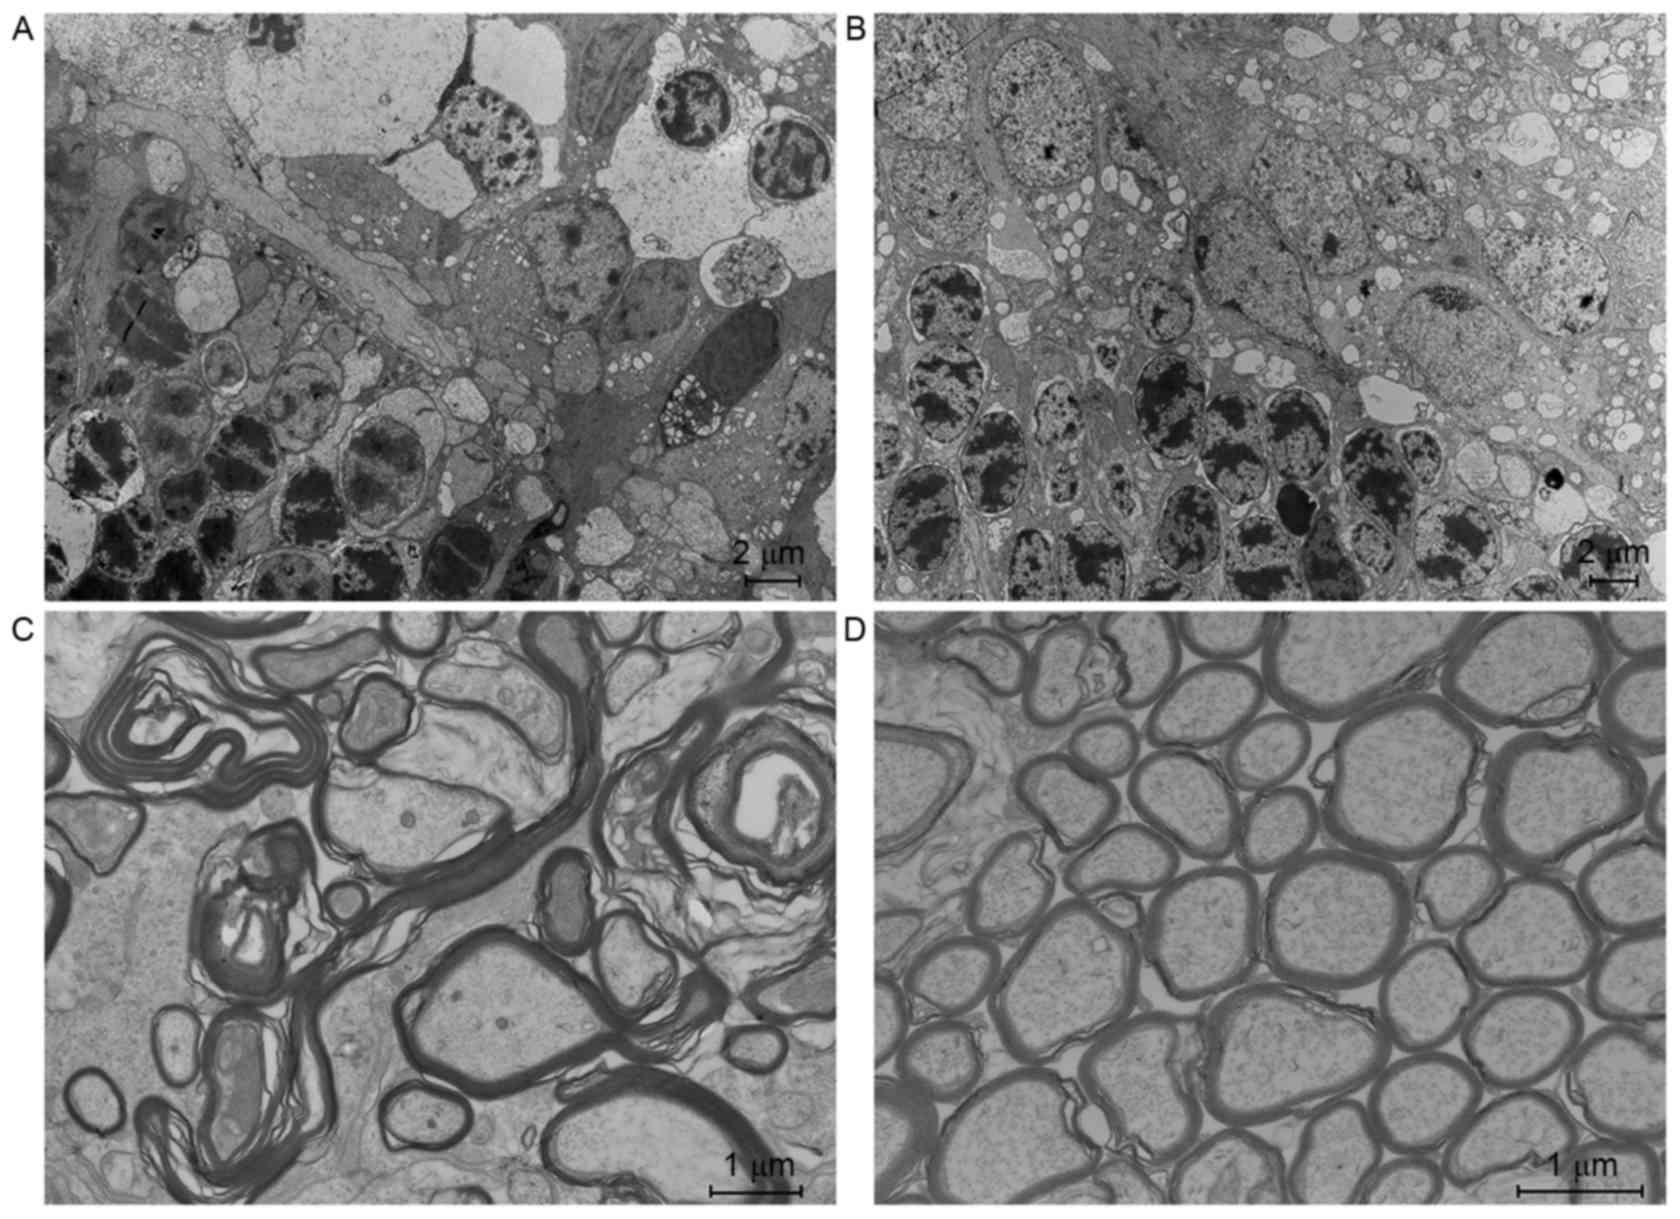
High IOP changes the retinal
ultrastructure
The ultrastructure of each layer of the experimental
eyes with high IOP was injured to some extent (Fig. 6). A part of the axon was markedly
swollen, forming a lacuna between the axon membrane and myelin
sheath, with several cracks. Axoplasmic electron density was
decreased and showed granular degeneration. The amounts of
microtubules and microfilaments were reduced. Mitochondria were
swollen and their membrane bilayer structure was unclear. Some
cristae had disappeared and there was vacuolar degeneration. There
were many mitochondrial vacuoles located in the lateral side of the
ganglion cells. Bipolar cells exhibited edema, some with nucleus
pyknosis and chromosome breakage. The appearance of photoreceptor
cells of the outer nucleus layer was the same as bipolar cells
(Fig. 6A). By contrast, in the
control group, the ultrastructure of each layer was normal
(Fig. 6B).
The structure of each layer of the myelinated area
(Fig. 6C and D) was injured to a
lesser extent than the unmyelinated area (Fig. 6A and B). Though bipolar cells and
photoreceptors had lots of swelling and mitochondrial
vacuolization, there were fewer signs of apoptosis such as nucleus
pyknosis and chromosome breakage. By contrast, the injury of each
layer of the unmyelinated area was more serious.
Discussion
The pathophysiological processes that cause glaucoma
remain poorly defined. Thus, the current study aimed to evaluate
the changes of myelinated and unmyelinated nerve fibers in retinal
ischemia-reperfusion injuries caused by acute ocular hypertension
and to determine the sequence of these changes. Doppler ultrasound
showed an obviously decline of peak systolic velocity and an
increase of resistance index of retinal bloodstream under an IOP of
70 mmHg. MBP IHC and electron microscopy demonstrated obvious
injuries to the myelin fibers. TUNEL demonstrated a significantly
higher apoptosis rate in the hypertension eyes compared with
control eyes. The apoptosis rate of RGCs and bipolar cells in
unmyelinated regions was higher than in myelinated regions. Thus,
an IOP of 70 mmHg led to an incomplete retinal ischemia, but was
the threshold for retinal ischemia, leading to obvious injuries to
the myelin fibers.
The observation of the capillaries on the retinal
surface demonstrated that with increasing IOP more capillaries
closed, decreasing blood supply. Coincidentally, when IOP reached
70 mmHg, Doppler ultrasound was unable to show the capillaries on
the retinal surface, indicating retinal ischemia. Although it was
not complete ischemia, it was enough to injure the retinal tissue.
Early studies have demonstrated that the majority of patients with
glaucomatous optic neuropathy and anterior ischemic optic
neuropathy have retinal vascular autoregulation defects (7).
In addition to humans (8,9),
blood vessels of various other animals also undergo spontaneous
adjustment when the pressure changes (10,11).
The central area of the optic papilla is the region across the
intraocular papilla. When IOP reaches 40 mmHg, the blood flow is
significantly reduced, and 40 mmHg was speculated to be the
threshold at which the central retinal artery can still
autoregulate. When the vessel passes through the optic papilla and
flows to the rim, the vascular autoregulation function is
strengthened, the compressive range is widened, and it was
necessary to increase IOP to 60–70 mmHg to reduce the blood flow in
the model of the present study.
The ciliary vascular system also has its own
regulatory functions (12). The
mean arterial pressure in rabbits is 70–75 mmHg (13). At this level, the IOP must be
increased to ~50 mmHg in order to cause the ciliary blood flow to
decrease (12). Similarly, the
level of central retinal artery autoregulation capacity threshold
is affected by the mean arterial pressure. Because the retinal
blood flow depends on the ocular perfusion pressure, and because
the ocular perfusion pressure is the difference of the mean
arterial pressure and IOP, the increase or decrease of mean
arterial pressure can directly affect the ocular perfusion pressure
level and the blood supply. When IOP is increased to 70 mmHg, the
ocular perfusion pressure is close to 0, while the vast majority of
retinal capillaries have no blood perfusion. In addition, because
eye perfusion pressure is proportional to the mean arterial
pressure and inversely proportional to the IOP, when the IOP is
increased the cribriform plate anterior perfusion pressure
decreases, but the screen plate perfusion pressure is not affected.
Therefore, a huge pressure differential exists before and after the
plate and is sufficient to threaten the blood flow and axoplasmic
transport (14).
MBP is a flexible polypeptide located in the compact
myelin and nucleus pulposus. Because of its specificity to
oligodendrocytes, it is often used as a marker of oligodendrocytes,
Schwann cells and Schwann cell tumors. Previous studies
demonstrated that MBP has an important role in the developmental
process of oligodendrocytes (15,16).
When the nerve tissue is subjected to ischemic injury or
degenerative changes, the MBP is activated, thereby increasing
synthesis and release, and its interstitial concentration rises
(17). Therefore, it is considered
an early specific indicator of disorders caused by exogenous
factors or autoimmune neurological degenerative disorders (18). This study showed that acute ocular
hypertension induced by ischemia reperfusion could lead to
impairment of the myelin structure. In addition, SEM confirmed
these damages.
The TUNEL cell apoptosis assay demonstrated that in
ischemia reperfusion injury induced by acute ocular hypertension,
the damage to unmyelinated nerve fibers was more severe than the
damage to myelinated nerve fibers. Myelin is a thick layer of
protective film, and it can provide direct mechanical protection
when exposed to high IOP. Additionally, rabbit eyes are similar to
those of humans and their visual center is located in the
unmyelinated area under the myelinated nerve fiber. Because the
myelinated area is wrapped in myelin, retinal cells in the
unmyelinated area apparently consume more oxygen and energy. Once
the blood supply decreases, its tolerance to ischemia and hypoxia
is correspondingly weaker (19).
The study of the rate of apoptosis for each layer
demonstrated that ganglion cells and bipolar cells both followed
the pattern of the apoptosis rate being higher in the unmyelinated
area compared with the myelinated area; however, the photoreceptor
cells did not exhibit the same pattern. Indeed, the photoreceptor
cells are located in the outer layer, which is farther from the
retinal vessels. The response of photoreceptor cells to the change
of blood supply is slower, and they are less affected by ischemia
reperfusion injuries (20). In
addition, photoreceptor cells are located close to the sieve plate
and an acutely elevated IOP can cause the sieve plate to sink,
slowing down or even stopping the axoplasmic transport speed
(21). On the other hand, ganglion
and bipolar cells are far from the sieve plate, and the baxoplasmic
transport distance is longer, making them more susceptible to
changes in IOP. The deficiency of neurotrophic factors reduces
their capacities of self-healing and resistance to ischemia,
thereby increasing cell injury and eventually leading to
irreversible cell apoptosis (19).
When the retina is injured, the myelin area can synthesize a series
of protective cytokines such as brain derived neurotrophic factor,
neurotrophin-3 and insulin-like growth factor-1 (22). These cytokines can diffuse into the
retina, increasing the resistance of cells to the injury, thus
helping them to recover. Nevertheless, due to the anatomical
structure, ganglion cells are certainly easier to be protected by
these factors.
The present study is not without limitations. Of
course, biases such as sample differences or sampling error and
other factors, cannot be rules out. Additional studies remain
necessary to address the complex question of the pathophysiology of
glaucoma.
In conclusion, when the IOP reaches 70 mmHg, the
rabbit retina is in a serious ischemic state and PSV drops, while
RI peaks. Acute ocular hypertension leads to damage to the optic
nerve myelin tissue and retinal cells of all layers, and the
content of MBP in myelin was increased. TUNEL demonstrated that all
layers of the retina had numerous apoptotic cells. Therefore, in
acute ocular hypertension in rabbits, the main function of myelin
may be to protect the optic nerve. This mechanism may be
association to various factors and more comprehensive studies are
required.
Acknowledgements
This work was supported by the National Natural
Science Foundation of China (grant no. 30772372), the National High
Technology Research and Development Program of China (863 Program)
(grant no. 2008AA02Z422), the Science and Technology Commission of
Shanghai (grant no. 14411960600) and the National Basic Research
Program of China (973 Program) (grant no. 2007CB512204).
Glossary
Abbreviations
Abbreviations:
|
IOP
|
intraocular pressure
|
|
MBP
|
myelin basic protein
|
|
RGCs
|
retinal ganglion cells
|
|
PSV
|
peak systolic velocity
|
|
RI
|
resistance index
|
|
IHC
|
immunohistochemistry
|
|
TUNEL
|
terminal deoxynucleotidyl transferase
biotin-dUTP nick end labeling
|
|
SEM
|
scanning electron microscopy
|
References
|
1
|
Quigley HA: Glaucoma. Lancet.
377:1367–1377. 2011. View Article : Google Scholar : PubMed/NCBI
|
|
2
|
Quigley HA and Broman AT: The number of
people with glaucoma worldwide in 2010 and 2020. Br J Ophthalmol.
90:262–267. 2006. View Article : Google Scholar : PubMed/NCBI
|
|
3
|
Bengtsson B, Leske MC, Hyman L and Heijl
A; Early Manifest Glaucoma Trial Group, : Fluctuation of
intraocular pressure and glaucoma progression in the early manifest
glaucoma trial. Ophthalmology. 114:205–209. 2007. View Article : Google Scholar : PubMed/NCBI
|
|
4
|
Osborne NN, Casson RJ, Wood JP, Chidlow G,
Graham M and Melena J: Retinal ischemia: Mechanisms of damage and
potential therapeutic strategies. Prog Retin Eye Res. 23:91–147.
2004. View Article : Google Scholar : PubMed/NCBI
|
|
5
|
Reichstein D, Ren L, Filippopoulos T,
Mittag T and Danias J: Apoptotic retinal ganglion cell death in the
DBA/2 mouse model of glaucoma. Exp Eye Res. 84:13–21. 2007.
View Article : Google Scholar : PubMed/NCBI
|
|
6
|
Romano PE: Association for research in
vision and ophthalmology. Binocul Vis Strabismus Q. 15:358–359.
2000.PubMed/NCBI
|
|
7
|
Flammer J and Mozaffarieh M:
Autoregulation, a balancing act between supply and demand. Can J
Ophthalmol. 43:317–321. 2008. View
Article : Google Scholar : PubMed/NCBI
|
|
8
|
Pillunat LE, Anderson DR, Knighton RW,
Joos KM and Feuer WJ: Autoregulation of human optic nerve head
circulation in response to increased intraocular pressure. Exp Eye
Res. 64:737–744. 1997. View Article : Google Scholar : PubMed/NCBI
|
|
9
|
Riva CE, Hero M, Titze P and Petrig B:
Autoregulation of human optic nerve head blood flow in response to
acute changes in ocular perfusion pressure. Graefes Arch Clin Exp
Ophthalmol. 235:618–626. 1997. View Article : Google Scholar : PubMed/NCBI
|
|
10
|
Blumenröder S, Augustin AJ and Koch FH:
The influence of intraocular pressure and systemic oxygen tension
on the intravascular pO2 of the pig retina as measured with
phosphorescence imaging. Surv Ophthalmol. 42 Suppl 1:S118–S126.
1997. View Article : Google Scholar : PubMed/NCBI
|
|
11
|
Bouzas EA, Donati G and Pournaras CJ:
Distribution and regulation of the optic nerve head tissue PO2.
Surv Ophthalmol. 42 Suppl 1:S27–S34. 1997. View Article : Google Scholar : PubMed/NCBI
|
|
12
|
Nauli SM, Jin X and Hierck BP: The
mechanosensory role of primary cilia in vascular hypertension. Int
J Vasc Med. 2011:3762812011.PubMed/NCBI
|
|
13
|
Selbach MJ, Wonka F, Höper J and Funk RH:
Effects of elevated intraocular pressure on haemoglobin oxygenation
in the rabbit optic nerve head: A microendoscopical study. Exp Eye
Res. 69:301–309. 1999. View Article : Google Scholar : PubMed/NCBI
|
|
14
|
Abbott CJ, Choe TE, Burgoyne CF, Cull G,
Wang L and Fortune B: Comparison of retinal nerve fiber layer
thickness in vivo and axonal transport after chronic intraocular
pressure elevation in young versus older rats. PLoS One.
9:e1145462014. View Article : Google Scholar : PubMed/NCBI
|
|
15
|
Galiano MR, Andrieux A, Deloulme JC, Bosc
C, Schweitzer A, Job D and Hallak ME: Myelin basic protein
functions as a microtubule stabilizing protein in differentiated
oligodendrocytes. J Neurosci Res. 84:534–541. 2006. View Article : Google Scholar : PubMed/NCBI
|
|
16
|
Badan I, Buchhold B, Hamm A, Gratz M,
Walker LC, Platt D, Kessler CH and Popa-Wagner A: Accelerated glial
reactivity to stroke in aged rats correlates with reduced
functional recovery. J Cereb Blood Flow Metab. 23:845–854. 2003.
View Article : Google Scholar : PubMed/NCBI
|
|
17
|
Diekmann H and Fischer D: Glaucoma and
optic nerve repair. Cell Tissue Res. 353:327–337. 2013. View Article : Google Scholar : PubMed/NCBI
|
|
18
|
Harauz G and Musse AA: A tale of two
citrullines-structural and functional aspects of myelin basic
protein deimination in health and disease. Neurochem Res.
32:137–158. 2007. View Article : Google Scholar : PubMed/NCBI
|
|
19
|
Guo WY, Cringle SJ, Su EN, Yu PK, Yu XB,
Sun X, Morgan W and Yu DY: Structure and function of myelinated
nerve fibers in the rabbit eye following ischemia/reperfusion
injury. Curr Neurovasc Res. 3:55–65. 2006. View Article : Google Scholar : PubMed/NCBI
|
|
20
|
Ju WK, Kim KY, Hofmann HD, Kim IB, Lee MY,
Oh SJ and Chun MH: Selective neuronal survival and upregulation of
PCNA in the rat inner retina following transient ischemia. J
Neuropathol Exp Neurol. 59:241–250. 2000. View Article : Google Scholar : PubMed/NCBI
|
|
21
|
Zhou J, Guo W, Fang Z, Yang Q, Wang Z and
Yu D: The change of the optic nerve axoplasmic transport under
different pressure state in acute high intraocular pressure model
of rabbit. Zhong Hua Yan Di Bing Za Zhi Bian Ji Bu. 27:454–457.
2011.(In Chinese).
|
|
22
|
Du Y and Dreyfus CF: Oligodendrocytes as
providers of growth factors. J Neurosci Res. 68:647–654. 2002.
View Article : Google Scholar : PubMed/NCBI
|