Introduction
Hypoxia appears in a number of extreme environments,
including high altitudes, the deep sea, and during aviation, and
occurs in numerous diseases, including cardiovascular and
respiratory failures, neurological disorders and cancer. Hypoxic
preconditioning (HPC), motivated by the repetitive exposure of
organisms, organs, tissues and cells to hypoxia is an intrinsic
cytoprotective strategy, existing widely in the heart, brain,
kidney, liver, intestine and other organs (1).
Previously, numerous studies have indicated that HPC
may protect an organism against hypoxic injury (2–5).
Additionally, the acute repetitive HPC mouse model has been widely
utilized to study animal behavior, endogenous metabolites,
metabolic pathways and intrinsic protective mechanisms under
hypoxic conditions (6,7). A previous study demonstrated that the
brain homogenates from preconditioned mice were able to strengthen
the tolerance to hypoxia and protect the animals from hypoxic
injury (8). Recent studies have
examined the potential biomarkers of HPC (9,10).
Cui et al (11) performed a
proteomic study to profile the patterns of protein expression in
HPC mouse brains. Although the protective effect of HPC is known,
the underlying mechanisms remain unclear, particularly at the
endogenous metabolite level.
Metabolomics is a top-down systemic biological
approach, whereby metabolic responses to physiological
interventions or environmental factors are analyzed and modeled
(12). Therefore, metabolomics
represents an excellent developing prospect for capturing
disease-specific metabolic signatures as putative biomarkers
(13). Metabolomics appears to be
a promising approach to identifying metabolite-based biomarkers and
revealing the underlying mechanism of neurodegenerative diseases
(14), cardiovascular disease
(15), and cancer (16). Recently, a study identified the
molecular alterations associated with HPC mouse brains using an
ultra-high performance liquid chromatography-coupled high
resolution mass spectrometry-based metabolomics approach (17). This strategy exemplified the
ability of metabolomics to identify endogenous biomarkers and
elucidate the protective mechanism of HPC.
In the present study, an acute repetitive HPC mouse
model was established, and the serum metabolites were profiled
using ultra-performance liquid chromatography-quadrupole
time-of-flight mass spectrometry (UPLC-QTOFMS), in conjunction with
univariate and multivariate data analyses. One of the purposes was
to identify the differential serum metabolites in HPC associated
with acute hypoxia and in normoxia controls. A further goal was to
elucidate the mechanisms through which organisms acclimatize to
hypoxia, in addition to the potential protective mechanism of HPC.
The present study revealed the important metabolites and metabolic
pathways in HPC and provided novel insights into the protective
mechanism of HPC.
Materials and methods
Chemicals and reagents
Formic acid was obtained from Fluka (Sigma-Aldrich;
Merck KGaA, Darmstadt, Germany). Acetone, ammonium formate, and
citrate were purchased from Sigma-Aldrich (Merck KGaA). Methanol
and acetonitrile (ACN) were chromatography grade (Merck KGaA).
Valine, phenylalanine, methionine, uric acid, arachidonic acid,
oleic acid, linoleic acid, palmitic acid and sodium succinate were
obtained from Shanghai Jingchun Reagent Co., Ltd. (Shanghai,
China). Ultrapure water was prepared using a Milli-Q water
purification system (EMD Millipore, Billerica, MA, USA).
Animals and sample collection
Male BALB/c mice of 6–8 weeks old, weighing 18–22 g,
were obtained from the Experimental Animal Center of the Third
Military Medical University (Chongqing, China). A total of 30
BALB/C mice were randomly divided into the normoxic control (H0),
acute hypoxic (H1) and acute repetitive hypoxia for four times
(HPC) groups. Mice were housed at 22±2°C and 60±10% relative
humidity in a specific pathogen-free environment, with a 12-h
light/dark cycle and ad libitum access to food and water.
The animal model of HPC was established according to
a method described previously (18). A weighed mouse was placed in a
125-ml jar, which was sealed airtight with a rubber plug. The mouse
was taken out of the jar immediately following the appearance of
the first asthmoid respiration (a sign of the hypoxia tolerance
limit); this was the first instance of hypoxia exposure.
Subsequently, the mouse was moved to a new, similar airtight jar in
order to duplicate a progressive hypoxic environment three more
times; the time of hypoxia tolerance in each mouse (from the
beginning of the first airtight exposure to the final asthmoid
respiration) was recorded. The H1 group was subjected to hypoxia
only 1 time, and the H0 group did not undergo the hypoxic
treatment. According to the following formula, the standard
tolerance time was computed: T=t/(v-w)/0.94×100 (T, standard
tolerance time; t, hypoxia tolerance time; v, jar volume; w, mouse
weight).
At the end of the experiment, the animals were
anesthetized and blood samples withdrawn via orbital puncture.
Subsequently, the samples were maintained at room temperature for
30 min, followed by centrifugation at 4°C and 1,500 × g for 10 min,
and preserved at −80°C. All animal studies were approved by the
Third Military Medical University Animal Care and Use
Committee.
Serum sample preparation
The serum samples were prepared according to a
previous report (19). A 100-µl
aliquot of serum sample was mixed with 10 µl
L-2-chlorophenylalanine (1 mg/ml in H2O), followed by
the addition of 400 µl methanol/acetonitrile/acetone (1:1:1,
v/v/v). Following vigorous agitation for 1 min and incubation on
ice for 10 min, the mixture was centrifuged at 13,000 × g for 15
min at 4°C to precipitate the protein. The supernatant was filtered
through a 0.22-µm syringe filter and transferred into the sampling
vial for UPLC-QTOFMS analysis. The serum samples from each group
were alternated in a random order for sequential analysis in order
to avoid technical errors originating from sample preparation and
analysis.
UPLC-QTOFMS analysis
UPLC-QTOFMS analysis was performed on an Agilent
1290 Infinity LC system coupled to Agilent 6530 Accurate-Mass
Quadrupole Time-of-Flight (Q-TOF) mass spectrometer (Agilent
Technologies, Inc., Santa Clara, CA, USA). The chromatographic
separations were performed on an ACQUITY UHPLC HSS T3 C18 column
(2.1×100 mm; 1.8 µm; Waters Corporation, Milford, MA, USA)
maintained at 45°C. The flow rate was 400 µl/min, and the injection
volume was 4 µl. The mobile phase consisted of 0.1% formic acid (A)
and ACN modified with 0.1% formic acid (B). A linear gradient was
applied as follows: 2% B at 0–3 min; 2–95% B at 3–20 min; and 95% B
at 20–22 min, followed by a re-equilibration step of 5 min.
An electrospray ionization source interface was set
in positive and negative modes in order to monitor the maximum
number of ions. The optimized conditions were as follows: Capillary
voltage, 3.5 kV; drying gas flow, 11 l/min; gas temperature, 350°C;
nebulizer pressure, 45 psi; fragmentor voltage, 120 V; and skimmer
voltage, 60 V. Data were collected in the centroid mode from
100–1,100 m/z. The potential biomarkers were analyzed by tandem MS
(MS/MS) in the Q-TOF. Nitrogen was used as the collision gas. The
MS/MS analysis was performed on the mass spectrometer adjusted to
different collision energies from 10–20 eV, according to the
stability of each metabolite. The MS spectra were collected at 2
spectra/s, and the MS/MS spectra were collected at 0.5 spectra/s,
with a medium isolation window (~4 m/z). The MS parameters set in
the negative mode were similar to those in the positive mode.
Data handling
The data were preprocessed according to a method
used previously, with minor modifications (19). The raw data in an
instrument-specific format (.d) were converted to mz data formats
using Agilent MassHunter Qualitative software (version B.02.00;
Agilent Technologies, Inc.). The XCMS (version 1.40.0; metlin.scripps.edu/download) program was employed
for nonlinear alignment of the data in the time domain, in addition
to the automatic integration and extraction of the peak
intensities. The XCMS parameters applied were the default settings
except for the following: Full width at half maximum (fwhm)=10,
bandwidth (bw)=10, and signal/noise ratio threshold (snthresh)=5.
The variables that were notpresent in a minimum of 80% of the
groups were filtered. An internal standard (L-2
chlorophenylalanine) was used for data quality control and
normalization. In addition, the ion peaks generated by the internal
standard were removed. The resulting three-dimensional matrix,
including retention time, m/z pairs, sample names and normalized
ion intensities, was introduced into the multivariate data
analysis.
The two datasets resulting from UPLC-QTOFMS in
positive ion mode (ESI+) and negative ion mode (ESI-) were analyzed
and validated using a multivariate statistical method. Each
normalized dataset was imported into the SIMCA-P 13.0 software
package (Umetrics, Umeå, Sweden) for principal component analysis
(PCA) and partial least squares-discriminant analysis (PLS-DA),
following mean-centering and pareto-scaling, the significantly
different expression of peaks (variable importance; VIP>1) was
identified by the software. The quality of the models was evaluated
with the relevant R2 and Q2 discussed elsewhere (20). Statistically significant
differences for the variables between the H0, H1, and HPC groups
were tested using one-way analysis of variance and the Tukey post
hoc test. The metabolites obtained from the ESI+ and ESI-modes of
the UPLC-QTOFMS analysis were similar to a previous study (21). The quasi-molecular ion peak was
identified to be similar to the accurate mass and retention time in
the extracted ion chromatogram (EIC), and the most probable
molecular formula was calculated using the Agilent MassHunter
software. The commercial standard MS/MS spectrum was used to
confirm the identified compound. Pathway analysis and visualization
using the Kyoto Encyclopedia of Genes and Genomes (KEGG; www.genome.jp/kegg) pathway database was conducted
using MetaboAnalyst 3.0 (22,23).
Results
Animal model of HPC
The duration of tolerance of mice in the H1 and HPC
groups was 17.2±3.3 and 91.4±11.5 min, respectively. The hypoxia
tolerance of mice was prolonged with the increase in the time of
hypoxia exposure, which suggested that the hypoxia preconditioned
mouse model was successfully established.
Serum metabolic profiling by
UPLC-QTOFMS
The coefficient of variation (CV) of the internal
standard was calculated. The results demonstrated that the CV was
<15%, which demonstrated the robustness of the method.
Therefore, differences observed between groups via multivariate
statistical analysis were more likely to reflect varied metabolite
profiles rather than analytical variation.
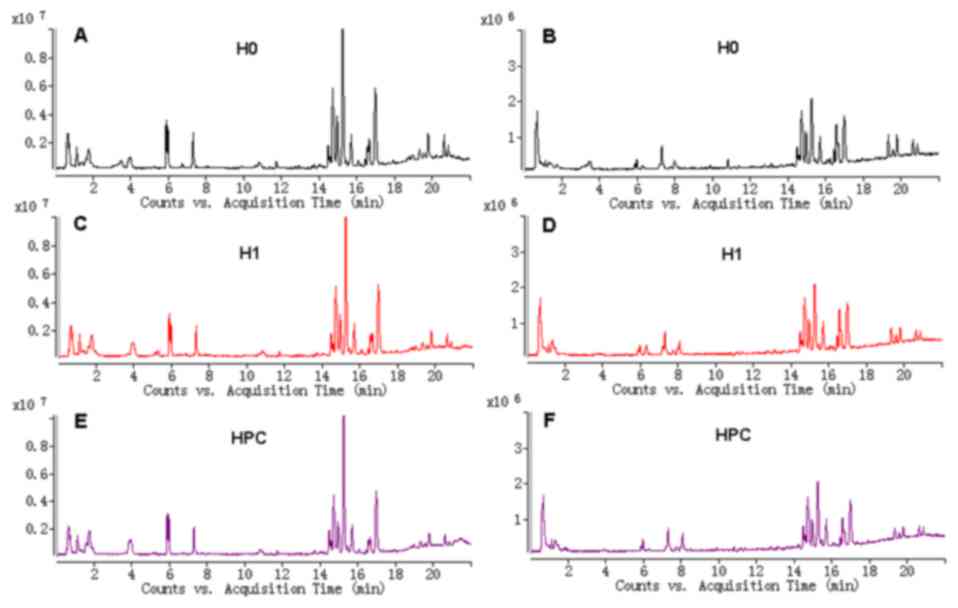
The typical total ion current chromatograms in
positive ion mode (ESI+) and negative ion mode (ESI-) of
UPLC-QTOFMS are presented in Fig.
1. A total of 1,008 and 922 peaks were obtained from
UPLC-QTOFMS ESI+ (expressed as ESI+ dataset) and ESI-mode
(expressed as ESI-dataset), respectively.
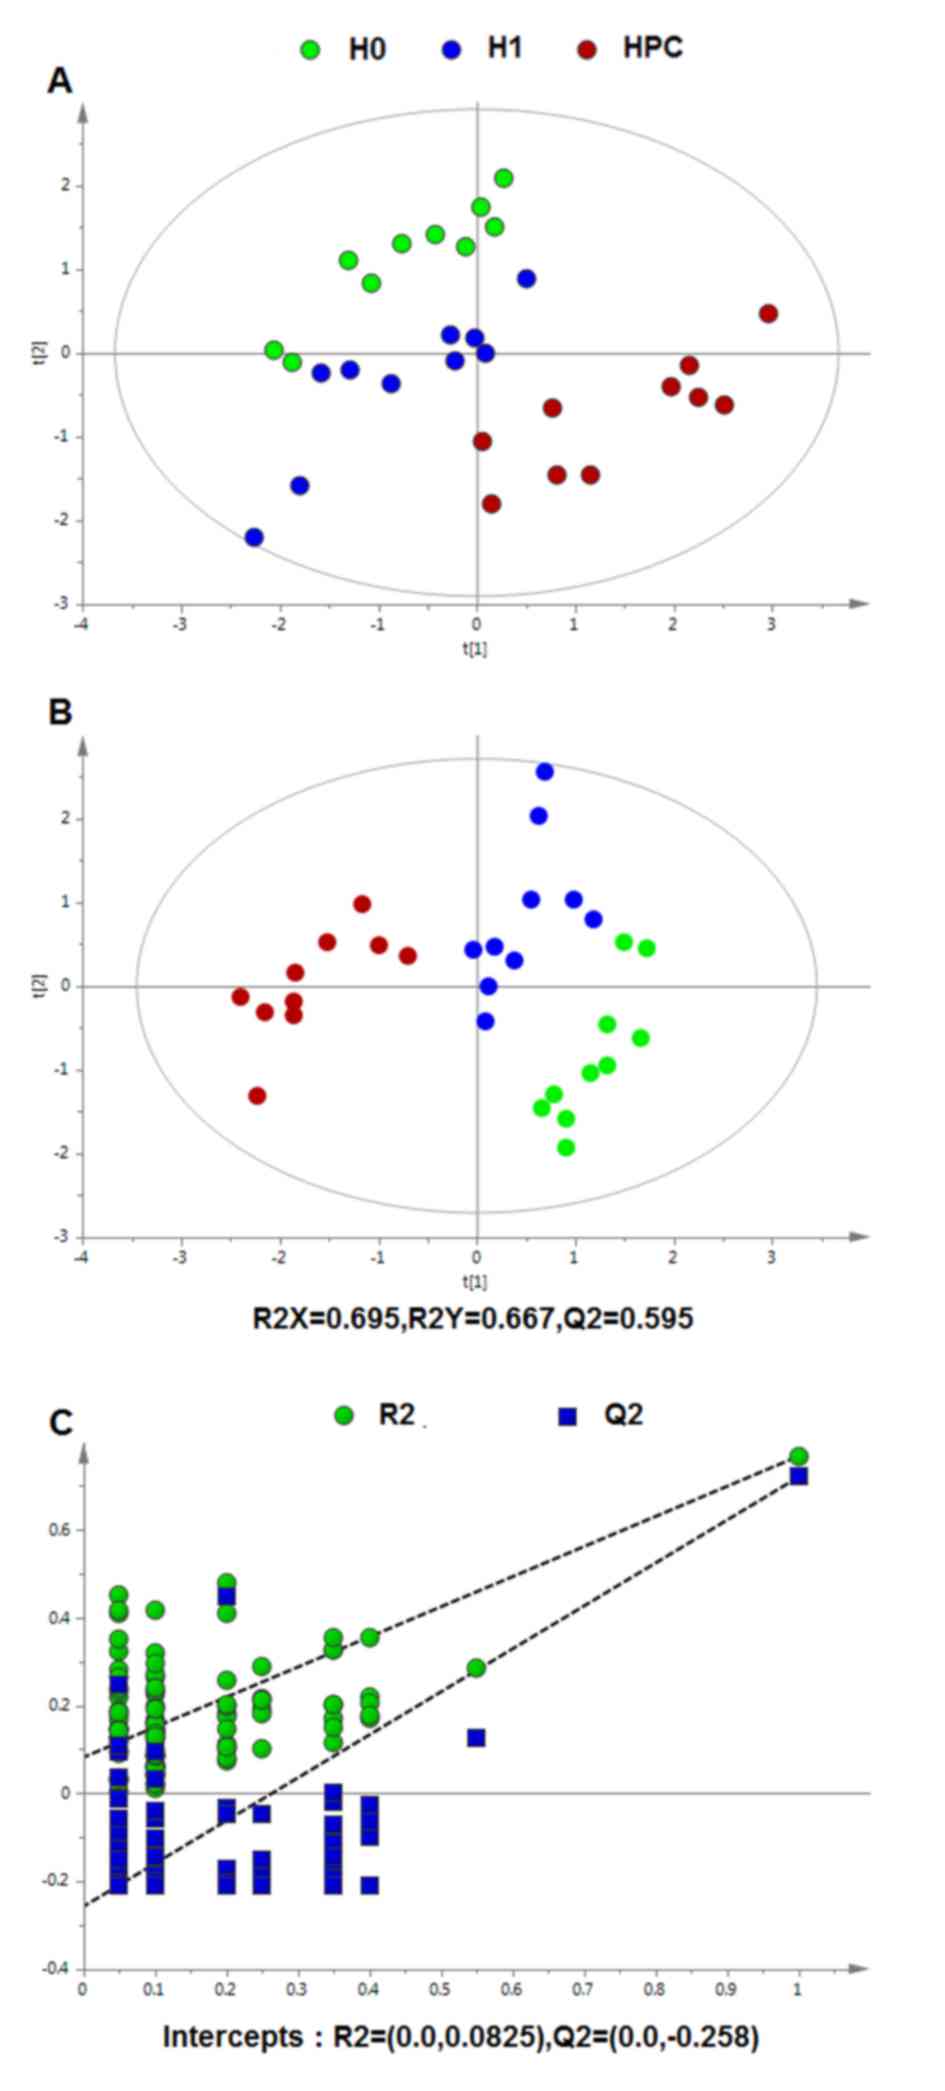
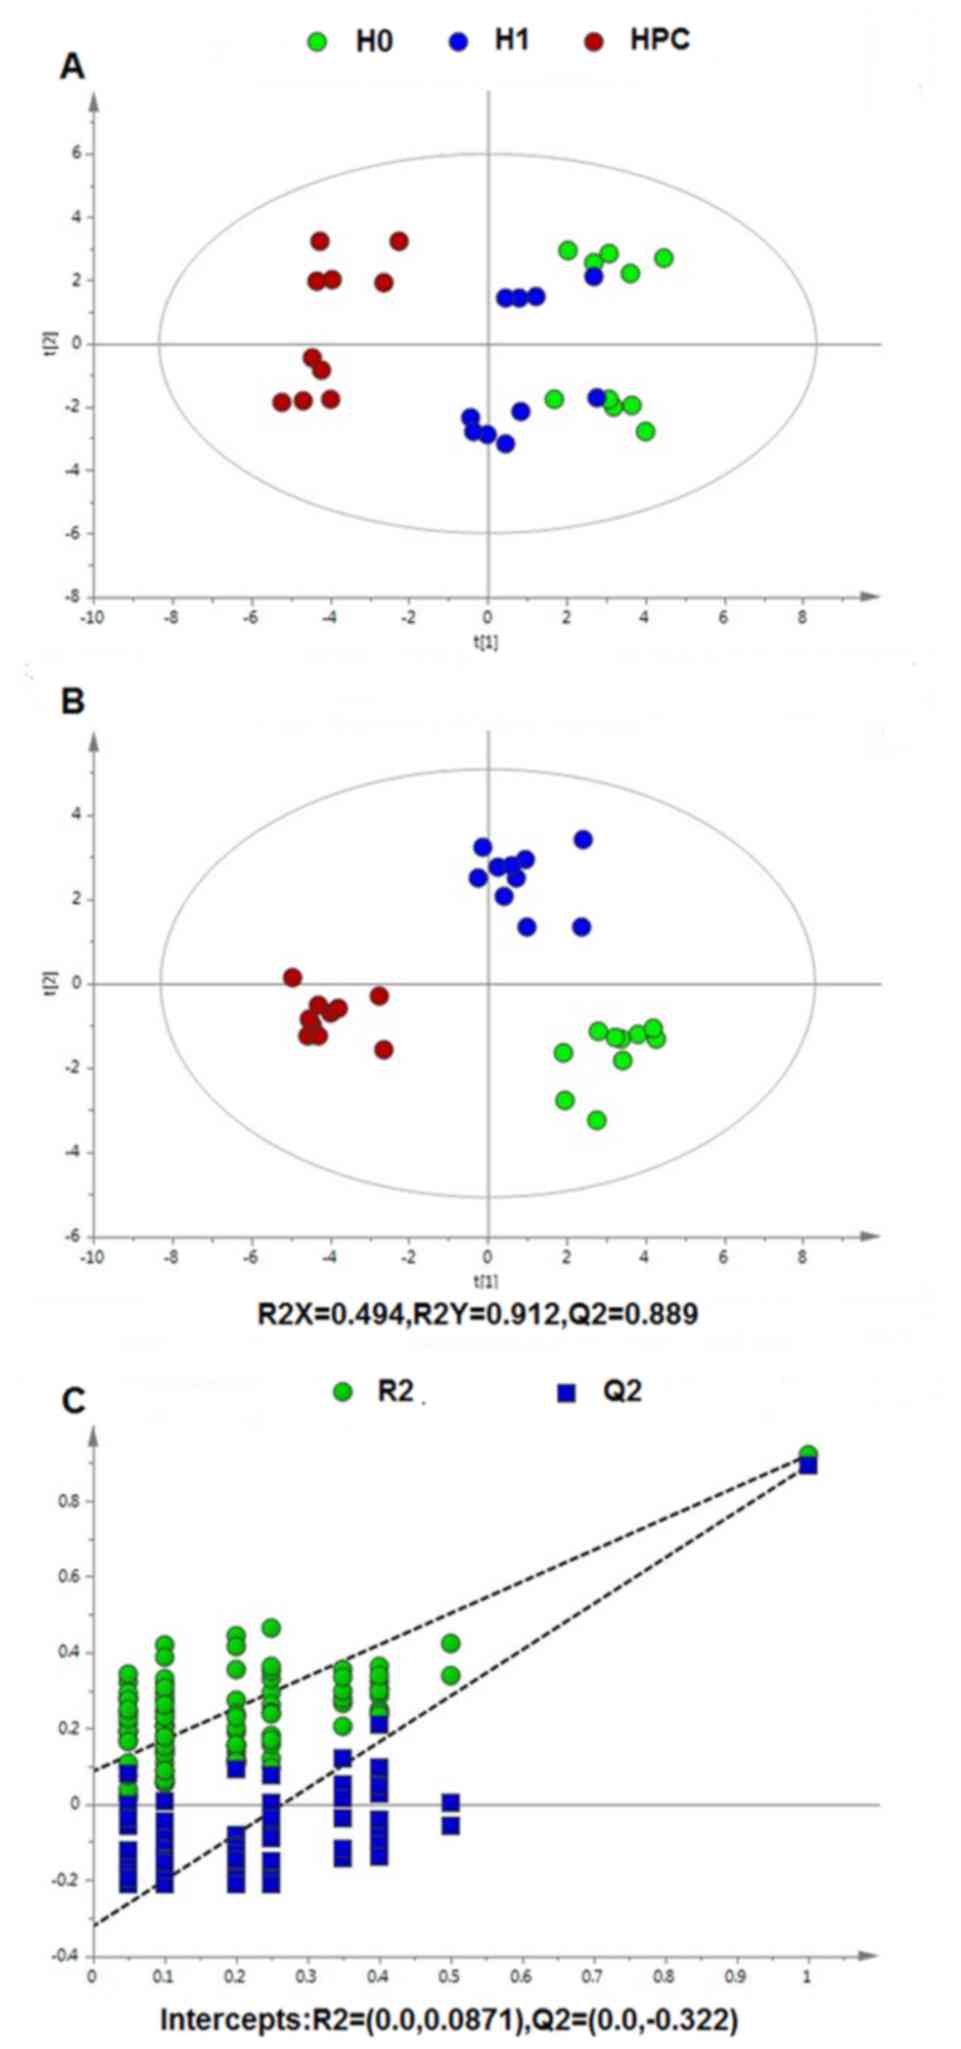
Multivariate statistical analysis
Following data normalization, the PCA was conducted
on the dataset, which revealed a trend of intergroup separation on
the scores plots. The plots of the PCA and PLS-DA scores obtained
from the three groups were constructed based on the spectral data
of the UPLC-QTOFMS ESI+ mode (Fig.
2) and UPLC-QTOFMS ESI-mode (Fig.
3). The two PLS-DA score plots demonstrated that the H0, H1 and
HPC groups were able to be separated distinctly. The PLS-DA models
were validated by a permutation test (99 times). As presented in
Figs. 2C and 3C, the R2 intercept values of
all the models and their Q2 intercept values correlated
with the extent of overfitting were small, indicating satisfactory
establishment of the models.
Identification of differential serum
metabolites in HPC
In order to select the potentially different
metabolites optimal for preferential study, metabolites which
differed significantly among the groups following one-way ANOVA
(P<0.05) were identified. Variables that significantly
contributed towards clustering and discrimination were identified,
according to the threshold values of variable importance in the
projection (VIP>1), which were generated following PLS-DA
processing. According to the above two different statistical
methods, 25 significantly-altered metabolites were identified in
HPC (Table I). The metabolites
obtained from the positive and negative ion modes of the
UPLC-QTOFMS analysis were similar to a previous study (19).
 | Table I.Summary statistics and
identifications of differentially-expressed plasma metabolites and
their metabolic pathways. |
Table I.
Summary statistics and
identifications of differentially-expressed plasma metabolites and
their metabolic pathways.
|
|
|
|
|
|
| H0
groupb | H1
groupb | H4
groupb |
| P-value for
ANOVA |
|---|
|
|
|
|
|
|
|
|
|
|
|
|
|
|
|---|
| No. | tr/min | m/z | Adduct | Metabolite | Associated
pathway | n=10 | n=10 | n=10 | VIPc | H1 & H0 | H4 & H0 | H4 & H1 |
|---|
| ESI |
|
|
|
|
|
|
|
|
|
|
|
|
|
| (+) |
|
|
|
|
|
|
|
|
|
|
|
|
|
| 1 | 1.13 | 118.086 | M+H | Valinea | Valine, leucine and
isoleucine biosynthesis | 0.0523±0-.0082 | 0.0650±0.0108 | 0.1203±0.0236 | 1.36 | 0.026 | P<0.01 | P<0.01 |
| 2 | 1.16 | 204.123 | M+H |
Acetylcarnitine | Fatty acid
transportation | 0.0965±0.0109 | 0.0743±0.0106 | 0.0425±0.0090 | 1.21 | P<0.01 | P<0.01 | P<0.01 |
| 3 | 1.17 | 150.058 | M+H |
Methioninea | Cysteine and
methionine metabolism | 0.0401±0.0048 | 0.0479±0.0100 | 0.0954±0.0181 | 1.24 | 0.117 | P<0.01 | P<0.01 |
| 4 | 1.63 | 182.081 | M+H | Tyrosine | Tyrosine
metabolism | 0.0448±0.0080 | 0.0748±0.0139 | 0.1208±0.0292 | 1.39 | P<0.01 | P<0.01 | 0.002 |
| 5 | 1.80 | 132.102 | M+H | Isoleucine | Valine, leucine and
isoleucine biosynthesis | 0.2824±0.0432 | 0.4661±0.1708 | 0.6779±0.1256 | 3.09 | 0.023 | P<0.01 | 0.017 |
| 6 | 3.64 | 166.086 | M+H |
Phenylalaninea | Phenylalanine
metabolism | 0.1812±0.0179 | 0.2628±0.0472 | 0.3334±0.0413 | 2.01 | 0.001 | P<0.01 | 0.007 |
| 7 | 14.62 | 494.325 | M+H | LysoPC(16:1) | Glycerophospholipid
metabolism | 0.0488±0.0085 | 0.1010±0.0244 | 0.0672±0.0179 | 1.09 | P<0.01 | 0.032 | 0.008 |
| 8 | 15.16 | 520.341 | M+H | LysoPC(18:2) | Glycerophospholipid
metabolism | 1.4183±0.2117 | 2.2970±0.3396 | 1.5134±0.2553 | 4.84 | P<0.01 | 1.000 | P<0.01 |
| 9 | 15.20 | 568.341 | M+H | LysoPC(22:6) | Glycerophospholipid
metabolism | 0.2987±0.0414 | 0.4279±0.1073 | 0.2297±0.0420 | 2.23 | 0.012 | 0.005 | P<0.01 |
| 10 | 15.22 | 544.341 | M+H | LysoPC(20:4) | Glycerophospholipid
metabolism | 0.4145±0.0396 | 0.7173±0.2747 | 0.4391±0.1241 | 2.47 | 0.019 | 0.907 | 0.035 |
| 11 | 15.44 | 424.343 | M+H |
Linoelaidylcarnitine | Fatty acid
transportation | 0.0242±0.0061 | 0.0633±0.0257 | 0.0529±0.0161 | 1.10 | 0.002 | 0.001 | 0.633 |
| 12 | 15.77 | 546.356 | M+H | LysoPC(20:3) | Glycerophospholipid
metabolism | 0.0910±0.0171 | 0.2249±0.0473 | 0.1192±0.0485 | 1.84 | P<0.01 | 0.281 | P<0.01 |
| 13 | 15.91 | 400.343 | M+H |
Palmitoylcarnitine | Fatty acid
transportation | 0.0632±0.0113 | 0.0864±0.0211 | 0.1100±0.0151 | 1.05 | 0.011 | P<0.01 | 0.010 |
| 14 | 16.14 | 522.357 | M+H | LysoPC(18:1) | Glycerophospholipid
metabolism | 0.8837±0.1314 | 1.4495±0.3031 | 1.0217±0.2578 | 3.50 | P<0.01 | 0.380 | 0.010 |
| 15 | 16.24 | 426.359 | M+H |
Octadecenoylcarnitine | Fatty acid
transportation | 0.0635±0.0086 | 0.1158±0.0222 | 0.1484±0.0194 | 1.48 | P<0.01 | P<0.01 | 0.008 |
| ESI |
|
|
|
|
|
|
|
|
|
|
|
|
|
| (−) |
|
|
|
|
|
|
|
|
|
|
|
|
|
| 1 | 0.74 | 124.008 | M-H | Taurine | Taurine and
hypotaurine metabolism | 0.3305±0.0689 | 0.3886±0.0563 | 0.6527±0.0923 | 1.10 | 0.272 | P<0.01 | P<0.01 |
| 2 | 0.82 | 133.015 | M-H | Malate | Citrate cycle (TCA
cycle) | 0.2442±0.1123 | 0.4746±0.0960 | 0.1731±0.0642 | 1.53 | P<0.01 | 0.297 | P<0.01 |
| 3 | 1.20 | 167.021 | M-H | Uric acid | Purine
metabolism | 0.4654±0.0871 | 1.2867±0.1555 | 0.6374±0.1670 | 2.72 | P<0.01 | 0.033 | P<0.01 |
| 4 | 1.28 | 191.020 | M-H |
Citratea | Citrate cycle (TCA
cycle) | 0.7793±0.2188 | 1.7729±0.2274 | 1.1371±0.2382 | 1.83 | P<0.01` | 0.005 | P<0.01 |
| 5 | 1.58 | 117.019 | M-H |
Succinatea | Citrate cycle (TCA
cycle) | 0.1866±0.1333 | 1.1098±0.2954 | 0.1141±0.0424 | 3.16 | P<0.01 | 0.324 | P<0.01 |
| 6 | 16.51 | 319.229 | M-H | 15-HETE | Arachidonic acid
metabolism | 2.1342±0.6468 | 3.0665±0.5586 | 2.0695±1.0005 | 2.40 | 0.009 | 0.997 | 0.044 |
| 7 | 19.33 | 303.233 | M-H | Arachidonic
acida | Arachidonic acid
metabolism | 0.5118±0.0825 | 0.7511±0.0553 | 0.7187±0.1332 | 1.41 | P<0.01 | P<0.01 | 1.000 |
| 8 | 19.50 | 279.233 | M-H | Linoleic
acida | Linoleic acid
metabolism | 0.3468±0.0589 | 0.8998±0.2997 | 0.5230±0.1105 | 1.46 | 0.001 | 0.002 | 0.009 |
| 9 | 20.23 | 255.233 | M-H | Palmitic
acida | Fatty acid
metabolism | 0.1555±0.0547 | 0.4895±0.1369 | 0.2829±0.0701 | 1.12 | P<0.01 | 0.016 | P<0.01 |
| 10 | 20.47 | 281.249 | M-H | Oleic
acida | Fatty acid
metabolism | 0.2162±0.0927 | 0.9256±0.3168 | 0.4428±0.1319 | 1.70 | P<0.01 | 0.001 | 0.002 |
Metabolic pathway analysis
Metabolite profiling focuses on the analysis of a
group of metabolites encompassed in a specific physiological
pathway. A detailed analysis of the relevant pathways and networks
of HPC was performed using MetaboAnalyst 3.0 (Table II). Consequently, the potential
target metabolic pathway analysis (impact-value≥0.10) with
MetaboAnalyst revealed that phenylalanine, tyrosine and tryptophan
biosynthesis, valine, leucine and isoleucine biosynthesis, taurine
and hypotaurine metabolism, phenylalanine metabolism, linoleic acid
metabolism, arachidonic acid metabolism, glyoxylate and
dicarboxylate metabolism, and tyrosine metabolism were disrupted in
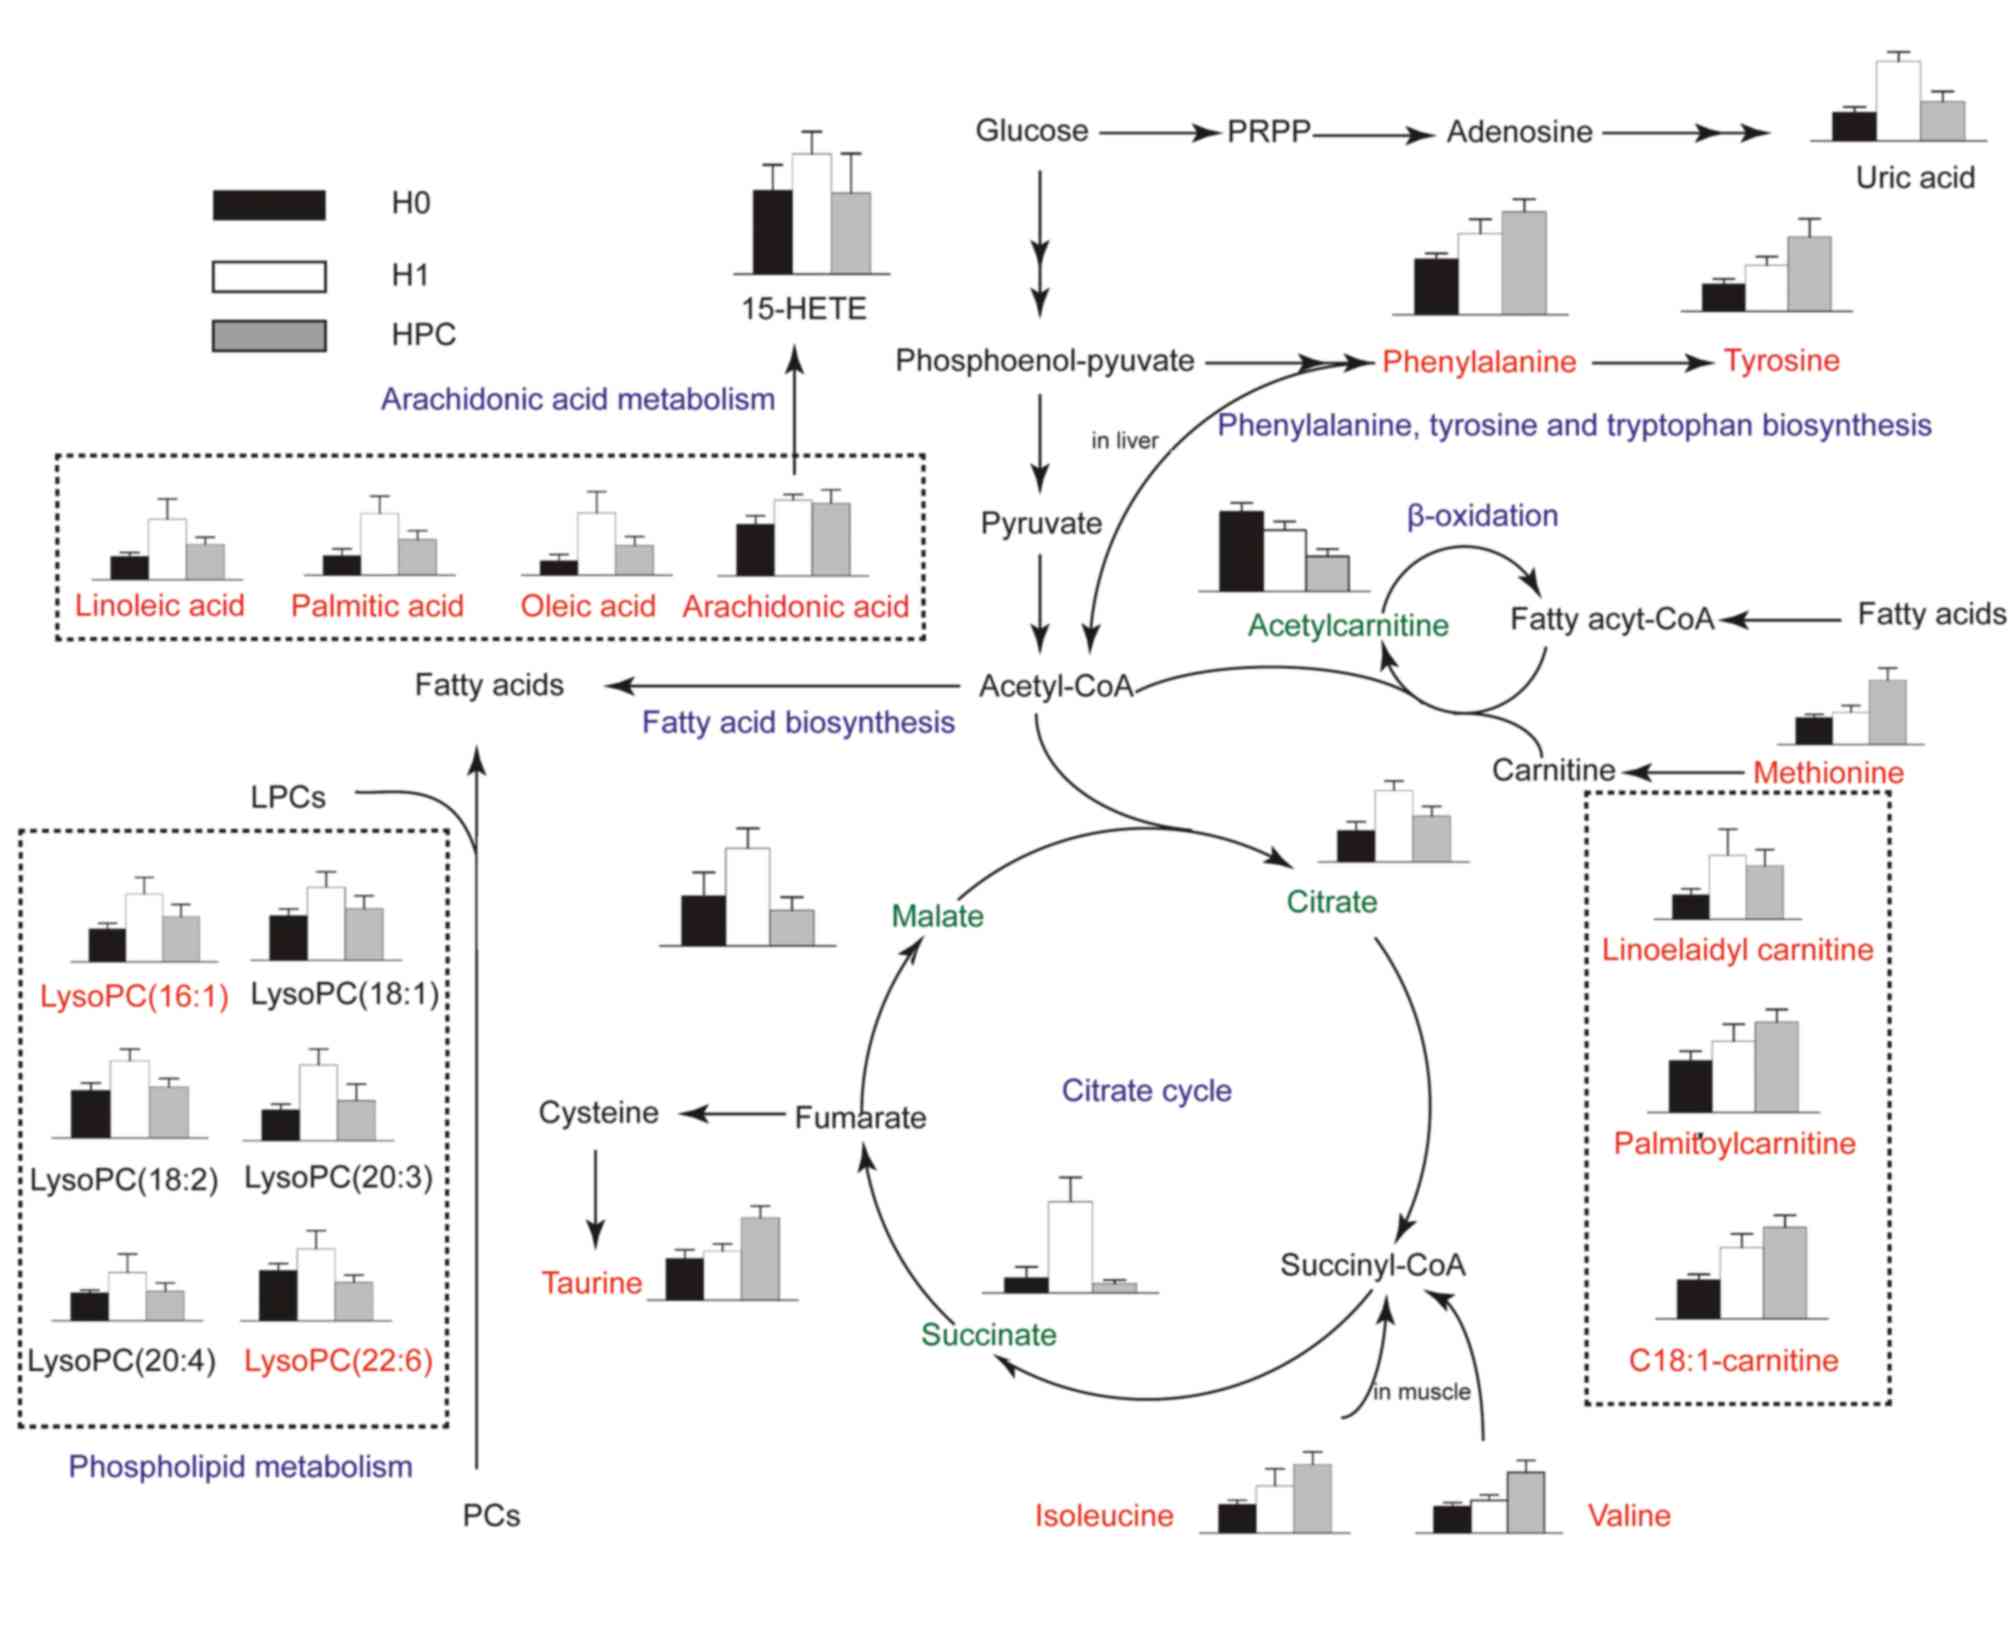
HPC (Fig. 4). In addition, further
correlated pathways were constructed using the reference map
obtained from the KEGG (Fig.
5).
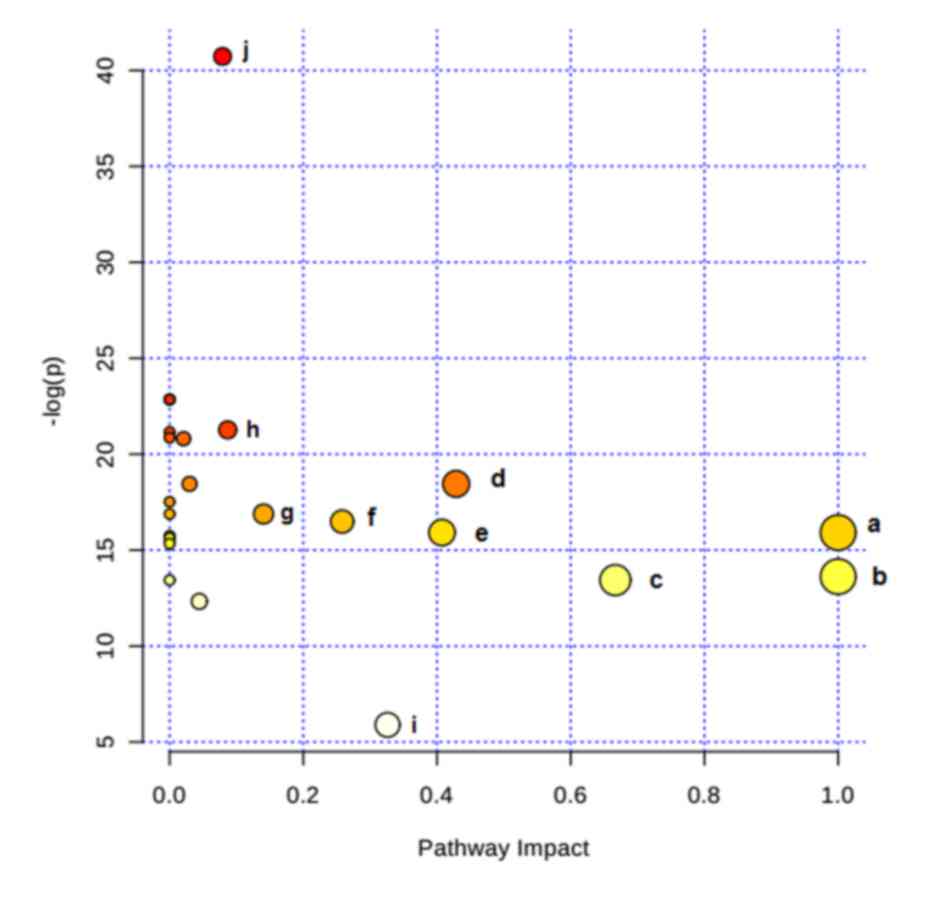 | Figure 4.Altered metabolic pathways under
hypoxia preconditioning. a, phenylalanine, tyrosine, and tryptophan
biosynthesis; b, linoleic acid metabolism; c, valine, leucine, and
isoleucine biosynthesis; d, taurine and hypotaurine metabolism; e,
phenylalanine metabolism; f, arachidonic acid metabolism; g,
glyoxylate and dicarboxylate metabolism; h, tyrosine metabolism; i,
citrate cycle. |
| Table II.Result from Metabolic Pathway
Analysis with MetaboAnalyst3.0. |
Table II.
Result from Metabolic Pathway
Analysis with MetaboAnalyst3.0.
| Pathway name | Total cmpd | Hits | Raw P-value | -log(p) | Impact |
|---|
| Phenylalanine,
tyrosine and tryptophan biosynthesis | 4 | 2 |
1.23×10⁻⁷ | 15.914 | 1.0000 |
| Linoleic acid
metabolism | 6 | 1 |
1.22×10⁻⁶ | 13.621 | 1.0000 |
| Valine, leucine and
isoleucine biosynthesis | 11 | 2 |
1.46×10⁻⁶ | 13.437 | 0.6667 |
| Taurine and
hypotaurine metabolism | 8 | 1 |
9.70×10⁻⁹ | 18.451 | 0.4286 |
| Phenylalanine
metabolism | 11 | 2 |
1.23×10⁻⁷ | 15.914 | 0.4074 |
| Arachidonic acid
metabolism | 36 | 2 |
2.76×10⁻³ |
5.893 | 0.3260 |
| Glyoxylate and
dicarboxylate metabolism | 18 | 1 |
6.92×10⁻⁸ | 16.487 | 0.2581 |
| Tyrosine
metabolism | 44 | 1 |
4.65×10⁻⁸ | 16.883 | 0.1405 |
| Citrate cycle | 20 | 2 |
2.06×10⁻¹⁸ | 40.726 | 0.0792 |
Discussion
Hypoxic preconditioning has been widely accepted to
be an endogenous protective effect; however, the underlying
mechanism has not yet been completely elucidated. In the present
study, endogenous metabolites in the serum of HPC mice were
analyzed by UPLC-QTOFMS. A total of 25 differentially-expressed
metabolites were identified, including phenylalanine, tyrosine and
tryptophan biosynthesis, valine, leucine and isoleucine
biosynthesis, taurine and hypotaurine metabolism, phenylalanine
metabolism, linoleic acid metabolism, arachidonic acid metabolism,
and glyoxylate and dicarboxylate metabolism. The major metabolic
patterns and plausible pathways in HPC mice are discussed
below.
The results of the present study demonstrated that
valine and isoleucine, the two branched-chain amino acids (BCAAs),
were significantly increased in the H1 and HPC groups, with the
highest levels in the HPC group. BCAAs are the main components of
muscle protein and are important substrates for the production of
ATP in muscle tissues. In hypoxic conditions, due to the lack of
oxygen, mitochondrial dysfunction leads to a restrictive
utilization of BCAAs; the two aromatic amino acids, phenylalanine
and tyrosine, were significantly increased in the H1 and HPC
groups, with the highest levels in the HPC group. Aromatic amino
acids are metabolized primarily in the liver. The continued
increase may be associated with the decreased metabolic capacity of
the liver in hypoxic environments (24,25).
These alterations indicated that amino acids may selectively
decrease the metabolic capacity of the muscle, liver and other
tissues in order to conserve the energy supply of vital organs
(e.g. brain and heart) during hypoxic conditioning.
Taurine is an antioxidant sulfur-containing amino
acid which is abundant in mammalian tissues. The results of the
present study demonstrated that, compared with the H0 group, the
serum content of taurine significantly increased in the mice in the
H1 and HPC groups; although the increase in the HPC group was
significant, the underlying mechanism was not clarified. This may
be attributed to the impaired function of the mitochondrial
membrane Na+/K+-ATP and the accumulation of
intracellular Na+, leading to restricted mitochondrial
oxidative phosphorylation, a decrease in ATP production,
accumulation of intracellular lactic acid, and the activation of
the cellular regulatory volume decrease reaction. Therefore,
taurine with the reduction of other extracellular osmotic
substances increased the content of taurine in the serum. Previous
studies have demonstrated that taurine modulated neuronal activity,
regulated the balance of intracellular and extracellular calcium
ions, and protected neurons and transplanted hearts from ischemic
and hypoxic injury, in addition to other functions (26,27).
Therefore, it was hypothesized that HPC protected the body against
hypoxic injury partially by upregulating the level of taurine.
The carnitine system (including free carnitine and
acylcarnitines) is essential for cell energy metabolism as a
carrier of long-chain fatty acids for β-oxidation or as a reservoir
pool of acyl-coenzyme A (28). In
the present study, the difference in the abundance of carnitines,
and their precursor methionine, among H0, H1 and HPC samples may
indicate an association between the requirement of alternative
energy and HPC. Previous studies have reported that acute hypoxia
inhibited the free fatty acid (FFA) oxidation, which resulted in
the accumulation of long-chain acylcarnitines (19,29).
In agreement with these previous reports, our results revealed
three long-chain acylcarnitines (linoelaidylcarnitine,
palmitoylcarnitine and octadecenoylcarnitine) that were
significantly increased in the H1 and HPC groups, with the highest
levels in the HPC group. In contrast with short-chain
acylcarnitines, acetyl-L-carnitine was decreased in the H1 and HPC
samples, with the lowest levels in the HPC group; however, the
reason remains to be elucidated. Previous studies demonstrated that
the administration of acetyl-L-carnitine attenuated neuronal
damage, prevented apoptosis and improved energy status during
hypoxic stress (30,31). Therefore, it was hypothesized that
supplementary short-chain carnitines may attenuate the damage of
hypoxia by promoting β-oxidation of long-chain fatty acids, that
decrease the accumulation of toxic long-chain acylcarnitines.
The results of the present study indicated that
lysophosphatidylcholines (LysoPCs) [(LysoPC (16:1), LysoPC (18:2),
LysoPC (18:1), LysoPC (20:4), LysoPC (20:3) and LysoPC (22:6)] and
FFAs (arachidonic acid, linoleic acid, oleic acid, and palmitic
acid) were significantly increased in the H1 group and decreased in
the HPC group. These alterations may be putatively ascribed to the
activation of phospholipase A2 (PLA2), which mediates the release
of LysoPCs and specific fatty acids from PC. Reportedly, PLA2 was
significantly increased under hypoxia, whereas it decreased
gradually to a normal level with the formation of HPC (32); this result indirectly substantiated
the results of the present study. LysoPCs are able to mediate a
number of cell signaling pathways in monocytes/macrophages
(33,34) and specific receptors (35), and therefore participate in the
inflammatory response. The other product of PC metabolism,
arachidonic acid, may be metabolized by cyclooxygenases and
lipoxygenases forming various eicosanoids, including
prostaglandins, thromboxanes, leukotrienes and lipoxins, that
participate in the inflammatory response (36). In the present study,
15-hydroxyeicosatetraenoic acid, a product of arachidonic acid
metabolisms, catalyzed by lipoxygenase, exhibited a trend similar
to that of arachidonic acid. The results of the present study
indicated that the phospholipid and arachidonic acid metabolic
pathway may serve a principal role in HPC.
Uric acid is the end product of purine metabolism
and is produced by two consecutive oxidation-reduction reactions
catalyzed by xanthine oxidase (XO): Hypoxanthine to xanthine, and
xanthine to uric acid. The results of the present study
demonstrated that the level of uric acid in the H1 group was
significantly increased compared with that in the H0 and HPC
groups. The mechanism may be associated with the reduction in ATP
levels when increased adenine nucleotide turnover was coupled with
the stimulation of XO (37).
The citrate cycle is central to aerobic metabolism,
facilitating an adequate supply of substrates derived from
carbohydrates, fatty acids or specific amino acids. In the present
study, three pivotal intermediates of the citrate cycle (malate,
citrate and succinate) were observed to be upregulated in the H1
group and downregulated in the HPC group. Therefore, mitochondrial
aerobic respiration may have been inhibited by acute hypoxia, which
may be partially restored by HPC.
In conclusion, a UPLC-QTOFMS-based serum metabolomic
approach was developed to profile HPC-associated metabolic
alterations. The results of the present study demonstrated that the
HPC mouse model was well-established. In the present study, 25
significantly-altered metabolites were identified and the major
metabolite was network predicted using pattern recognition and
pathway analysis. The identified target metabolites were observed
to encompass a variety of pathways associated with valine, leucine,
and isoleucine biosynthesis, in addition to taurine, hypotaurine,
phenylalanine, linoleic acid and arachidonic acid metabolism. The
results of the present study provided novel insights into the
protective mechanism of HPC.
Acknowledgements
The present study was supported by the National
Natural Science Foundation of China (grant nos. 81301685 and
J1310001), the 973 Project of China (grant no. 2012CB518201) and
the Key Research Project of the People's Liberation Army (grant no.
BWS11J042).
References
|
1
|
Janoff A: Alterations in lysosomes
(intracellular enzymes) during shock; effects of preconditioning
(tolerance) and protective drugs. Int Anesthesiol Clin. 2:251–269.
1964. View Article : Google Scholar : PubMed/NCBI
|
|
2
|
Dirnagl U, Becker K and Meisel A:
Preconditioning and tolerance against cerebral ischaemia: From
experimental strategies to clinical use. Lancet Neurol. 8:398–412.
2009. View Article : Google Scholar : PubMed/NCBI
|
|
3
|
Zhang SX, Miller JJ, Gozal D and Wang Y:
Whole-body hypoxic preconditioning protects mice against acute
hypoxia by improving lung function. J Appl Physiol (1985).
96:392–397. 2004. View Article : Google Scholar : PubMed/NCBI
|
|
4
|
Carini R, De Cesaris MG, Splendore R,
Bagnati M and Albano E: Ischemic preconditioning reduces Na(+)
accumulation and cell killing in isolated rat hepatocytes exposed
to hypoxia. Hepatology. 31:166–172. 2000. View Article : Google Scholar : PubMed/NCBI
|
|
5
|
Zhu HL, Wei X, Qu SL, Zhang C, Zuo XX,
Feng YS, Luo Q, Chen GW, Liu MD, Jiang L, et al: Ischemic
postconditioning protects cardiomyocytes against
ischemia/reperfusion injury by inducing MIP2. Exp Mol Med.
43:437–445. 2011. View Article : Google Scholar : PubMed/NCBI
|
|
6
|
Gao Y, Gao G, Long C, Han S, Zu P, Fang L
and Li J: Enhanced phosphorylation of cyclic AMP response element
binding protein in the brain of mice following repetitive hypoxic
exposure. Biochem Biophys Res Commun. 340:661–667. 2006. View Article : Google Scholar : PubMed/NCBI
|
|
7
|
Wang MM, Wang LJ, Chen Y, Li XR, Lv GW and
Xue M: Establishment of the prediction model of tolerance time of
mice and rats exposed to hypoxia. Chin J Comp Med. 1–23. 2008.
View Article : Google Scholar
|
|
8
|
Lu GW, Yu S, Li RH, Cui XY and Gao CY:
Hypoxic preconditioning: A novel intrinsic cytoprotective strategy.
Mol Neurobiol. 31:255–271. 2005. View Article : Google Scholar : PubMed/NCBI
|
|
9
|
Lv H, Wang Q, Wu S, Yang L, Ren P, Yang Y,
Gao J and Li L: Neonatal hypoxic ischemic encephalopathy-related
biomarkers in serum and cerebrospinal fluid. Clin Chim Acta.
450:282–297. 2015. View Article : Google Scholar : PubMed/NCBI
|
|
10
|
Hernández-Jiménez M, Sacristán S, Morales
C, García-Villanueva M, García-Fernández E, Alcázar A, González VM
and Martín ME: Apoptosis-related proteins are potential markers of
neonatal hypoxic-ischemic encephalopathy (HIE) injury. Neurosci
Lett. 558:143–148. 2014. View Article : Google Scholar : PubMed/NCBI
|
|
11
|
Cui C, Zhou T, Li J, Wang H, Li X, Xiong
J, Xu P and Xue M: Proteomic analysis of the mouse brain after
repetitive exposure to hypoxia. Chem Biol Interact. 236:57–66.
2015. View Article : Google Scholar : PubMed/NCBI
|
|
12
|
Fiehn O: Metabolomics-the link between
genotypes and phenotypes. Plant Mol Biol. 48:155–171. 2002.
View Article : Google Scholar : PubMed/NCBI
|
|
13
|
Sreekumar A, Poisson LM, Rajendiran TM,
Khan AP, Cao Q, Yu J, Laxman B, Mehra R, Lonigro RJ, Li Y, et al:
Metabolomic profiles delineate potential role for sarcosine in
prostate cancer progression. Nature. 457:910–914. 2009. View Article : Google Scholar : PubMed/NCBI
|
|
14
|
Jové M, Portero-Otín M, Naudí A, Ferrer I
and Pamplona R: Metabolomics of human brain aging and age-related
neurodegenerative diseases. J Neuropathol Exp Neurol. 73:640–657.
2014. View Article : Google Scholar : PubMed/NCBI
|
|
15
|
Shah SH, Kraus WE and Newgard CB:
Metabolomic profiling for the identification of novel biomarkers
and mechanisms related to common cardiovascular diseases: Form and
function. Circulation. 126:1110–1120. 2012. View Article : Google Scholar : PubMed/NCBI
|
|
16
|
Armitage EG and Barbas C: Metabolomics in
cancer biomarker discovery: Current trends and future perspectives.
J Pharm Biomed Anal. 87:1–11. 2014. View Article : Google Scholar : PubMed/NCBI
|
|
17
|
Zhou T, Wang M, Cheng H, Cui C, Su S, Xu P
and Xue M: UPLC-HRMS based metabolomics reveals the sphingolipids
with long fatty chains and olefinic bonds up-regulated in metabolic
pathway for hypoxia preconditioning. Chem Biol Interact.
242:145–152. 2015. View Article : Google Scholar : PubMed/NCBI
|
|
18
|
Lu GW, Chui XY and Zhao LF: Brain
mechanisms of hypoxic preconditioning. Zhongguo Ying Yong Sheng Li
Xue Za Zhi. 20:98–103. 2004.(In Chinese). PubMed/NCBI
|
|
19
|
Liao WT, Liu B, Chen J, Cui JH, Gao YX,
Liu FY, Xu G, Sun BD, Yuan ZB, Zhang EL, et al: Metabolite
Modulation in Human Plasma in the Early Phase of Acclimatization to
Hypobaric Hypoxia. Sci Rep. 6:225892016. View Article : Google Scholar : PubMed/NCBI
|
|
20
|
Yin P, Wan D, Zhao C, Chen J, Zhao X, Wang
W, Lu X, Yang S, Gu J and Xu G: A metabonomic study of hepatitis
B-induced liver cirrhosis and hepatocellular carcinoma by using
RP-LC and HILIC coupled with mass spectrometry. Mol BioSyst.
5:868–876. 2009. View
Article : Google Scholar : PubMed/NCBI
|
|
21
|
Tan G, Liao W, Dong X, Yang G, Zhu Z, Li
W, Chai Y and Lou Z: Metabonomic profiles delineate the effect of
traditional Chinese medicine sini decoction on myocardial
infarction in rats. PLoS One. 7:e341572012. View Article : Google Scholar : PubMed/NCBI
|
|
22
|
Xia J, Mandal R, Sinelnikov IV, Broadhurst
D and Wishart DS: MetaboAnalyst 2.0-a comprehensive server for
metabolomic data analysis. Nucleic Acids Res. 40:W127–W133. 2012.
View Article : Google Scholar : PubMed/NCBI
|
|
23
|
Xia J and Wishart DS: Web-based inference
of biological patterns, functions and pathways from metabolomic
data using MetaboAnalyst. Nat Protoc. 6:743–760. 2011. View Article : Google Scholar : PubMed/NCBI
|
|
24
|
Muratsubaki H and Yamaki A: Profile of
plasma amino Acid levels in rats exposed to acute hypoxic hypoxia.
Indian J Clin Biochem. 26:416–419. 2011. View Article : Google Scholar : PubMed/NCBI
|
|
25
|
Walker V, Gentry AJ, Green LR, Hanson MA
and Bennet L: Effects of hypoxia on plasma amino acids of fetal
sheep. Amino Acids. 18:147–156. 2000. View Article : Google Scholar : PubMed/NCBI
|
|
26
|
Tang DQ, Bian TT, Zheng XX, Li Y, Wu XW,
Li YJ, Du Q and Jiang SS: LC-MS/MS methods for the determination of
edaravone and/or taurine in rat plasma and its application to a
pharmacokinetic study. Biomed Chromatogr. 28:1173–1182. 2014.
View Article : Google Scholar : PubMed/NCBI
|
|
27
|
Sahin MA, Yucel O, Guler A, Doganci S,
Jahollari A, Cingoz F, Arslan S, Gamsizkan M, Yaman H and
Demirkilic U: Is there any cardioprotective role of Taurine during
cold ischemic period following global myocardial ischemia? J
Cardiothorac Surg. 6:312011. View Article : Google Scholar : PubMed/NCBI
|
|
28
|
Jones LL, McDonald DA and Borum PR:
Acylcarnitines: Role in brain. Prog Lipid Res. 49:61–75. 2010.
View Article : Google Scholar : PubMed/NCBI
|
|
29
|
Bruder ED and Raff H: Cardiac and plasma
lipid profiles in response to acute hypoxia in neonatal and young
adult rats. Lipids Health Dis. 9:32010. View Article : Google Scholar : PubMed/NCBI
|
|
30
|
Hota KB, Hota SK, Chaurasia OP and Singh
SB: Acetyl-L-carnitine-mediated neuroprotection during hypoxia is
attributed to ERK1/2-Nrf2-regulated mitochondrial biosynthesis.
Hippocampus. 22:723–736. 2012. View Article : Google Scholar : PubMed/NCBI
|
|
31
|
Barhwal K, Singh SB, Hota SK, Jayalakshmi
K and Ilavazhagan G: Acetyl-L-carnitine ameliorates hypobaric
hypoxic impairment and spatial memory deficits in rats. Eur J
Pharmacol. 570:97–107. 2007. View Article : Google Scholar : PubMed/NCBI
|
|
32
|
Liu H, Zhao H, Wang W, Xie X and Lu GW:
Changes of PLA2 Activity in Hypoxic Preconditioning in Brain
Tissue. Aca Periodical Changchun Coll Traditional Chinese Med.
16:49–50. 2006.
|
|
33
|
Duong CQ, Bared SM, Abu-Khader A, Buechler
C, Schmitz A and Schmitz G: Expression of the lysophospholipid
receptor family and investigation of lysophospholipid-mediated
responses in human macrophages. Biochim Biophys Acta. 1682:112–119.
2004. View Article : Google Scholar : PubMed/NCBI
|
|
34
|
Kabarowski JH: G2A and LPC: Regulatory
functions in immunity. Prostaglandins Other Lipid Mediat. 89:73–81.
2009. View Article : Google Scholar : PubMed/NCBI
|
|
35
|
Oestvang J and Johansen B:
PhospholipaseA2: A key regulator of inflammatory signalling and a
connector to fibrosis development in atherosclerosis. Biochim
Biophys Acta. 1761:1309–1316. 2006. View Article : Google Scholar : PubMed/NCBI
|
|
36
|
Balsinde J, Winstead MV and Dennis EA:
Phospholipase A(2) regulation of arachidonic acid mobilization.
FEBS Lett. 531:2–6. 2002. View Article : Google Scholar : PubMed/NCBI
|
|
37
|
Hare JM and Johnson RJ: Uric acid predicts
clinical outcomes in heart failure: Insights regarding the role of
xanthine oxidase and uric acid in disease pathophysiology.
Circulation. 107:1951–1953. 2003. View Article : Google Scholar : PubMed/NCBI
|