Introduction
Berberine (Ber) is an isoquinoline alkaloid isolated
from Coptischinensis Franch, which differs from
Coptischinensis extract (CCE) (1). Studies have shown that Ber offers
potential for the treatment of type 2 diabetes mellitus (T2DM)
(2–7), whereas CCE is primarily one of the
components of a Chinese traditional formula for the treatment of
diabetes mellitus (DM) via the prevention of associated vascular
and cardiac damage, renal fibrosis and lipid metabolism (8–10).
Ber is a classical natural medicine, the applications of which have
attracted interest in investigations focused on the treatment of DM
(11–15). The pharmacological effects of Ber
on glucose metabolism have been shown to involve pathways,
including improving insulin resistance (16), promoting insulin secretion
(17–19), protecting diabetic nephropathy
(20–22), modulating gut microbiota (23,24),
affecting phospholipid metabolites (25), preventing cardiac dysfunction in
T2TM (26–28), inhibiting gluconeogenesis in the
liver (29,30), reducing glucose absorption and
enhancing glucose consumption (31,32),
ameliorating hepatosteatosis and stimulating glycolysis (33,34),
and regulating lipid metabolism (35,36).
The potency of Ber in the treatment of DM is predominantly
associated with its antioxidant and anti-inflammatory activities
(37,38), and few studies have focused on the
pancreatic-derived factor of islet β-cells (39–41).
The protein expression of poly ADP-ribose polymerase (PARP)-1 in
islet β-cells may also be an important pathway for DM treatment
(42).
Therefore, the present study selected Ber and CCE as
the subjects for investigation, and their different effectson T2DM
rats were examined. The indices of fasting blood glucose (FBG),
glucosylated serum protein (GSP) and glucose infusion rate (GIR) in
fasting rats were compared among treatment groups of rats, and the
pancreatic indices of mean optical density (MOD) and fasting β-cell
functional index (FBCI) were compared for the evaluation of insulin
secretion. Ber and CCE were also used to investigate their
protective effects on Rin-5f cells, in which results of the
glucose-stimulated insulin release test (GSIS), cell cycle,
lipotoxic islet cell proliferation and protein expression levels of
PARP-1 were analyzed. CCE and Ber possessed equal effects in the
treatment of T2MD rats, which may have stimulated the pancreatic
secretion of insulin. In the Rin-5f cells, the GSIS, protection of
lipotoxic islet cell proliferation and apoptosis, and the protein
expression levels of PARP-1 were improved, which may protect
pancreatic of islet β-cells by improving islet β-cell proliferation
and the protein expression of PARP-1.
Materials and methods
Preparation and analysis of CCE
The herbal medicine Coptischinensis Franch
(Guangzhou Baiyunshan Zhong Yi Pharmaceutical Co., Ltd., Guangzhou,
China; batch no. 20090208) was extracted by the addition of 0.5%
sulfuric acid (1:8 by weight) three times at a temperature of 100°C
(1.5 h each time). The filtrates were mixed and concentrated by
evaporation at 75°C to obtain a condensed solution (relative
density of 1.07 at 55°C), following which the solution was filtered
and the precipitate discarded prior to adjusting the pH to 9.0 with
calcium hydroxide (10% by weight). The solution was then filtered
and the pH was adjusted to 1.5 with hydrochloric acid (AR),
following which sodium chloride (AR) was added to adjust the
concentration (10% by weight). The solution was agitated to mix,
prior to standing for 24 h, following which the precipitate was
obtained and washed with water until a pH of 5.0 was obtained. The
precipitate was refined three times using hydrochloric acid, sodium
chloride (10% by weight) and water, according to the
above-mentioned procedure. The obtained precipitate was evaporated
to dryness at 60°C to obtain 8 kg of CCE.
The sample analysis was performed on an Agilent 1200
high-performance liquid chromatography (HPLC) system (Agilent
Technologies, Inc., Santa Clara, CA, USA) equipped with a diode
array detector at a wavelength of 345 nm. The HPLC column used was
a Venusil XBP-C18 (Agela Technologies, Inc., Wilmington, DE, USA)
analytical column (250×4.6 mm, 5 µm). The mobile phase composition
was acetonitrile and 0.05 M potassium dihydrogen phosphate buffer
solution (28:72, v/v) at a flow rate of 1.0 ml·min−1.
The test solution was prepared by dissolving CCE in hydrochloric
acid-methanol (1:100, v/v). The standard was prepared by dissolving
the standard sepiberberine (EPI), coptisine (COP), palmatine (PAL),
jatrorrhizine (JAT) and Ber in hydrochloric acid-methanol (1:100,
v/v) to obtain appropriate concentrations for CCE sample analysis.
The EPI, COP, PAL, JAT and Ber standards were purchased from the
National Institutes for Food and Drug Control (Beijing, China) and
Shanghai Yuanye Biotechnology Co,. Ltd. (Shanghai, China).
Animals, model establishment and
treatment
A total of 180 male Sprague-Dawley rats (190±10 g; 4
weeks old) of SPF grade were purchased from Vital River Lab Animal
Technology Co., Ltd (Beijing, China), as was the high-fat diet,
which contained 18% lard, 20% sucrose, 3% egg yolk and 59% basal
diet (24.0% protein, 3.5% lipids and 60.5% carbohydrate). All
experiments were approved by the Ethical Committee of Guang'anmen
Hospital, China Academy of Chinese Medical Sciences (Beijing,
China). The animals were cared for in accordance with the Guide for
the Care and Use of Laboratory Animals of the National Institutes
of Health (Bethesda, MD, USA). The rats were randomly divided into
two groups; in the normal control group (n=20), rats were fed with
a basal diet; in the high-fat diet group (n=160), rats were fed
with the high-fat diet for a total of 8 weeks. The rat body weights
were compared between the control group and the experimental group
in eight randomly selected rats, and no significant differences in
body weights were found between the two groups. The rats were
randomly selected for eight hyperinsulinemiceuglycemic clamp
experiments to assess insulin resistance, the results of glucose
homeostasis and glucose infusion rate (GIR) are shown in Table I, with insulin resistance observed
in the high-fat diet group rats. When the rats in the high-fat diet
group showed significant insulin resistance, the rats were
administered with an intravenous injection of streptozotocin
(dissolved in 0.l M citrate buffer in an ice bath at a
concentration of 1%; pH 4.4) at a dose of 30 mg/kg to establish the
T2DM rat model. The rats in the normal diet group were administered
with an intravenous injection of an equal volume of citric
acid-sodium buffer solution. After 1 week, the blood glucose levels
of the rats were randomly measured, and a blood glucose level of
>16.7 mM was considered to indicate successful model
establishment. The model rats were randomly divided into eight
groups according to blood glucose level and body weight. The rats
in the control group and model group were orally administered with
distilled water every day; rats in the rosiglitazone group received
rosiglitazone at a dose of 0.4 mg/kg/d; rats in the metformin, Ber
and CCE groups were administrated with metformin, Ber and CCE at a
dose of 100 mg/kg/d (Table II),
respectively. The rats in each group were administered with
distilled water or drugs for 8 weeks.
 | Table I.Results of the
hyperinsulinemiceuglycemic clamp test prior to modeling. |
Table I.
Results of the
hyperinsulinemiceuglycemic clamp test prior to modeling.
| Group | Glucose homeostasis
(mM/l) | Glucose infusion
rate (mg·kg−1·min−1) |
|---|
| Control | 5.0±0.1 | 23.38±1.26 |
| High-fat diet | 5.0±0.2 |
20.27±1.60a |
| Table II.Details of the rats in each
experimental group. |
Table II.
Details of the rats in each
experimental group.
| Group | n | Blood glucose
(mM) | Body weight
(g) | Dose (mg/kg/d) |
|---|
| Control | 20 |
4.8±1.1a | 369.6±19.6 | Distilled
water |
| Model | 15 | 23.0±3.8 | 372.2±30.4 | Distilled
water |
| Metformin | 15 | 23.1±3.7 | 370.8±39.1 | 100 |
| Rosiglitazone | 15 | 23.0±3.9 | 365.1±42.9 | 0.4 |
| Ber-low | 15 | 23.3±3.7 | 362.1±40.6 | 50 |
| Ber-middle | 15 | 23.1±3.9 | 362.9±39.3 | 100 |
| Ber-high | 15 | 23.2±4.1 | 363.1±45.5 | 250 |
| CCE-low | 15 | 23.1±3.8 | 355.8±54.7 | 50 |
| CCE-middle | 15 | 23.2±3.9 | 359.8±51.1 | 100 |
| CCE-high | 15 | 23.1±3.9 | 344.9±50.9 | 250 |
Measurement of fasting blood glucose
and glycosylated serum protein
The rats were fasted overnight for 12 h (8.00
p.m-8.00 a.m.) with free access to water. The FBG was measured the
following morning using a blood glucose meter via the tail vein.
The blood serum was separated by centrifugation at 4,000 × g for 15
min at 4°C to determine the levels of glycosylated serum protein
(GSP).
Hyperinsulinemic-euglycemic clamp
experiment
The rats were fasted overnight prior to the
hyperinsulinemic-euglycemic clamp experiment with free access to
water. The rats were anesthetized via 2% sodium pentobarbital
intraperitoneal injection, the dose of which was calculated by body
weight at 40 mg/kg. The right carotid artery and the left jugular
vein were isolated and incubated with a silica gel epidural
catheter (inner diameter, 0.6 mm; outer diameter, 1 mm), which
contained saline heparin (50 U/ml) to maintain patency. Arterial
blood glucose was determined using a blood glucose meter. The
venous catheter was connected to the tee and the vein connected to
the outlet, with the inlet end connected to infusions of insulin
(infusion rate 8 mU/kg/min, insulin albumin diluted with 0.5%
bovine serum from Gibco, Thermo Fisher Scientific, Inc. (Waltham,
MA, USA; lot: 1527494) and glucose (20%) using a microcomputer
digital micro-injection syringe pump from the jugular vein. The
blood glucose levels of the rats were determined following of 30
min of insulin and glucose infusion. The blood was obtained from
the jugular vein to measure glucose values. Firstly, short-acting
porcine insulin (Sigma-Aldrich; Merck Millipore (Darmstadt,
Germany); 1:500; batch no. 20110925) was constantly infused, and
blood glucose was determined once every 10 min. When the blood
glucose level exceeded the baseline value ± 0.5 mM, 20% glucose was
infused to adjust the blood GIR on the basis of the control value ±
0.5 mM. The GIR was adjusted in the shortest possible time in
accordance with a normal blood glucose level. The procedure was
repeated until three consecutive blood glucose values were stable
within the above range; the steady state value of the three average
GIR values (mg·kg−1·min−1) was obtained.
Pancreatic tissue
immunohistochemistry
The rats were sacrificed under anesthesia. The
pancreatic tissue was isolated and embedded in paraffin prior to
being cut intosections (2×2 cm, 8 µm) for insulin
immunohistochemistry (INS). The tissue sections were stained with
guinea pig anti-porcine insulin antibody (cat. no. 129-10332;
RayBiotech, Inc., Norcross, GA 30092; 1:100) in the β-cells. For
the second step of the DAKO antibody Envision™ system (Glostrup,
Denmark), DAB was used as a color reagent for the β-cell tissue
sections. The Envision procedure was as follows: Tissue sections
were skimmed prior to hydration by rinsing in distilled water and
were placed in TBS, to which with 0.3% hydrogen peroxide was added
to block endogenous peroxidase, and then incubated for 15 min at
4°C. The tissue sections were rinsed in distilled water and placed
into TBS for rinsing for 5 min, which was repeated three times.
Following incubation for 2 h at 4°C, TBS rinsing was performed for
5 min three times, Envision™ was added prior to incubation for 60
min, followed by rinsing in TBS for 5 min three times. The DAB
source chromogenic solution was used for staining for 3 min, and
color development was terminated with distilled water. The sections
were then dehydrated in alcohol. A negative control experiment was
also performed, in which TBS was used instead of primary antibody
as a negative blank control. The results were observed under a
light microscope (Nikon Corporation, Tokyo, Japan). The MOD was
obtained from Sigma Photo Prosoftware version 5.5.1 (Sigma-Aldrich;
Merck Millipore) by counts. The FBCI was calculated based on
fasting insulin level (FINS) and FBG using the following formula:
FBCI = FINS /FBG.
Cell culture
The Rin-5f cells were cultured in medium comprising
fetal bovine serum (FBS) diluted in 1640 culture medium (1:10,
v/v). When ~80% of the Rin-5f cells had adhered to the bottom of
the dish, the original culture medium was discarded and replaced
with 5% BSA in 1640, and cultured for 36 h for synchronized
cultivation. The Rin-5f cell line was provided by the Cell Library
of Wuxi Medical School, Jiangnan University (Wuxi, China). The 1640
culture medium, FBS and antibiotic-antimycotic were purchased from
Invitrogen; Thermo Fisher Scientific, Inc. The kit used for western
blot analysis was purchased from GE Healthcare Life Sciences
(Chalfont, UK). PARP-1 antibody (cat. no. AE90773Mu) was purchased
from Cell Signaling Technology, Inc. (Danvers, MA, USA);
HRP-labeled goat anti-mouse IgG (H+L) (cat. no. SN133) were all
obtained from NanJing KeyGen Biotech Co., Ltd. (Nanjing, China),
β-actin (cat. no. P0068) were obtained from Beyotime Institute of
Biotechnology (Shanghai, China). The FITC Annexin V Apoptosis
Detection kit II was purchased from BD Biosciences (Franklin Lakes,
NJ, USA). Fatty acid-free bovine serum albumin (FFA) and other
chemical reagents were purchased from Sigma-Aldrich; Merck
Millipore. FFA was dissolved with 0.1 M NaOH solution at 70°C, and
then shaken for 10 min prior to filtering through a 0.22-µm filter
as the stock solution at a concentration of 100 mM. The FFA
solution was dissolved in deionized water to obtain a solution
concentration of 50 g/l at 55°C, prior to filtering through a
0.22-µm filter. A solution was then prepared, which contained 5%
FBS and 0.25 mM FFA in 1640 culture medium.
A Synergy 2 microplate reader (BioTek Instruments,
Inc., Winooski, VT, USA) was used to measure the absorption. The
mRNA expression levels were detected using the line-general-time
fluorescence quantitative polymerase chain reaction system
(Line-Gene 9600; Hangzhou Bioer Technology Co., Ltd., Hangzhou,
China). An RNA prep pure cell kit (cat. no. DP430) was obtained
from Tiagen Biotech Co., Ltd. (Beijing, China). PCR was performed
using a Verso 1-step QRT-PCR kit Plus ROX vial (cat. no. AB-4100/A;
Thermo Fisher Scientific, Inc.), which contained 50 µl Verso Enzyme
mix, 50 µl yellow RT Enhancer, a 1-step QRT-PCR mix (2X 1.25 ml)
and 25 µl brown ROX dye. The fluorophore used in the reaction was
Taqman (cat. no. 4304437; Thermo Fisher Scientific, Inc.). The
1-step QRT-PCR mix contained Thermo-Start™ DNA polymerase (cat. no.
AB-4100/A; Thermo Fisher Scientific, Inc.), which had 5′ to 3′
polymerization and exonuclease activity but lacked 3′ to 5′
exonuclease activity. The kit used for cDNA synthesis and reverse
transcription were from the Verso 1-step QRT-PCR kit Plus ROX vial,
where the Verso™ Enzyme mix (cat. no. AB-4100/A; Thermo Fisher
Scientific, Inc.) contained the reverse transcriptase enzyme for
long cDNA strand generation. and also contained RNAse inhibitor to
protect RNA templates from degradation (according to the
manufacturer's protocol). Cycling conditions were as follows
(according to the kit protocol): 50°C for 15 min for one cycle,
thermostatic activation at 95°C for 15 min for one cycle, followed
by 40 cycles at 95°C for 15 sec and extension at 60°C for 60 sec
(43). Primers were as follows:
forward, 5′GCC CTA AAG GCT CAG AAC GAC 3′ and reverse, 5′CAC CAT
GCC ATC AGC TAC TCG3 for PARP-1; forward, 5′CAC CCA CTC CTC CAC CTT
TG3′ and reverse, 5′CCA CCA CCC TGT TGC TGT AG3 for GAPDH. Image
capture was performed using the Flurochem 8900 system (Alpha
Innotech). The 2−∆∆Cq method was used for quantification
(44).
Rin-5f cell survival rate assay using
MTT
The Rin-5f cells were transferred into a 96-well
plate at ~1×10⁵ cells per well, following which
different concentrations of the drugs were added to each well and
incubated for 0, 24, 48 and 72 h prior to the MTT assay. Culture
medium without Rin-5f cells and drug-free culture medium with
Rin-5f cells were used as blank and control groups, respectively.
Each group was examined in triplicate (n=3). The obtained
absorbance values were used to calculate the Rin-5f cell survival
rate (SR%). The absorbance (A) of each well was determined using a
Synergy 2 micro-plate reader at wavelength of 570 nm, SR% was used
to evaluate the effects of Ber and CCE on Rin-5f cells, calculated
using the following formula: SR% = (ADrug groups -
Ablank) /(AControl group -
Ablank).
GSIS release test
The Rin-5f cells were induced with the drugs for 3
days, following which the drug was washed off, and 1.0 g/l glucose
was added, prior to culture in 2% BSA 1640 culture medium in a
CO2 incubator at 37°C for 10 min. The supernatant was
aspirated, and 3 g/l glucose was added to cells for culture in 2%
BSA 1640 culture medium for 45 min. Again, the supernatant was
discarded and the cells were washed twice with the culture medium.
Subsequently, 1 g/l glucose was added and the cells were cultured
in 2% BSA in 1640 medium for 45 min, following which the
supernatant was discarded. The levels of insulin were measured
using chemiluminescence, and the insulin release index was
calculated by comparing the high glucose intake insulin value with
the low glucose insulin value (n=6). The experimental groups
composed of control group, glibenclamide group, Ber groups at doses
of 5, 20, 100, 150 and 250 µM, and CCE group at doses of 5, 20,
100, 150 and 250 µM.
Analysis of cell cycle
The Rin-5f cells were transferred into a 6-well
plate at ~1×10⁵ in each well for culture until 80% of
cells had adhered to the bottom of the plate. Culture
synchronization was performed for 36 h prior to discarding of the
original culture medium. The cells were divided into a control
group (5% BSA in 1640 medium) and drug-induced groups (0.25 mM FFA,
BerorCCE at a dose of 100 µM in 5% BSA in 1640 medium) with three
wells for each group. Following drug intervention for 48 h at 37°C,
the trypsin-digested cells were collected by centrifugation (1,350
× g) at 4°C for 15 min, and the suspended and adherent cells were
collected and washed twice with pre-cooled PBS at 4°C. The cells
were then resuspended with binding buffer to a cell concentration
of 106/ml, and 100 µl of each sample cell suspension was
collected and added to10 µl propidium iodide solution (PI) and 100
mg/l RNA enzyme-binding buffer. The mixture was incubated at 37°C
for 30 min in a water bath. Subsequently, 400 µl of the binding
buffer was added into each sample fluid, and cell cycle and
distribution analyses were performed on the samples using flow
cytometry.
MTT determination of the inhibition of
lipotoxic islet cell proliferation
The Rin-5f cells were seeded into a 96-well plate
(20,000 per well), following cell cultivation for synchronization.
Different concentrations of the drug and 0.25 mM palmitic acid, low
glucose 1640 culture medium, and 2% BSA, respectively, were added
to the wells, with six parallel wells for each group. The MTT assay
was performed using an MTT kit, according to the manufacturer's
protocol, following cultivation for 24 h. The experiments were
repeated three times. The absorbance (A) values were used to
calculated islet cell proliferation inhibition rate (PIR) as
follows: PIR = [1 - (Ad - Ab) /(Ac
- Ab)] × 100%, where Ad, Ac and
Ab represented the drug induced group, control group and
blank group, respectively. The were 13 groups, including the
control group, Ber groups at doses of 2, 10, 50, 100, 250 and 500
µM and the CCE groups.
Protective effects of Ber and CCE on
high fat-induced islet cell apoptosis
Cohest apoptotic Rin-5f cell staining was performed
to examine apoptosis. Sterilized slides were placed into 6-well
cell culture plates; with 5×10⁵ islets cells in each
well. Following incubation for the synchronization, when cells had
adhered to the bottom of the plate, 1640 low glucose culture
medium, 0.25 mM palmitate and 2% BSA were added to induce cell
apoptosis, following which the drugs were added for 24 h prior to
removal of the culture medium. Following washing with PBS three
times, the slides were removed and stained according to the
manufacturer's protocol of the cohest staining kit. The numbers of
apoptotic cells were counted in 100 cells per field on each slide
in five fields of view under a fluorescence microscope. The
apoptotic rate was calculated as follows: Apoptotic rate = number
of apoptotic cells /500 × 100%. The experimental groups comprised
Ber and CCE at doses of 2, 10, 50, 100, 250 and 500 µM
respectively.
Determination of islet cell
apoptosis
The high fat-induced Rin-5f cells were divided into
a control group (culture medium), model group (0.25 mM FFA, 5% BSA,
1640), Ber (100 µM) and CCE (100 µM), prior to induction for 24 h.
The cells (5×10⁵ islets cells per well) were stained
according to the Annexin V-FITC/PI double staining method. The
culture medium was removed and the cells were washed twice with
Dulbecco's phosphate-buffered saline (D-PBS), following which 0.25%
trypsin was added to digest the cells, and the cell suspension was
collected by centrifugation at 4°C for 5 min at 1,350 × g to remove
the medium. The precipitate was resuspended with 0.5 ml binding
buffer, following which 5 µl Annexin V-FITC reagent and 5 µl PI
were added prior to vortexing for 1 min. The mixture was incubated
at room temperature for 20 min in the dark. The binding of Annexin
V-FITC was measured using flow cytometry to obtain the V-positive
cell number and the mean fluorescence intensity (excitation
wavelength, 488 nm; emission wavelength, 530 nm). A total of 1.0 ml
of sample was analyzed for positive expression rate detection and
adjusted to 1×10⁴ cells in each vial. The results were
presented on a bivariate flow cytometry scatter plot. The lower
left quadrant, the upper right quadrant and the lower right
quadrant represent live cells (FITC−/PI−),
necrotic cells (FITC+/PI+) and apoptotic
cells (FITC+/PI−), respectively.
Western blot analysis of the protein
expression of PARP-1 in apoptotic islet cells
The Rin-5f cells were seeded into a 100 mm
petri-dishes at a concentration of 106 cells per well.
When 80% of the cells had adhered to the bottom of the wells,
culture synchronization was performed for 36 h, prior to discarding
of the culture medium. The cells were divided into a control group
(5% BSA, 1640 medium), model group (0.25 mM FFA, 5% BSA, 1640
medium) and drug groups (Ber or CCE, 0.25 mM FFA, 5% BSA, 1640
medium), prepared at doses of 50, 100, 150 and 200 µM for Ber and
for CCE. The cells were incubated for 24 h prior to digestion with
protein lysate to extract proteins at 4°C. The protein
concentrations were determined according to the Bradford method as
follows: For each 50 µg protein sample, isolation was performed by
adding 130 ml polyacrylamide and 1 ml SDS gel per liter, followed
by transfer onto a cellulose acetate membrane, and then blocked at
room temperature with tris-buffered saline with tween-20 (TBST)
containing 50 g/l of skim milk for 1 h. Subsequently, specific
antibody was added and incubated at 4°C overnight, following which
the membrane was washed with TBST three times (10 min each). The
membrane was then incubated with horseradish peroxidase-labeled
goat anti-rabbit IgG (1:1,000, diluted in 0.01 M sodium phosphate
and 0.25 M NaCl at pH 7.6) at room temperature for 1 h, and then
washed with TBST three times (10 min each). A sensitizing reagent
kit was used to detect chemiluminescent substrate. The Flurochem
8900 image acquisition system and Alpha View software version 3.0
(Protein Simple Bioscience and Technology Co., Ltd., Shanghai,
China) were used for image capture and scanning for densitometric
analysis, respectively.
Statistical analysis
Statistical analysis was performed on SPSS 11.5
software (SPSS, Inc., Chicago, IL, USA). An independent-samples
t-test was used for intergroup comparison. All data are presented
as the mean ± standard deviation. P<0.05 was considered to
indicate a statistically significant difference.
Results
CCE sample analysis
The CCE was analyzed according to the developed HPLC
method, the contents of EPI, COP, JAT, PAL and Ber were 2.79, 3.11,
8.03, 8.02 and 74.12% respectively. The content of the five
alkaloids was 96.07%. The contents, chemical structures and HPLC
chromatography results for CCE alkaloid determination are shown in
Fig. 1.
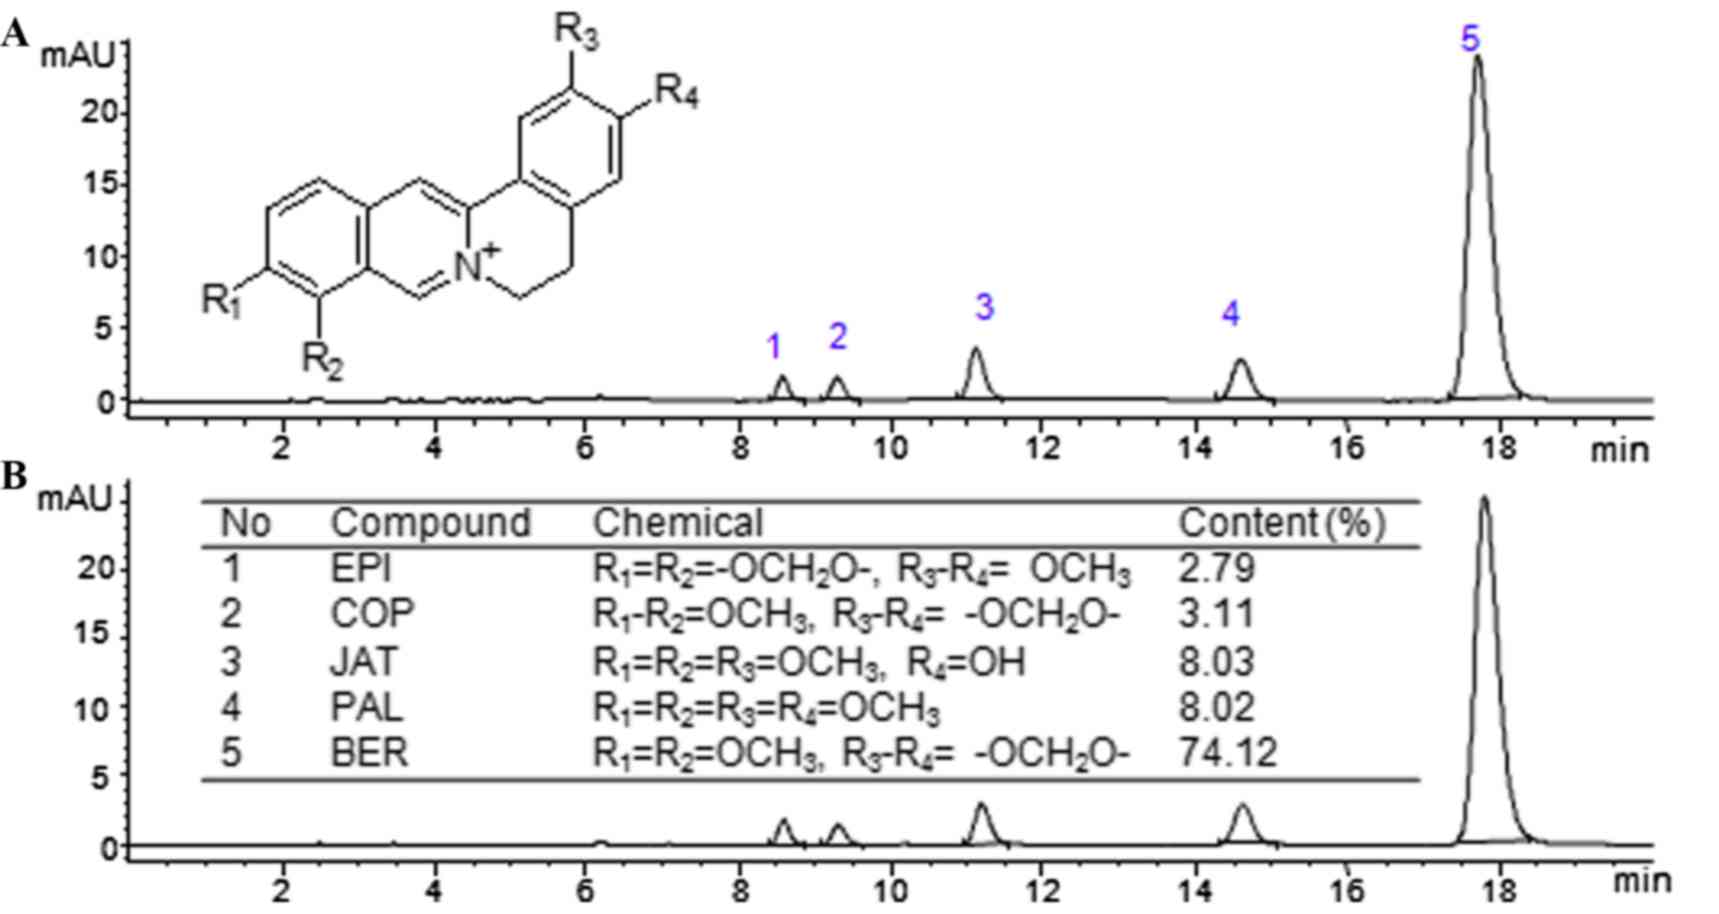 | Figure 1.High performance liquid
chromatography, chemical structures and contents for CCE
determination. Chromatography of (A) standard solution and (B) test
solution. Peaks 1–5 represent EPI, COP, JAT, PAL and Ber,
respectively. EPI, epiberberine; COP, coptisine; PAL, palmatine;
JAT, jatrorrhizine; Ber, berberine. |
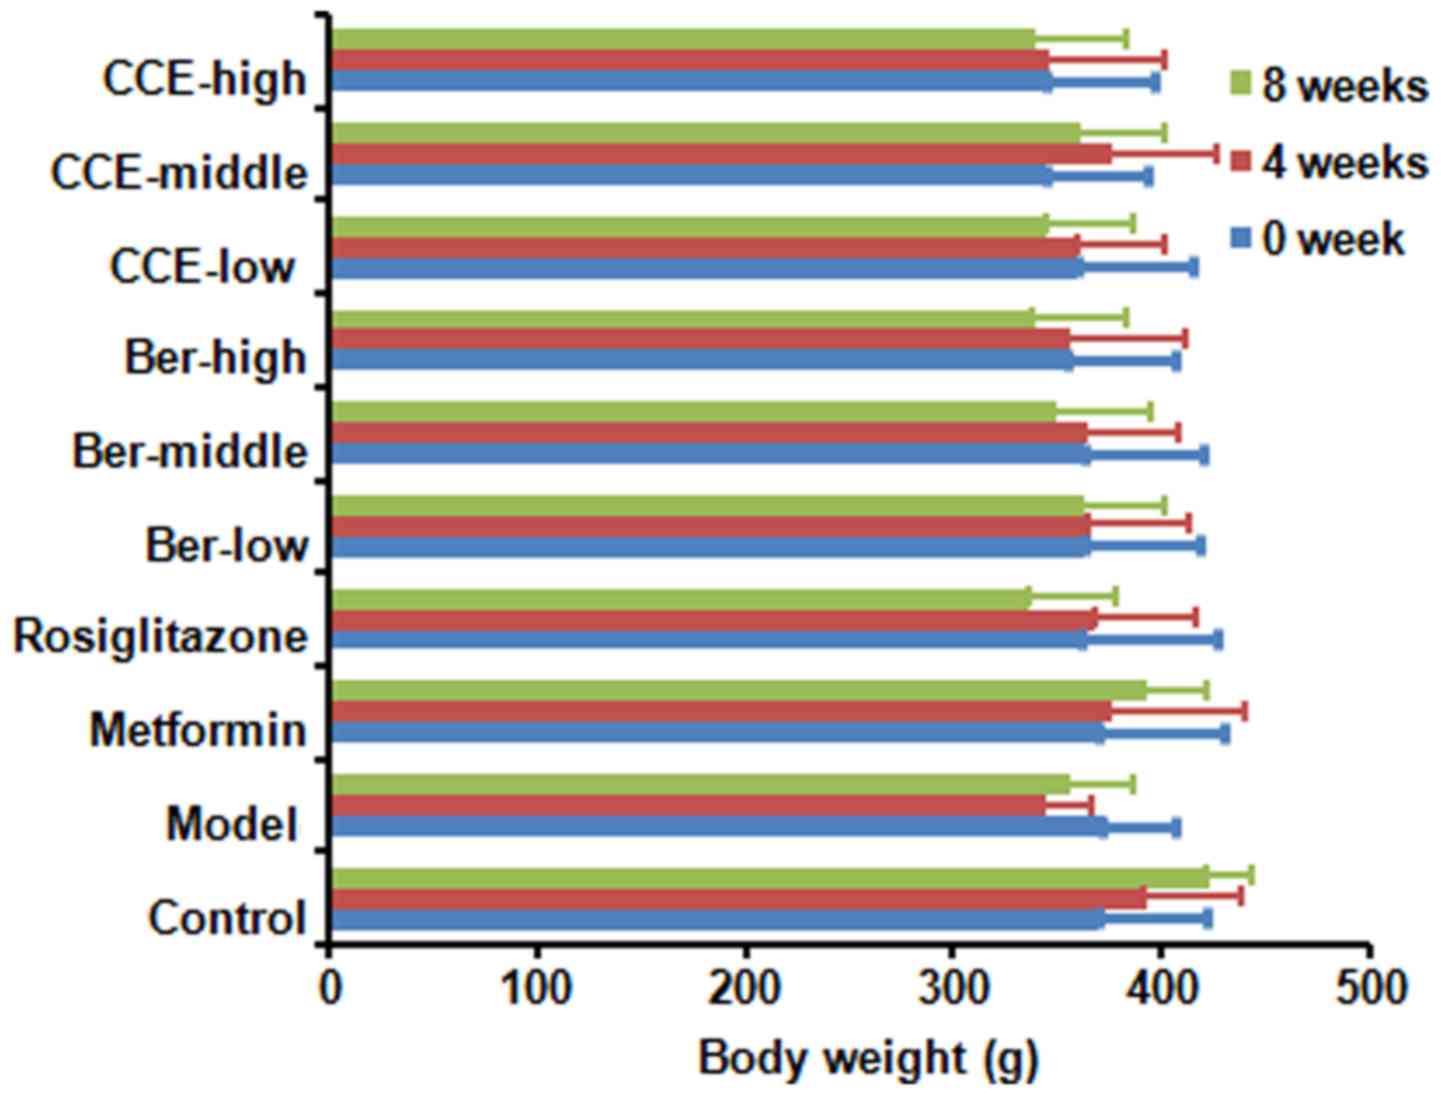
Body weights of the rats
The body weights in the control group of normal rats
gradually increased between 0 and 8 weeks, which was also observed
in the metformin group rats. In the model group, the body weights
initially decreased and then increased slowly, whereas the body
weights gradually decreased in the CCE-high group and Ber-high
group. In the rosiglitazone group, body weights initially increased
and then decreased as in the CCE and Ber groups (Fig. 2). Where rat health was affected by
severe T2DM, body weights decreased initially (0–4 weeks) between a
stage of severe disease and recovery, and then increased gradually
(5–8 weeks). In each drug group, no decreases in body weights were
observed between 0 and 4 weeks in each, including the rosiglitazone
group, due to the protective effects of the drug. The body weights
of rats were increased in the met form in group. Metformin is a
biguanideantihyperglycemic agent used for the treatment of
non-insulin-dependent DM, which may explain the increase in body
weight.
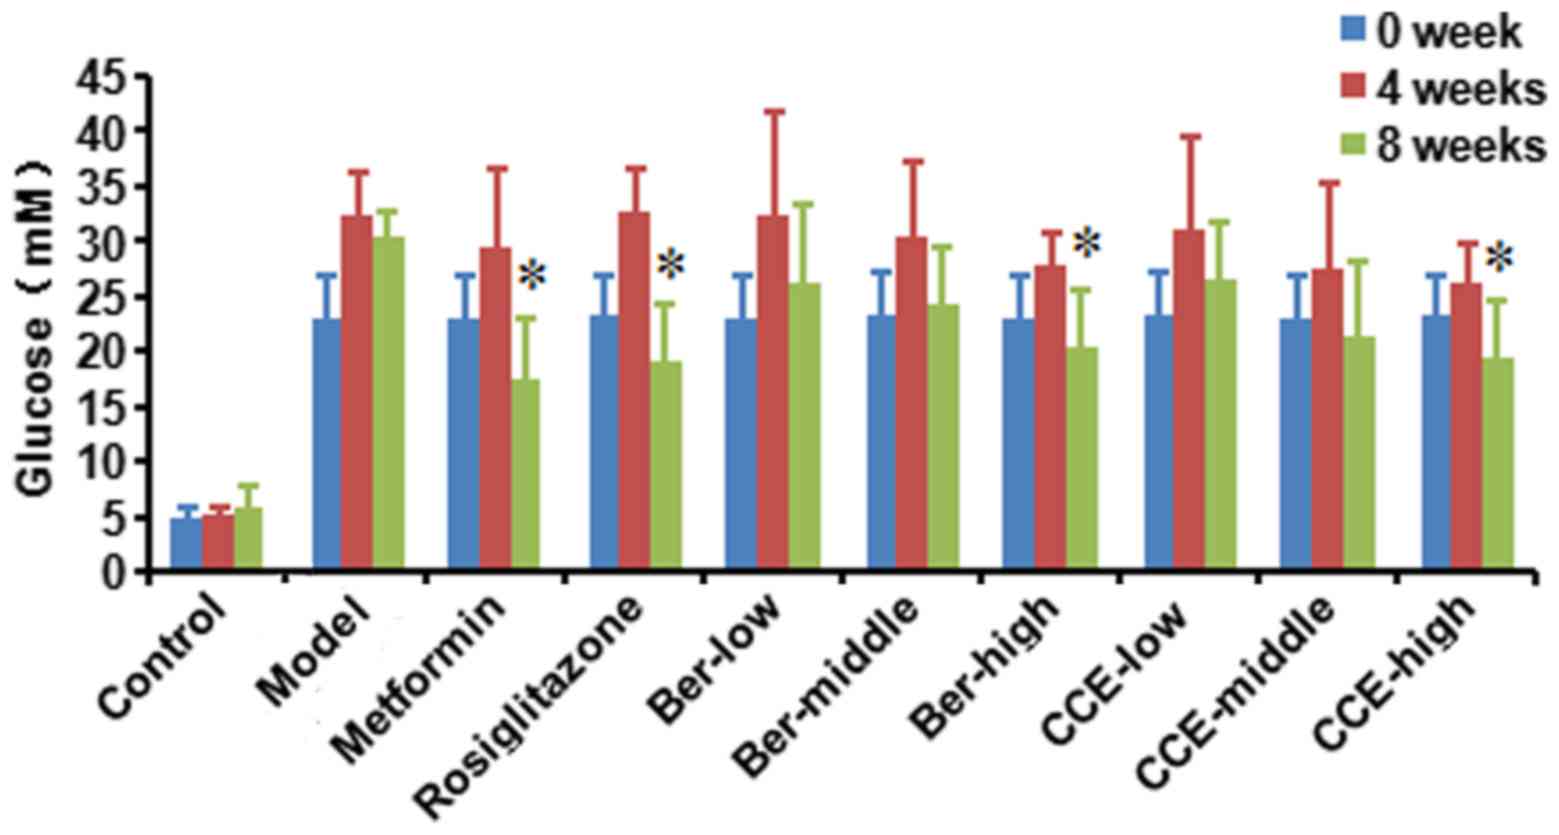
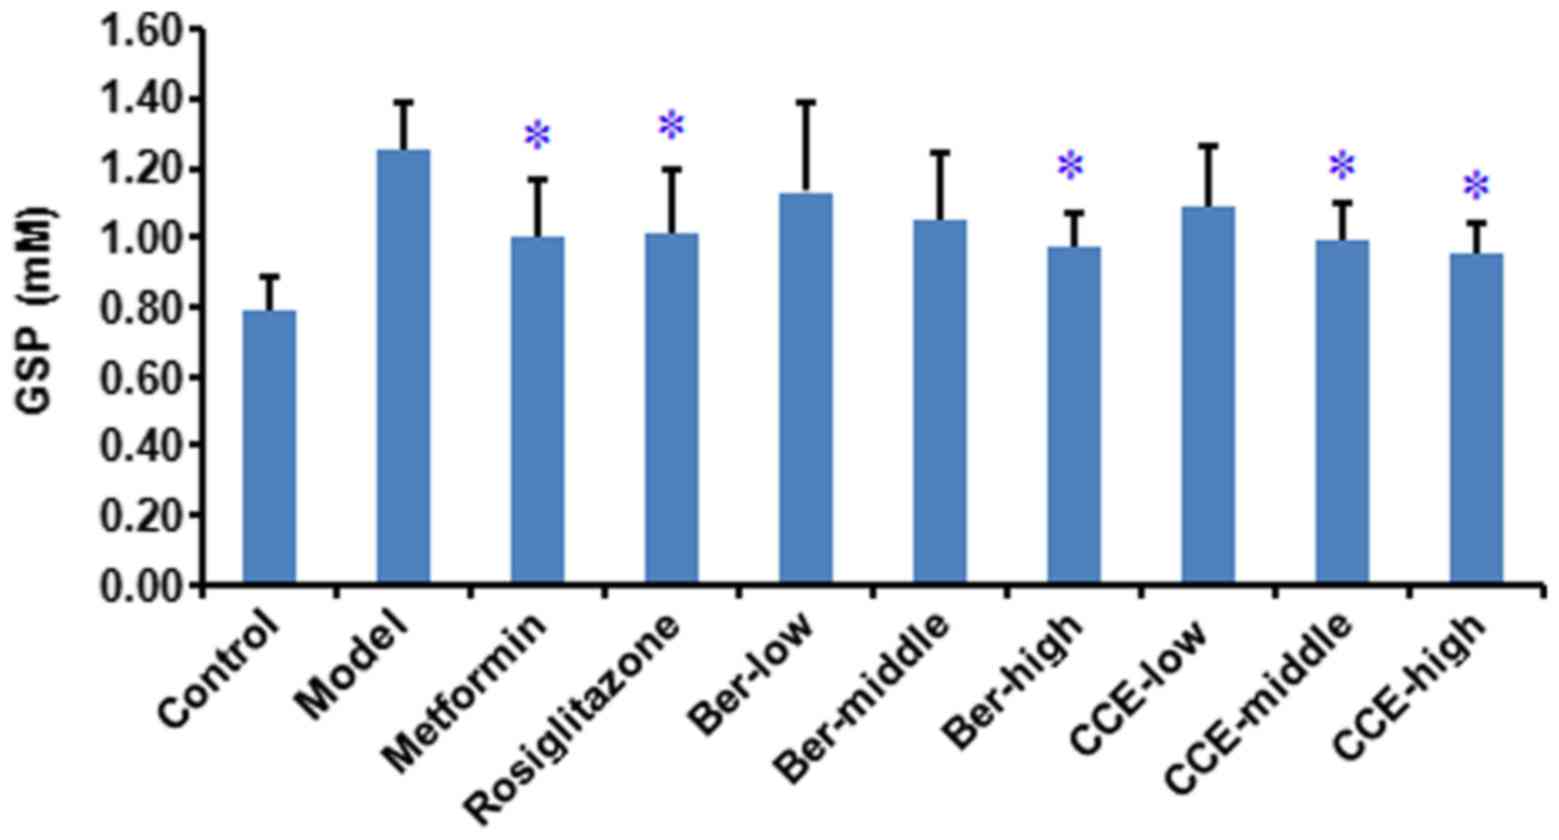
FBG and GSP
The FBG levels were measured in each group; the FBG
in the control group of normal rats was normal during the 8 weeks
at a range of 3.9–7.2 mM. The FBG levels in rats of the metformin
and rosiglitazone groups were 17.4 and 19.1 mM at 8 weeks, which
were significantly different, compared with the levels in the model
group rats (P<0.05). The FBG levels in the rats of the CCE-high
group and Ber-high group were 19.5 and 20.4 mM at 8 weeks, which
were also significantly different, compared with levels in the
model group rats (P<0.05). No differences in FBG were found in
the CCE-high group and Ber-high group, compared with the metformin
or rosiglitazone groups. The trend of FBG followed an initial
increase (4 weeks) and subsequent decrease (8 weeks), with the
exception of the control group. The decreases in FBG were
associated with the increased doses of the CCE and Ber (Fig. 3), and the decreases in GSP were
associated with the increased doses of CCE and Ber (Fig. 4).
Hyperinsulinemic-euglycemic clamp
test
It was found that the GIR of the model group rats
was significantly decreased, compared with the normal control
group, metformin group, Ber-high group and CCE-high group rats in
the hyperinsulinemic-euglycemic clamp experiment (P<0.01).
Following drug intervention with metformin, Ber or CCE, GIR was
significantly increased (P<0.01; Table III).
| Table III.Hyperinsulinemic-euglycemic clamp
test results of experimental groups. |
Table III.
Hyperinsulinemic-euglycemic clamp
test results of experimental groups.
| Group | n | Glucose (mM) | GIR
(mg·kg−1·min−1) |
|---|
| Control | 6 | 5.0±0.1 | 24.01±2.26a |
| Model | 6 | 4.9±0.2 | 9.45±1.47 |
| Metformin | 6 | 5.0±0.2 |
15.64±1.82a |
| Ber-high | 6 | 5.1±0.3 |
16.65±2.48a |
| CCE-high | 6 | 5.0±0.2 |
15.65±1.33a |
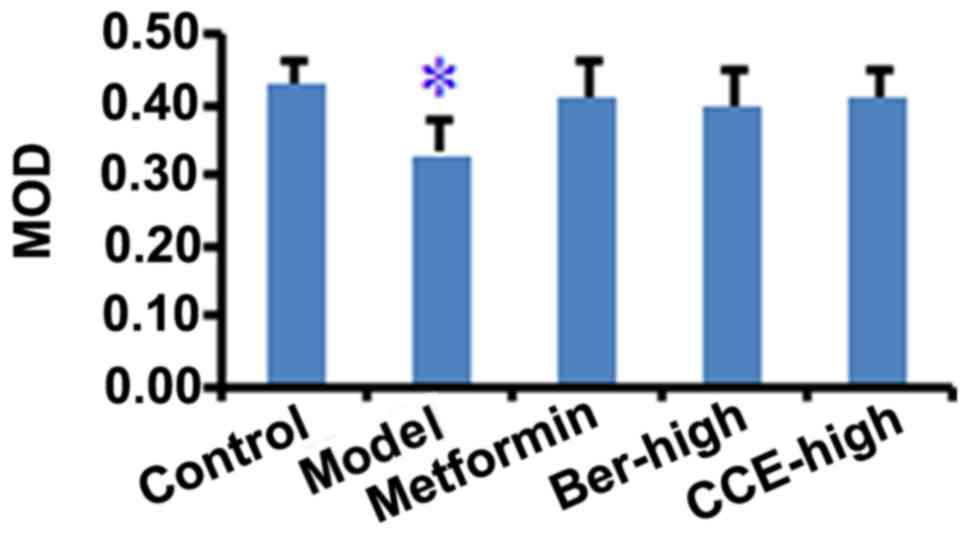
Pancreatic tissue
immunohistochemistry, insulin levels and FBCI
The INS results showed that, in the control group of
normal rats, pancreatic tissue was stained dark brown yellow in
color. The islet cells were expressed at a high level and were
diffuse in the central region of the pancreatic tissue. In the
model group rats, diffuse islet cells were observed in lower
number, compared with the normal group, and were brown in color.
The islet cells in the metformin, CCE-high group and Ber-high group
rats were distributed in the central region of the pancreatic
tissue and brown in color, the expression of which was high,
compared with that in the model group rats. The MOD values obtained
from each group were compared, and the lowest MOD was recorded in
the model group, which was significantly lower, compared with that
of the normal control group (P<0.05). Following intervention
with metformin, CCE or Ber, the MOD values were significantly
higher, compared with that in the model group (P<0.05), however,
no significant differences were found among the drug treatment
groups (Fig. 5).
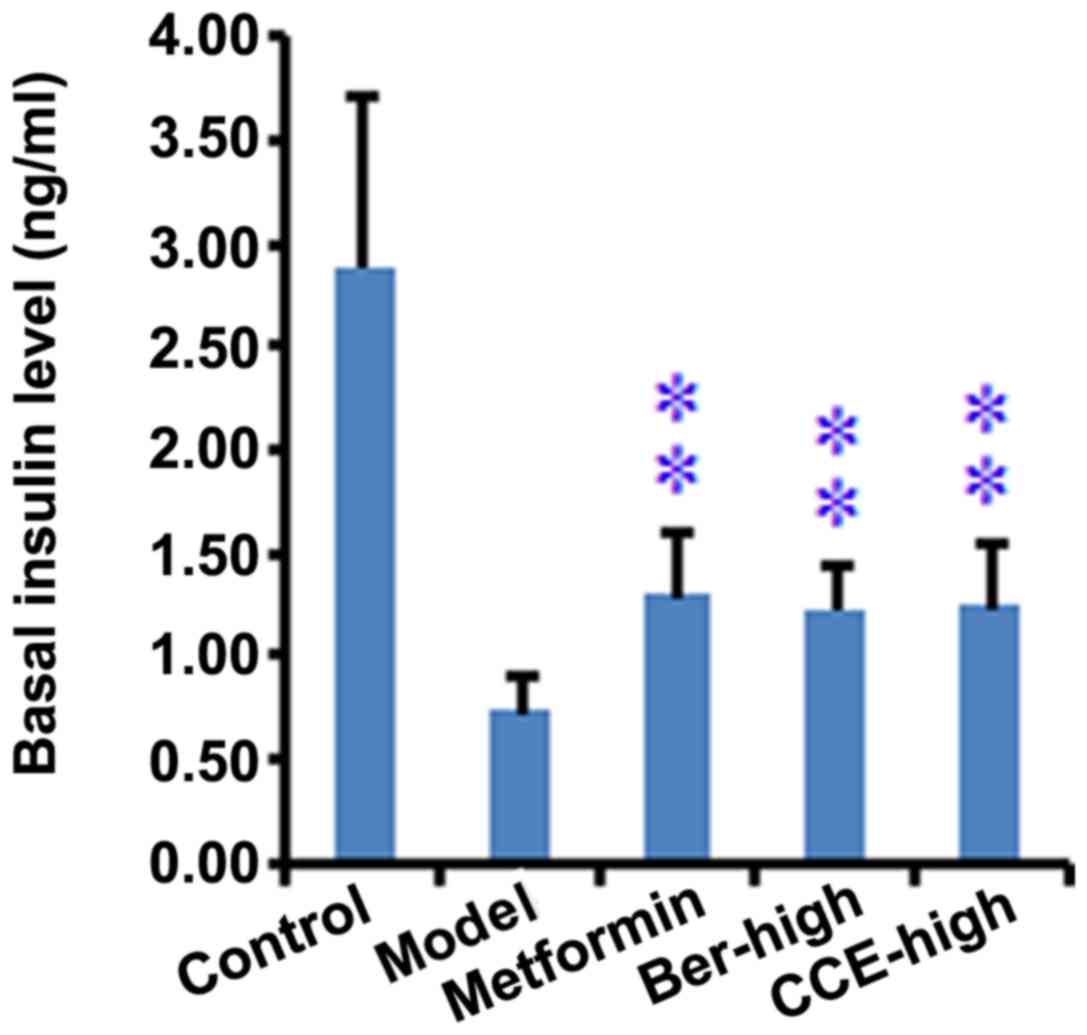
The basal insulin levels obtained from each group
were also compared, the lowest of which was present in the model
group rats (0.74±0.18), which was significantly (P<0.01) lower,
compared with that in the control group rats (2.89±0.82), and was
significantly higher, compared with those of the metformin, CCE or
Ber drug intervention groups (P<0.01). No significant
differences were found among three drug treatment groups (Fig. 6).
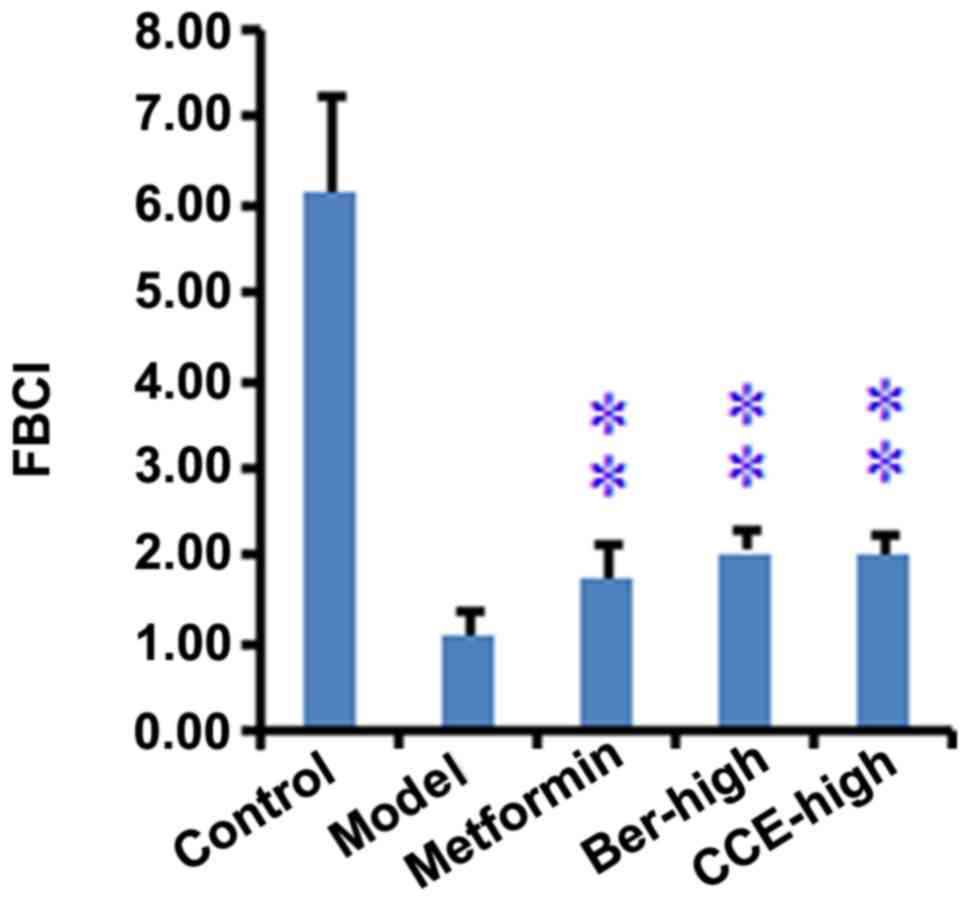
The FBCI values obtained from each group were also
compared, the lowest of which was present in the model group rats
(1.08±0.27), which was significantly (P<0.01) lower than that in
the control group rats (6.14±1.09), and was significantly higher,
compared with those in metformin, CCE or Berdrug intervention
groups (P<0.05). No significant differences were found among the
three drug treatment groups (Fig.
7).
Rin-5f cell survival rate assay using
MTT
According to the SR% formula, the SR% of Ber and CCE
were determined at doses of 2, 10, 50, 100, 250 and 500 µM,
respectively. The results are shown in Table IV. There was no effect on the
survival rate of Rin-5f cells treated with Ber and CCE up to 500
µM.
| Table IV.Effects of Ber and CCE on islet cell
proliferation inhibition rate. |
Table IV.
Effects of Ber and CCE on islet cell
proliferation inhibition rate.
|
| Ber (µM) | CCE (µM) |
|---|
|
|
|
|
|---|
| Factor | 5 | 20 | 100 | 500 | 5 | 20 | 100 | 500 | Control |
|---|
| Absorbance | 1.294±0.052 | 1.282±0.075 | 1.266±0.063 | 1.248±0.105 | 1.278±0.025 | 1.272±0.074 | 1.260±0.068 | 1.252±0.036 | 1.294±0.091 |
| SR (%) | 100.33 | 99.34 | 98.01 | 96.52 | 99.01 | 98.51 | 97.52 | 96.85 | 100.00 |
GSIS test on Rin-5f cells
The GSIS of Ber and CCE were determined at doses of
5, 20, 100, 150 and 250 µM (Table
V). The results showed that Ber and CCE increased GSIS of the
Rin-5f cells at a dose of 100 µM (P<0.05), compared with the
control group. Ber and CCE promoted the secretion of insulin,
however, this was to a lesser degree, compared with that of
glibenclamide.
| Table V.Glucose-stimulated insulin release
test of Rin-5f cells treated with Ber and CCE at doses of 5–250
µM. |
Table V.
Glucose-stimulated insulin release
test of Rin-5f cells treated with Ber and CCE at doses of 5–250
µM.
|
|
| Insulin release
index |
|---|
|
|
|
|
|---|
| Group | Dose (µM) | Ber | CCE |
|---|
| Control | – | 0.98±0.03 | 0.98±0.03 |
| Glibenclamide | 10 | 1.45±0.05 | 1.45±0.05 |
| Ber/CCE | 5 | 1.11±0.05 | 1.15±0.05 |
|
| 20 | 1.21±0.04 | 1.25±0.04 |
|
| 100 |
1.32±0.06a |
1.37±0.06a |
|
| 150 | 1.15±0.05 | 1.19±0.05 |
|
| 250 | 1.06±0.03 | 1.08±0.03 |
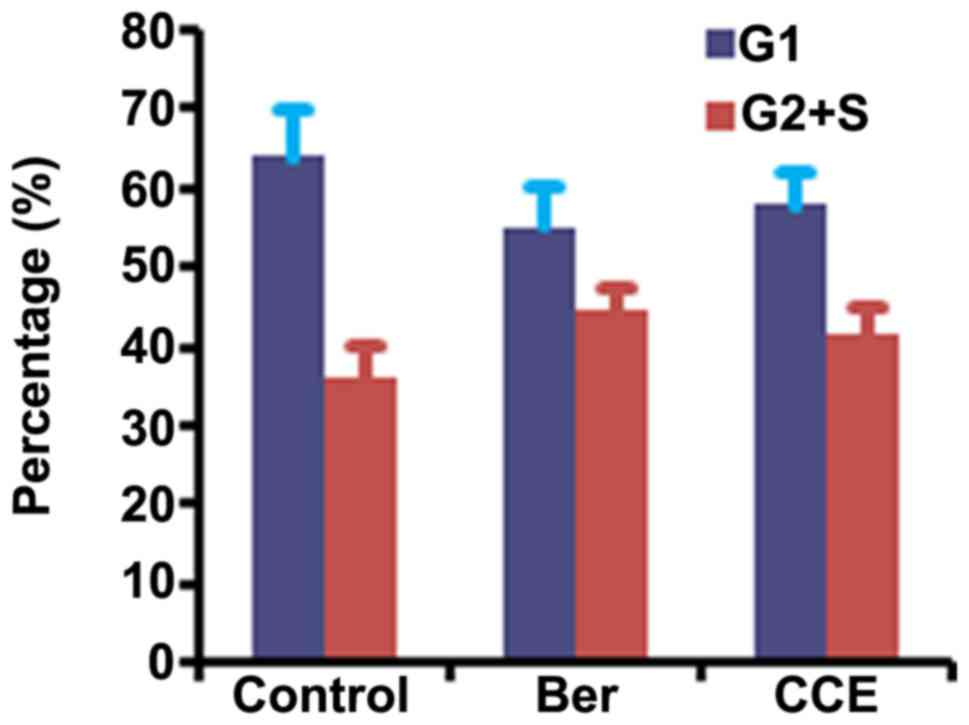
Analysis of Rin-5f cell cycle
Following analysis of the cell cycle induced by 0.25
mM FFA prior to Ber and CCE, the G1 stage of the Rin-5f cell cycle
was decreased, whereas the G2 and S cell cycle stages were
increased (Fig. 8). No significant
differences were found between the control group and Ber or CCE
group.
Effects of Ber and CCE on lipotoxic
islet cell proliferation
An MTT assay was used to examine the effects of Ber
and CCE on lipotoxic islet cell proliferation. The PIR was
determined in each group (Table
VI), which was decreased significantly by Ber and CCE at doses
of 100 µM, compared with that in the control group (P<0.05). The
effect of Beronlipotoxic islet cell proliferation was with
dose-dependent at the dose range of 2–500 µM.
| Table VI.Proliferation inhibition rate of Ber
and CCE on lipotoxic islet cell proliferation. |
Table VI.
Proliferation inhibition rate of Ber
and CCE on lipotoxic islet cell proliferation.
| Dose (µM) | Ber survival rate
(%) | CCE survival rate
(%) | Control survival
rate (%) |
|---|
| 2 | 55.6±4.8 | 53.5±5.4 |
|
| 10 | 46.8±5.4 | 42.9±3.8 |
|
| 50 | 45.6±3.9 | 40.4±4.2 | 54.3±4.25 |
| 100 |
40.2±4.5a |
36.9±4.25a |
|
| 250 | 49.8±5.2 | 45.4±4.0 |
|
| 500 | 54.6±4.9 | 49.9±4.3 |
|
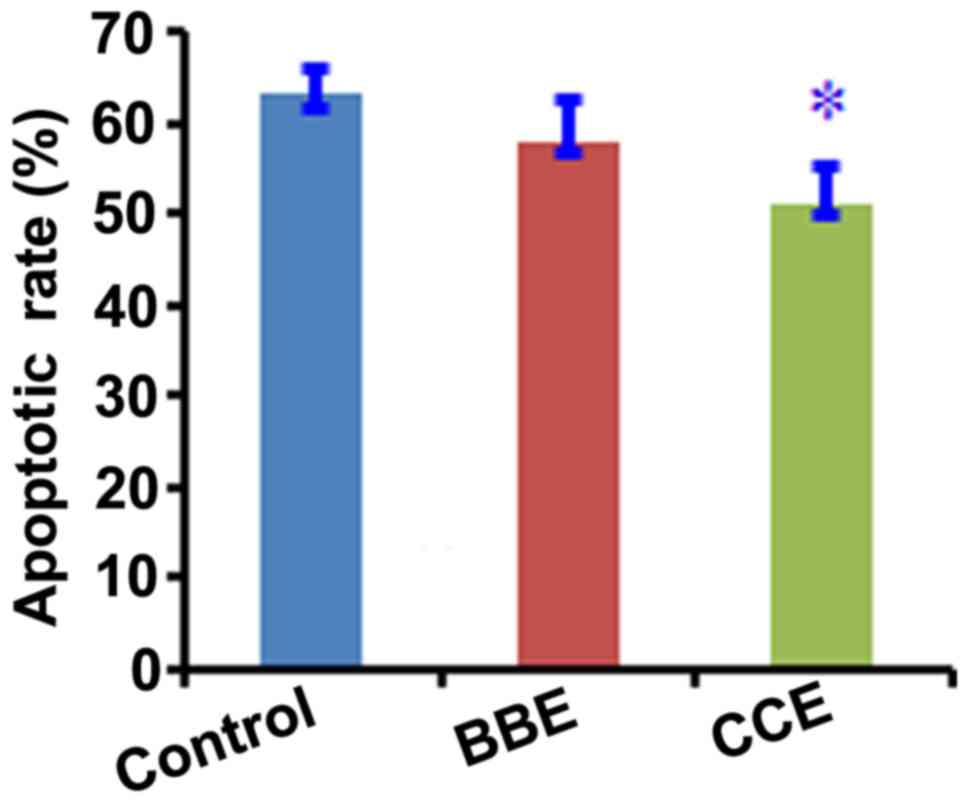
Determination apoptosis of Rin-5f
cells
Following induction of the Rin-5f cells with 0.10,
0.25 and 0.5 mM FFA for 24 h, the apoptosis of Rin-5f cells was
examined at each period of time under a microscope. The cohest
staining in the 0.5 mM FFA-induced group showed cell shrinkage into
a round or oval shape, synapses had disappeared, cells were
floating or suspended in medium with loss of adherent growth, and a
large number of vacuoles were apparent with no visible nuclei. In
the 0.25 mM FFA-induced group, there was partial cell shrinkage and
adherent growth, and nuclei were visible. The numbers of apoptotic
cells in each group were increased with increasing dose and time.
The apoptosis of Rin-5f cells was determined using a Annexin
V/FITC/PI double-labeled kit and flow cytometry to obtain the
proportion of apoptotic Rin-5f cells in each group (Fig. 9). No significant difference in the
proportions of apoptotic ßRin-5f cells were observed in the groups
at 6 h, however, apoptosis was significantly decreased following
treatment with Ber or CCE at a dose of 100 µM for 24 h. There was a
significant difference between the CCE group and control group
(P<0.05).
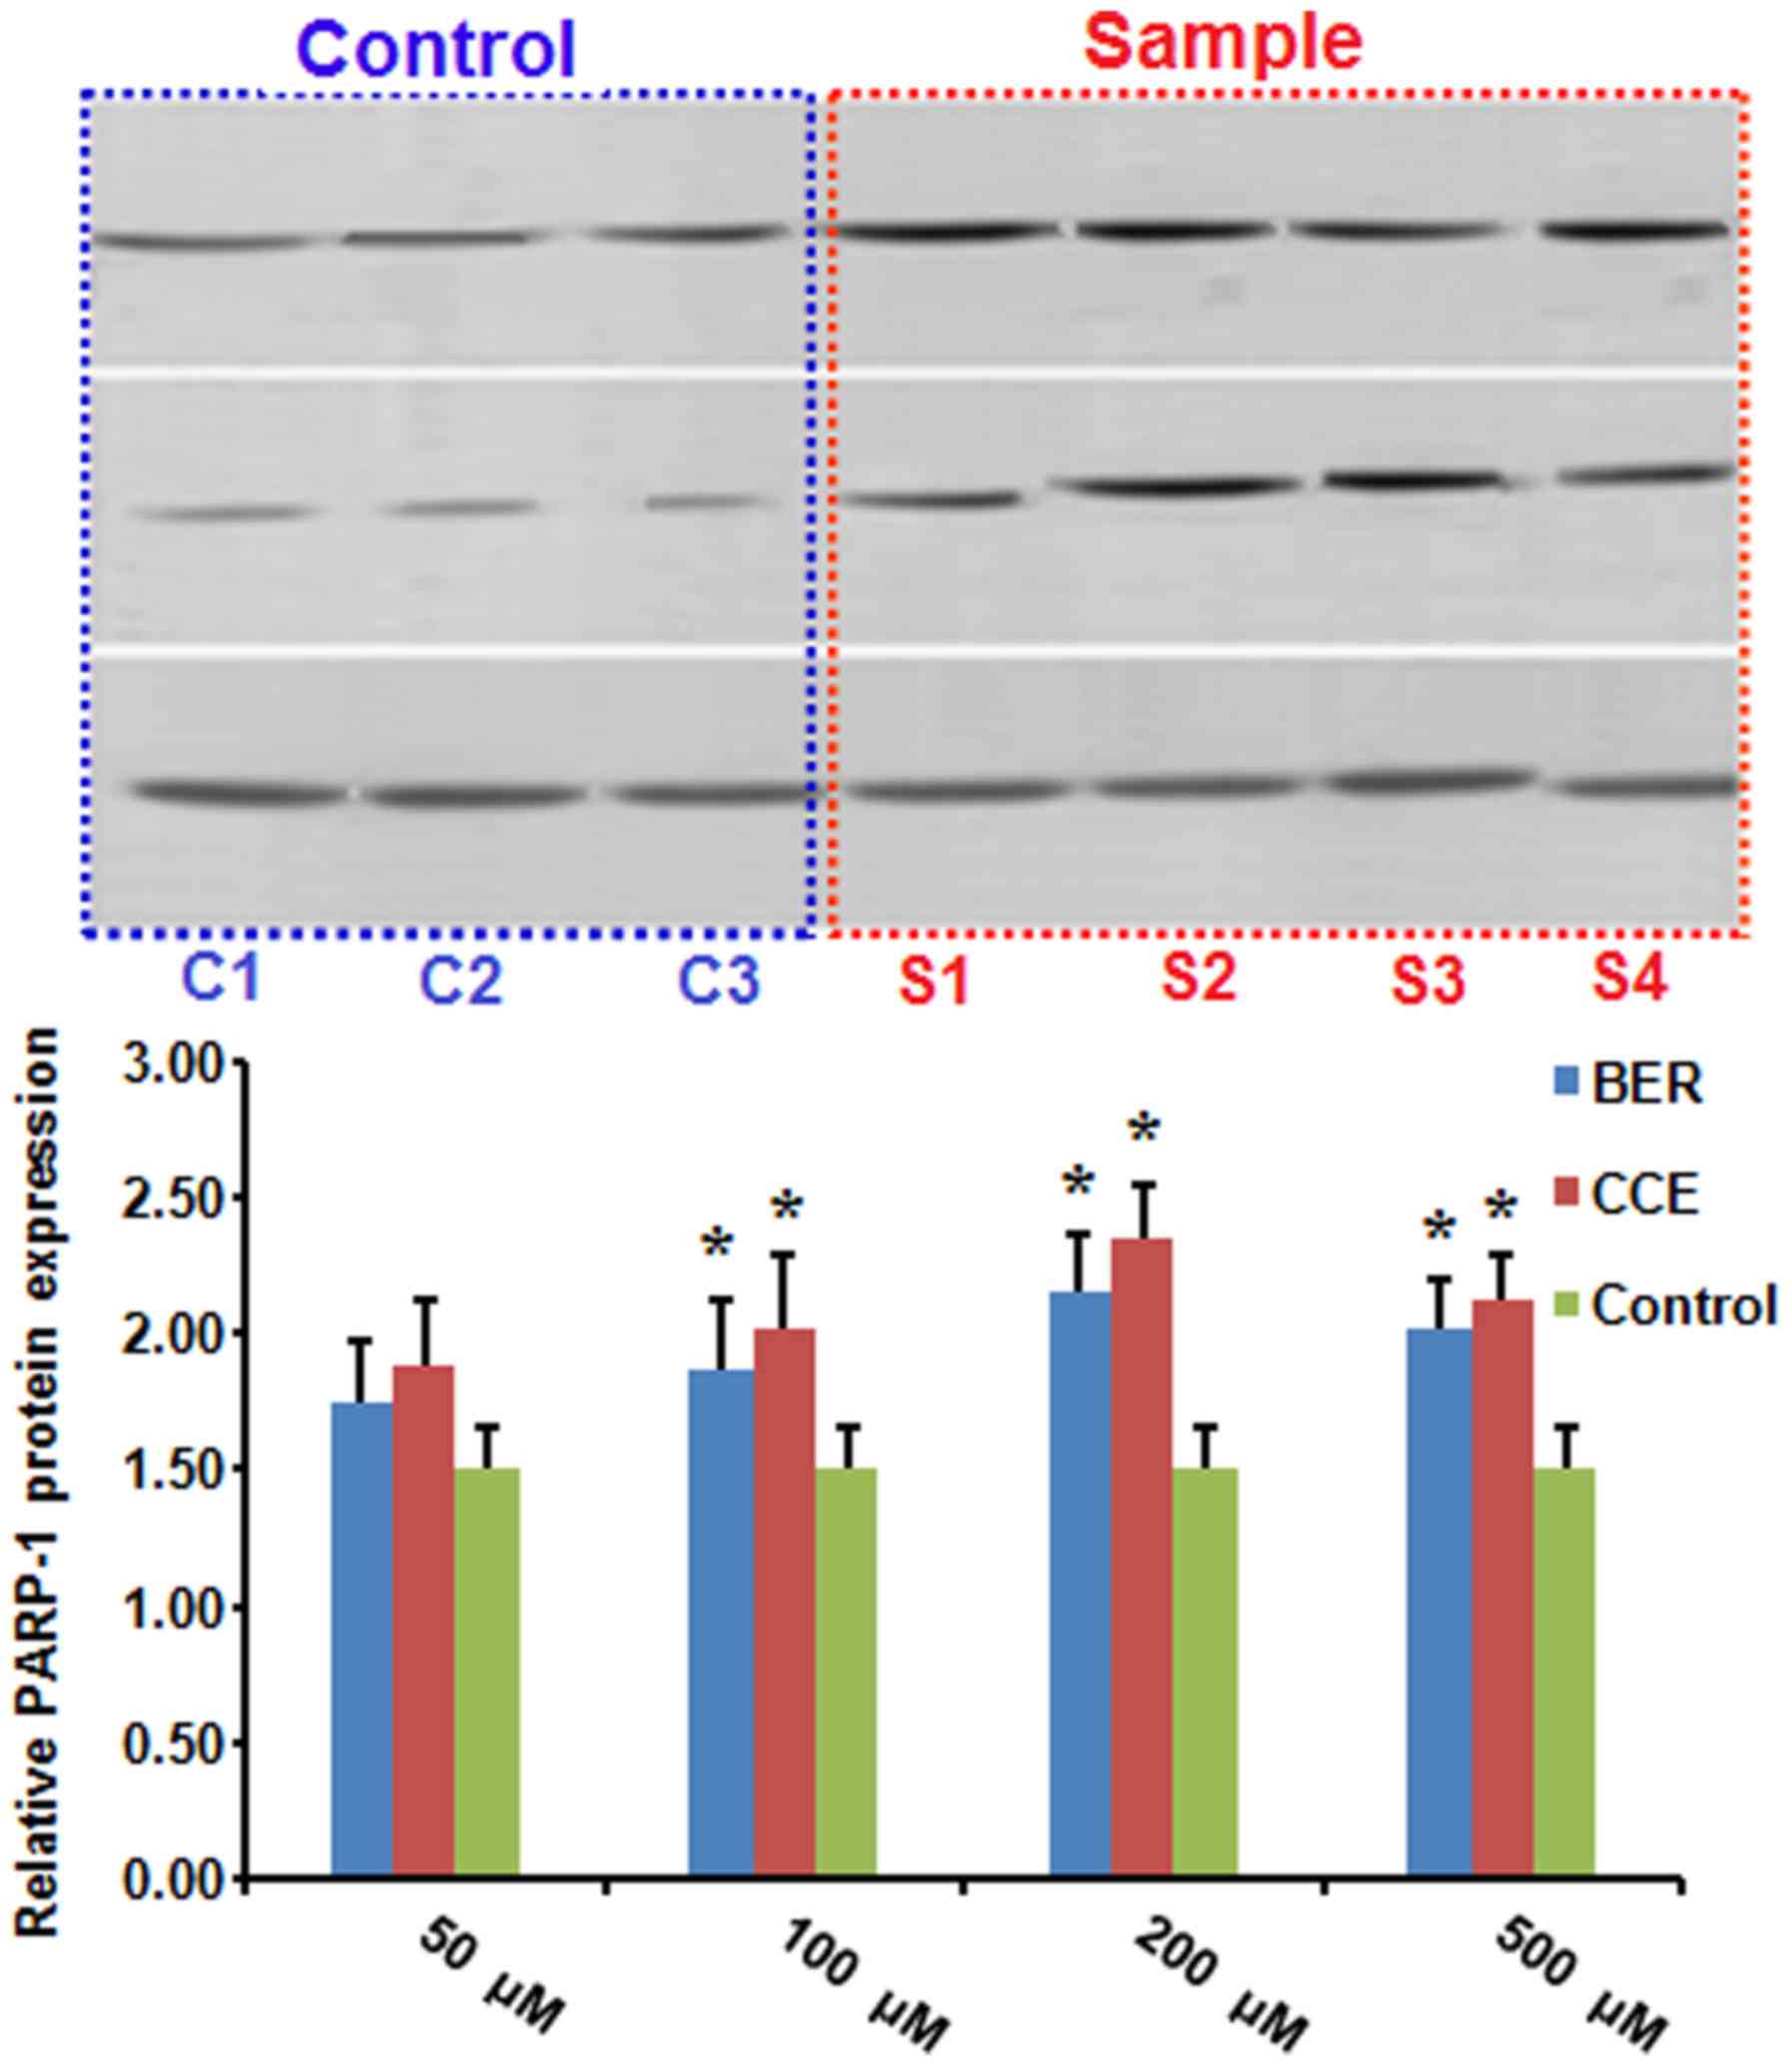
Effects on islet cell protein
expression of PARP-1
For each group, the grayscale of the protein
expression of PARP-1was plotted for the Rin-5f cells at 24 h
(Fig. 10), which revealed higher
gray values in the sample groups, compared with the control group.
The relative protein expression was determined and compared between
the sample group and control group. The protein expression levels
were significantly increased in the Ber and CCE groups at doses of
100, 200 and 500 µM. The dose of 200 µM had a more marked effect,
compared with the other doses.
Discussion
The present study developed a simple preparation
method to obtain CCE with a purity of 96.07% for alkaloids from
Coptischinensis Franch. The systematic pharmacological
function of the anti-DM treatments of Ber and CCE were investigated
using a T2MD rat model and the Rin-5f cell line. When CCE was used
to treat T2DM rats and compared with Berat 8 weeks, the FBG of the
rats was reduced. No significant differences were found between Ber
or CCE and metformin or rosiglitazone; the FBG and GSP values were
decreased significantly in all of the drug groups with
dose-dependence. Ber and CCE increased GIR via improving insulin
secretion.
When Ber and CCE were used to examine their effects
on Rin-5f cells no toxicity towards the Rin-5f cells was observed;
IRI and GSIS were increased, cell cycle was altered showing a
decrease in G1 and an increase in G2+S. Ber and CCE exhibited a
protective effect on lipotoxic islet cell proliferation, which was
associated with the increased protein expression of PARP-1. CCE was
more effective than Ber on altering the protein expression of
PARP-1.
In conclusion, CCE and Ber possessed similar
efficacies in the treatment of T2MD rats, the effects of which may
have occurred through stimulating the pancreatic secretion of
insulin, which may be associated with their protective role on
islet β-cells by increasing islet β-cell proliferation and the
protein expression of PARP-1.
Acknowledgements
The present study was supported by the Technology
Major Projects for Major New Drugs Innovation and Development
(grant no. 2011ZX09102-011-08), the National Basic Research Program
(973 Program; grant no. 2010CB530601), the National Nature Science
Foundation of China (grant no. 81541083) and the Science Foundation
of China Academy of Chinese Medical Science (grant no.
ZZ0708074).
References
|
1
|
Mao T, Yan Q, Zhou F and Shen YZ:
Isolation and identification of berberine from cell cultures of
Coptis chinensis. Chin J Biotechnol. 13:193–199. 1997.PubMed/NCBI
|
|
2
|
Ríos JL, Francini F and Schinella GR:
Natural products for the treatment of Type 2 diabetes mellitus.
Planta Med. 81:975–994. 2015. View Article : Google Scholar : PubMed/NCBI
|
|
3
|
Sun SF, Zhao TT, Zhang HJ, Huang XR, Zhang
WK, Zhang L, Yan MH, Dong X, Wang H, Wen YM, et al: Renoprotective
effect of berberine on type 2 diabetic nephropathy in rats. Clin
Exp Pharmacol Physiol. 42:662–670. 2015. View Article : Google Scholar : PubMed/NCBI
|
|
4
|
Di Pierro F, Bellone I, Rapacioli G and
Putignano P: Clinical role of a fixed combination of standardized
Berberis aristata and Silybum marianum extracts in diabetic and
hypercholesterolemic patients intolerant to statins. Diabetes Metab
Syndr Obes. 8:89–96. 2015. View Article : Google Scholar : PubMed/NCBI
|
|
5
|
Chang W, Chen L and Hatch GM: Berberine as
a therapy for type 2 diabetes and its complications: From mechanism
of action to clinical studies. Biochem Cell Biol. 93:479–486. 2015.
View Article : Google Scholar : PubMed/NCBI
|
|
6
|
Lan J, Zhao Y, Dong F, Yan Z, Zheng W, Fan
J and Sun G: Meta-analysis of the effect and safety of berberine in
the treatment of type 2 diabetes mellitus, hyperlipemia and
hypertension. J Ethnopharmacol. 161:69–81. 2015. View Article : Google Scholar : PubMed/NCBI
|
|
7
|
Dong Y, Chen YT, Yang YX, Zhou XJ, Dai SJ,
Tong JF, Shou D and Li C: Metabolomics study of type 2 diabetes
mellitus and the antidiabetic effect of berberine in zucker
diabetic fatty rats using Uplc-ESI-Hdms. Phytother Res. 30:823–828.
2016. View
Article : Google Scholar : PubMed/NCBI
|
|
8
|
Yi Q, He XE, Luo KF, Zhang GS, Liu YH, Xue
Q, Hou N, Chen WL and Luo JD: Protection of long-term treatment
with huang-lian-jie-du-tang on vascular endothelium in rats with
type 2 diabetes mellitus. Curr Ther Res Clin Exp. 73:174–185. 2012.
View Article : Google Scholar : PubMed/NCBI
|
|
9
|
Li CB, Li XX, Chen YG, Gao HQ, Bu PL,
Zhang Y and Ji XP: Huang-lian-jie-du-tang protects rats from
cardiac damages induced by metabolic disorder by improving
inflammation-mediated insulin resistance. PLoS One. 8:e675302013.
View Article : Google Scholar : PubMed/NCBI
|
|
10
|
Wu JS, Shi R, Lu X, Ma YM and Cheng NN:
Combination of active components of Xiexin decoction ameliorates
renal fibrosis through the inhibition of NF-κB and TGF-β1/Smad
pathways in db/db diabetic mice. PLoS One. 10:e01226612015.
View Article : Google Scholar : PubMed/NCBI
|
|
11
|
Yang Z, Wang L, Zhang F and Li Z:
Evaluating the antidiabetic effects of Chinese herbal medicine:
Xiao-Ke-An in 3T3-L1 cells and KKAy mice using both conventional
and holistic omics approaches. BMC Complement Altern Med.
15:2722015. View Article : Google Scholar : PubMed/NCBI
|
|
12
|
Chang YX, Ge AH, Donnapee S, Li J, Bai Y,
Liu J, He J, Yang X, Song LJ, Zhang BL and Gao XM: The
multi-targets integrated fingerprinting for screening anti-diabetic
compounds from a Chinese medicine Jinqi Jiangtang Tablet. J
Ethnopharmacol. 164:210–222. 2015. View Article : Google Scholar : PubMed/NCBI
|
|
13
|
Zarei A, Changizi-Ashtiyani S, Taheri S
and Ramezani M: A quick overview on some aspects of
endocrinological and therapeutic effects of Berberis vulgaris L.
Avicenna J Phytomed. 5:485–497. 2015.PubMed/NCBI
|
|
14
|
Pang B, Zhao LH, Zhou Q, Zhao TY, Wang H,
Gu CJ and Tong XL: Application of berberine on treating type 2
diabetes mellitus. Int J Endocrinol. 2015:9057492015. View Article : Google Scholar : PubMed/NCBI
|
|
15
|
Pang B, Yu XT, Zhou Q, Zhao TY, Wang H, Gu
CJ and Tong XL: Effect of rhizoma coptidis (Huang Lian) on treating
diabetes mellitus. Evid Based Complement Alternat Med.
2015:9214162015. View Article : Google Scholar : PubMed/NCBI
|
|
16
|
Li F, Zhao YB, Wang DK, Zou X, Fang K and
Wang KF: Berberine relieves insulin resistance via the cholinergic
anti-inflammatory pathway in HepG2 cells. J Huazhong Univ Sci
Technolog Med Sci. 36:1–69. 2016. View Article : Google Scholar : PubMed/NCBI
|
|
17
|
Geng FH, Li GH, Zhang X, Zhang P, Dong MQ,
Zhao ZJ, Zhang Y, Dong L and Gao F: Berberine improves mesenteric
artery insulin sensitivity through up-regulating insulin
receptor-mediated signaling in diabetic rats. Br J Pharmacol.
173:1569–1579. 2016. View Article : Google Scholar : PubMed/NCBI
|
|
18
|
Lu L, Zhijian H, Lei L, Wenchuan C and
Zhimin Z: Berberine in combination with insulin has additive
effects on titanium implants osseointegration in diabetes mellitus
rats. Evid Based Complement Alternat Med. 2015:8242592015.
View Article : Google Scholar : PubMed/NCBI
|
|
19
|
Yu Y, Hao G, Zhang Q, Hua W, Wang M, Zhou
W, Zong S, Huang M and Wen X: Berberine induces GLP-1 secretion
through activation of bitter taste receptor pathways. Biochem
Pharmacol. 97:173–177. 2015. View Article : Google Scholar : PubMed/NCBI
|
|
20
|
Zhou J, Du X, Long M, Zhang Z, Zhou S,
Zhou J and Qian G: Neuroprotective effect of berberine is mediated
by MAPK signaling pathway in experimental diabetic neuropathy in
rats. Eur J Pharmacol. 774:87–94. 2016. View Article : Google Scholar : PubMed/NCBI
|
|
21
|
Tang LQ, Ni WJ, Cai M, Ding HH, Liu S and
Zhang ST: The renoprotective effects of berberine and its potential
impact on the expression of β-arrestins and ICAM-1/VCAM-1 in
streptozocin induced-diabetic nephropathy rats. J Diabetes.
November 3–2015.(Epub ahead of print).
|
|
22
|
Friedemann T, Schumacher U, Tao Y, Leung
AK and Schröder S: Neuroprotective activity of coptisine from
coptis Chinensis (Franch). Evid Based Complement Alternat Med.
2015:8273082015. View Article : Google Scholar : PubMed/NCBI
|
|
23
|
Zhang X, Zhao Y, Xu J, Xue Z, Zhang M,
Pang X, Zhang X and Zhao L: Modulation of gut microbiota by
berberine and metformin during the treatment of high-fat
diet-induced obesity in rats. Sci Rep. 5:144052015. View Article : Google Scholar : PubMed/NCBI
|
|
24
|
Xie W, Gu D, Li J, Cui K and Zhang Y:
Effects and action mechanisms of berberine and Rhizoma coptidis on
gut microbes and obesity in high-fat diet-fed C57BL/6J mice. PLoS
One. 6:e245202011. View Article : Google Scholar : PubMed/NCBI
|
|
25
|
Wu X, Li Y, Wang Q, Li W and Feng Y:
Effects of berberine and pomegranate seed oil on plasma
phospholipid metabolites associated with risks of type 2 diabetes
mellitus by U-HPLC/Q-TOF-MS. J Chromatogr B Analyt Technol Biomed
Life Sci. 1007:110–120. 2015. View Article : Google Scholar : PubMed/NCBI
|
|
26
|
Chang W, Li K, Guan F, Yao F, Yu Y, Zhang
M, Hatch GM and Chen L: Berberine pretreatment confers
cardioprotection against ischemia-reperfusion injury in a rat model
of type 2 diabetes. J Cardiovasc Pharmacol Ther. 21:486–494. 2016.
View Article : Google Scholar : PubMed/NCBI
|
|
27
|
Dai P, Wang J, Lin L, Zhang Y and Wang Z:
Renoprotective effects of berberine as adjuvant therapy for
hypertensive patients with type 2 diabetes mellitus: Evaluation via
biochemical markers and color Doppler ultrasonography. Exp Ther
Med. 10:869–876. 2015. View Article : Google Scholar : PubMed/NCBI
|
|
28
|
Chang W, Zhang M, Meng Z, Yu Y, Yao F,
Hatch GM and Chen L: Berberine treatment prevents cardiac
dysfunction and remodeling through activation of 5′-adenosine
monophosphate-activated protein kinase in type 2 diabetic rats and
in palmitate-induced hypertrophic H9c2 cells. Eur J Pharmacol.
769:55–63. 2015. View Article : Google Scholar : PubMed/NCBI
|
|
29
|
Jiang SJ, Dong H, Li JB, Xu LJ, Zou X,
Wang KF, Lu FE and Yi P: Berberine inhibits hepatic gluconeogenesis
via the LKB1-AMPK-TORC2 signaling pathway in streptozotocin-induced
diabetic rats. World J Gastroenterol. 21:7777–7785. 2015.
View Article : Google Scholar : PubMed/NCBI
|
|
30
|
Jhong CH, Riyaphan J, Lin SH, Chia YC and
Weng CF: Screening alpha-glucosidase and alpha-amylase inhibitors
from natural compounds by molecular docking in silico. Biofactors.
41:242–251. 2015. View Article : Google Scholar : PubMed/NCBI
|
|
31
|
Chang W, Chen L and Hatch GM: Berberine
treatment attenuates the palmitate-mediated inhibition of glucose
uptake and consumption through increased 1,2,3-triacyl-sn-glycerol
synthesis and accumulation in H9c2 cardiomyocytes. Biochim Biophys
Acta. 1864:352–362. 2016. View Article : Google Scholar
|
|
32
|
Pirillo A and Catapano AL: Berberine, a
plant alkaloid with lipid- and glucose-lowering properties: From in
vitro evidence to clinical studies. Atherosclerosis. 243:449–461.
2015. View Article : Google Scholar : PubMed/NCBI
|
|
33
|
Xue M, Zhang L, Yang MX, Zhang W, Li XM,
Ou ZM, Li ZP, Liu SH, Li XJ and Yang SY: Berberine-loaded solid
lipid nanoparticles are concentrated in the liver and ameliorate
hepatosteatosis in db/db mice. Int J Nanomedicine. 10:5049–5057.
2015. View Article : Google Scholar : PubMed/NCBI
|
|
34
|
Zhang Y, Chang X, Song X, Chen C, Chen H,
Lu Z, Gao X and Lu D: Berberine reverses abnormal expression of
L-type pyruvate kinase by DNA demethylation and histone acetylation
in the livers of the non-alcoholic fatty disease rat. Int J Clin
Exp Med. 8:7535–7543. 2015.PubMed/NCBI
|
|
35
|
Zhang J, Tang H, Deng R, Wang N, Zhang Y,
Wang Y, Liu Y, Li F, Wang X and Zhou L: Berberine suppresses
adipocyte differentiation via decreasing Creb transcriptional
activity. PLoS One. 10:e01256672015. View Article : Google Scholar : PubMed/NCBI
|
|
36
|
Wang Z, Wu J, Zhou Q, Wang Y and Chen T:
Berberine nanosuspension enhances hypoglycemic efficacy on
streptozotocin induced diabetic C57BL/6 mice. Evid Based Complement
Alternat Med 2015. 2397492015.
|
|
37
|
Liu C, Wang Z, Song Y, Wu D, Zheng X, Li
P, Jin J, Xu N and Li L: Effects of berberine on amelioration of
hyperglycemia and oxidative stress in high glucose and high fat
diet-induced diabetic hamsters in vivo. Biomed Res Int.
2015:3138082015.PubMed/NCBI
|
|
38
|
Cui E, Zhi X, Chen Y, Gao Y, Fan Y, Zhang
W, Ma W, Hou W, Guo C and Song X: Coptis chinensis and myrobalan
(Terminalia chebula) can synergistically inhibit inflammatory
response in vitro and in vivo. Evid Based Complement Alternat Med.
2014:5101572014. View Article : Google Scholar : PubMed/NCBI
|
|
39
|
Wang O, Cai K, Pang S, Wang T, Qi D, Zhu
Q, Ni Z and Le Y: Mechanisms of glucose-induced expression of
pancreatic-derived factor in pancreatic beta-cells. Endocrinology.
149:672–680. 2008. View Article : Google Scholar : PubMed/NCBI
|
|
40
|
Gastaldelli A, Ferrannini E, Miyazaki Y,
Matsuda M, Mari A and DeFronzo RA: Thiazolidinediones improve
beta-cell function in type 2 diabetic patients. Am J Physiol
Endocrinol Metab. 292:E871–E883. 2007. View Article : Google Scholar : PubMed/NCBI
|
|
41
|
Guardado-Mendoza R, Davalli AM, Chavez AO,
Hubbard GB, Dick EJ, Majluf-Cruz A, Tene-Perez CE, Goldschmidt L,
Hart J, Perego C, et al: Pancreatic islet amyloidosis, beta-cell
apoptosis, and alpha-cell proliferation are determinants of islet
remodeling in type-2 diabetic baboons. Proc Natl Acad Sci USA.
106:13992–13997. 2009; View Article : Google Scholar : PubMed/NCBI
|
|
42
|
Andreone T, Meares GP, Hughes KJ, Hansen
PA and Corbett JA: Cytokine-mediated β-cell damage in
PARP-1-deficient islets. Am J Physiol Endocrinol Metab.
303:E172–E179. 2012. View Article : Google Scholar : PubMed/NCBI
|
|
43
|
Radzi SF Muhd, Rückert C, Sam SS, Teoh BT,
Jee PF, Phoon WH, Abubakar S and Zandi K: Detection of Langat virus
by TaqMan real-time one-step qRT-PCR method. Sci Rep. 5:140072015.
View Article : Google Scholar : PubMed/NCBI
|
|
44
|
Livak KJ and Schmittgen TD: Analysis of
relative gene expression data using real-time quantitative PCR and
the 2(-Delta Delta C(T)) method. Methods. 25:402–408. 2001.
View Article : Google Scholar : PubMed/NCBI
|