Introduction
Childhood obesity is a prevalent disease worldwide
(1)and has been recognized as a
serious public health concern due to its increasing morbidity in
addition to adverse health effects (2). Compared with normal-weight children,
obese children have an increased probability of obesity in
adulthood (3), which may lead to
hypertension, diabetes, dyslipidemia, chronic heart disease and
other disorders (4). In addition,
the prevalence of depression in obese children is greater than
those of normal-weight children (5).
Obesity in children is a multifactorial disease, to
which numerous genetic factors contribute (6). Previous genetic studies have
identified that the mutation in melanocortin-4 receptor
(MC4R) is associated with childhood obesity through binding
with α-melanocyte-stimulating hormone (α-MSH). It has been
identified that α-MSH could inhibit feeding, thus leading to an
increasing risk of obesity (7–10). A
missense amino acid substitution (R236G) has been reported
to contribute to an inherited susceptibility to obesity. The
R236G mutation contributes to an aberrant fusion protein,
which is capable of interfering with central melanocortin signaling
and appears to increase the risk of early-onset obesity (11–13).
The fat mass and obesity associated gene has been recognized as
another gene relevant to childhood obesity by influencing appetite
and body composition (14,15). However, the effective approaches of
preventing obesity development in children remain limited and
further studies of the molecular mechanisms are required.
The aim of the present study was to identify
potential biomarkers of childhood obesity. Furthermore, the current
study aimed to elucidate the molecular mechanism for the therapy of
childhood obesity. The significant differentially expressed genes
(DEGs) in omental adipose tissues were screened by comparison of
samples between obese and normal-weight children with two-way
hierarchical clustering, co-expression (CE) analysis and gene
network construction. The notable amino acids were identified by
measuring of codon usage bias.
Materials and methods
Source of data
The microarray expression profile of GSE9624
(http://www.ncbi.nlm.nih.gov/geo/query/acc.cgi?acc=GSE9624)
was extracted from the Gene Expression Omnibus database, based on
the Affymetrix Human Genome U133 Plus 2.0 Array GPL570
(HG-U133_Plus_2). The data used was originally from 11 samples of
omental adipose tissues, with 5 from obese children and 6 from
normal-weight children.
Data preprocessing and DEGs
analysis
The probe-level data in the CEL files were converted
into expression measures using the Affy package (version 1.48.0)
(16) with R software (https://www.r-project.org/). Missing data were
inputted and data normalization was performed using quartile
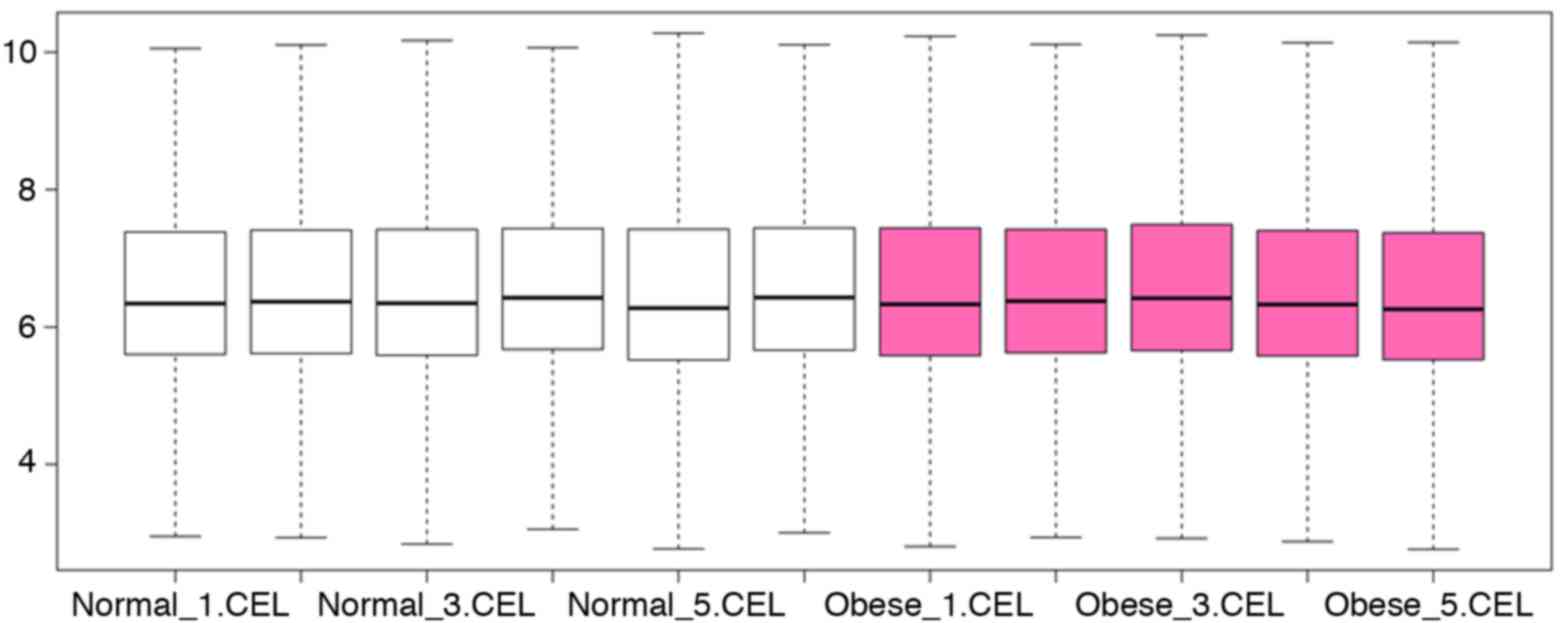
normalization (17). A boxplot
graph was produced to present the chip data distribution and the
median values. When the median values were consistent subsequent to
normalization, the chip data were used for DEGs analysis.
The omental adipose tissues of normal-weight
children were considered as the controls. DEGs in omental adipose
tissues between obese children samples and normal controls were
identified by the limma package (version 3.26.8) (https://bioconductor.org/packages/release/bioc/html/limma.html)
(18). The P-values and log fold
change (logFC) were calculated. P<0.01 and |logFC| >1 were
considered as the cut-off criteria.
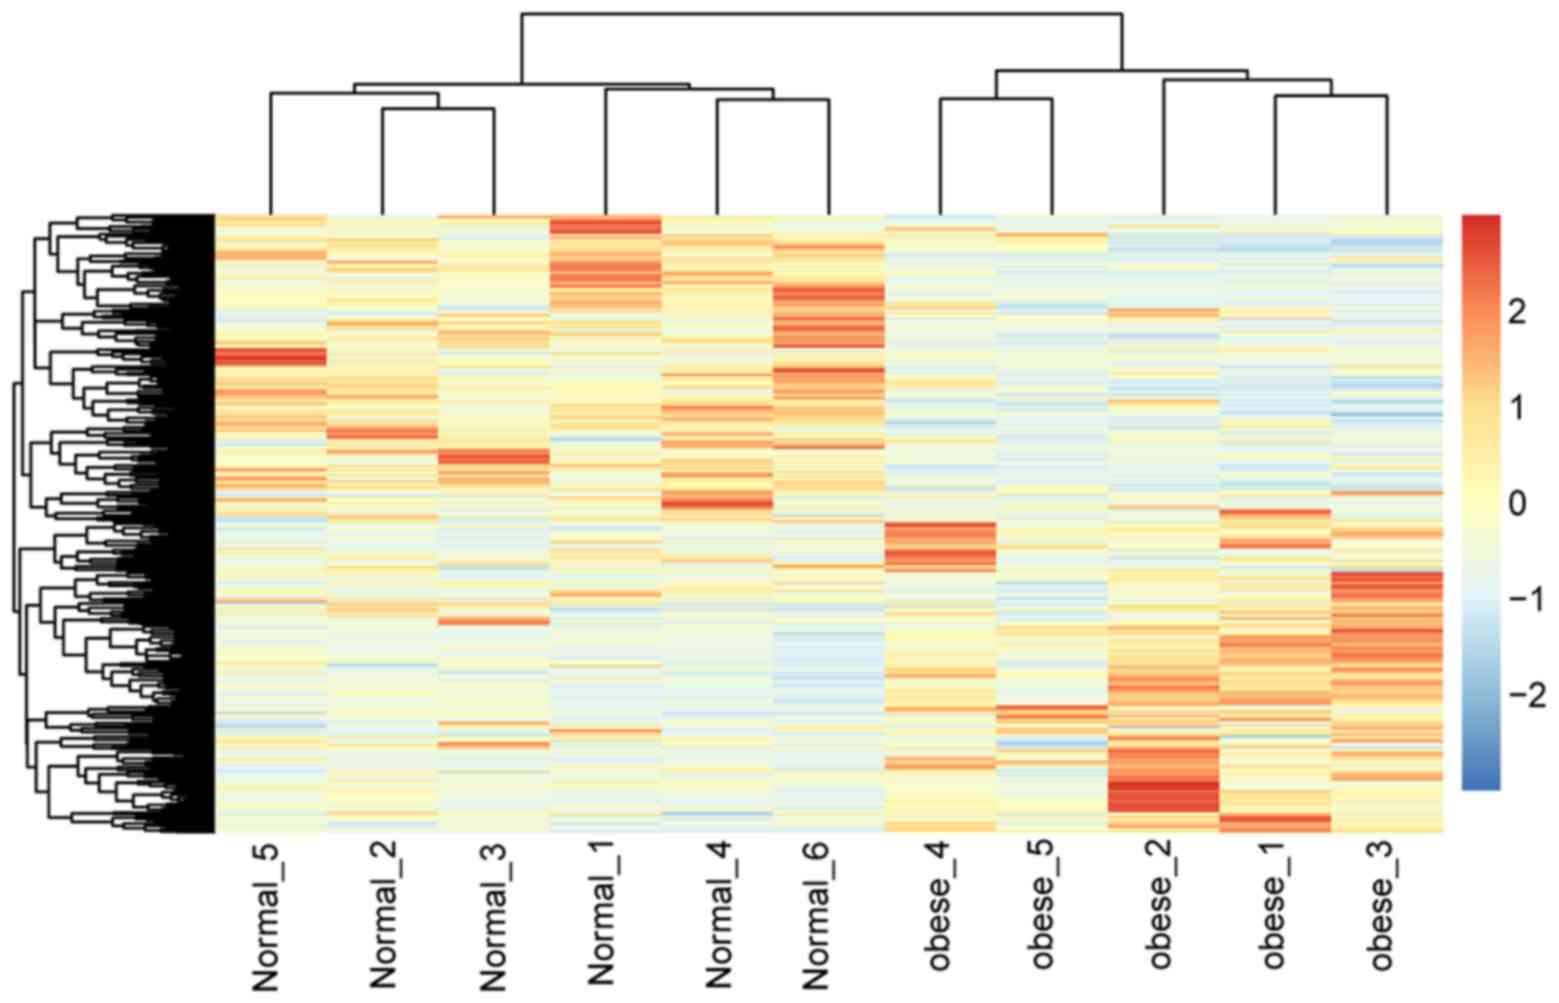
Hierarchical clustering of DEGs
Two-way hierarchical clustering was applied using
the pheatmap package in R language (version 1.0.8) (https://cran.r-project.org/web/packages/pheatmap/index.html)
(19). Subsequently, the heat map
of the DEGs was generated. The clustering was performed using the
Euclidean distance and Ward's method (20).
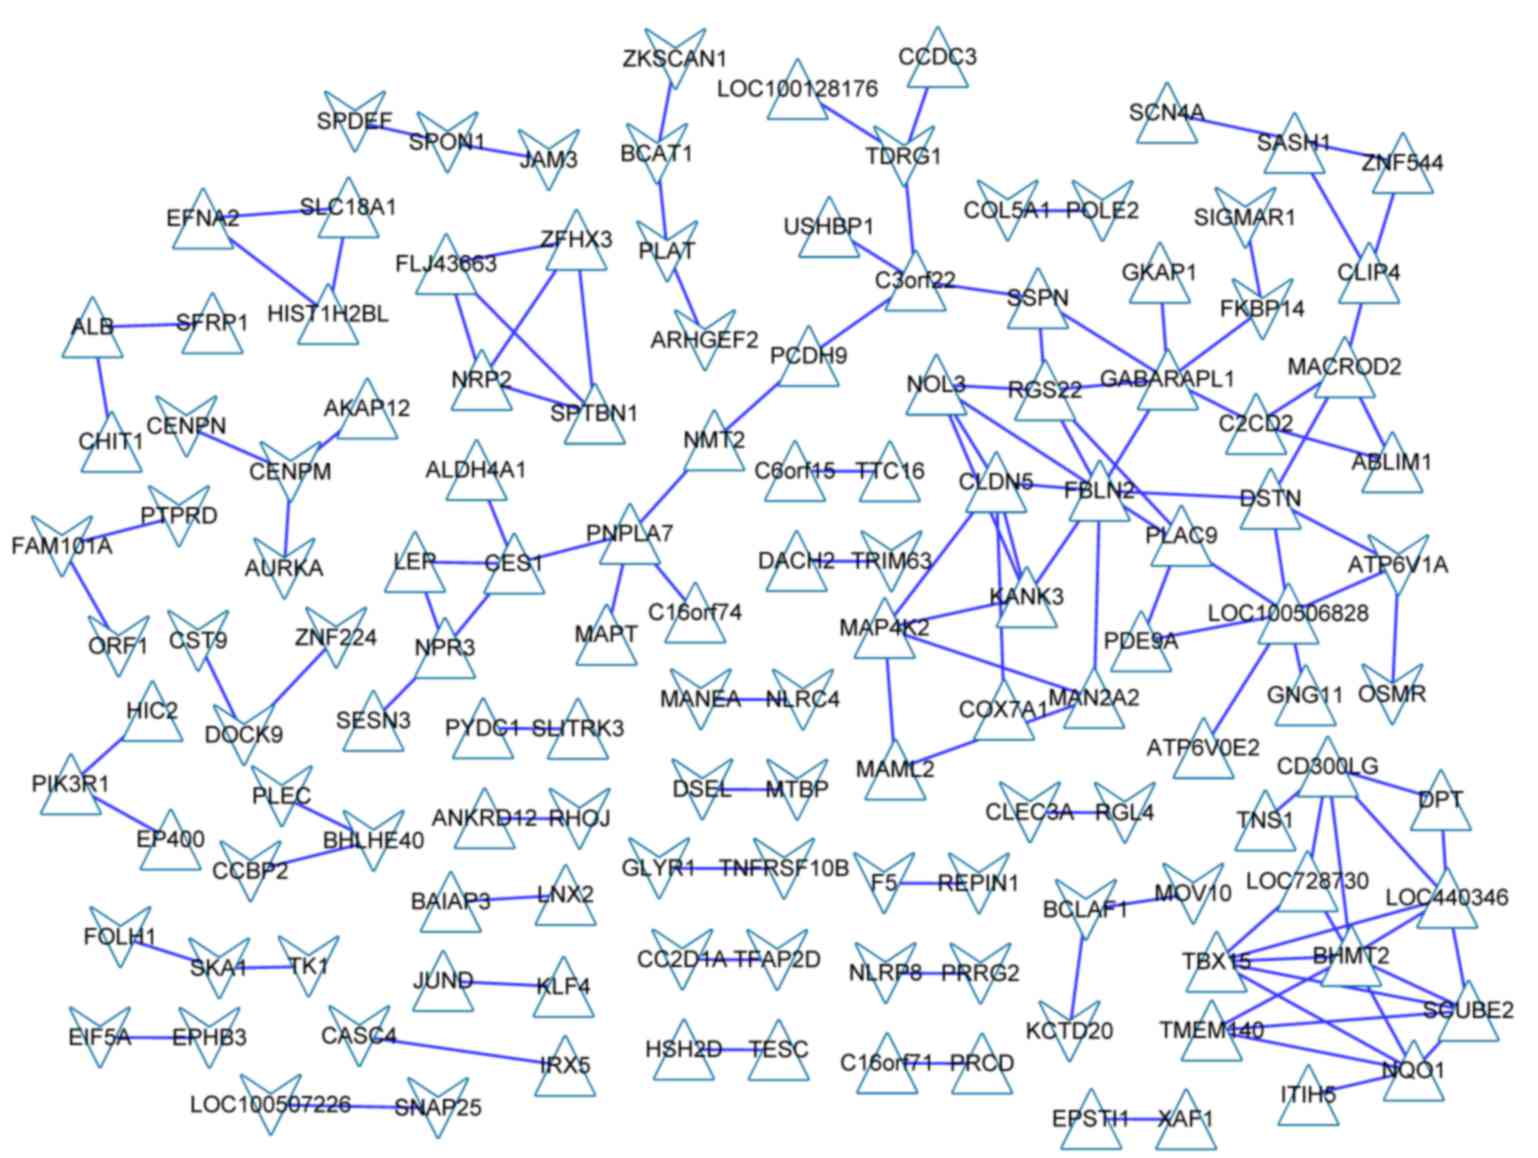
CE analysis of DEGs
The CE analysis was performed using online CoExpress
software (http://www.bioinformatics.lu/CoExpress/). To identify
CE DEGs, the correlation coefficient of each gene pair was
calculated using the Pearson's correlation coefficient (21). The correlation coefficient ranged
from −1 to +1, ‘−’ represented a negative correlation and ‘+
represented a positive correlation. When CE<0.95, the gene pairs
were cut off. Subsequently, the CE gene network was constructed by
connecting the CE genes with straight lines.
Gene network construction
The functional similarity of DEGs was calculated
using GOSim package (version 1.8.0) (https://www.bioconductor.org/packages/release/bioc/html/GOSim.html)
(22), which functions based on
various information theoretic similarity concepts for gene ontology
(GO) terms. P<0.05 was used as the cut-off criterion.
Following functional classification, the gene
network enriched by the screened DEGs was constructed. The
Cytoscape package (version 3.2.1) (http://www.cytoscape.org/) was applied for the network
visualization (23).
Measures of codon usage bias
It has been previously identified that there are
large differences in codon usage bias among genes with different
functions (24). The program of
codon usage analysis has been previously used for analyzing codon
and amino acid usage patterns (25). In the current study, the codon
usage bias of the DEGs in each cluster was examined using the codon
adaptation index (CAI) value, which was calculated with the CAI
program from the European Molecular Biology Open Software Suite
(version 6.5.0) (http://emboss.sourceforge.net/index.html) (26). CAI values between 0 and 1 indicated
a positive correlation between the codon usage bias and the CAI
value.
Results
DEGs analysis
The boxplot graph demonstrated that the chip data
had been normalized and were available for DEGs selection (Fig. 1).
Based on the cut-off criteria of P<0.01 and |log
FC| >1, 583 DEGs were identified in omental adipose tissues
between the samples from obese children and those of normal-weight
controls, including 310 upregulated genes and 273 downregulated
genes.
Hierarchical clustering of DEGs
The heat map of DEGs (Fig. 2) indicated a marked difference in
the DEGs of omental adipose tissues between the samples from obese
children and those of normal-weight controls, observed by the clear
color difference.
CE analysis of DEGs
A total of 130 DEGs were selected using the cut-off
criterion of CE>0.95. The CE network of those DEGs is presented
in Fig. 3.
Gene network construction
Functional classification of the 130 DEGs was
performed. According to the GO functional nodes of these DEGs, they
were classified into 4 clusters (summarized in Table I).
 | Table I.Functional classification of
correlated differentially expressed genes. |
Table I.
Functional classification of
correlated differentially expressed genes.
| Cluster name | Genes | Enrichment
P-value | Biological
function |
|---|
| C1 (BP) | ARHGEF2, MAPT,
SPTBN1, SKA1, DSTN | 0.0154 |
GO:0051493~regulation of cytoskeleton
organization |
|
| ARHGEF2, MAPT,
SKA1 | 0.0199 |
GO:0031110~regulation of microtubule
polymerization or depolymerization |
|
| ARHGEF2, MAPT,
SKA1 | 0.0350 |
GO:0070507~regulation of microtubule
cytoskeleton organization |
|
| ARHGEF2, MAPT,
SKA1 | 0.0464 |
GO:0032886~regulation of microtubule-based
process |
| C2 (BP) | ARHGEF2, MAPT,
EIF5A, SPTBN1, DSTN | 0.0004 |
GO:0043244~regulation of protein complex
disassembly |
|
| ARHGEF2, MAPT,
SPTBN1, SKA1, DSTN | 0.0154 |
GO:0051493~regulation of cytoskeleton
organization |
|
| ARHGEF2, MAPT,
SPTBN1 | 0.0335 | GO:0043242~negative
regulation of protein complex disassembly |
| C3 (BP) | NRP2, LEP,
SLITRK3, IRX5, EFNA2, EPHB3, SNAP25 NRP2, SLITRK3, EFNA2 | 0.0320 | GO:0048666~neuron
development |
|
| EPHB3,
SNAP25 | 0.0469 |
GO:0007409~axonogenesis |
| C4 (CC) | CENPN, CENPM,
SKA1 | 0.0064 |
GO:0000777~condensed chromosome
kinetochore |
|
| CENPN,
CENPM, SKA1 | 0.0080 |
GO:0000779~condensed chromosome,
centromeric region |
|
| CENPN, CENPM,
SKA1 | 0.0104 |
GO:0000776~kinetochore |
|
| CENPN, CENPM,
SKA1 | 0.0221 |
GO:0000775~chromosome, centromeric
region |
|
| CENPN, CENPM,
SKA1 | 0.0234 |
GO:0000793~condensed chromosome |
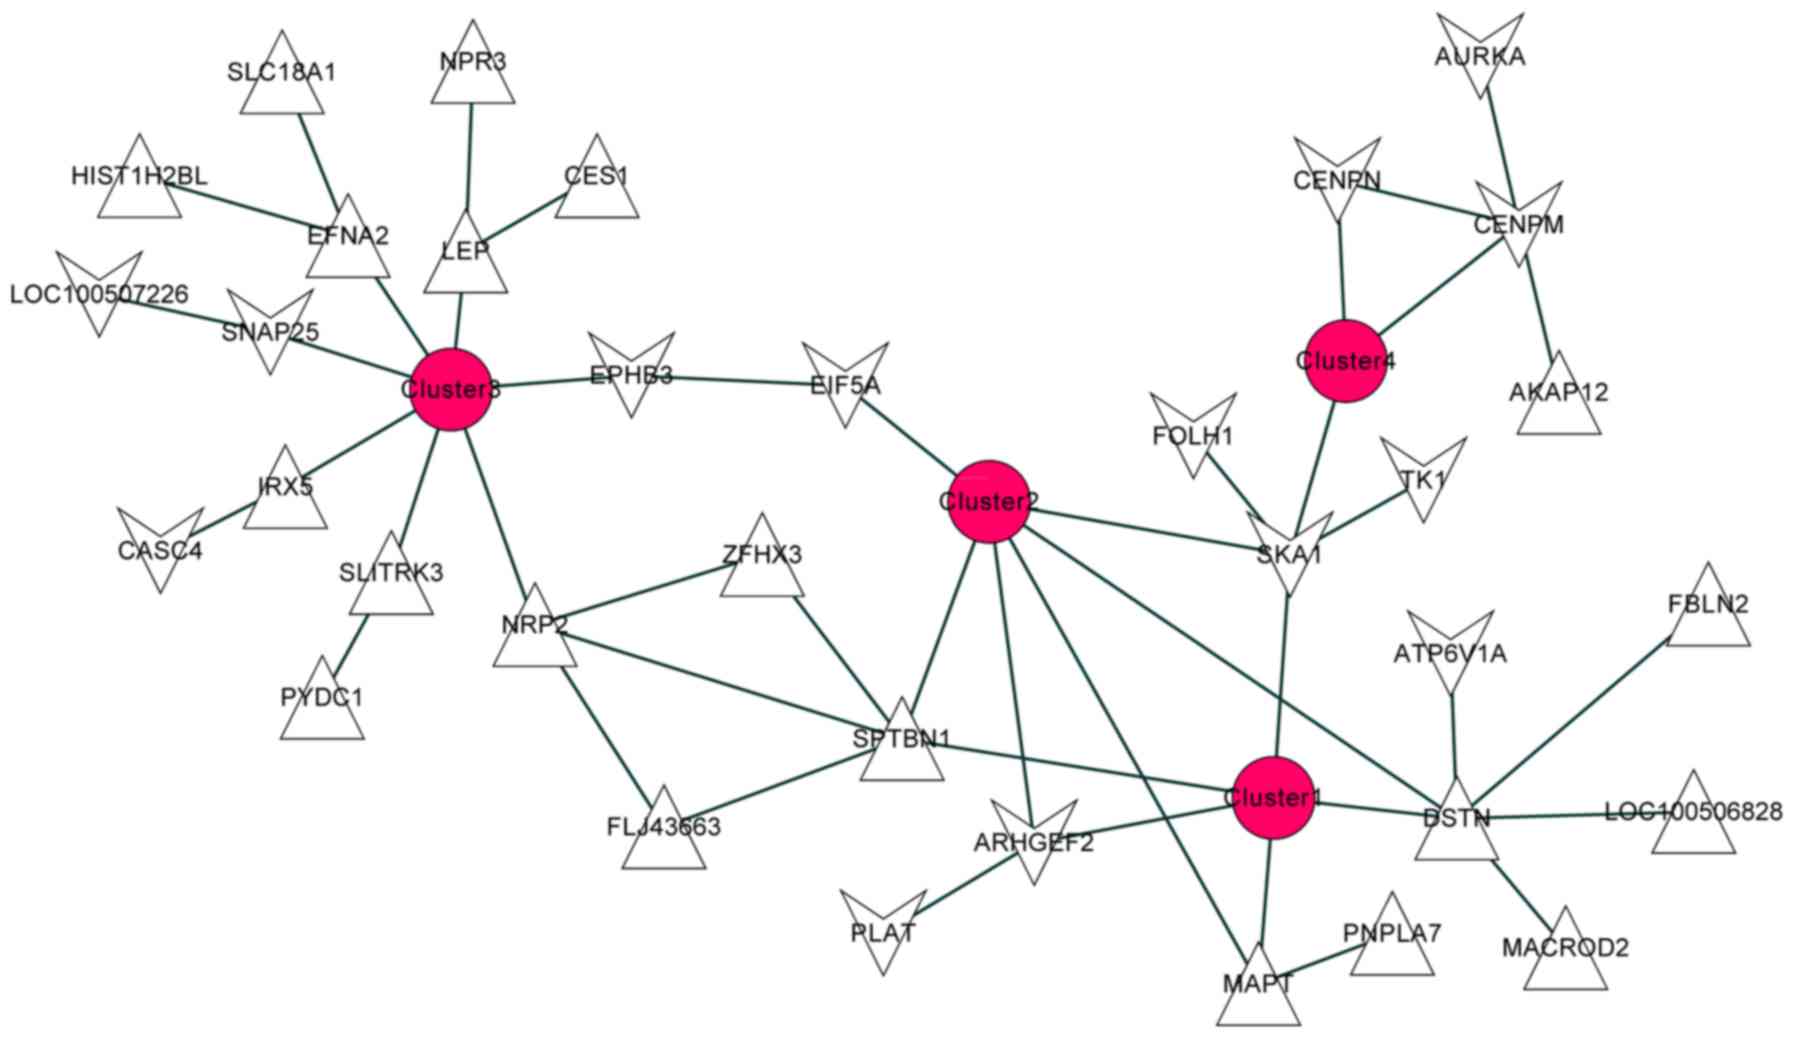
The gene network of the DEGs with similarities of
expression and function is presented in Fig. 4. The gene network included 38
nodes, 34 DEGs and 35 edges. There were 3 significantly upregulated
genes [microtubule-associated protein tau (MAPT), destrin
(actin depolymerizing factor) (DSTN) and spectrin, β,
non-erythrocytic 1 (SPTBN1)] and 2 significantly
downregulated genes [Rho/Rac guanine nucleotide exchange factor 2
(ARHGEF2) and spindle and kinetochore associated complex
subunit 1 (SKA1)].
Codon usage bias
The CAI values of the DEGs in the 4 clusters were
0.724 (cluster 1), 0.687 (cluster 2), 0.712 (cluster 3) and 0.705
(cluster 4), indicating a significant codon usage bias. To confirm
the codon usage bias, amino acids translated by the codon in each
sequence were summarized in Table
II. The top 3 amino acids were glycine, leucine and serine,
which exhibited a high bias.
| Table II.Codon usage of differential
expression genes sequence in the 4 clusters. |
Table II.
Codon usage of differential
expression genes sequence in the 4 clusters.
|
| AA Sum |
|---|
|
|
|
|---|
| Codon | AA | Cluster 1 | Cluster 2 | Cluster 3 | Cluster 4 | Cluster 1 | Cluster 2 | Cluster 3 | Cluster 4 |
|---|
| GCA | A | 194 | 26 | 695 | 190 | 712 | 148 | 2147 | 666 |
| GCC | A | 253 | 40 | 641 | 210 |
|
|
|
|
| GCG | A | 45 | 48 | 163 | 58 |
|
|
|
|
| GCT | A | 220 | 34 | 648 | 208 |
|
|
|
|
| TGC | C | 212 | 24 | 771 | 198 | 376 | 51 | 1579 | 427 |
| TGT | C | 164 | 27 | 808 | 229 |
|
|
|
|
| GAC | D | 128 | 20 | 469 | 117 | 270 | 40 | 1058 | 255 |
| GAT | D | 142 | 20 | 589 | 138 |
|
|
|
|
| GAA | E | 212 | 18 | 880 | 187 | 573 | 60 | 1731 | 436 |
| GAG | E | 361 | 42 | 851 | 249 |
|
|
|
|
| TTC | F | 203 | 46 | 857 | 216 | 531 | 108 | 2242 | 616 |
| TTT | F | 328 | 62 | 1385 | 400 |
|
|
|
|
| GGA | G | 281 | 46 | 842 | 198 | 1146 | 185 | 2907 | 765 |
| GGC | G | 255 | 43 | 658 | 203 |
|
|
|
|
| GGG | G | 387 | 62 | 825 | 180 |
|
|
|
|
| GGT | G | 223 | 34 | 582 | 184 |
|
|
|
|
| CAC | H | 179 | 22 | 693 | 200 | 341 | 43 | 1519 | 355 |
| CAT | H | 162 | 21 | 826 | 155 |
|
|
|
|
| ATA | I | 114 | 11 | 752 | 171 | 406 | 52 | 2302 | 528 |
| ATC | I | 127 | 19 | 605 | 153 |
|
|
|
|
| ATT | I | 165 | 22 | 945 | 204 |
|
|
|
|
| AAA | K | 294 | 18 | 1478 | 406 | 491 | 44 | 2328 | 609 |
| AAG | K | 197 | 26 | 850 | 203 |
|
|
|
|
| CTA | L | 134 | 18 | 470 | 136 | 1322 | 212 | 4625 | 1282 |
| CTC | L | 275 | 49 | 804 | 249 |
|
|
|
|
| CTG | L | 372 | 42 | 958 | 288 |
|
|
|
|
| CTT | L | 220 | 45 | 851 | 230 |
|
|
|
|
| TTA | L | 135 | 21 | 778 | 173 |
|
|
|
|
| TTG | L | 186 | 37 | 764 | 206 |
|
|
|
|
| ATG | M | 165 | 22 | 776 | 183 | 165 | 22 | 776 | 183 |
| AAC | N | 109 | 10 | 617 | 163 | 244 | 22 | 1550 | 384 |
| AAT | N | 135 | 12 | 933 | 221 |
|
|
|
|
| CCA | P | 273 | 35 | 880 | 214 | 1029 | 157 | 2750 | 682 |
| CCC | P | 339 | 57 | 831 | 170 |
|
|
|
|
| CCG | P | 86 | 17 | 213 | 69 |
|
|
|
|
| CCT | P | 331 | 48 | 826 | 229 |
|
|
|
|
| CAA | Q | 178 | 24 | 832 | 177 | 495 | 60 | 1815 | 448 |
| CAG | Q | 317 | 36 | 983 | 271 |
|
|
|
|
| AGA | R | 289 | 30 | 1020 | 228 | 846 | 137 | 2503 | 663 |
| AGG | R | 337 | 41 | 843 | 233 |
|
|
|
|
| CGA | R | 35 | 9 | 128 | 48 |
|
|
|
|
| CGC | R | 64 | 16 | 143 | 58 |
|
|
|
|
| CGG | R | 80 | 28 | 233 | 51 |
|
|
|
|
| CGT | R | 41 | 13 | 136 | 45 |
|
|
|
|
| AGC | S | 264 | 30 | 662 | 194 | 1235 | 182 | 3930 | 1118 |
| AGT | S | 207 | 23 | 666 | 188 |
|
|
|
|
| TCA | S | 191 | 31 | 795 | 227 |
|
|
|
|
| TCC | S | 252 | 44 | 771 | 202 |
|
|
|
|
| TCG | S | 47 | 12 | 126 | 40 |
|
|
|
|
| TCT | S | 274 | 42 | 910 | 267 |
|
|
|
|
| ACA | T | 164 | 12 | 845 | 206 | 538 | 72 | 2187 | 587 |
| ACC | T | 197 | 25 | 564 | 134 |
|
|
|
|
| ACG | T | 33 | 10 | 131 | 54 |
|
|
|
|
| ACT | T | 144 | 25 | 647 | 193 |
|
|
|
|
| GTA | V | 124 | 13 | 435 | 136 | 642 | 112 | 2144 | 634 |
| GTC | V | 136 | 24 | 433 | 126 |
|
|
|
|
| GTG | V | 246 | 39 | 680 | 212 |
|
|
|
|
| GTT | V | 136 | 36 | 596 | 160 |
|
|
|
|
| TGG | W | 331 | 42 | 945 | 233 | 331 | 42 | 945 | 233 |
| TAC | Y | 95 | 11 | 397 | 132 | 179 | 24 | 1090 | 305 |
| TAT | Y | 84 | 13 | 693 | 173 |
|
|
|
|
| TAA | * | 108 | 9 | 819 | 214 |
|
|
|
|
| TAG | * | 134 | 17 | 526 | 149 |
|
|
|
|
| TGA | * | 208 | 22 | 827 | 206 |
|
|
|
|
Discussion
Childhood obesity is a multisystem disease with
potentially life-threatening consequences (27). In spite of numerous genetic studies
aiming to elucidate the pathogenesis of childhood obesity, the
molecular mechanisms in the development and progression of this
disease remain unclear. In the present study, 3 notably upregulated
genes (MAPT, DSTN and SPTBN1) and 2 notable
downregulated genes (ARHGEF2 and SKA1) were
identified. Several functions, including microtubule polymerization
or depolymerization, condensed chromosome kinetochore, regulation
of cytoskeleton organization and regulation of microtubule
cytoskeleton organization, were observed to be significantly
enriched by these DEGs.
SKA1 is a protein-coding gene. The
SKA1 complex is part of the conserved
kinetochore-microtubule interface and directly associates with
microtubules as part of oligomeric assemblies. It has been
previously demonstrated to serve a critical role in interacting
with dynamic microtubules at the outer kinetochore by
depolymerizing microtubule ends (28). As presented in Table I and Fig. 4, SKA1 was significantly
enriched in regulation of microtubule polymerization or
depolymerization. The depolymerizing microtubules attached by
macromolecular kinetochores are necessary for the chromosome
movements to ensure regular chromosome segregation (29,30).
Notably, SKA1 was observed in the current study to also be
enriched in cluster 4, which consisted of biological functions such
as condensed chromosome kinetochore. Previous studies have
identified that chromosomal (such as those on chromosome 11p14-p12
and chromosome 16p11.2) deletions may result in obesity (31–34).
Therefore, it is suggested that SKA1 may be associated with
childhood obesity by depolymerizing microtubules and disturbing
chromosome segregation.
An additional significantly downregulated gene
identified in the present study is ARHGEF2. ARHGEF2
encodes guanine nucleotide exchange factor H1, which is a
microtubule-associated exchange factor (35,36).
ARHGEF2 activity is downregulated by interaction of its
C-terminus with microtubules (37). Rho GEF is associated with
microtubules and becomes active upon microtubule depolymerization
(38). Through functional
analysis, ARHGEF2 was observed to be significantly enriched
in the regulation of microtubule polymerization or
depolymerization. Hence, similar to that of SKA1, it is
suggested that ARHGEF2 may be a candidate gene in childhood
obesity, acting via targeting the regulation of microtubule
polymerization or depolymerization.
In the present study, MAPT was observed as a
significantly upregulated gene. MAPT encodes the
microtubule-associated protein (MAP) tau. MAP has been observed to
serve an important role in the promotion of microtubule assembly
in vitro (39). The results
of the current study indicated that MAPT targeted regulation
of microtubule cytoskeleton organization. Previous studies have
demonstrated that disruption of microtubule assembly inhibited the
translocation of the insulin responsive glucose transporter isoform
(GLUT4) (40,41). GLUT4 translocation promotes
insulin to stimulate glucose uptake in adipose tissue, ultimately
resulting in obesity (42). Thus,
MAPT may serve a stimulative role in the development and
progression of childhood obesity.
SPTBN1 is a member of the β-spectrin gene
family (43). Spectrin is a
protein functioning in actin cross-linking and the molecular
scaffold. It connects the plasma membrane to the actin cytoskeleton
and determines cytoskeleton organization including cell shape,
arrangement of transmembrane proteins and organization of
organelles (44). SPTBN1
was identified in the current study as a significantly upregulated
gene, enriched in pathway of regulation of cytoskeleton
organization. Cytoskeleton organization is a biological process
involving various cellular components in adipose tissues. Fat
deposition in mature fat cells and cell proliferation have been
suggested to accelerate pre-adipocytes to differentiate into
adipocytes, serving a role in the regulation of body weight
(45). Thus, it is suggested that
SPTBN1 may be a candidate gene for childhood obesity, acting
via the regulation of cytoskeleton organization function.
DSTN encodes for the protein destrin. Destrin
is a pH-independent protein, with the capacity to sever actin
filaments (F-actin) (46). Destrin
has been previously reported to serve a role in the reorganization
of the actin cytoskeleton in response to stress and cell stimuli
(47). In addition, destrin
belongs to the actin-depolymerizing factor family, which mediates a
pH-sensitive destruction of actin filaments (48–51).
Filament networks, such as peripheral actin filaments, have been
identified to have a mechanical connection to various cytoskeletal
structures (52). By reviewing the
functional classifications and the gene network in the current
study, it is suggested that DSTN participates in the
regulation of cytoskeletal organization. Previously, organization
of the actin cytoskeleton was suggested to be necessary for early
adipocyte differentiation, resulting in hyperplasia of adipose
tissues which is a critical event for the development of obesity
(53,54). This led to it being hypothesized
that DSTN may be a biomarkers of childhood obesity.
However, there were limitations in the present
study. The results obtained were web-based and were not verified by
any biological experiments. In addition, the data downloaded were
from a European database, it remains unclear whether these results
would be consistent for children from other continents. Thus,
further experimental studies based on the observations of the
current study are required.
In conclusion, MAPT, DSTN,
SPTBN1, ARHGEF2 and SKA1 may be candidate
biomarkers of childhood obesity. Microtubule polymerization or
depolymerization, condensed chromosome kinetochore, regulation of
cytoskeleton organization and regulation of microtubule
cytoskeleton organization may be important biological pathways in
the progression of childhood obesity. The observations of the
current study may have implications for the understanding of the
molecular mechanisms, and identification of candidate therapeutic
agents, for childhood obesity. However, further studies are
required to confirm the preliminary observations outlined in the
current study, with the aim of this information being used in a
clinical setting.
Acknowledgements
The current study was supported by the Shanghai
Universities Young Teachers Training Scheme (grant no.
Zzjdyx12021).
References
|
1
|
Etelson D, Brand DA, Patrick PA and
Shirali A: Childhood obesity: Do parents recognize this health
risk? Obes Res. 11:1362–1368. 2003. View Article : Google Scholar : PubMed/NCBI
|
|
2
|
Dietz WH: Health consequences of obesity
in youth: Childhood predictors of adult disease. Pediatrics.
101:518–525. 1998.PubMed/NCBI
|
|
3
|
Dehghan M, Akhtar-Danesh N and Merchant
AT: Childhood obesity, prevalence and prevention. Nutr J. 4:242005.
View Article : Google Scholar : PubMed/NCBI
|
|
4
|
Daniels SR: The consequences of childhood
overweight and obesity. Future Child. 16:47–67. 2006. View Article : Google Scholar : PubMed/NCBI
|
|
5
|
French SA, Story M and Perry CL:
Self-esteem and obesity in children and adolescents: A literature
review. Obes Res. 3:479–490. 1995. View Article : Google Scholar : PubMed/NCBI
|
|
6
|
Han JC, Lawlor DA and Kimm SY: Childhood
obesity. Lancet. 375:1737–1748. 2010. View Article : Google Scholar : PubMed/NCBI
|
|
7
|
Govaerts C, Srinivasan S, Shapiro A, Zhang
S, Picard F, Clement K, Lubrano-Berthelier C and Vaisse C:
Obesity-associated mutations in the melanocortin 4 receptor provide
novel insights into its function. Peptides. 26:1909–1919. 2005.
View Article : Google Scholar : PubMed/NCBI
|
|
8
|
Tao YX and Segaloff DL: Functional
characterization of melanocortin-4 receptor mutations associated
with childhood obesity. Endocrinology. 144:4544–4551. 2003.
View Article : Google Scholar : PubMed/NCBI
|
|
9
|
Yeo GS, Farooqi IS, Aminian S, Halsall DJ,
Stanhope RG and O'Rahilly S: A frameshift mutation in MC4R
associated with dominantly inherited human obesity. Nat Gene.
20:111–112. 1998. View
Article : Google Scholar
|
|
10
|
Del Giudice Miraglia E, Cirillo G, Nigro
V, Santoro N, D'urso L, Raimondo P, Cozzolino D, Scafato D and
Perrone L: Low frequency of melanocortin-4 receptor (MC4R)
mutations in a Mediterranean population with early-onset obesity.
Int J Obes Relat Metab Disord. 26:647–651. 2002. View Article : Google Scholar : PubMed/NCBI
|
|
11
|
Challis BG, Pritchard LE, Creemers JW,
Delplanque J, Keogh JM, Luan J, Wareham NJ, Yeo GS, Bhattacharyya
S, Froguel P, et al: A missense mutation disrupting a dibasic
prohormone processing site in pro-opiomelanocortin (POMC) increases
susceptibility to early-onset obesity through a novel molecular
mechanism. Hum Mol Genet. 11:1997–2004. 2002. View Article : Google Scholar : PubMed/NCBI
|
|
12
|
Santoro N, Perrone L, Cirillo G, Raimondo
P, Amato A, Coppola F, Santarpia M, D'Aniello A and Del Giudice
Miraglia E: Weight loss in obese children carrying the
proopiomelanocortin R236G variant. J Endocrinol Invest. 29:226–230.
2006. View Article : Google Scholar : PubMed/NCBI
|
|
13
|
Hung CN, Poon WT, Lee CY, Law CY and Chan
AY: A case of early-onset obesity, hypocortisolism, and skin
pigmentation problem due to a novel homozygous mutation in the
proopiomelanocortin (POMC) gene in an Indian boy. J Pediatr
Endocrinol Metab. 25:175–179. 2012. View Article : Google Scholar : PubMed/NCBI
|
|
14
|
Wardle J, Carnell S, Haworth CM, Farooqi
IS, O'Rahilly S and Plomin R: Obesity associated genetic variation
in FTO is associated with diminished satiety. J Clin Endocrinol
Metab. 93:3640–3643. 2008. View Article : Google Scholar : PubMed/NCBI
|
|
15
|
Gulati P, Cheung MK, Antrobus R, Church
CD, Harding HP, Tung YC, Rimmington D, Ma M, Ron D, Lehner PJ, et
al: Role for the obesity-related FTO gene in the cellular sensing
of amino acids. Proc Natl Acad Sci USA. 110:2557–2562. 2013.
View Article : Google Scholar : PubMed/NCBI
|
|
16
|
Liu WM, Mei R, Di X, Ryder TB, Hubbell E,
Dee S, Webster TA, Harrington CA, Ho MH, Baid J, et al: Analysis of
high density expression microarrays with signed-rank call
algorithms. Bioinformatics. 18:1593–1599. 2002. View Article : Google Scholar : PubMed/NCBI
|
|
17
|
Smyth GK and Speed T: Normalization of
cDNA microarray data. Methods. 31:265–273. 2003. View Article : Google Scholar : PubMed/NCBI
|
|
18
|
Smyth GK: Limma: Linear models for
microarray dataBioinformatics and Computational Biology Solutions
Using R and Bioconductor. Gentleman R, Carey VJ, Huber W, Irizarry
RA and Dudoit S: Springer; New York: pp. 397–420. 2005, View Article : Google Scholar
|
|
19
|
Team RC: R: A Language and Environment for
Statistical ComputingR Foundation for Statistical Computing.
Vienna: 2012
|
|
20
|
Deza MM and Deza E: Encyclopedia of
Distances. 1st edition. Springer-Verlag; Berlin: 2009, View Article : Google Scholar
|
|
21
|
Obayashi T, Kinoshita K, Nakai K, Shibaoka
M, Hayashi S, Saeki M, Shibata D, Saito K and Ohta H: ATTED-II: A
database of co-expressed genes and cis elements for identifying
co-regulated gene groups in Arabidopsis. Nucleic Acids Res.
35:(Database Issue). D863–D869. 2007. View Article : Google Scholar : PubMed/NCBI
|
|
22
|
Fröhlich H, Speer N, Poustka A and
Beissbarth T: GOSim-an R-package for computation of information
theoretic GO similarities between terms and gene products. BMC
Bioinformatics. 8:1662007. View Article : Google Scholar : PubMed/NCBI
|
|
23
|
Smoot ME, Ono K, Ruscheinski J, Wang PL
and Ideker T: Cytoscape 2.8: New features for data integration and
network visualization. Bioinformatics. 27:431–432. 2011. View Article : Google Scholar : PubMed/NCBI
|
|
24
|
Liu Q, Dou S, Ji Z and Xue Q: Synonymous
codon usage and gene function are strongly related in Oryza sativa.
Bio Systems. 80:123–131. 2005. View Article : Google Scholar : PubMed/NCBI
|
|
25
|
McInerney JO: GCUA: General codon usage
analysis. Bioinformatics. 14:372–373. 1998. View Article : Google Scholar : PubMed/NCBI
|
|
26
|
Rice P, Longden I and Bleasby A: EMBOSS:
The European molecular biology open software suite. Trends Genet.
16:276–277. 2000. View Article : Google Scholar : PubMed/NCBI
|
|
27
|
Ebbeling CB, Pawlak DB and Ludwig DS:
Childhood obesity: Public-health crisis, common sense cure. Lancet.
360:473–482. 2002. View Article : Google Scholar : PubMed/NCBI
|
|
28
|
Welburn JP, Grishchuk EL, Backer CB,
Wilson-Kubalek EM, Yates JR III and Cheeseman IM: The human
kinetochore Ska1 complex facilitates microtubule
depolymerization-coupled motility. Dev Cell. 16:374–385. 2009.
View Article : Google Scholar : PubMed/NCBI
|
|
29
|
Welburn JP, Grishchuk EL, Backer CB,
Wilson-Kubalek EM, Yates JR III and Cheeseman IM: The human
kinetochore Ska1 complex facilitates microtubule
depolymerization-coupled motility. Dev Cell. 16:374–385. 2009.
View Article : Google Scholar : PubMed/NCBI
|
|
30
|
Schmidt JC, Arthanari H, Boeszoermenyi A,
Dashkevich NM, Wilson-Kubalek EM, Monnier N, Markus M, Oberer M,
Milligan RA, Bathe M, et al: The kinetochore-bound Ska1 complex
tracks depolymerizing microtubules and binds to curved
protofilaments. Dev Cell. 23:968–980. 2012. View Article : Google Scholar : PubMed/NCBI
|
|
31
|
Bochukova EG, Huang N, Keogh J, Henning E,
Purmann C, Blaszczyk K, Saeed S, Hamilton-Shield J, Clayton-Smith
J, O'Rahilly S, et al: Large, rare chromosomal deletions associated
with severe early-onset obesity. Nature. 463:666–670. 2010.
View Article : Google Scholar : PubMed/NCBI
|
|
32
|
Farooqi IS: Genetic and hereditary aspects
of childhood obesity. Best Pract Res Clin Endocrinol Metab.
19:359–374. 2005. View Article : Google Scholar : PubMed/NCBI
|
|
33
|
Walters RG, Jacquemont S, Valsesia A, de
Smith AJ, Martinet D, Andersson J, Falchi M, Chen F, Andrieux J,
Lobbens S, et al: A new highly penetrant form of obesity due to
deletions on chromosome 16p11.2. Nature. 463:671–675. 2010.
View Article : Google Scholar : PubMed/NCBI
|
|
34
|
Bachmann-Gagescu R, Mefford HC, Cowan C,
Glew GM, Hing AV, Wallace S, Bader PI, Hamati A, Reitnauer PJ,
Smith R, et al: Recurrent 200-kb deletions of 16p11. 2 that include
the SH2B1 gene are associated with developmental delay and obesity.
Genet Med. 12:641–647. 2010. View Article : Google Scholar : PubMed/NCBI
|
|
35
|
Siesser PF, Motolese M, Walker MP,
Goldfarb D, Gewain K, Yan F, Kulikauskas RM, Chien AJ, Wordeman L
and Major MB: FAM123A binds to microtubules and inhibits the
guanine nucleotide exchange factor ARHGEF2 to decrease actomyosin
contractility. Sci Signal. 5:ra642012. View Article : Google Scholar : PubMed/NCBI
|
|
36
|
Brajenovic M, Joberty G, Küster B,
Bouwmeester T and Drewes G: Comprehensive proteomic analysis of
human Par protein complexes reveals an interconnected protein
network. J Biol Chem. 279:12804–12811. 2004. View Article : Google Scholar : PubMed/NCBI
|
|
37
|
Poroyko V and Birukova A: ARHGEF2 (rho/rac
guanine nucleotide exchange factor (GEF) 2). Atlas Genet Cytogenet
Oncol Haematol. 4:582007.
|
|
38
|
Conde C and Cáceres A: Microtubule
assembly, organization and dynamics in axons and dendrites. Nat Rev
Neurosci. 10:319–332. 2009. View Article : Google Scholar : PubMed/NCBI
|
|
39
|
Kuznetsov SA, Rodionov VI, Gelfand VI and
Rosenblat VA: Microtubule-associated protein MAP1 promotes
microtubule assembly in vitro. FEBS Lett. 135:241–244. 1981.
View Article : Google Scholar : PubMed/NCBI
|
|
40
|
Emoto M, Langille SE and Czech MP: A role
for kinesin in insulin-stimulated GLUT4 glucose transporter
translocation in 3T3-L1 adipocytes. J Biol Chem. 276:10677–10682.
2001. View Article : Google Scholar : PubMed/NCBI
|
|
41
|
Patki V, Buxton J, Chawla A, Lifshitz L,
Fogarty K, Carrington W, Tuft R and Corvera S: Insulin action on
GLUT4 traffic visualized in single 3T3-l1 adipocytes by using
ultra-fast microscopy. Mol Biol Cell. 12:129–141. 2001. View Article : Google Scholar : PubMed/NCBI
|
|
42
|
Kanzaki M and Pessin JE:
Insulin-stimulated GLUT4 translocation in adipocytes is dependent
upon cortical actin remodeling. J Biol Chem. 276:42436–42444. 2001.
View Article : Google Scholar : PubMed/NCBI
|
|
43
|
Hillen N, Mester G, Lemmel C, Weinzierl
AO, Müller M, Wernet D, Hennenlotter J, Stenzl A, Rammensee HG and
Stevanović S: Essential differences in ligand presentation and T
cell epitope recognition among HLA molecules of the HLA-B44
supertype. Eur J Immunol. 38:2993–3003. 2008. View Article : Google Scholar : PubMed/NCBI
|
|
44
|
Guilherme R, Guimiot F, Tabet AC,
Khung-Savatovsky S, Gauthier E, Nouchy M, Benzacken B, Verloes A,
Oury JF, Delezoide AL and Aboura A: Abnormal muscle development of
the diaphragm in a fetus with 2p14-p16 duplication. Am J Med Genet
A. 149A:2892–2897. 2009. View Article : Google Scholar : PubMed/NCBI
|
|
45
|
Aksu S, Koczan D, Renne U, Thiesen HJ and
Brockmann GA: Differentially expressed genes in adipose tissues of
high body weight-selected (obese) and unselected (lean) mouse
lines. J Appl Genet. 48:133–143. 2007. View Article : Google Scholar : PubMed/NCBI
|
|
46
|
Moriyama K, Yonezawa N, Sakai H, Yahara I
and Nishida E: Mutational analysis of an actin-binding site of
cofilin and characterization of chimeric proteins between cofilin
and destrin. J Biol Chem. 267:7240–7244. 1992.PubMed/NCBI
|
|
47
|
Yahara I, Aizawa H, Moriyama K, Iida K,
Yonezawa N, Nishida E, Hatanaka H and Inagaki F: A role of
cofilin/destrin in reorganization of actin cytoskeleton in response
to stresses and cell stimuli. Cell Struct Funct. 21:421–424. 1996.
View Article : Google Scholar : PubMed/NCBI
|
|
48
|
Agrawal PB, Greenleaf RS, Tomczak KK,
Lehtokari VL, Wallgren-Pettersson C, Wallefeld W, Laing NG, Darras
BT, Maciver SK, Dormitzer PR and Beggs AH: Nemaline Myopathy with
minicores caused by mutation of the CFL2 gene encoding the
skeletal muscle actin-binding protein, cofilin-2. Am J Hum Genet.
80:162–167. 2007. View
Article : Google Scholar : PubMed/NCBI
|
|
49
|
Verdoni AM, Aoyama N, Ikeda A and Ikeda S:
Effect of destrin mutations on the gene expression profile in vivo.
Physiol Genomics. 34:9–21. 2008. View Article : Google Scholar : PubMed/NCBI
|
|
50
|
Maciver SK and Hussey PJ: The ADF/cofilin
family: Actin-remodeling proteins. Genome Biol. 3:30072002.
View Article : Google Scholar
|
|
51
|
Hawkins M, Pope B, Maciver SK and Weeds
AG: Human actin depolymerizing factor mediates a pH-sensitive
destruction of actin filaments. Biochemistry. 32:9985–9993. 1993.
View Article : Google Scholar : PubMed/NCBI
|
|
52
|
Wiche G: Role of plectin in cytoskeleton
organization and dynamics. J Cell Sci. 111:2477–2486.
1998.PubMed/NCBI
|
|
53
|
Kawaguchi N, Sundberg C, Kveiborg M,
Moghadaszadeh B, Asmar M, Dietrich N, Thodeti CK, Nielsen FC,
Möller P, Mercurio AM, et al: ADAM12 induces actin cytoskeleton and
extracellular matrix reorganization during early adipocyte
differentiation by regulating beta1 integrin function. J Cell Sci.
116:3893–3904. 2003. View Article : Google Scholar : PubMed/NCBI
|
|
54
|
Bost F, Aouadi M, Caron L and Binétruy B:
The role of MAPKs in adipocyte differentiation and obesity.
Biochimie. 87:51–56. 2005. View Article : Google Scholar : PubMed/NCBI
|