Introduction
Postmenopausal osteoporosis (PMOP) is a common
skeletal disorder in postmenopausal women that occurs due to the
simultaneous interaction of independent predisposing factors,
including aging and continuous calcium loss (1). In the developed world, depending on
the method of diagnosis, 9–38% of females are affected by PMOP
(2). It is estimated that
one-third of adult women are affected by osteoporosis-associated
fractures in their lifetime, which is a public health concern
(3).
The mechanism underlying all cases of osteoporosis
involves an imbalance between bone resorption and formation
(4). In postmenopausal women,
excessive bone resorption and an inadequate rate of formation of
new bone tissue are associated with estrogen deficiency (5). Low estrogen levels have been
hypothesized to cause osteoporosis in women since the 1940s
(6). Based on the above mechanism,
various medications, including alendronate, etidronate, risedronate
and strontium ranelate have been employed to prevent osteoporotic
fragility fractures in patients with PMOP (7). However, the efficacy of these
medications have not been directly compared and it is not clear
which of these medications are the most effective (8). Furthermore, the effect of medications
is not ideal; patients with PMOP need continued treatment for up to
10 years (9). It has been
previously demonstrated that the peak bone mass and early
menopausal bone loss are associated with the level of expression of
estrogen-associated genes (10).
Previous study has demonstrated that mutations in
osteoclast-associated genes, including parathyroid hormone 1
receptor, colony stimulating factor 1 and low-density lipoprotein
receptor-related protein 5 are associated with PMOP (11). Furthermore, bioinformatics analysis
of gene expression profiles in B cells from patients with PMOP
demonstrated that filamin A a and transforming growth factor-β1 may
be potential target genes associated with the pathogenesis of PMOP
(12). In addition, certain
transcription factors (TFs), such as catenin β1, and pathways,
including the mitogen-activated protein kinase signaling pathway,
have been demonstrated to be involved in primary osteoporosis by
DNA microarray analysis (1).
Therefore, a thorough understanding of the mechanisms underlying
PMOP may be based on bioinformatics analysis and may contribute to
the development of novel and effective treatment approaches for
PMOP.
In the present study, a bioinformatics analysis was
performed based on a gene expression profile of 12 tissue samples
from ovariectomized (OVX) mice and 11 normal tissue samples from
sham surgery mice. Differentially expressed gene (DEG)
investigation, function and pathway enrichment studies, as well as
protein-protein interaction network (PPI) analyses, were performed.
Furthermore, TF-target gene regulatory networks and chemical-gene
interaction networks were investigated. The present study aimed to
systematically investigate potential genes and TFs associated with
the progression of PMOP, which may aid in elucidating the molecular
mechanism underlying PMOP. Additionally, potential chemical
compounds that may be employed for the treatment of PMOP were also
identified. The present study may provide insights into PMOP that
may aid the development of novel and effective therapies for
PMOP.
Materials and methods
Data resource
Gene expression profile data (accession no.
GSE68303) were downloaded from the Gene Expression Omnibus (GEO)
database (http://www.ncbi.nlm.nih.gov/geo/) (13). This dataset was produced on a
GPL6885 Illumina MouseRef-8 v2.0 expression beadchip platform
(Illumina, Inc., San Diego, CA, USA). A total of 12 tissue samples
from OVX mice (OVX group) and 11 normal tissue samples from sham
surgery mice (control group) were included in this dataset. The OVX
and sham surgical operations were conducted by Calabrese et
al (13). Briefly, mice were
anesthetized using isoflurane and surgery was performed using a
dorsal approach to excise the ovaries, and the abdominal and skin
incisions were subsequently closed. At 4 weeks following surgery,
the uterine weights were measured to confirm successful OVX
surgeries (13).
Data preprocessing and differential
expression analysis
Normalization of gene expression profile data was
performed using the Robust Multichip Averaging (RMA) method
(14) in Affy package version
1.44.0 (15) in R (version 3.0.0;
(http://bioconductor.org/biocLite.R).
DEGs were identified using unpaired t-tests using the Linear Models
for Microarray Data package (limma version 3.32.2; http://www.bioconductor.org/packages/release/bioc/html/limma.html)
(16) by comparing gene expression
values between the OVX group and the control group. Following
t-tests, the Benjamini-Hochberg procedure was performed to adjust
P-values. Finally, P<0.05 and |log2 fold change|>0
was selected as the threshold for identification of DEGs. A heat
map was constructed using pheatmap package version 1.08 (17) in R.
PPI network construction
The Search Tool for the Retrieval of Interacting
Genes/Proteins (STRING; version 10.0; http://www.string-db.org/) database provides
comprehensive coverage and access to experimental and predicted
information concerning PPIs (18).
Biological General Repository for Interaction Datasets (BioGRID;
version 3.4; https://wiki.thebiogrid.org/) is an open access
database that contains information on genetic and protein
interactions obtained from primary biomedical literature for
numerous model organisms and humans (19). Mentha (http://mentha.uniroma2.it/about.php) is a resource
used to browse integrated protein-interaction networks (20). Furthermore, the Human Protein
Reference Database (HPRD; release no. 9; www.hprd.org/) is a centralized platform for the
visual representation and integration of information pertaining to
domain architecture, post-translational modifications, interaction
networks and disease association for each protein in the human
proteome (21). In the present
study, these four databases were used to predict PPIs.
Based on the above databases, a PPI network was
constructed using upregulated and downregulated DEGs, and
visualized using Cytoscape software (version 3.2.0) (22). Topological index of a network
(degree centrality) is defined as the number of links incident upon
a node (23). The score of each
node was determined by degree centrality, where an increased score
indicates a more important location within the network.
Investigation of modules in the PPI
network
It has been previously demonstrated that genes from
the same module in a PPI network serve similar roles and are
implicated in the same biological functions (24). Analysis of modules in PPI networks
was performed using ClusterONE package in Cytoscape software
(22) using the cut-off value of
P<0.001.
Enrichment analysis of the DEGs
Multifaceted Analysis Tool for Human Transcriptome
(MATHT, http://www.biocloudservice.com) is an online tool that
provides a comprehensive set of functional annotation tools for
investigators to understand the biological roles served by large
lists of genes. Gene Ontology (GO, http://www.geneontology.org/) provides structured,
controlled vocabulary and classification that includes several
domains of molecular and cellular biology, and is available for the
scientific community to annotate genes, gene products and sequences
(25). Furthermore, Kyoto
Encyclopedia of Genes and Genomes (KEGG) is a knowledge base for
the systematic analysis of gene functions in terms of networks of
genes and molecules (26). In the
present study, GO-Biological Process (GO-BP) function and KEGG
pathway enrichment analyses of DEGs were performed utilizing the
MATHT based on Fisher's method. P<0.05 was considered to
indicate a statistically significant difference.
TF-target gene regulatory network
construction
The regulation of gene expression by TFs is
important. Analysis of TF binding sites is required for the
investigation of gene regulation systems. In the present study, a
transcriptional regulatory network was constructed based on the
Overrepresentation Enrichment Analysis (ORA) method using the
WebGestalt database (http://www.webgestalt.org/option.php) (8). The TF-target gene regulatory network
was visualized using Cytoscape software (version 3.2.0). False
discovery rate (FDR) <0.05 was considered the threshold.
Chemical-gene interaction network
construction
The Comparative Toxicogenomics Database (CTD)
provides manually curated information concerning
chemical-gene/protein interactions, and chemical-disease and
gene-disease associations (27).
The interactions between chemicals and genes were determined using
the CDT. Subsequently, the chemical-gene interaction network was
constructed using Cytoscape software (version 3.2.0).
Results
DEGs in OVX samples compared with
control samples
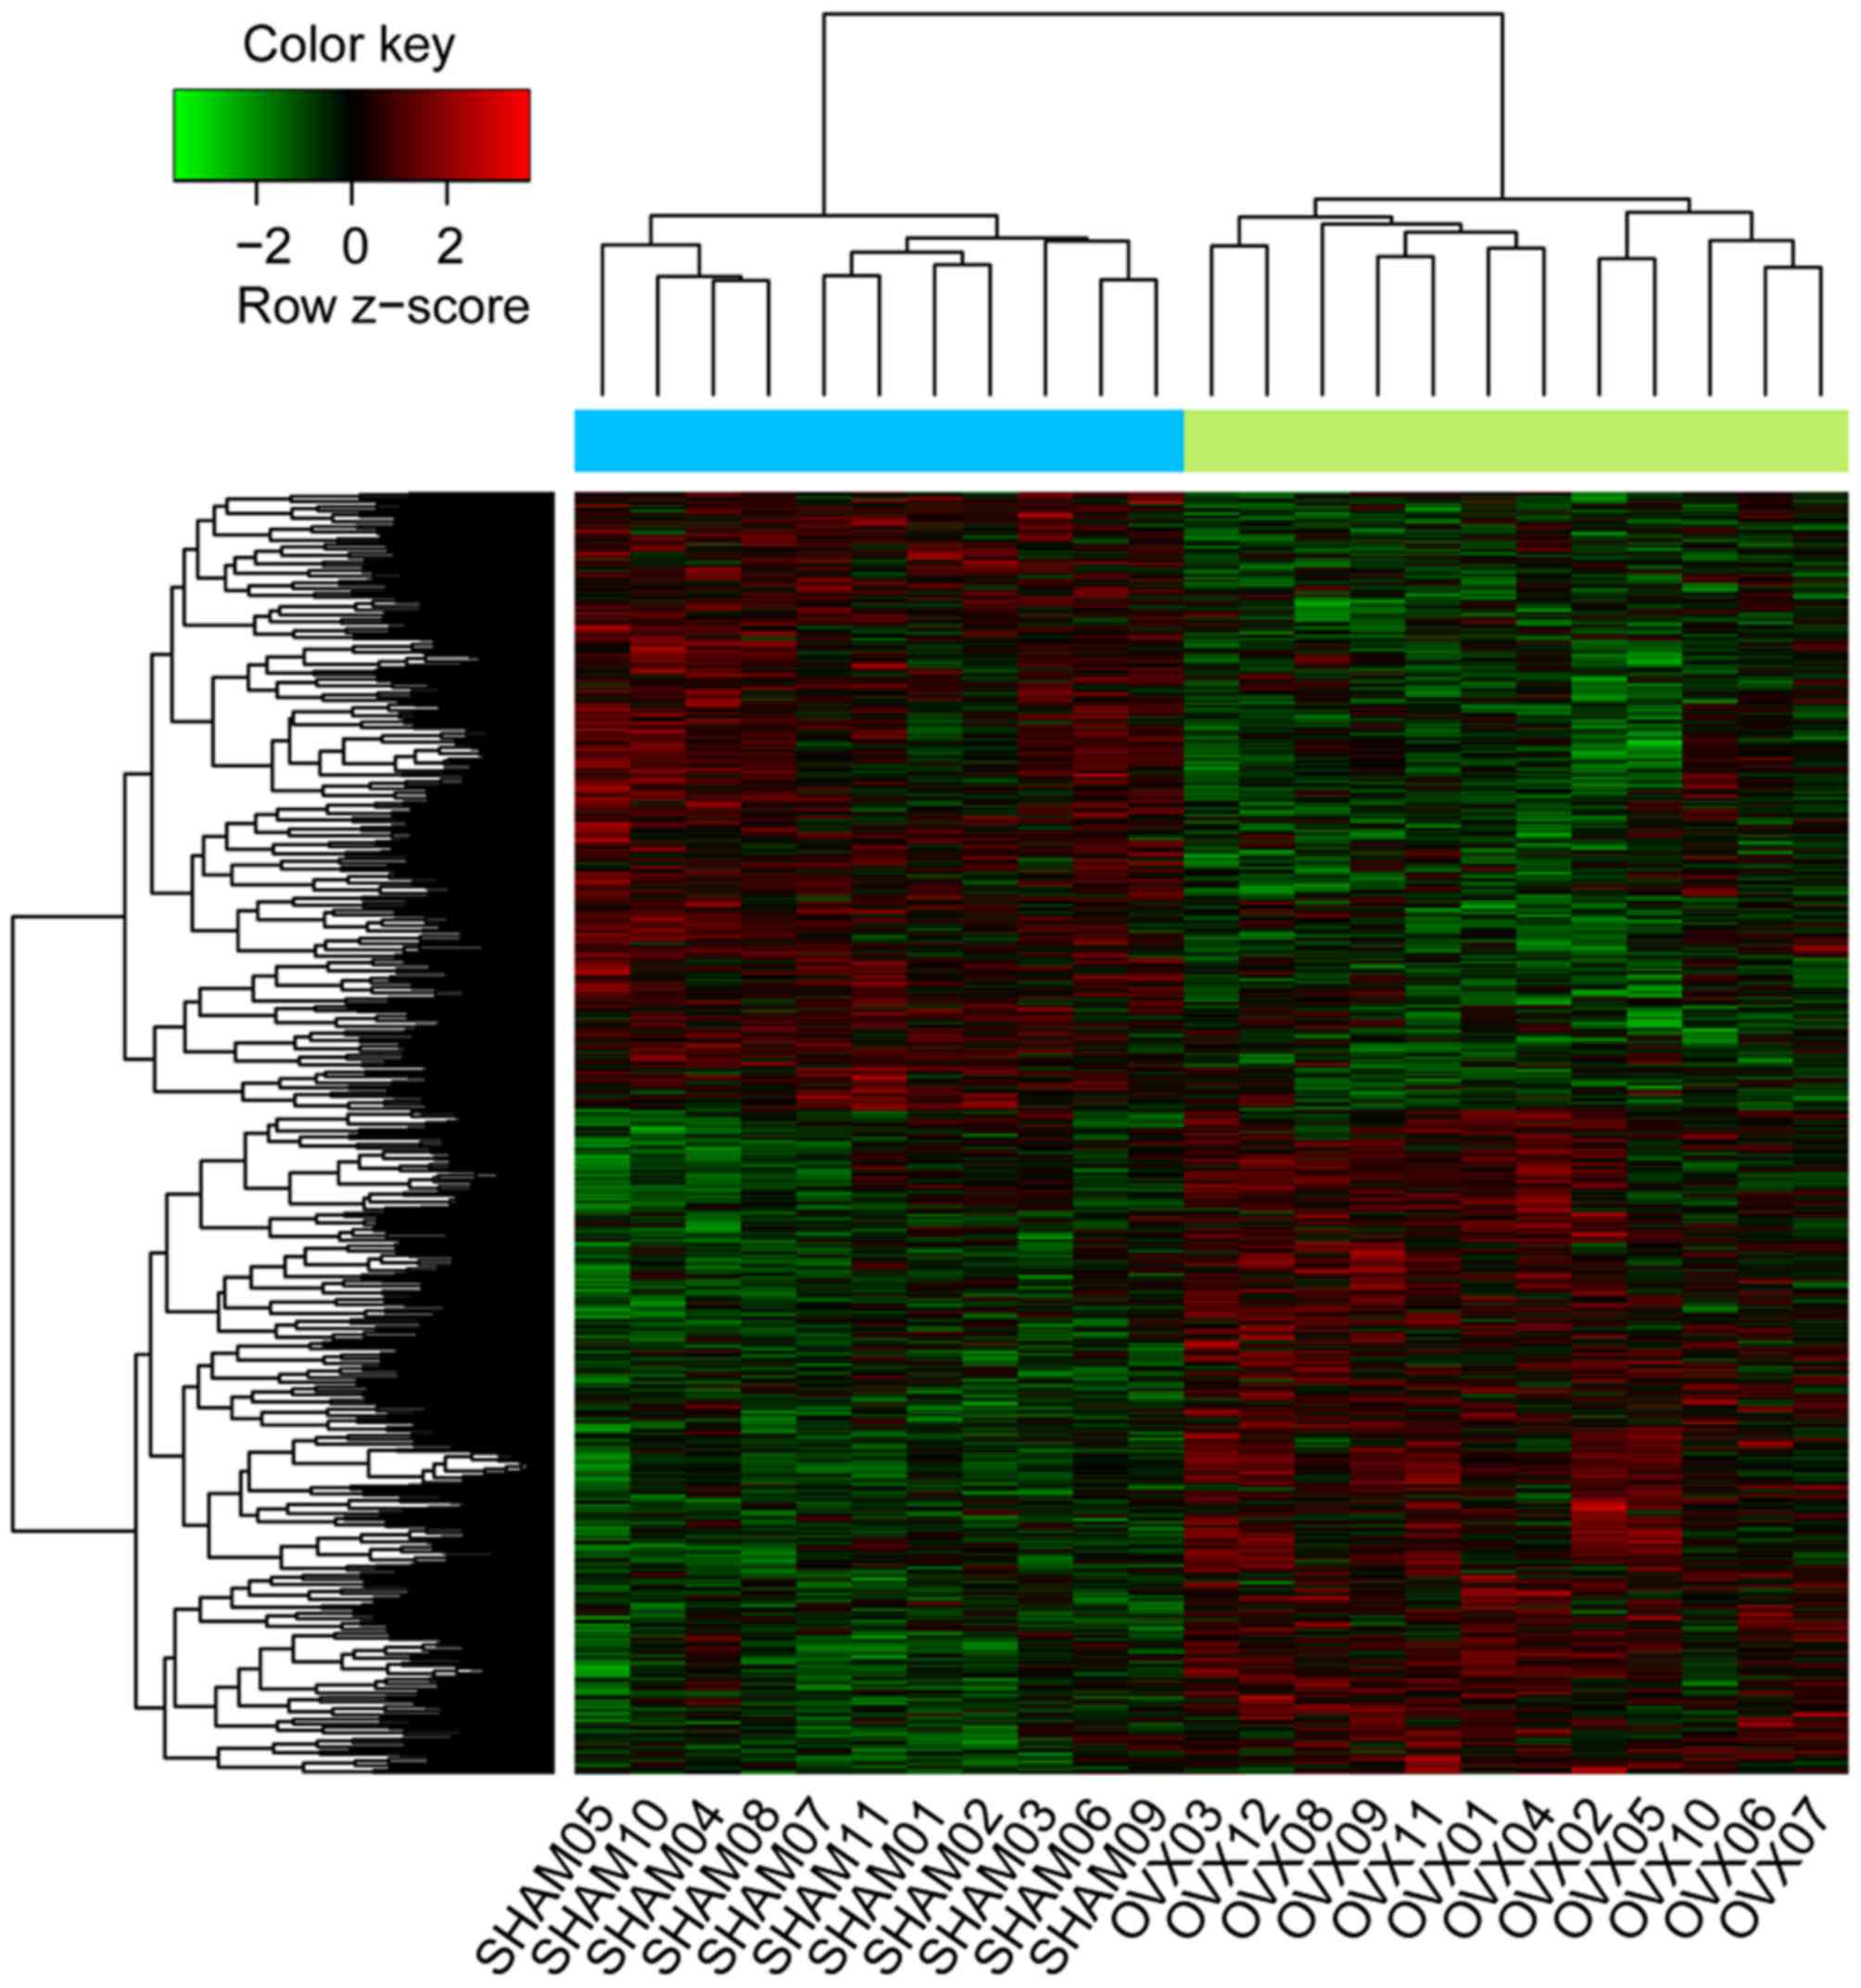
As large amounts of data are included in a gene
expression profile, the original data was analyzed and filtered. A
total of 784 upregulated and 729 downregulated DEGs were
identified. A heat map of upregulated and downregulated DEGs was
constructed (Fig. 1) from DNA
microarray data, reflecting the gene expression values between the
control and OVX groups.
PPI network and module analysis
To identify potential interactions between DEGs, a
PPI network was constructed based on protein interactions between
DEGs. The results identified 552 nodes (genes) in upregulated DEGs,
including protein tyrosine phosphatase receptor type C, protein
tyrosine phosphatase non-receptor type 6, spleen tyrosine kinase,
proto-oncogene vav, phosphatidylinositol-4,5-bisphosphate 3-kinase
catalytic subunit γ isoform and γ-actin 11. In addition, 493 nodes
were identified in downregulated DEGs, including polo-like kinase
1, cell division cycle 6 (CDC6), minichromosome maintenance complex
component (MCM)3, ribonucleoside-diphosphate reductase subunit M2,
MCM7 and baculoviral inhibitor of apoptosis repeat-containing 5
(BIRC5; data not shown).
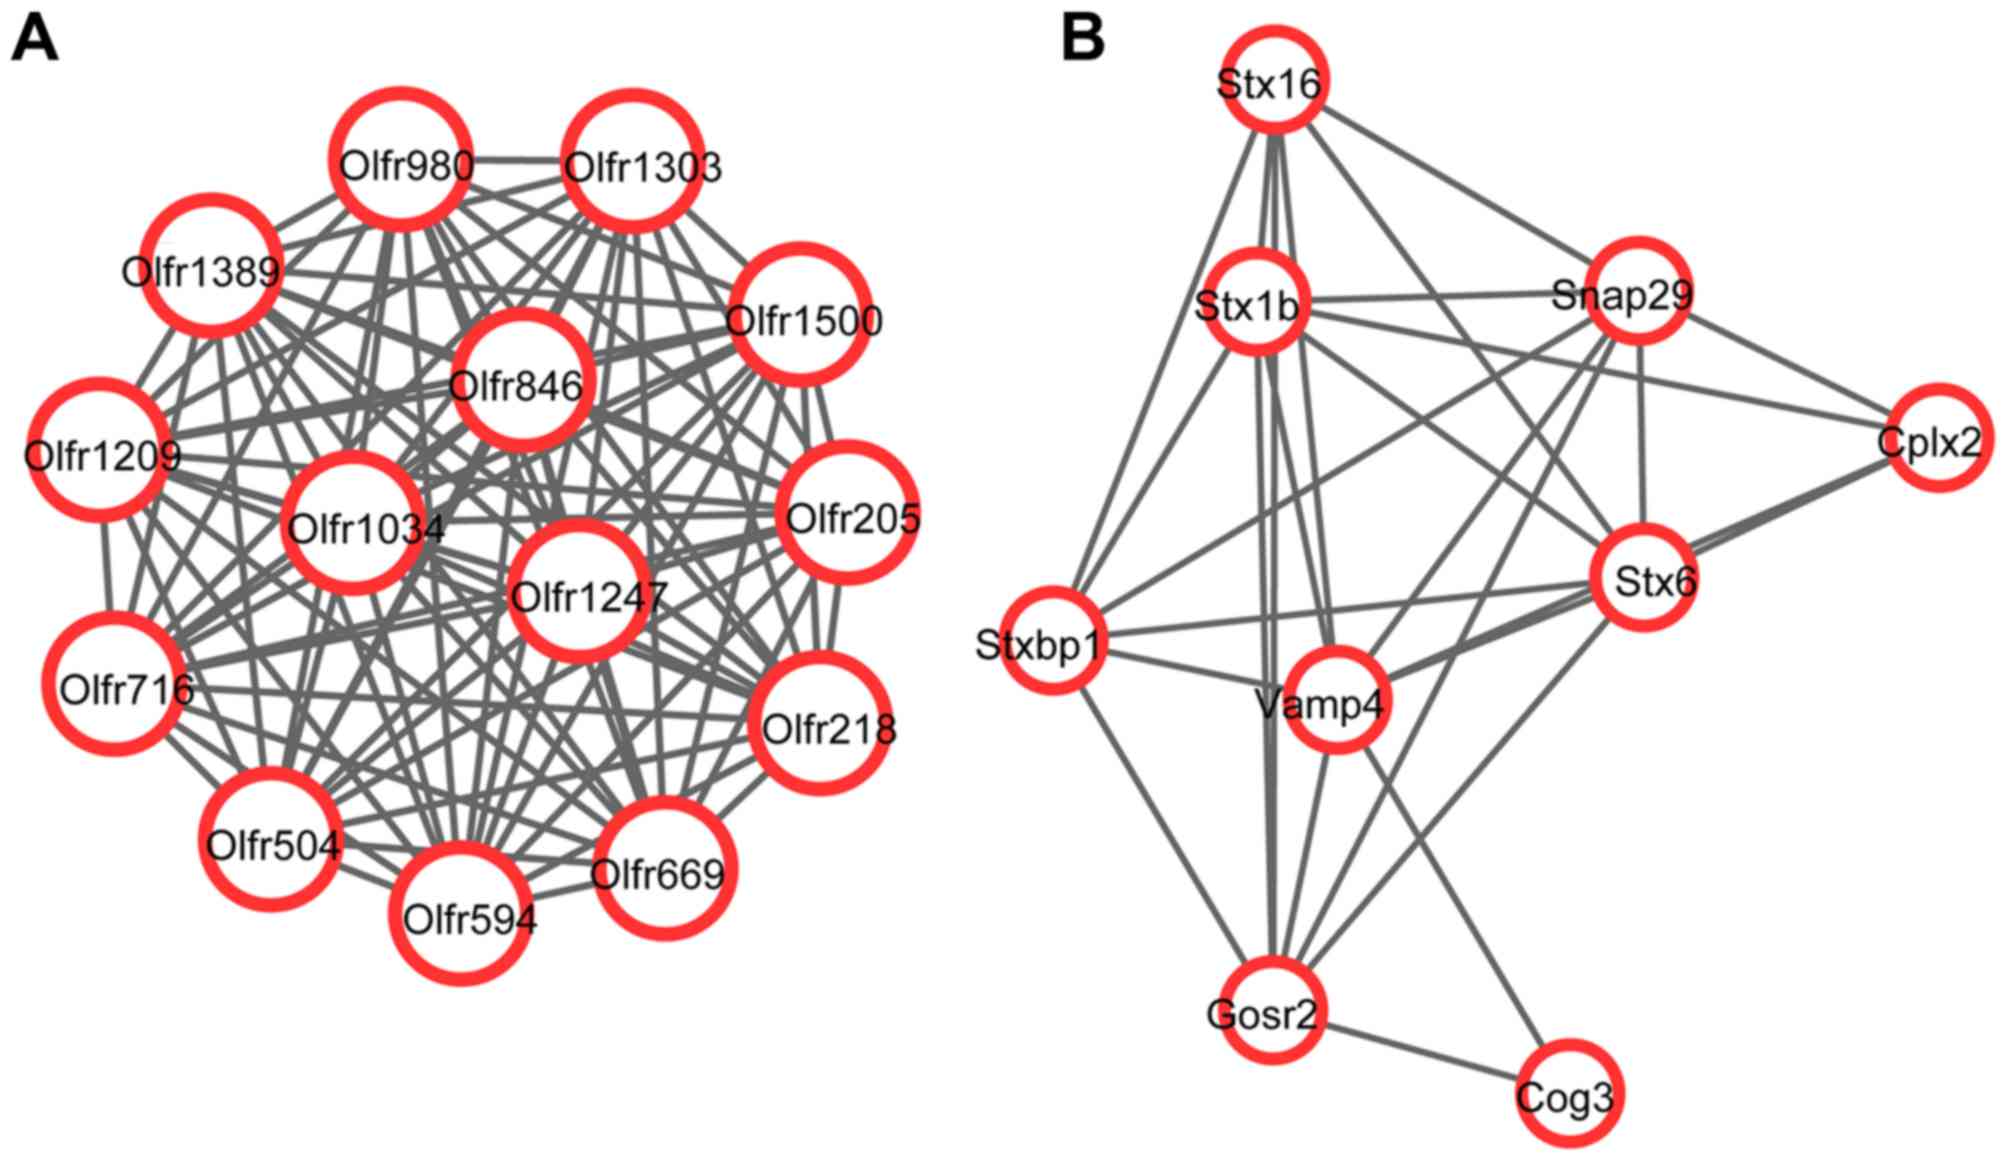
A total of 2 upregulated and 6 downregulated modules
were identified in the PPI network with P<0.001 using Cytoscape
software. There were 14 nodes and 91 interactions in one of the
upregulated modules (module a; P=1.173×10⁻⁷; Fig. 2A) and 9 nodes and 27 interactions
in the other upregulated module (module b; P=5.498×10⁻⁴;
Fig. 2B). The following number of
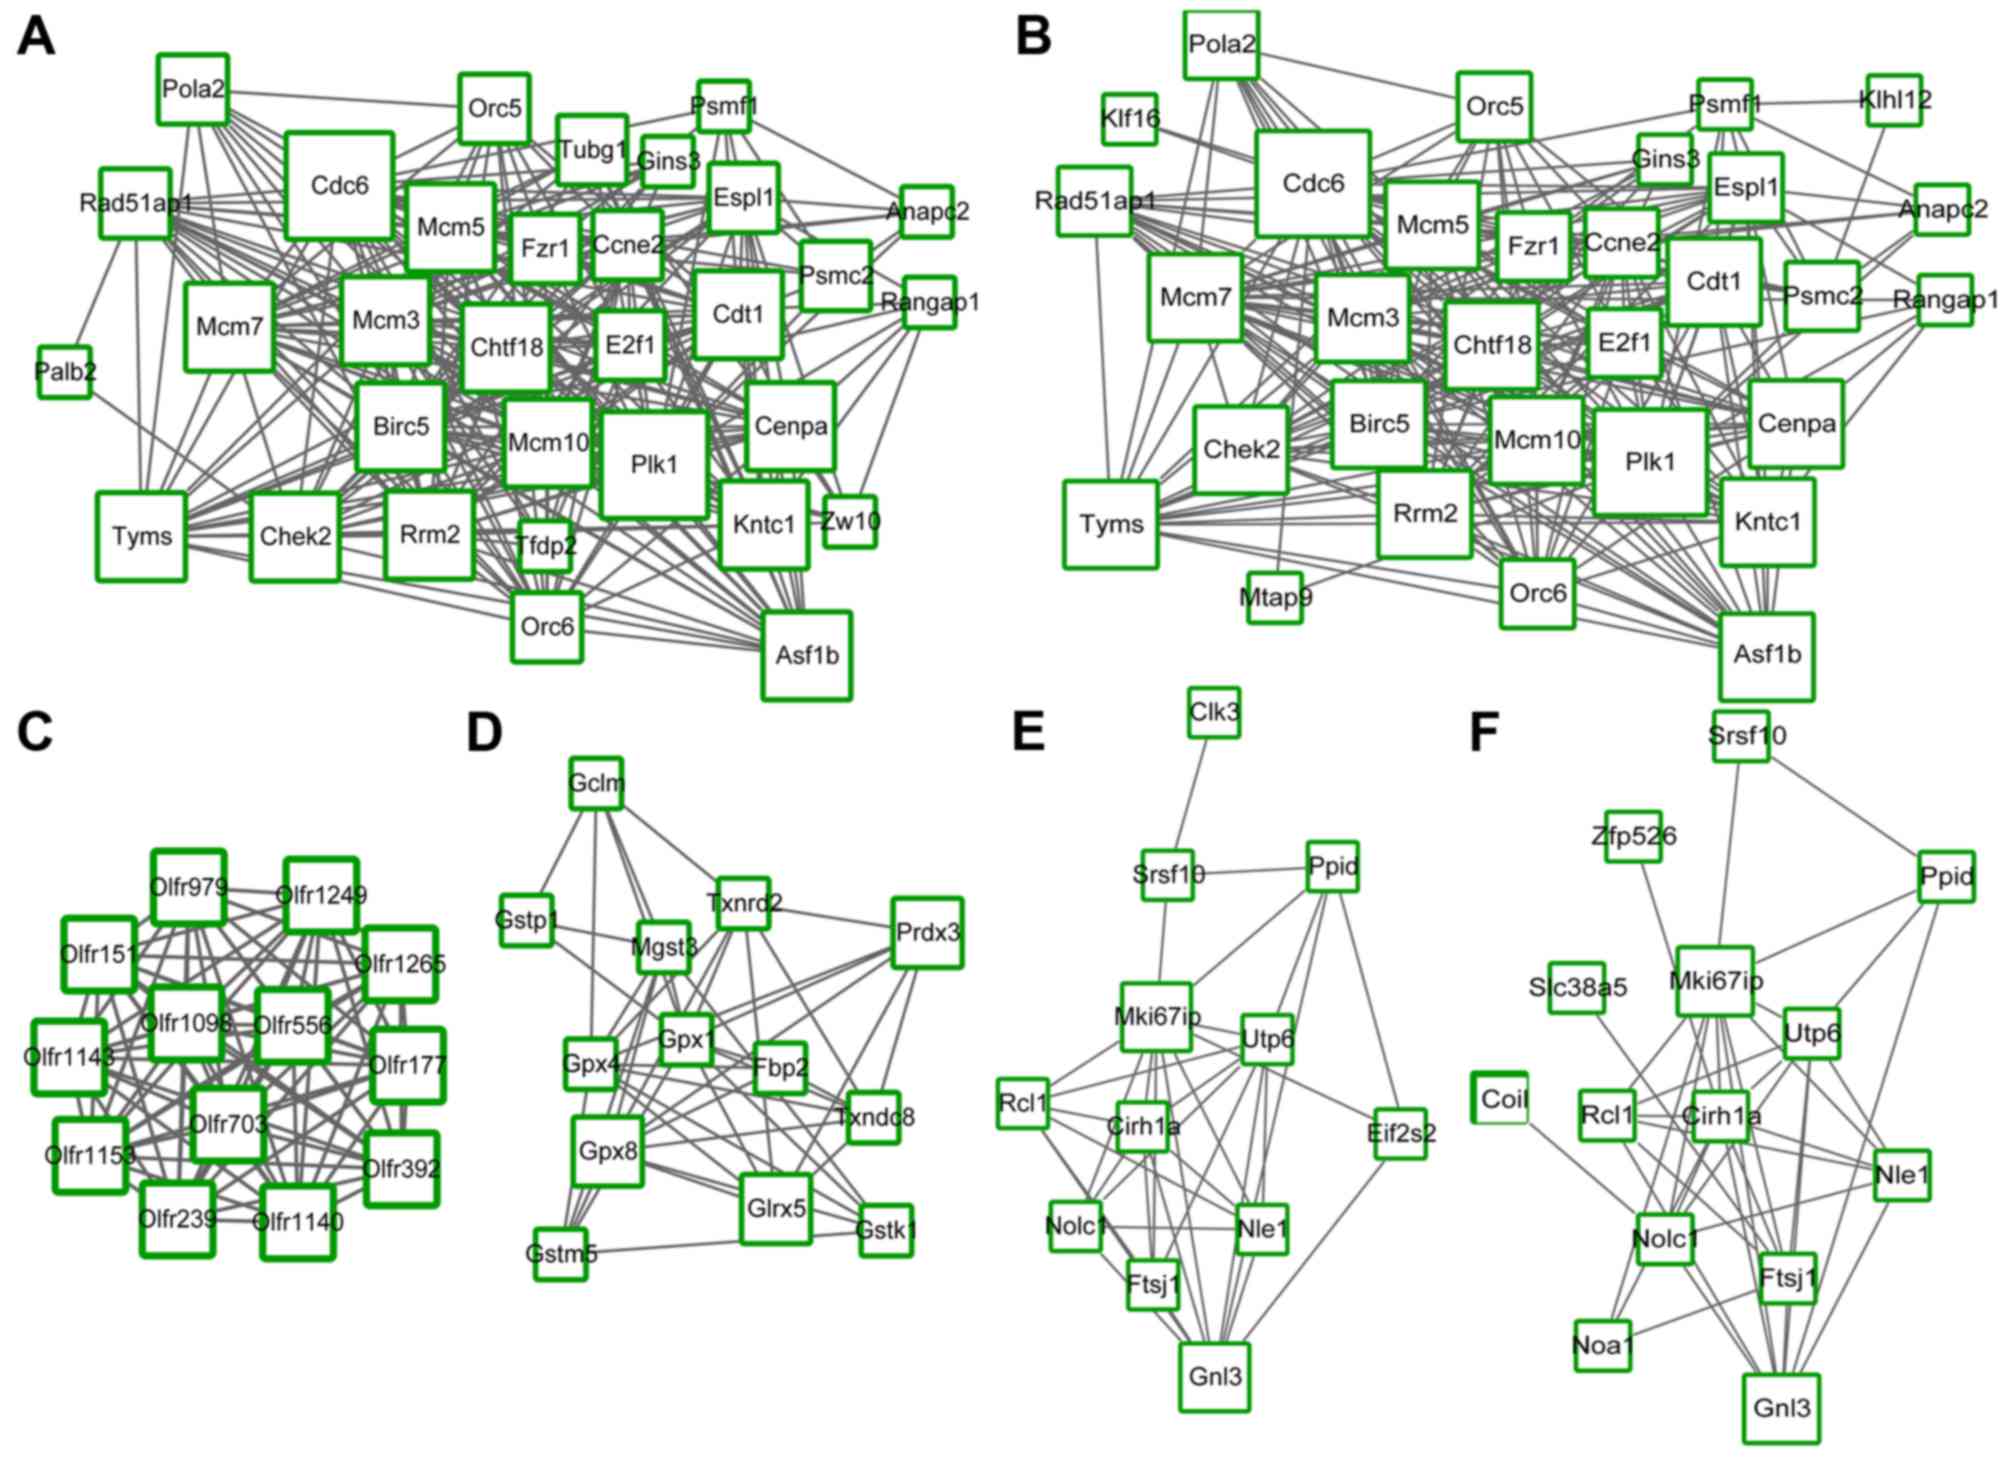
nodes and interactions were observed in the 6 downregulated
modules: 32 nodes and 254 interactions in module a (P=0; Fig. 3A), 31 nodes and 239 interactions in
module b (P=8.384×10⁻⁹; Fig. 3B), 13 nodes and 78 interactions in
module c (P=3.342×10⁻⁷; Fig. 3C), 13 nodes and 41 interactions in
module d (P=5.799×10⁻⁴; Fig. 3D), 12 nodes and 34 interactions in
module e (P=8.300×10⁻⁴; Fig. 3E) and 14 nodes and 36 interactions
in module f (P=9.507×10⁻⁴; Fig. 3F).
Functional enrichment analysis for
DEGs
To further elucidate the roles of DEGs, GO
functional and KEGG pathway enrichment analyses were performed. The
upregulated DEGs were primarily involved in the ‘sensory perception
of smell’ (GO accession no. 0007608), including olfactory receptor
(OLFR)594, OLFR1247, OLFR846, OLFR218 and OLFR1389 genes, and KEGG
pathway ‘olfactory transduction’ (entry no. mmu04740), including
OLFR594, OLFR1247, OLFR846, OLFR218 and OLFR1389 genes (Table I). Furthermore, the downregulated
DEGs were involved in ‘DNA replication initiation’ (GO accession
no. 0006270), including cyclin E2, CDC6, MCM7, and origin
recognition complex subunit 5 and 6 genes, ‘cell cycle’ (GO
accession no. 0007049), including fizzy and cell division cycle
20-related 1 (FZR1), kinetochore-associated 1, BIRC5, checkpoint
kinase 2 and MCM3 genes, and ‘sensory perception of smell’ (GO
accession no. 0007608), including OLFR1249, OLFR239, OLFR177,
OLFR1098 and OLFR703 genes. Downregulated DEGs were primarily
involved in KEGG pathways of ‘cell cycle’ (entry no. mmu04110),
including E2F transcription factor 1, anaphase-promoting complex
subunit 2, CDC6, FZR1 and extra spindle pole bodies-like 1 genes,
‘DNA replication’ (entry no. mmu03030), including MCM7, DNA
polymerase α subunit 2, MCM3 and MCM5 genes, and ‘glutathione
metabolism’ (entry no. mmu00480), including microsomal glutathione
S-transferase 3, glutathione peroxidase (GPX)1, glutathione
S-transferase κ1, GPX4 and GPX8 genes. Detailed functional analyses
of downregulated DEGs in 6 modules are presented in Table II.
 | Table I.Results of GO function and KEGG
pathway enrichment analyses of upregulated differentially expressed
genes in postmenopausal osteoporosis (all the significant terms or
the top 5 most significant terms of the KEGG pathways or GO_BP were
listed). |
Table I.
Results of GO function and KEGG
pathway enrichment analyses of upregulated differentially expressed
genes in postmenopausal osteoporosis (all the significant terms or
the top 5 most significant terms of the KEGG pathways or GO_BP were
listed).
| A, GO function and
KEGG pathway enrichment analyses of DEGs in the upregulated module
a |
|---|
|
|---|
| ID | Analysis type | Process | Count | P-value | Genes |
|---|
| mmu04740 | KEGG pathway | Olfactory
transduction | 13 |
5.33×10⁻¹¹ | OLFR594, OLFR1247,
OLFR846, OLFR218, OLFR1389, OLFR1303, OLFR1209, OLFR980, OLFR1034,
OLFR1500, OLFR716, OLFR205, OLFR669 |
| GO: 0007608 | GO_BP | Sensory perception
of smell | 14 |
2.41×10⁻¹⁶ | OLFR594, OLFR1247,
OLFR846, OLFR218, OLFR1389, OLFR1303, OLFR1209, OLFR980, OLFR1034,
OLFR1500, OLFR716, OLFR205, OLFR504, OLFR669 |
| GO: 0007186 | GO_BP | G-protein coupled
receptor signaling pathway | 14 |
4.50×10⁻¹⁴ | OLFR594, OLFR1247,
OLFR846, OLFR218, OLFR1389, OLFR1303, OLFR1209, OLFR980, OLFR1034,
OLFR1500, OLFR716, OLFR205, OLFR504, OLFR669 |
| GO: 0050907 | GO_BP | Detection of
chemical stimulus involved in sensory perception | 4 |
3.83×10⁻⁴ | OLFR1247, OLFR218,
OLFR1303, OLFR1209 |
|
| B, GO function
and KEGG pathway enrichment analyses of DEGs in the upregulated
module b |
|
| ID | Analysis
type | Process | Count | P-value | Genes |
|
| mmu04130 | KEGG pathway | SNARE interactions
in vesicular transport | 6 |
2.17×10⁻¹¹ | SNAP29, STX6,
STX16, VAMP4, GOSR2, STX1B |
| mmu04721 | KEGG pathway | Synaptic vesicle
cycle | 3 |
1.30×10⁻³ | CPLX2, STXBP1,
STX1B |
| GO: 0016192 | GO_BP | Vesicle-mediated
transport | 6 |
1.18×10⁻⁸ | STX6, STX16,
STXBP1, VAMP4, GOSR2, STX1B |
| GO: 0015031 | GO_BP | Protein
transport | 7 |
3.18×10⁻⁸ | COG3, SNAP29, STX6,
STX16, STXBP1, GOSR2, STX1B |
| GO: 0006810 | GO_BP | Transport | 8 |
7.62×10⁻⁷ | COG3, SNAP29, STX6,
CPLX2, STX16, STXBP1, GOSR2, STX1B |
| GO: 0090161 | GO_BP | Golgi ribbon
formation | 3 |
9.40×10⁻⁶ | STX6, STX16,
VAMP4 |
| GO: 0031629 | GO_BP | Synaptic vesicle
fusion to presynaptic active zone membrane | 3 |
1.55×10⁻⁵ | SNAP29, STXBP1,
STX1B |
| Table II.Results of GO function and KEGG
pathway enrichment analyses of downregulated DEGs in postmenopausal
osteoporosis (all the significant terms or the top 5 most
significant terms of the KEGG pathways or GO_BP were listed). |
Table II.
Results of GO function and KEGG
pathway enrichment analyses of downregulated DEGs in postmenopausal
osteoporosis (all the significant terms or the top 5 most
significant terms of the KEGG pathways or GO_BP were listed).
| A, GO function and
KEGG pathway enrichment analyses of DEGs in the downregulated
module a |
|---|
|
|---|
| ID | Analysis type | Process | Count | P-value | Genes |
|---|
| mmu04110 | KEGG pathway | Cell cycle | 14 |
4.52×10⁻¹⁹ | E2F1, ANAPC2, CDC6,
FZR1, ESPL1, CHEK2, MCM3, MCM5, CCNE2, MCM7, PLK1, TFDP2, ORC5,
ORC6 |
| mmu03030 | KEGG pathway | DNA
replication | 4 |
1.07×10⁻⁴ | MCM7, POLA2, MCM3,
MCM5 |
| mmu04114 | KEGG pathway | Oocyte meiosis | 4 |
3.11×10⁻³ | CCNE2, ANAPC2,
PLK1, ESPL1 |
| mmu04115 | KEGG pathway | P53 signaling
pathway | 3 |
1.40×10⁻² | CCNE2, RRM2,
CHEK2 |
| mmu04914 | KEGG pathway |
Progesterone-mediated oocyte
maturation | 3 |
2.29×10⁻² | ANAPC2, FZR1,
PLK1 |
| GO: 0006270 | GO_BP | DNA replication
initiation | 9 |
2.01×10⁻¹⁷ | CCNE2, CDC6, MCM7,
ORC5, ORC6, POLA2, MCM3, MCM10, MCM5 |
| GO: 0006260 | GO_BP | DNA
replication | 12 |
6.83×10⁻¹⁷ | CDC6, MCM7, GINS3,
RRM2, CHTF18, ORC5, ORC6, POLA2, MCM3, MCM10, MCM5, CDT1 |
| GO: 0007049 | GO_BP | Cell cycle | 16 |
1.41×10⁻¹⁴ | E2F1, ANAPC2, CDC6,
FZR1, KNTC1, BIRC5, CHEK2, MCM3, MCM5, CDT1, CCNE2, MCM7, PLK1,
TFDP2, CHTF18, ZW10 |
| GO: 0051301 | GO_BP | Cell division | 10 |
8.49×10⁻⁹ | CCNE2, ANAPC2,
CDC6, FZR1, PLK1, BIRC5, CHEK2, KNTC1, MCM5, ZW10 |
| GO: 0007067 | GO_BP | Mitotic nuclear
division | 9 |
1.59×10⁻⁸ | ANAPC2, CDC6, FZR1,
PLK1, KNTC1, BIRC5, ESPL1, CHEK2, ZW10 |
|
| B, GO function
and KEGG pathway enrichment analyses of DEGs in the downregulated
module b |
|
| ID | Analysis
type | Process | Count | P-value | Genes |
|
| mmu04110 | KEGG pathway | Cell cycle | 13 |
7.81×10⁻¹⁸ | CCNE2, E2F1,
ANAPC2, CDC6, FZR1, MCM7, PLK1, ORC5, ORC6, ESPL1, CHEK2, MCM3,
MCM5 |
| mmu03030 | KEGG pathway | DNA
replication | 4 |
7.87×10⁻⁵ | MCM7, POLA2, MCM3,
MCM5 |
| mmu04114 | KEGG pathway | Oocyte meiosis | 4 |
2.31×10⁻³ | CCNE2, ANAPC2,
PLK1, ESPL1 |
| mmu04115 | KEGG pathway | P53 signaling
pathway | 3 |
1.15×10⁻² | CCNE2, RRM2,
CHEK2 |
| mmu04914 | KEGG pathway |
Progesterone-mediated oocyte
maturation | 3 |
1.90×10⁻² | CCNE2, RRM2,
CHEK2 |
| GO: 0006270 | GO_BP | DNA replication
initiation | 9 |
1.09×10⁻¹⁷ | CCNE2, CDC6, MCM7,
ORC5, ORC6, POLA2, MCM3, MCM10, MCM5 |
| GO: 0006260 | GO_BP | DNA
replication | 12 |
2.82×10⁻¹⁷ | CDC6, MCM7, GINS3,
RRM2, CHTF18, ORC5, ORC6, POLA2, MM3,C MCM10, MCM5, CDT1 |
| GO: 0007049 | GO_BP | Cell cycle | 14 |
2.90×10⁻¹² | CCNE2, E2F1,
ANAPC2, CDC6, FZR1, MCM7, PLK1, KNTC1, CHTF18, BIRC5, CHEK2, MCM3,
MCM5, CDT1 |
| GO: 0051301 | GO_BP | Cell division | 9 |
9.13×10⁻⁸ | CCNE2, ANAPC2,
CDC6, FZR1, PLK1, KNTC1, BIRC5, CHEK2, MCM5 |
| GO: 0007067 | GO_BP | Mitotic nuclear
division | 8 |
2.15×10⁻⁷ | ANAPC2, CDC6, FZR1,
PLK1, KNTC1, BIRC5, ESPL1, CHEK2 |
|
| C, GO function
and KEGG pathway enrichment analyses of DEGs in the downregulated
module c |
|
| ID | Analysis
type | Process | Count | P-value | Genes |
|
| mmu04740 | KEGG pathway | Olfactory
transduction | 12 |
3.84×10⁻¹⁰ | OLFR239, OLFR177,
OLFR1143, OLFR556, OLFR1098, OLFR703, OLFR1265, OLFR151, OLFR392,
OLFR979, OLFR1140, OLFR1153 |
| GO: 0007608 | GO_BP | Sensory perception
of smell | 13 |
3.85×10⁻¹⁵ | OLFR1249, OLFR239,
OLFR177, OLFR1098, OLFR703, OLFR1265, OLFR151, OLFR1143, OLFR556,
OLFR392, OLFR1153, OLFR1140, OLFR979 |
| GO:0007186 | GO_BP | G-protein coupled
receptor signaling pathway | 13 |
4.80×10⁻¹³ | OLFR1249, OLFR239,
OLFR177, OLFR1098, OLFR703, OLFR1265, OLFR151, OLFR1143, OLFR556,
OLFR392, OLFR1153, OLFR1140, OLFR979 |
|
| D, GO function
and KEGG pathway enrichment analyses of DEGs in the downregulated
module d |
|
| ID | Analysis
type | Process | Count | P-value | Genes |
|
| mmu00480 | KEGG pathway | Glutathione
metabolism | 8 |
2.23×10⁻¹⁴ | MGST3, GPX1, GSTK1,
GPX4, GPX8, GCLM, GSTM5, GSTP1 |
| mmu00980 | KEGG pathway | Metabolism of
xenobiotics by cytochrome P450 | 4 |
4.41×10⁻⁵ | MGST3, GSTK1,
GSTM5, GSTP1 |
| mmu00982 | KEGG pathway | Drug
metabolism-cytochrome P450 | 4 |
4.83×10⁻⁵ | MGST3, GSTK1,
GSTM5, GSTP1 |
| mmu05204 | KEGG pathway | Chemical
carcinogenesis | 4 |
1.31×10⁻⁴ | MGST3, GSTK1,
GSTM5, GSTP1 |
| GO: 0006749 | GO_BP | Glutathione
metabolic process | 6 |
9.25×10⁻¹¹ | GPX1, GSTK1, GPX4,
GCLM, GSTM5, GSTP1 |
| GO: 0045454 | GO_BP | Cell redox
homeostasis | 5 |
7.37×10⁻⁸ | GPX1, GLRX5,
TXNDC8, TXNRD2, PRDX3 |
| GO: 0006979 | GO_BP | Response to
oxidative stress | 5 |
1.32×10⁻⁶ | GPX1, GPX4, GPX8,
PRDX3, GCLM |
| GO: 0055114 | GO_BP | Oxidation-reduction
process | 6 |
4.58×10⁻⁵ | GPX1, TXNDC8, GPX4,
TXNRD2, GPX8, PRDX3 |
| GO: 0042744 | GO_BP | Hydrogen peroxide
catabolic process | 2 |
9.25×10⁻³ | GPX1, PRDX3 |
|
| E, GO function
and KEGG pathway enrichment analyses of DEGs in the downregulated
module e |
|
| ID | Analysis
type | Process | Count | P-value | Genes |
|
| mmu03008 | KEGG pathway | Ribosome biogenesis
in eukaryotes | 4 |
1.18×10⁻⁵ | RCL1, UTP6, CIRH1A,
GNL3 |
| GO: 0006364 | GO_BP | rRNA
processing | 3 |
2.09×10⁻³ | RCL1, UTP6,
CIRH1A |
| GO: 0006396 | GO_BP | RNA processing | 2 |
3.97×10⁻² | RCL1, UTP6 |
| GO: 0042254 | GO_BP | Ribosome
biogenesis | 2 |
4.82×10⁻² | RCL1, UTP6 |
|
| F, GO function
and KEGG pathway enrichment analyses of DEGs in the downregulated
module f |
|
| ID | Analysis
type | Process | Count | P-value | Genes |
|
| mmu03008 | KEGG pathway | Ribosome biogenesis
in eukaryotes | 4 |
1.18×10⁻⁵ | RCL1, UTP6, CIRH1A,
GNL3 |
| GO: 0042254 | GO_BP | Ribosome
biogenesis | 3 |
1.28×10⁻³ | RCL1, NOA1,
GNL3 |
| GO: 0006364 | GO_BP | rRNA
processing | 3 |
2.54×10⁻³ | RCL1, UTP6,
CIRH1A |
| GO: 0006396 | GO_BP | RNA processing | 2 |
4.35×10⁻² | RCL1, UTP6 |
TF-target gene regulatory network
analysis
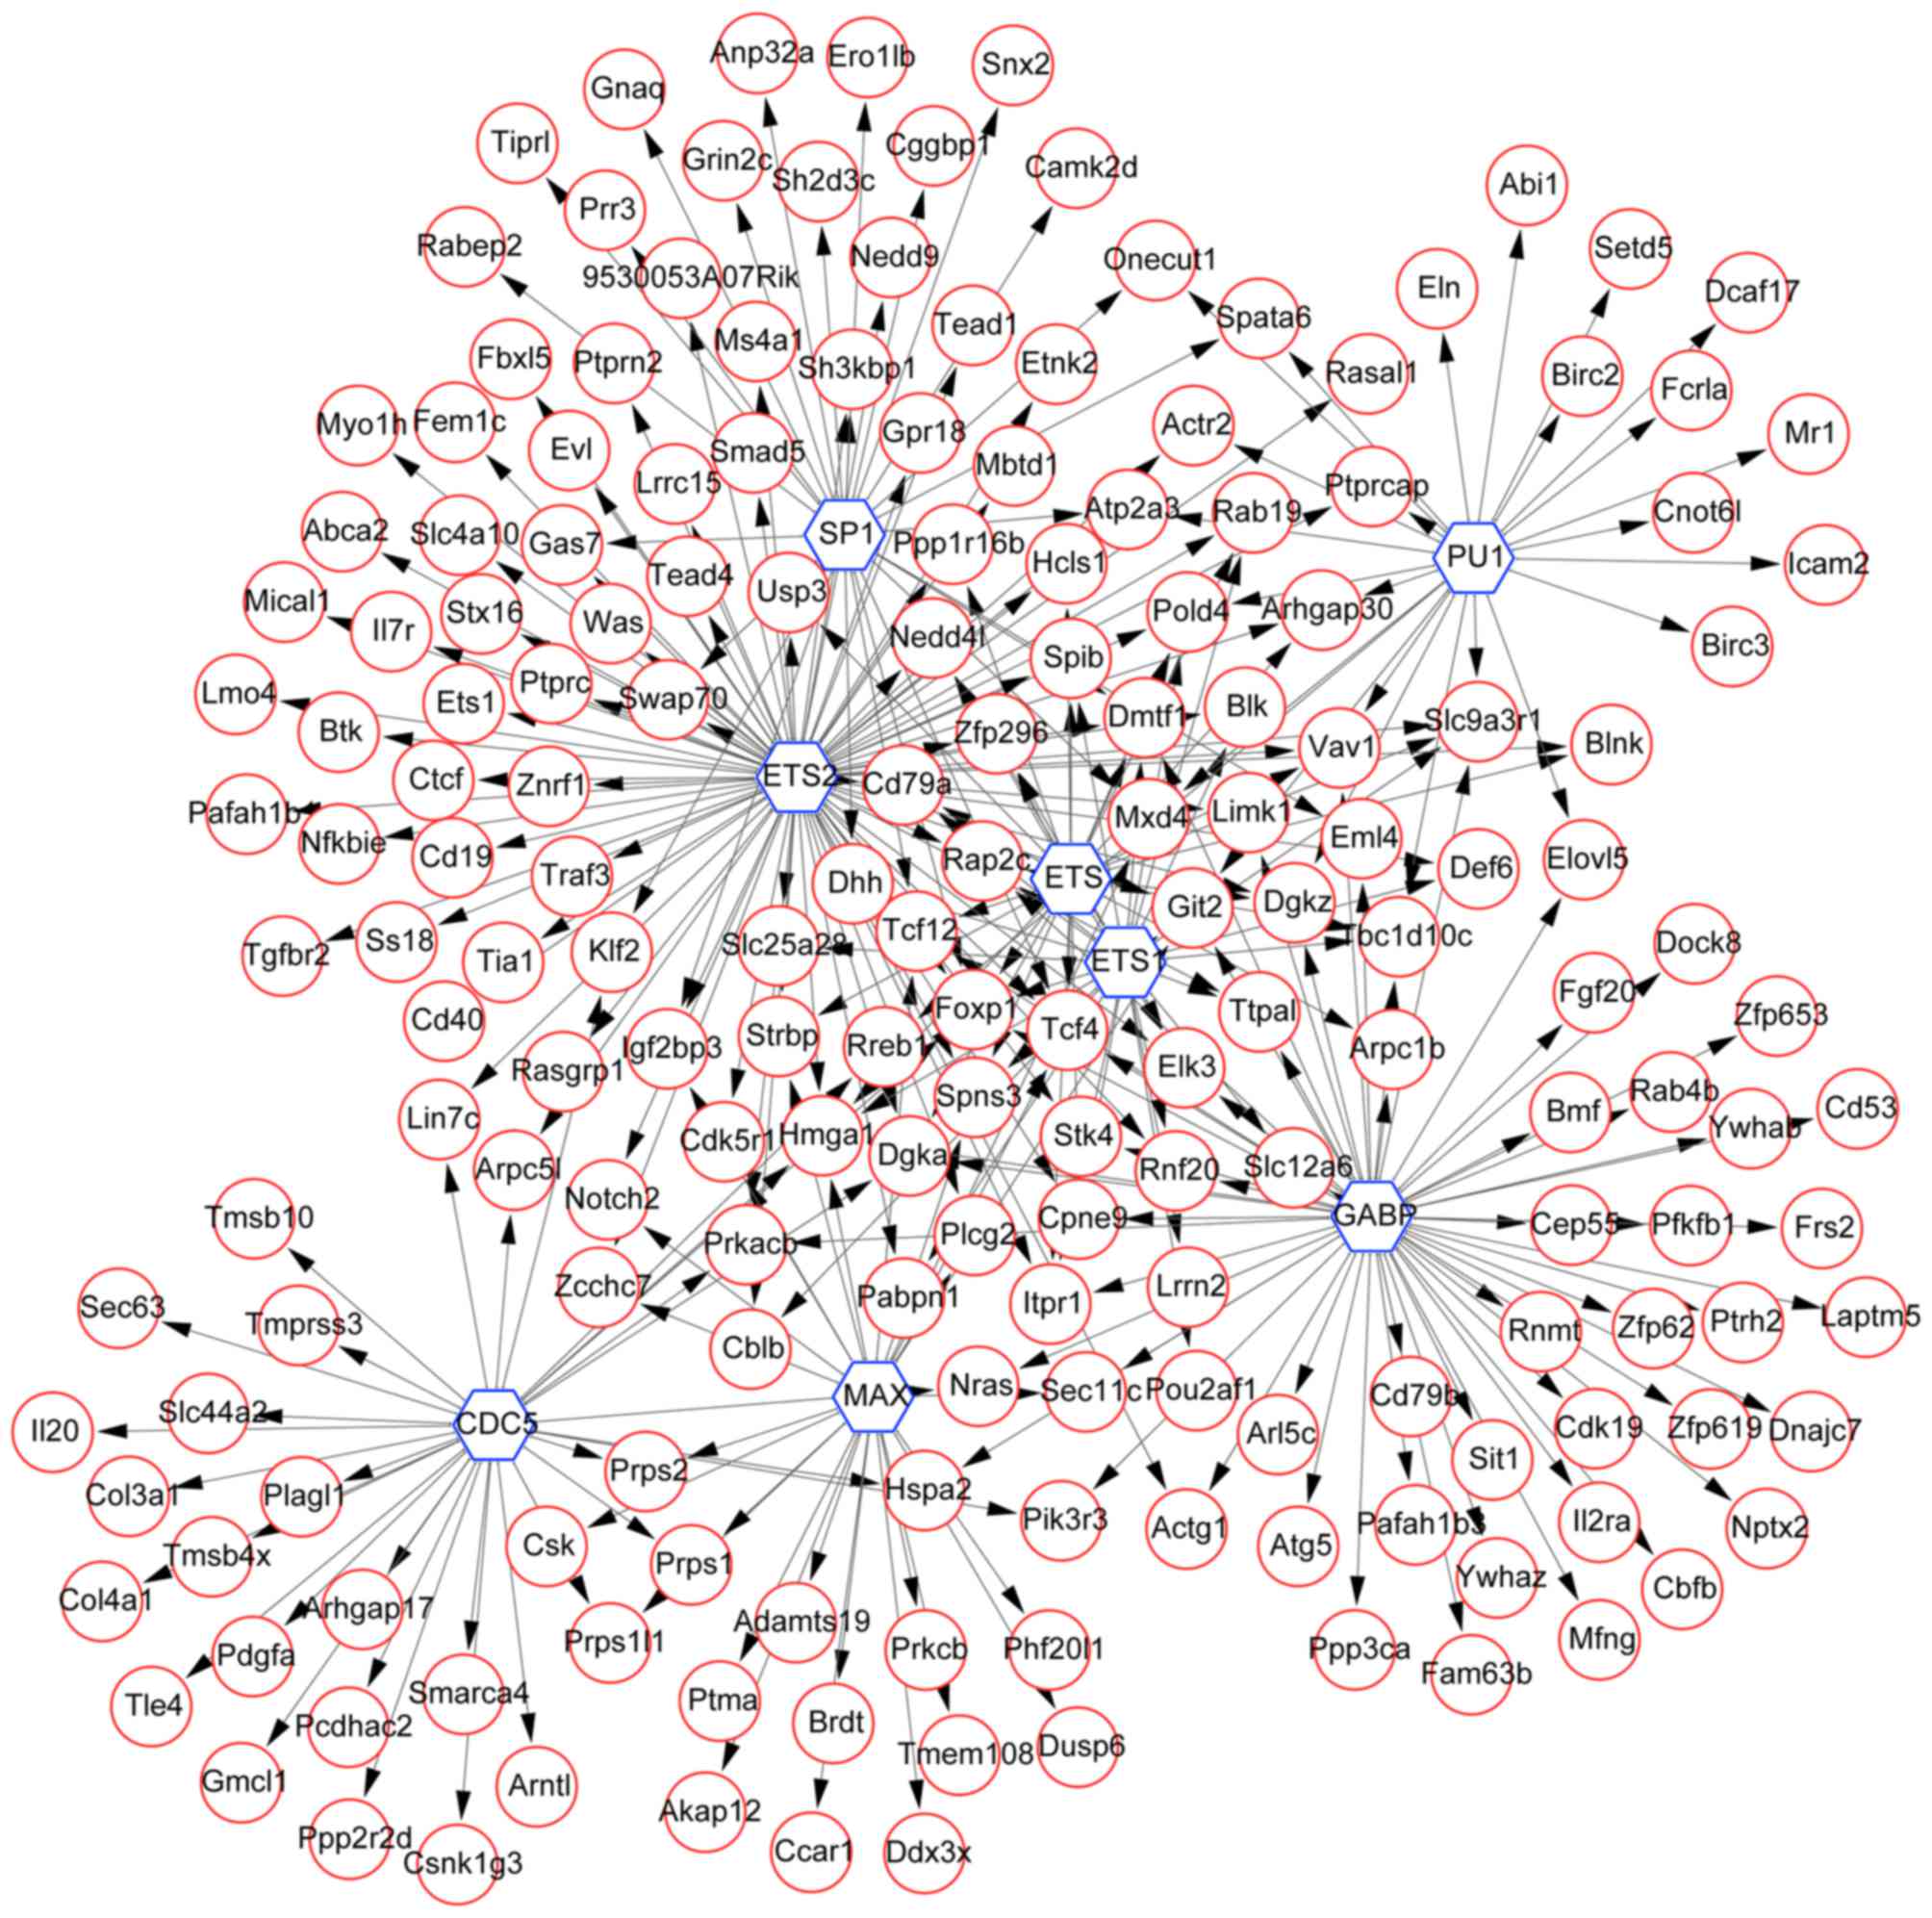
To further investigate the association between TFs
and their target genes, the TF-target gene network was constructed
using WebGestalt software. Using FDR<0.05 as a cut-off value,
the results demonstrated that there were 187 upregulated DEGs,
including high-mobility group protein, forkhead box protein P1,
sodium-hydrogen antiporter 3 regulator 1 and G protein-coupled
receptor kinase-interactor 2, and certain TFs, including protein
ETS1, ETS-2 and other ETS family members, GA-binding protein,
myc-associated factor X, Spi-1 proto-oncogene/PU1, SP1 TF (SP1) and
CDC5 in this network (Fig. 4).
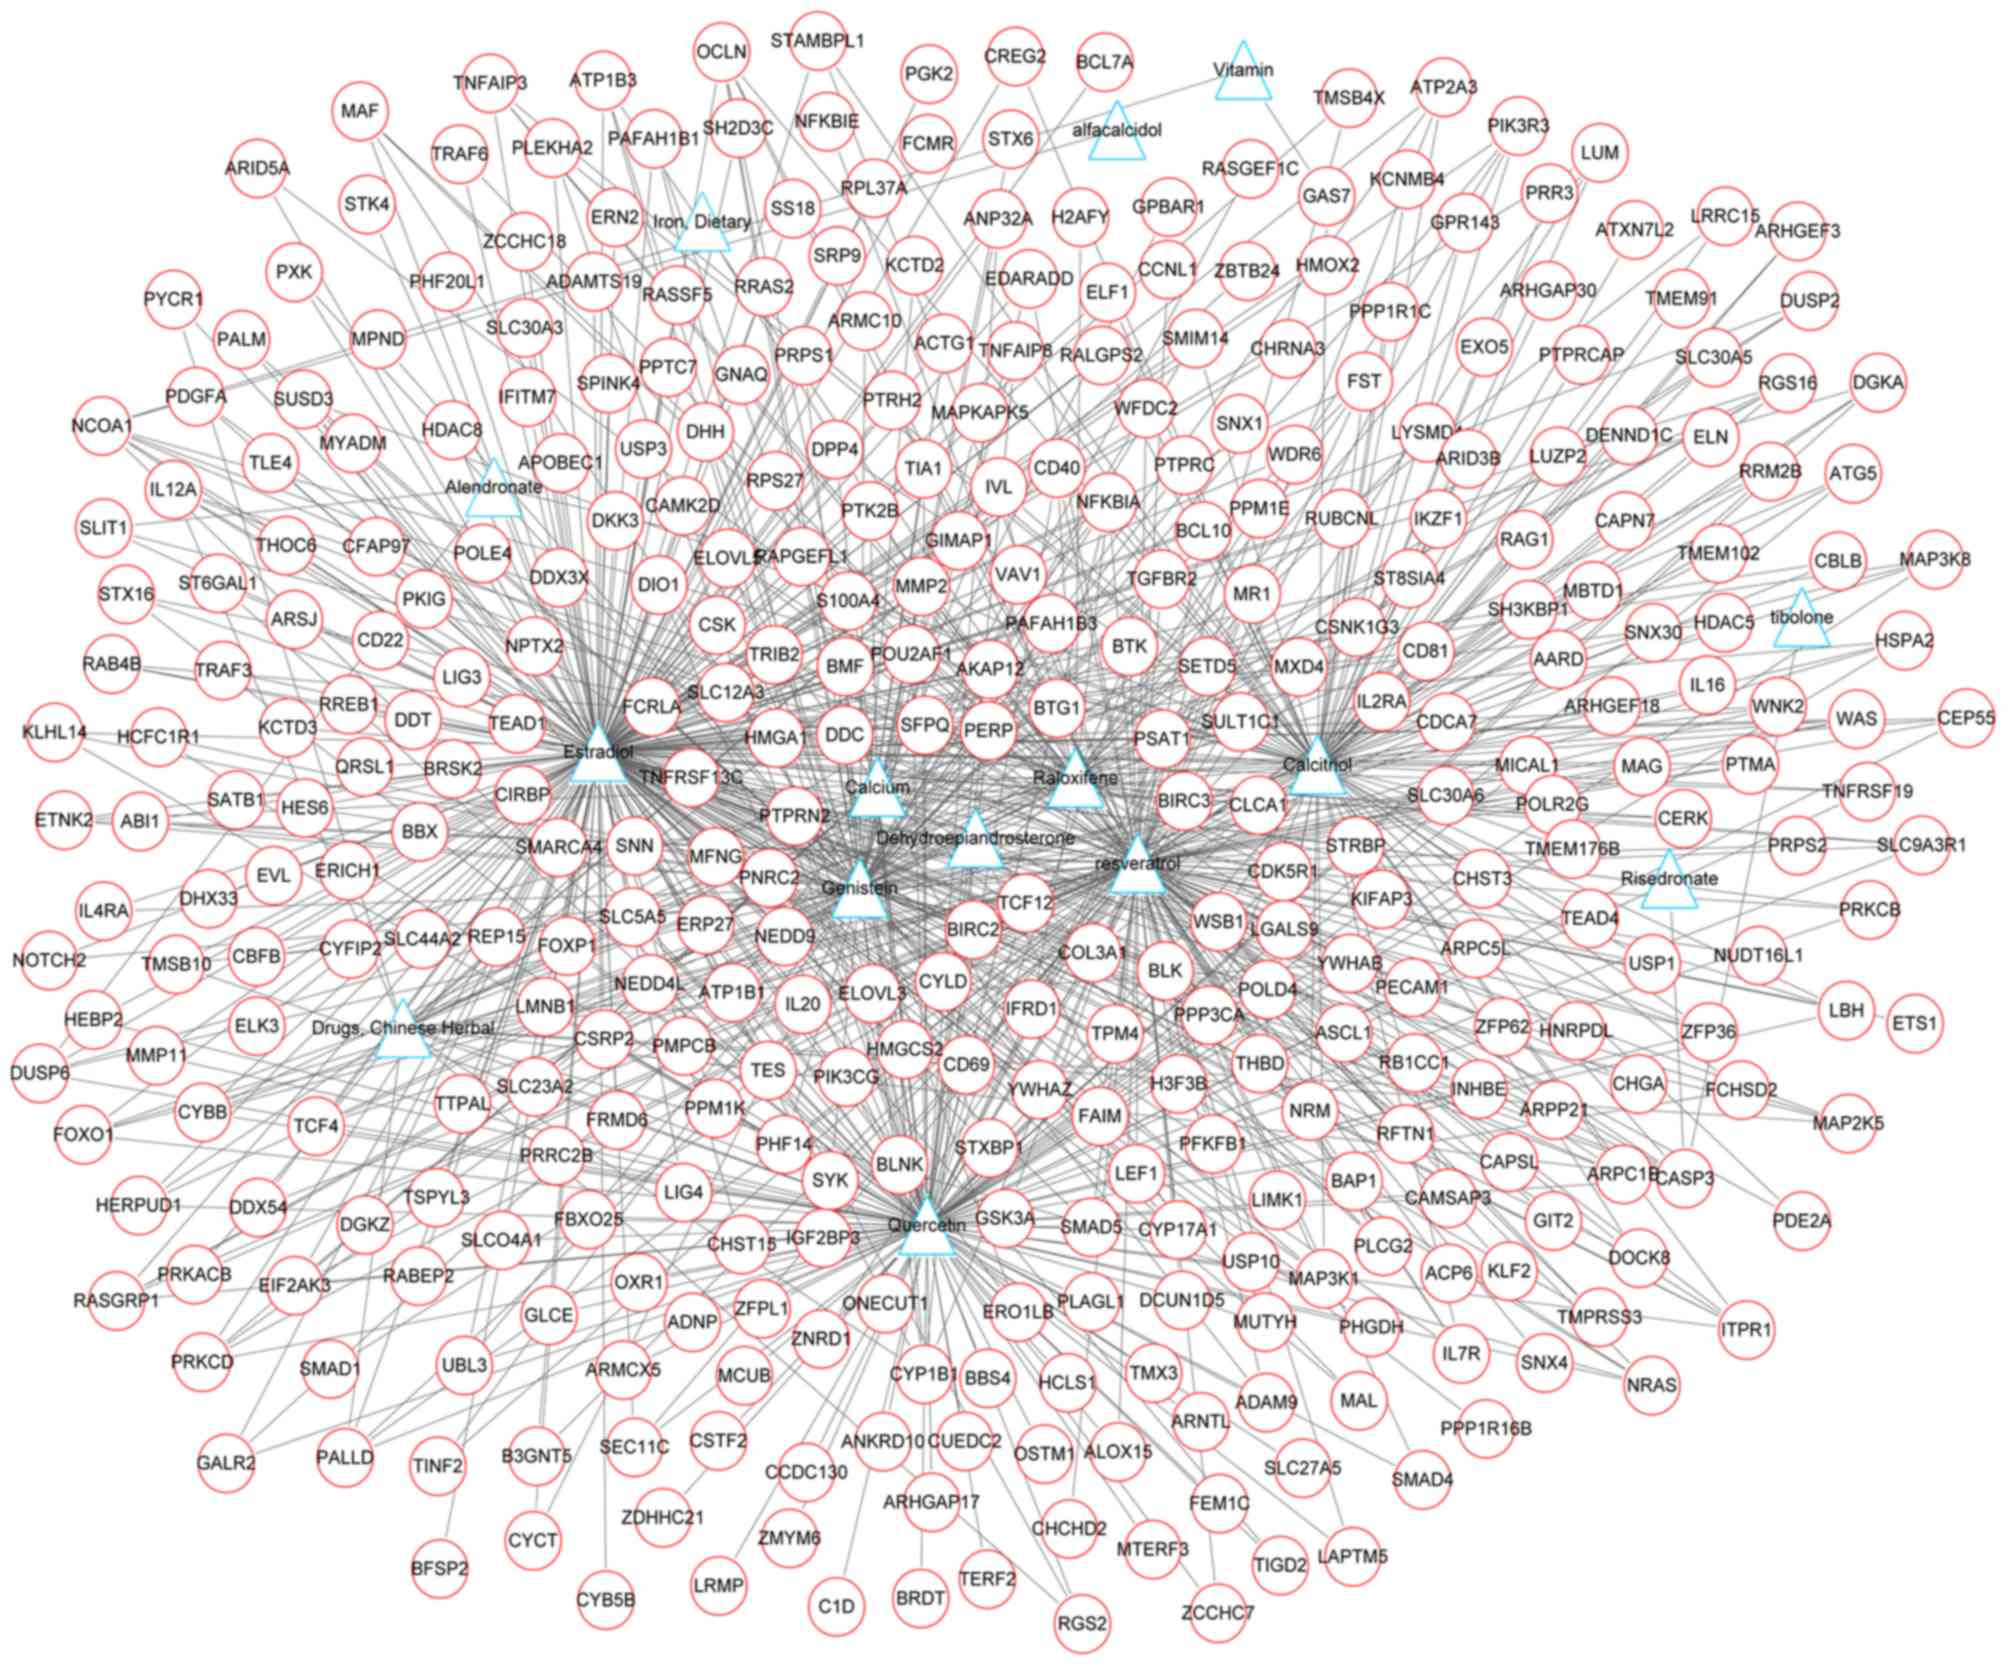
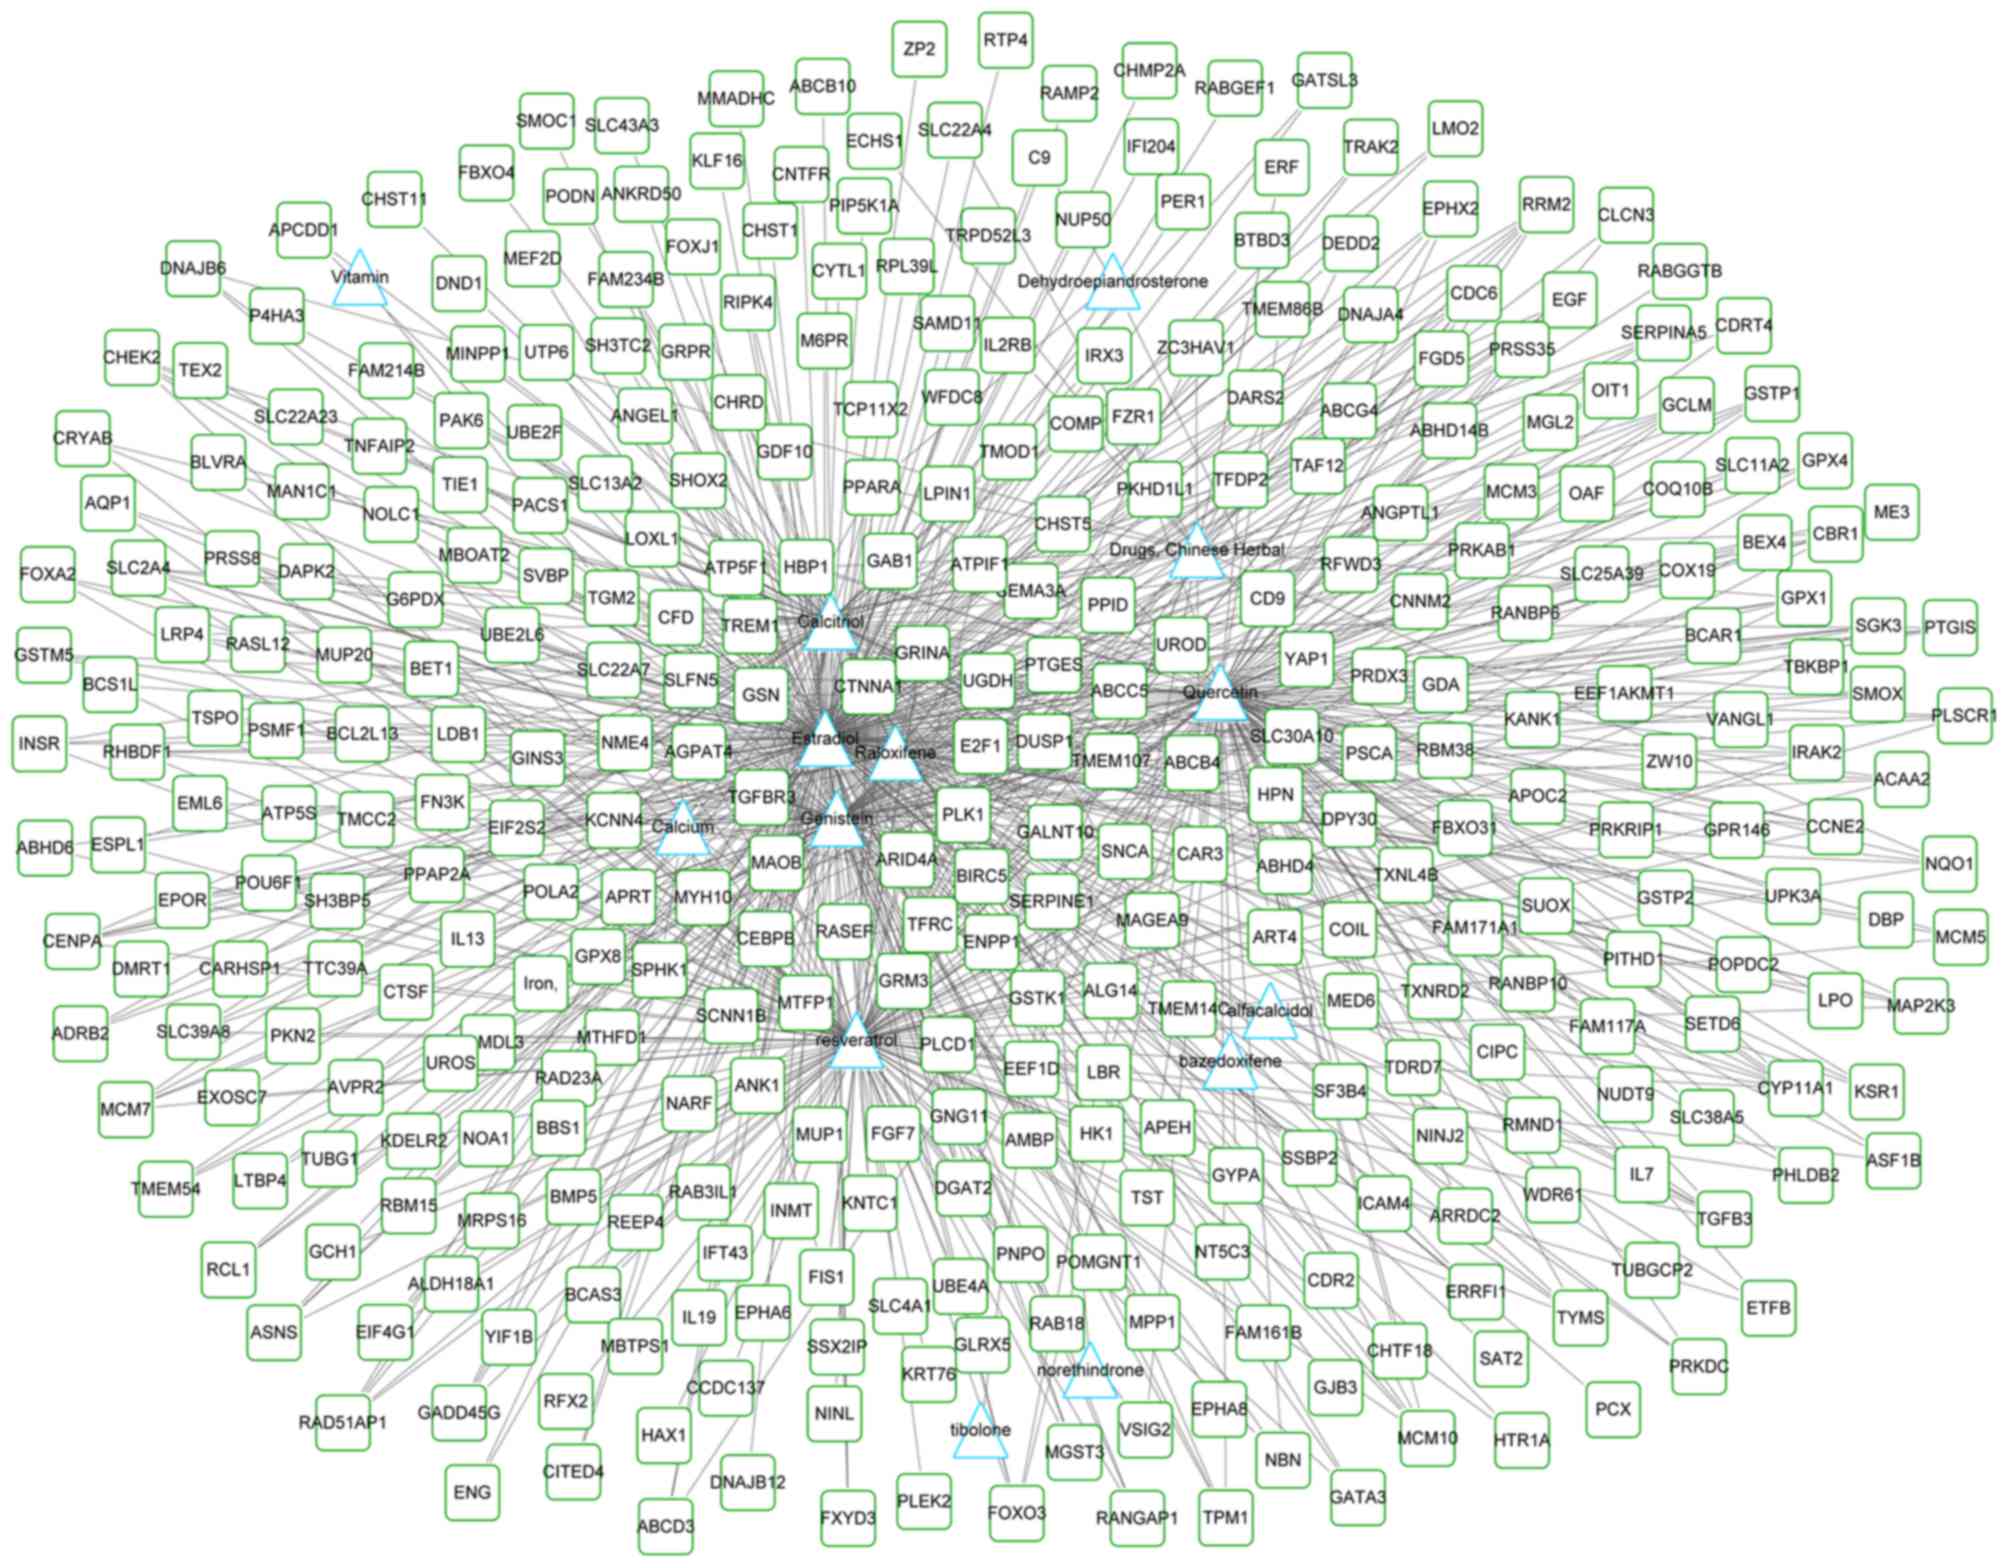
Chemical-gene interaction network
analysis
Based on the CTD database, the present study
revealed a total of 79,334 chemical-gene interactions identified in
osteoporosis patients or in postmenopausal women. Among these
interactions, a total of 850 interactions were identified between
upregulated genes and chemicals (375 upregulated genes and 15
chemicals; Fig. 5). There were 781
interactions between downregulated genes and chemicals (375
downregulated genes and 14 chemicals; Fig. 6). Certain chemicals, including
estradiol, resveratrol, quercetin, calcitriol, genistein and
raloxifene were identified as key chemicals in upregulated or
downregulated DEG-chemical networks.
Discussion
PMOP, frequently associated with skeletal disorders
among elderly women, represents a medical and economic burden
(1). It has been demonstrated that
estrogen serves a role in the regulation of bone turnover (5,28).
However, the role of estrogen deficiency in the mechanisms
underlying PMOP based on gene expression patterns has not been
previously investigated. In the present study, the upregulated DEGs
in modules were enriched in ‘sensory perception of smell’ function
and ‘olfactory transduction’ pathway. OLFR family genes were
enriched in the upregulated modules. Downregulated DEGs in modules
were enriched in ‘DNA replication initiation’ function and ‘cell
cycle’ pathway. A total of 8 TFs, including SP1 and ETS1, were
associated with PMOP. Furthermore, estradiol and resveratrol were
key chemicals in the chemical-gene interaction network.
Estrogen has an important role in bone
metabolism/remodeling, and estrogen deficiency leads to bone loss,
as identified in maxillary alveolar bone (29). Therefore, the reduced estrogen
levels in post-menopausal women may influence the progression of
bone formation (29). Bone
morphogenetic proteins (BMPs) serve roles in the process of bone
formation and maintenance (30).
Shou et al (31) indicated
that the survival of OLFR neurons was regulated by BMPs in
vitro. OFLR family genes, which are expressed in the cell
membranes of OFLR neurons, are members of the class A
rhodopsin-like family of G protein-coupled receptors (32). Wineland et al (33) demonstrated that the regulation of
BMP levels was crucial to the development and maintenance of OLFR
neurons and that overexpression of BMPs led to reduced numbers of
OLFR neurons. In the present study, ‘sensory perception of smell’
and ‘olfactory transduction’ were the most enriched GO functions
and KEGG pathways for upregulated DEGs, respectively. The
upregulated DEGs that were associated with the most enriched
function and pathway all belonged to the OLFR family and included
OLFR846, OLFR218 and OLFR1389 genes, which suggests that the OLFR
family may serve an important role in the process of PMOP.
Therefore, based on the above results, it may be hypothesized that
estrogen deficiency may induce low expression of BMPs, which
further leads to the overexpression of OLFR genes. However,
researching concerning the association between estrogen, the OLFR
family and bone development has been neglected in recent years, and
further investigation is necessary to confirm the pathological
mechanism underlying PMOP. Furthermore, 50 years ago, estrogen was
reported to alter the duration of DNA synthesis and the cell cycle
in mice (34). Recently,
Javanmoghadam et al (35)
indicated that estrogen receptor α regulated the cell cycle in a
ligand-dependent manner. In the present study, downregulated DEGs
were primarily enriched in ‘DNA replication initiation’ function
and ‘cell cycle’ pathway. These results indicate that estrogen
deficiency may lead to the reduced expression of genes enriched in
‘DNA replication initiation’ and ‘cell cycle’ functions and
pathways, respectively, which may further influence the process of
bone formation.
SP1 is a protein encoded by the SP1 gene in humans
(36). SP1 functions as an
osteogenic cell fate-determining factor by regulating gene
expression at the transcriptional level (37). Based on a DNA microarray analysis,
Xie et al (11)
demonstrated that SP1 regulated the majority of upregulated DEGs
from primary osteoporosis tissue samples and normal bone tissue
samples. Furthermore, a large-scale gene analysis demonstrated that
SP1 polymorphism was associated with reduced bone mineral density
and may predispose females to incident vertebral fractures
(38). ETS1, which is a member of
the ETS family of transcription factors, is a protein encoded by
the ETS1 gene in humans (39).
Ring finger protein 11 is expressed in bone cells during
osteogenesis and is regulated by ETS1 (40). Almeida et al (41) indicated that in bone stromal
cell-derived lesions, protein kinase A regulates caspase 1 via
ETS1. In a tissue engineering study, Sutter et al (42) revealed differential expression of
ETS2 in tissue engineered bone constructs in vitro,
demonstrating an association between ETS2 and osteogenesis.
However, direct evidence of associations between these genes and
PMOP is rare. In the present study, SP1, ETS1 and ETS2 were
identified as key TFs in the TF-target gene network, which further
indicated that these TFs may serve roles in the process of PMOP.
The identification of the enriched TFs may improve the
understanding of the mechanisms underlying PMOP.
Furthermore, several chemicals, including estradiol
and resveratrol, were identified in the present study. Estradiol is
a medication and a naturally occurring steroid hormone (43). Estradiol is used in hormone
replacement therapies for the treatment of moderate to severe
menopausal symptoms, including osteoporosis (44). Resveratrol is a polyphenolic
phytoalexin that also exhibits osteoprotective and
chondroprotective properties (45). Preclinical evidence from rat models
of osteoporosis demonstrated that resveratrol may be used as a
therapeutic agent for bone loss (46). A recent study demonstrated that
oral gavage of rats with resveratrol at 1 mg/kg/day may potentially
prevent bone defects (47).
Therefore, these chemicals identified in the present study may be
used for treatment of PMOP in the future.
However, certain limitations are associated with the
present study. No animal, molecular or cellular biological
experiments were conducted in the present study. The microarray
data was generated by research by Calabrese et al (13), but whether the OVX and sham
surgical operations were performed under identical conditions is
not known.
In conclusion, functions, including ‘sensory
perception of smell’ and ‘DNA replication initiation’, as well as
pathways, including ‘olfactory transduction’ and ‘cell cycle’, may
serve roles in the process of PMOP. Furthermore, the OLFR family
genes, and SP1 and ETS1 TFs, may be involved in the progression of
PMOP. Additionally, chemicals, including estradiol and resveratrol,
may in the future be used for the treatment of PMOP. The results of
the present study should be further confirmed by a study with a
larger sample size, and by in vitro and in vivo
experiments. A greater number of potential molecular pathways and
genes underlying the progress of PMOP should be identified.
References
|
1
|
Black DM and Rosen CJ: Clinical practice.
Postmenopausal osteoporosis. N Engl J Med. 374:254–262. 2016.
View Article : Google Scholar
|
|
2
|
Wade SW, Strader C, Fitzpatrick LA,
Anthony MS and O'Malley CD: Estimating prevalence of osteoporosis:
Examples from industrialized countries. Arch Osteoporos. 9:1822014.
View Article : Google Scholar
|
|
3
|
Kwun S, Laufgraben ML and Gopalakrishnan
G: Prevention and treatment of postmenopausal osteoporosis. The
Obstetrician & Gynaecologist. 14:251–256. 2012. View Article : Google Scholar
|
|
4
|
Ralston SH: The genetics of osteoporosis.
Br Med Bull. 90:2472015.
|
|
5
|
Heiss C, Govindarajan P, Schlewitz G,
Hemdan NY, Schliefke N, Alt V, Thormann U, Lips KS, Wenisch S,
Langheinrich AC, et al: Induction of osteoporosis with its
influence on osteoporotic determinants and their interrelationships
in rats by DEXA. Med Sci Monit. 18:BR199–BR207. 2012. View Article : Google Scholar :
|
|
6
|
Kenigsberg D and Hull ME: Bone calcium
dynamics in women with declining estrogen levels. Springer
Netherlands. 153–160. 1990.
|
|
7
|
Eastell R: Prevention and management of
osteoporosis. Medicine. 45:565–569. 2017. View Article : Google Scholar
|
|
8
|
Body JJ: How to manage postmenopausal
osteoporosis? Acta Clin Belg. 66:443–447. 2011.
|
|
9
|
Adler RA, El-Hajj Fuleihan G, Bauer DC,
Camacho PM, Clarke BL, Clines GA, Compston JE, Drake MT, Edwards
BJ, Favus MJ, et al: Managing osteoporosis in patients on Long-term
bisphosphonate treatment: Report of a task force of the American
society for bone and mineral research. J Bone Miner Res.
31:19102016. View Article : Google Scholar
|
|
10
|
Keen RW, Woodford-Richens KL, Lanchbury JS
and Spector TD: Peak bone mass, early menopausal bone loss and
polymorphism at the oestrogen receptor gene. Osteoporosis Int.
6:1021996. View Article : Google Scholar
|
|
11
|
Xie W, Ji L, Zhao T and Gao P:
Identification of transcriptional factors and key genes in primary
osteoporosis by DNA microarray. Med Sci Monit. 21:1333–1344. 2015.
View Article : Google Scholar :
|
|
12
|
Ma M, Luo S, Zhou W, Lu L, Cai J, Yuan F
and Yin F: Bioinformatics analysis of gene expression profiles in B
cells of postmenopausal osteoporosis patients. Taiwan J Obstet
Gynecol. 56:165–170. 2017. View Article : Google Scholar
|
|
13
|
Calabrese G, Mesner LD, Foley PL, Rosen CJ
and Farber CR: Network analysis implicates alpha-synuclein (Snca)
in the regulation of Ovariectomy-induced bone loss. Sci Rep.
6:294752016. View Article : Google Scholar :
|
|
14
|
Irizarry RA, Hobbs B, Collin F,
Beazer-Barclay YD, Antonellis KJ, Scherf U and Speed TP:
Exploration, normalization, and summaries of high density
oligonucleotide array probe level data. Biostatistics. 4:249–264.
2003. View Article : Google Scholar
|
|
15
|
Gautier L, Cope L, Bolstad BM and Irizarry
RA: Affy-analysis of Affymetrix GeneChip data at the probe level.
Bioinformatics. 20:307–315. 2004. View Article : Google Scholar
|
|
16
|
Diboun I, Wernisch L, Orengo CA and
Koltzenburg M: Microarray analysis after RNA amplification can
detect pronounced differences in gene expression using limma. BMC
Genomics. 7:2522006. View Article : Google Scholar :
|
|
17
|
Wang L, Cao C, Ma Q, Zeng Q, Wang H, Cheng
Z, Zhu G, Qi J, Ma H, Nian H and Wang Y: RNA-seq analyses of
multiple meristems of soybean: Novel and alternative transcripts,
evolutionary and functional implications. BMC Plant Biol.
14:1692014. View Article : Google Scholar :
|
|
18
|
Szklarczyk D, Franceschini A, Kuhn M,
Simonovic M, Roth A, Minguez P, Doerks T, Stark M, Muller J, Bork
P, et al: The STRING database in 2011: Functional interaction
networks of proteins, globally integrated and scored. Nucleic Acids
Res. 39:(Database Issue). D561–D568. 2011. View Article : Google Scholar
|
|
19
|
Chatr-Aryamontri A, Breitkreutz BJ,
Oughtred R, Boucher L, Heinicke S, Chen D, Stark C, Breitkreutz A,
Kolas N, O'Donnell L, et al: The BioGRID interaction database: 2015
update. Nucleic Acids Res. 43:(Database Issue). D470–D478. 2015.
View Article : Google Scholar
|
|
20
|
Calderone A, Castagnoli L and Cesareni G:
Mentha: A resource for browsing integrated protein-interaction
networks. Nat Methods. 10:690–691. 2013. View Article : Google Scholar
|
|
21
|
Liu B and Hu B: HPRD: A High performance
RDF database. Springer Berlin Heidelberg; pp. 364–374. 2007
|
|
22
|
Shannon P, Markiel A, Ozier O, Baliga NS,
Wang JT, Ramage D, Amin N, Schwikowski B and Ideker T: Cytoscape: A
software environment for integrated models of biomolecular
interaction networks. Genome Res. 13:2498–2504. 2003. View Article : Google Scholar :
|
|
23
|
Sharma D and Surolia A: Degree
CentralityEncyclopedia of Systems Biology. Dubitzky W, Wolkenhauer
O, Cho KH and Yokota H: Springer New York; New York, NY: pp. 558.
2013, View Article : Google Scholar
|
|
24
|
Wang J, Ren J, Li M and Wu FX:
Identification of hierarchical and overlapping functional modules
in PPI networks. IEEE Trans Nanobioscience. 11:386–393. 2012.
View Article : Google Scholar
|
|
25
|
Gene Ontology Consortium: The gene
ontology (GO) project in 2006. Nucleic Acids Res. 34:(Database
Issue). D322–D326. 2006. View Article : Google Scholar
|
|
26
|
Ogata H, Goto S, Sato K, Fujibuchi W, Bono
H and Kanehisa M: KEGG: Kyoto encyclopedia of genes and genomes.
Nucleic Acids Res. 27:29–34. 1999. View Article : Google Scholar :
|
|
27
|
Davis AP, Grondin CJ, Lennon-Hopkins K,
Saraceni-Richards C, Sciaky D, King BL, Wiegers TC and Mattingly
CJ: The comparative toxicogenomics database's 10th year
anniversary: Update 2015. Nucleic Acids Res. 43:(Database Issue).
D914–D920. 2015. View Article : Google Scholar
|
|
28
|
Verbruggen SW, Vaughan TJ and Mcnamara LM:
Mechanisms of osteocyte stimulation in osteoporosis. J Mech Behav
Biomed Mater. 62:158–168. 2016. View Article : Google Scholar
|
|
29
|
Xu XC, Chen H, Zhang X, Zhai ZJ, Liu XQ,
Zheng XY, Zhang J, Qin A and Lu EY: Effects of oestrogen deficiency
on the alveolar bone of rats with experimental periodontitis. Mol
Med Rep. 12:3494–3502. 2015. View Article : Google Scholar :
|
|
30
|
Katagiri T and Watabe T: Bone
morphogenetic proteins. Cold Spring Harb Perspect Biol.
8:pii:a0218992016. View Article : Google Scholar
|
|
31
|
Shou J, Murray RC, Rim PC and Calof AL:
Opposing effects of bone morphogenetic proteins on neuron
production and survival in the olfactory receptor neuron lineage.
Development. 127:5403–5413. 2000.
|
|
32
|
Hussain A, Saraiva LR and Korsching SI:
Positive Darwinian selection and the birth of an olfactory receptor
clade in teleosts. Proc Natl Acad Sci USA. 106:4313–4318. 2009.
View Article : Google Scholar :
|
|
33
|
Wineland A, Blitz IL, Murray RC and Calof
AL: A transgenic approach for determining the role of bone
morphogenetic proteins in the development of olfactory receptor
neurons. Developmental Biol. 271:2004.
|
|
34
|
Galand P, Rodesch F, Leroy F and Chretien
J: Altered duration of DNA synthesis and cell cycle in non-target
tissues of mice treated with oestrogen. Nature. 216:1211–1212.
1967. View Article : Google Scholar
|
|
35
|
Javanmoghadam S, Zhang W, Hunt KK and
Keyomarsi K: Estrogen receptor alpha is cell cycle-regulated and
regulates the cell cycle in a ligand-dependent fashion. Cell Cycle.
15:1579–1590. 2016. View Article : Google Scholar :
|
|
36
|
Surhone LM, Tennoe MT and Henssonow SF:
Sp1 Transcription Factor. Betascript Publishing; 2016
|
|
37
|
Zhang Y, Hassan MQ, Xie RL, Hawse JR,
Spelsberg TC, Montecino M, Stein JL, Lian JB, van Wijnen AJ and
Stein GS: Co-stimulation of the bone-related Runx2 P1 promoter in
mesenchymal cells by SP1 and ETS transcription factors at
polymorphic purine-rich DNA sequences (Y-repeats). J Biol Chem.
284:3125–3135. 2009. View Article : Google Scholar :
|
|
38
|
Ralston SH, Uitterlinden AG, Brandi ML,
Balcells S, Langdahl BL, Lips P, Lorenc R, Obermayer-Pietsch B,
Scollen S, Bustamante M, et al: Large-scale evidence for the effect
of the COLIA1 Sp1 polymorphism on osteoporosis outcomes: The
GENOMOS study. PLoS Med. 3:e902006. View Article : Google Scholar :
|
|
39
|
Dwyer J, Li H, Xu D and Liu JP:
Transcriptional regulation of telomerase activity: Roles of the the
Ets transcription factor family. Ann N Y Acad Sci. 1114:36–47.
2007. View Article : Google Scholar
|
|
40
|
Gao Y, Ganss BW, Wang H, Kitching RE and
Seth A: The RING finger protein RNF11 is expressed in bone cells
during osteogenesis and is regulated by Ets1. Exp Cell Res.
304:127–135. 2005. View Article : Google Scholar
|
|
41
|
Almeida MQ, Tsang KM, Cheadle C, Watkins
T, Grivel JC, Nesterova M, Goldbach-Mansky R and Stratakis CA:
Protein kinase A regulates caspase-1 via Ets-1 in bone stromal
cell-derived lesions: A link between cyclic AMP and
pro-inflammatory pathways in osteoblast progenitors. Hum Mol Genet.
20:165–175. 2011. View Article : Google Scholar
|
|
42
|
Sutter W, Stein E, Koehn J, Schmidl C,
Lezaic V, Ewers R and Turhani D: Effect of different biomaterials
on the expression pattern of the transcription factor Ets2 in
bone-like constructs. J Craniomaxillofac Surg. 37:263–271. 2009.
View Article : Google Scholar
|
|
43
|
Kuhl H: Pharmacology of estrogens and
progestogens: Influence of different routes of administration.
Climacteric. 8 Suppl 1:S3–S63. 2005. View Article : Google Scholar
|
|
44
|
Klein-Nulend J, van Oers RF, Bakker AD and
Bacabac RG: Bone cell mechanosensitivity, estrogen deficiency, and
osteoporosis. J Biomech. 48:855–865. 2015. View Article : Google Scholar
|
|
45
|
Cooley J, Broderick TL, Al-Nakkash L and
Plochocki JH: Effects of resveratrol treatment on bone and
cartilage in obese diabetic mice. J Diabetes Metab Disord.
14:102015. View Article : Google Scholar :
|
|
46
|
Tou JC: Evaluating resveratrol as a
therapeutic bone agent: Preclinical evidence from rat models of
osteoporosis. Ann N Y Acad Sci. 1348:75–85. 2015. View Article : Google Scholar
|
|
47
|
Lee AM, Shandala T, Soo PP, Su YW, King
TJ, Chen KM, Howe PR and Xian CJ: Effects of resveratrol
supplementation on methotrexate Chemotherapy-induced Bone Loss.
Nutrients. 9:pii: E255. 2017. View Article : Google Scholar
|