Introduction
Osteosarcoma (OS) is the most common type of
malignant bone carcinoma, which occurs primarily in the metaphyseal
regions of long bones in adolescents and young adults (1). The 5-year survival rates of patients
with OS without metastases is 60% (2). Although the survival rate has
improved considerably following the introduction of neoadjuvant
chemotherapy, it has reached a plateau and novel biological
therapies are required to achieve further improvement. Although
genetic alterations in OS have been extensively studied,
understanding of the etiology of OS remains limited. Notably,
epigenetics is emerging as an promising strategy for the study of
OS.
DNA methylation, one of the most important
mechanisms involved in microRNA expression regulation (3), gene silencing (4) and alternative gene splicing (5), exerts important functions in the
early stage of carcinoma. As DNA methylation is stable and easily
detected qualitatively or quantitatively, it has been identified to
be a promising diagnostic marker for the early detection of cancer
(6), compared with copy number
variations (7), single nucleotide
polymorphisms (SNPs)/mutations (8)
and gene/microRNA expression (9).
Previously, numerous instances of abnormal DNA methylation in the
early stage of OS have been identified. For example, previous
studies have indicated that Ras association domain family member
1A, death associated protein kinase, O-6-methylguanine-DNA
methyltransferase, TIMP metallopeptidase inhibitor 3, and RB
transcriptional corepressor 1 are hypermethylated in OS (10–12).
In addition, Sonaglio et al (13) demonstrated that the
hypermethylation of cyclin dependent kinase inhibitor 2A is
associated with the absence of OS metastases, although estrogen
receptor 1 hypermethylation is associated with decreased overall
survival in OS. In addition, hypomethylation of iroquois homeobox 1
has been suggested to promote OS metastasis by inducing C-X-C motif
chemokine ligand 14/nuclear factor-κB signaling (14). Despite the fact that a number of
diagnostic panels have been developed, to the best of our
knowledge, the causes of OS remain to be completely elucidated.
Previously, microarray analysis has been used to
detect genetic alterations and identify potential targets in human
OS cell lines. Kresse et al (15) combined the genetic and epigenetic
profiles of 19 OS samples on the basis of microarray technologies,
and deposited the OS-associated DNA methylation dataset in the Gene
Expression Omnibus (GEO) database (no. GSE36002). In the previous
study, the differentially methylated genes were extracted and
functional enrichment analysis was implemented. However, the
interactions among the differentially methylated genes were not
measured.
Therefore, in order to better understand the
molecular mechanisms of OS, the present study aimed to extract the
differentially methylated genes from OS and normal samples from
GSE36002. Hierarchical clustering was performed based on Euclidian
distance and average linkage criteria. Functional enrichment
analysis was respectively implemented for differentially
hypomethylated/hypermethylated genes, to further identify the
potential biological processes based on the Database for
Annotation, Visualization and Integrated Discovery (DAVID).
Subsequently, a protein-protein interaction (PPI) network was
established to analyze the interactions between differentially
methylated genes, followed by hub gene identification. The results
of the present study provided evidence of the cumulative roles of
epigenetic mechanisms in OS.
Materials and methods
Collection of DNA methylation
data
DNA methylation data for OS (accession no. GSE36002)
(15) was obtained from the GEO in
the National Center for Biotechnology Information database
(www.ncbi.nlm.nih.gov/gds), which was
deposited in the GPL8490 platform (Illumina Human Methylation27
BeadChip; Illumina Inc., San Diego, CA, USA). GSE36002 included 25
samples (19 OS cell lines, and six normal samples derived from two
osteoblast and four normal bone samples). Specifically, the 19 OS
cell lines were obtained from EuroBoNeT
(eurobonet.pathobiology.eu/cd/index.php). The two normal bone
samples were collected from patients with cancer (one with OS and
one with renal cell cancer) at the Norwegian Radium Hospital (Oslo,
Norway). The normal bone was obtained from a site as distant as
possible from the tumor site. The other two normal bone samples
from different donors were purchased from Capital Biosciences, Inc.
(Gaithersburg, MD, USA). The two human osteoblast cultures
separated from the calvariae of different donors were purchased
from ScienCell Research Laboratories, Inc. (San Diego, CA,
USA).
DNA methylation data quality control
and identification of differentially methylated genes
The methylation-identification algorithm in Genelibs
(www.genelibs.com/gb) was utilized in the
present study. The raw methylation status of 27,578 CpG sites was
downloaded. Probes were eliminated from the dataset when they met
the following criteria: i) Probes with SNP-CpG distances ≤2; ii)
probes on X and Y chromosomes; iii) minimum allelic frequency
<0.05; and iv) cross-hybridizing probes. Subsequently, DNA
methylation data from the 25,628 CpG sites were kept for subsequent
analysis.
The DNA methylation microarray data were processed
using the Lumi package (bioconductor.org/packages/release/bioc/html/lumi.html)
(16,17) of Bioconductor software. Data were
normalized via the β-mixture quantile normalization method
(18). Subsequently, β values
(percentage methylation changes) were utilized in graphical
representations of the data and demonstrated the percentage of
methylation counted using the formula methylated/(methylated +
unmethylated), ranging between 0 and 1; 0 represented fully
unmethylated, while 1 represented fully methylated. In the present
study, the β values of the OS and normal groups were calculated.
Subsequently, the absolute value of the difference in mean β values
between OS and normal groups was calculated, termed A. A Student's
t-test was employed in the analysis to identify the differentially
methylated CpGs between the two conditions. Differentially
methylated CpGs were identified based on P<0.05 and A>0.01.
SPSS version 18.0 (SPSS Inc., Chicago, IL, USA) was used for
statistical analysis.
Refinement of the basic differential
methylation analysis
In order to decrease the number of non-variable
sites to enhance the statistical power of the following analyses,
further filtering steps were performed to promote a more stringent
analysis. All sites with β values ≤0.2 and ≥0.8 were deleted from
all 25 samples, in order to decrease the number of non-variable
sites to further promote the statistical power of the subsequent
analyses (19). Additionally, only
CpGs with a mean β-value difference ≥0.2 were kept. The absolute
β-values in each matched pair were examined. A cut-off threshold of
≥0.2 average β-values difference was applied to detect CpGs with
substantial methylation differences.
Hierarchical clustering analysis
Hierarchical clustering is a common approach
utilized to determine clusters of similar data in multidimensional
spaces (20). Generally, cancers
having similar methylation profiles clustered together. To analyze
whether these differentially methylated CpGs could segregate the
samples into two distinct clusters including OS and normal samples,
unsupervised hierarchical clustering was conducted using Euclidian
distance and average linkage criteria (21). The matrix of mean β-value levels of
differential methylated CpGs was formed between OS and normal
samples.
Gene ontology (GO) analysis of
differentially methylated genes
GO analysis has been widely utilized for large-scale
functional enrichment research (22). In the present study, GO functional
enrichment analysis was implemented for differentially methylated
genes using DAVID (david.ncifcrf.gov) which is a software tool providing
a comprehensive set of functional annotation for researchers to
understand the biological meaning behind a large number of genes
(23). Specifically, Fisher's
exact test was used to classify the GO category. Subsequently,
P-values were corrected using the false discovery rate (FDR) with
the Benjamini & Hochberg method (24). Functional terms with FDR <0.01
and gene count >10 were considered to be statistically
significant.
Pathway enrichment analysis of
differentially methylated genes
The Kyoto Encyclopedia of Genes and Genomes (KEGG;
www.genome.jp/kegg/pathway) is a
knowledge base used to systematically analyze gene functions
(25). In the present study,
pathway analysis was performed according to the KEGG using the
DAVID tool. Fisher's exact test was used to extract the significant
pathways, and the threshold of significance was defined by FDR.
Significant pathways were selected according to the thresholds of
FDR <0.01 and gene count >10.
PPI network construction and hub genes
identification
The Search Tool for the Retrieval of Interacting
Genes (STRING) database (www.bork.embl-heidelberg.de/STRING) is a global
resource for analyzing PPI information (26). In the present study, the STRING
tool was used to identify the PPIs of differentially methylated
genes. The differentially methylated genes with required confidence
(combined score) >0.8 were extracted, and the PPI network was
established and displayed using Cytoscape software (cytoscape.org) (27).
Given that the networks were scale-free, the hub genes were
identified with degree >90.
Results
Identification of differentially
methylated genes
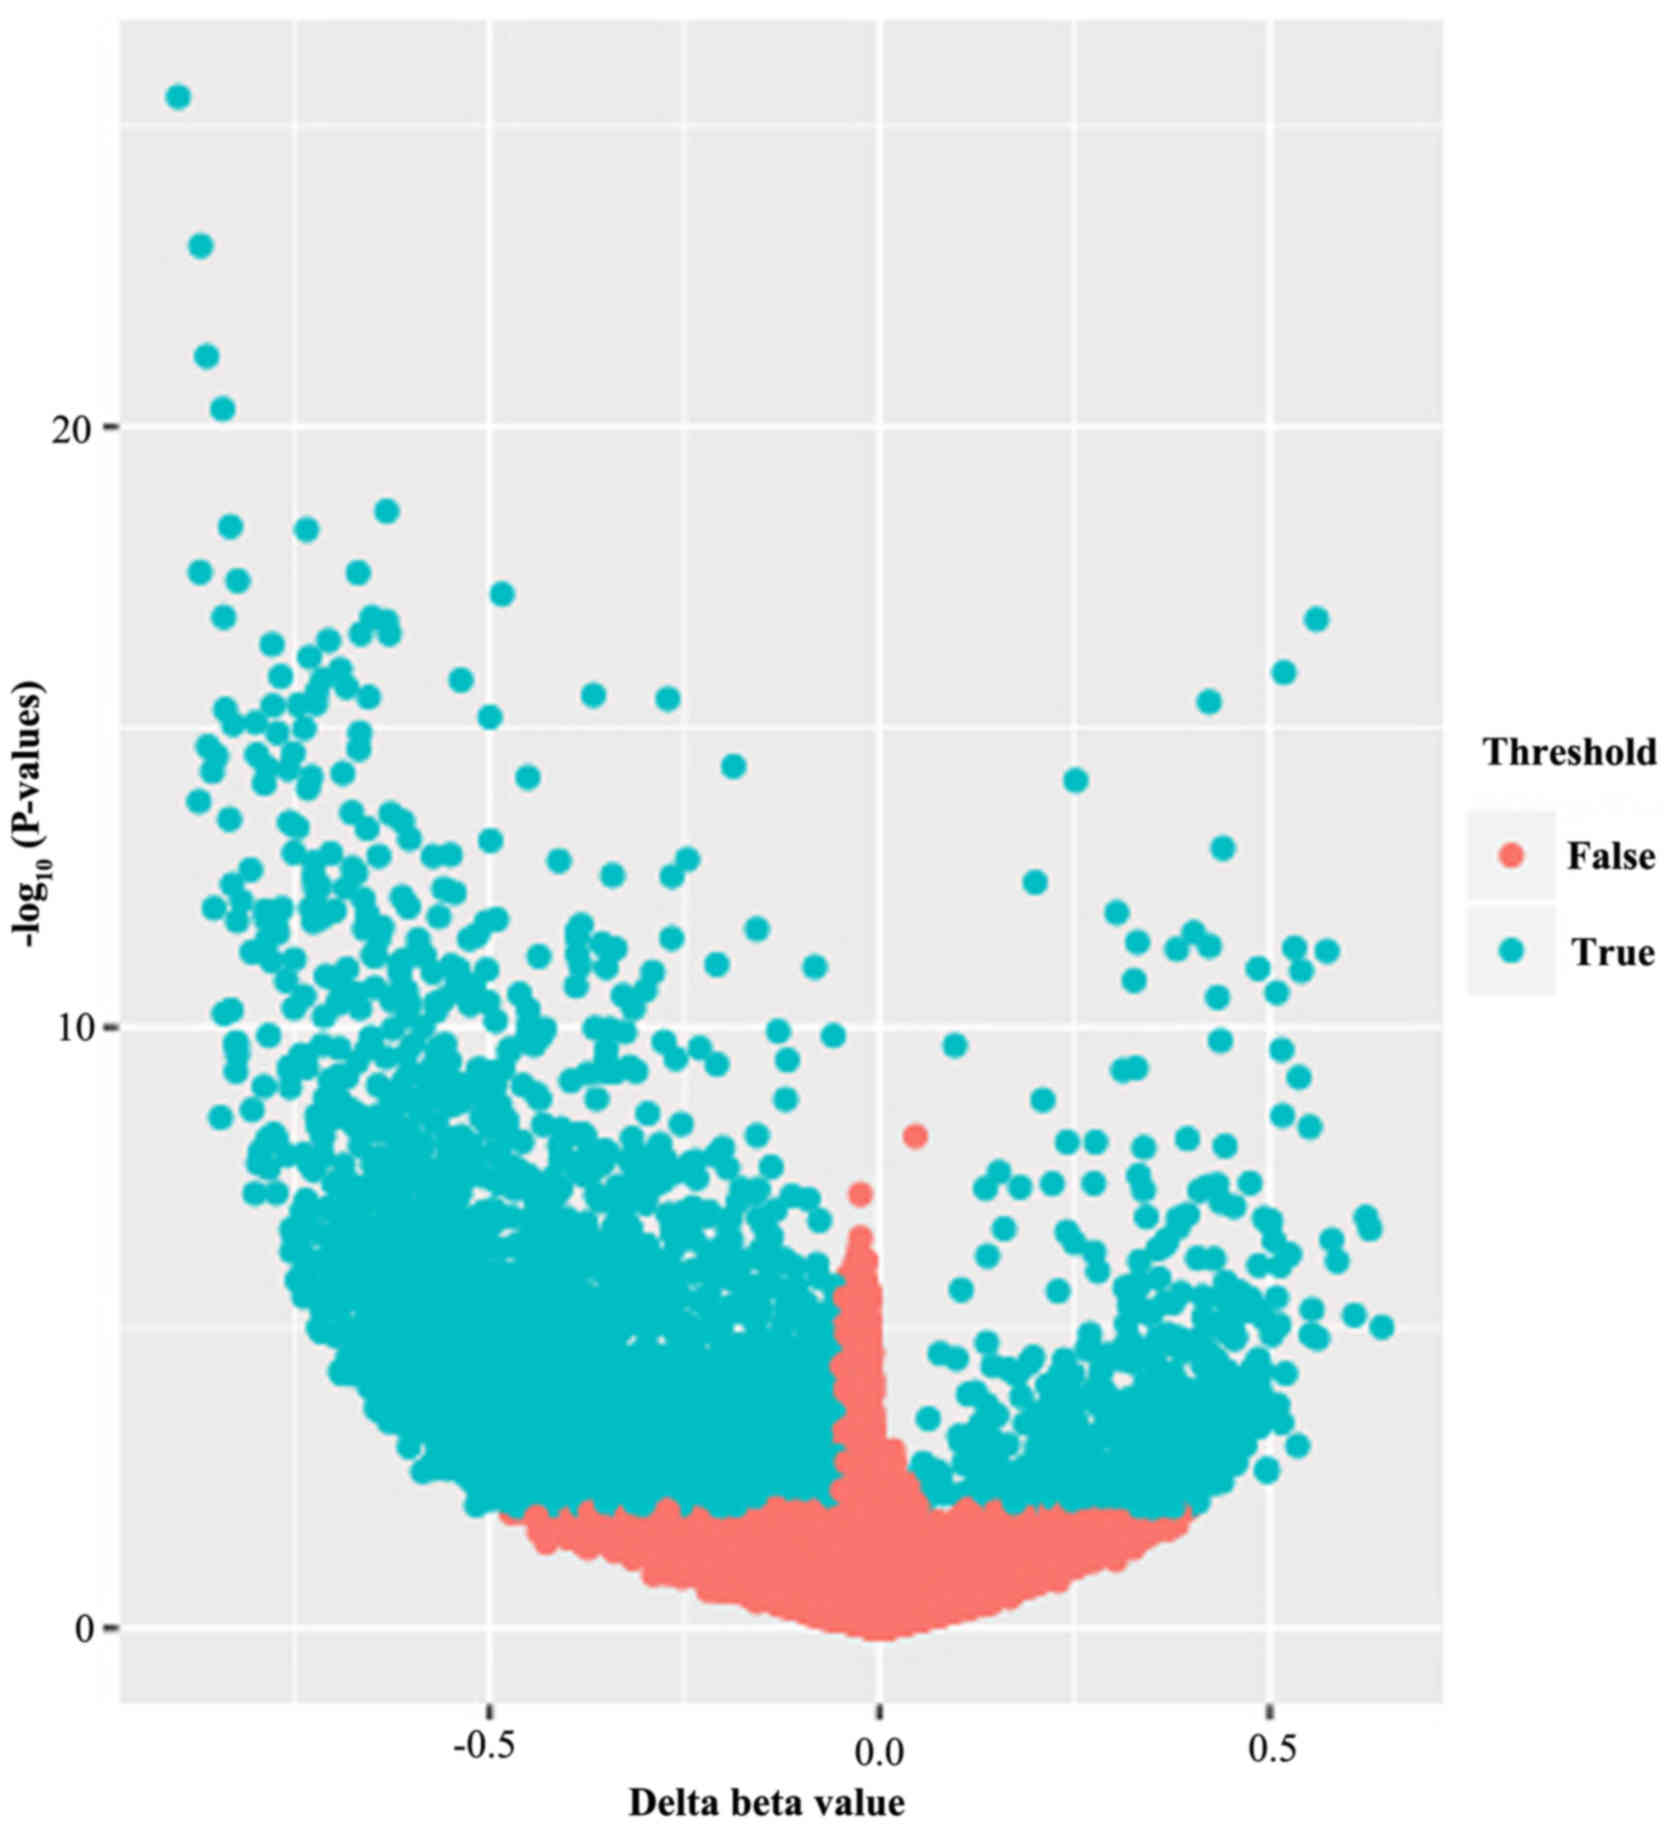
Following quality control and normalization to
remove probes with SNP-CpG distance ≤2, on the X and Y chromosomes,
with minimum allelic frequency <0.05, and cross-hybridizing, a
total of 25,628 methylated CpGs remained in the final dataset of 25
samples. A volcano plot exhibiting the distribution of the 25,628
analyzed methylated CpGs was produced, as presented in Fig. 1. Among these 25,628 methylated
CpGs, 5,889 CpGs (representing 4,677 genes) were differentially
methylated, when the absolute value of the mean β-value difference
between the OS and normal groups was >0.01 and the P-value was
<0.05. A total of 572 of the CpGs were hypermethylated and 5,317
CpGs were hypomethylated in the OS group compared with the normal
group.
Subsequently, these 5,889 methylated CpGs initially
extracted as differentially methylated sites were subjected to
further filtering. Using the cut-off threshold of ≥0.2 average
β-values difference, 3,725 unique CpGs (covering 2,862 genes) were
detected to be differentially methylated between the OS and normal
groups. Among these 2,862 genes, 510 gene were differentially
hypermethylated genes and 2,352 were differentially hypomethylated
genes.
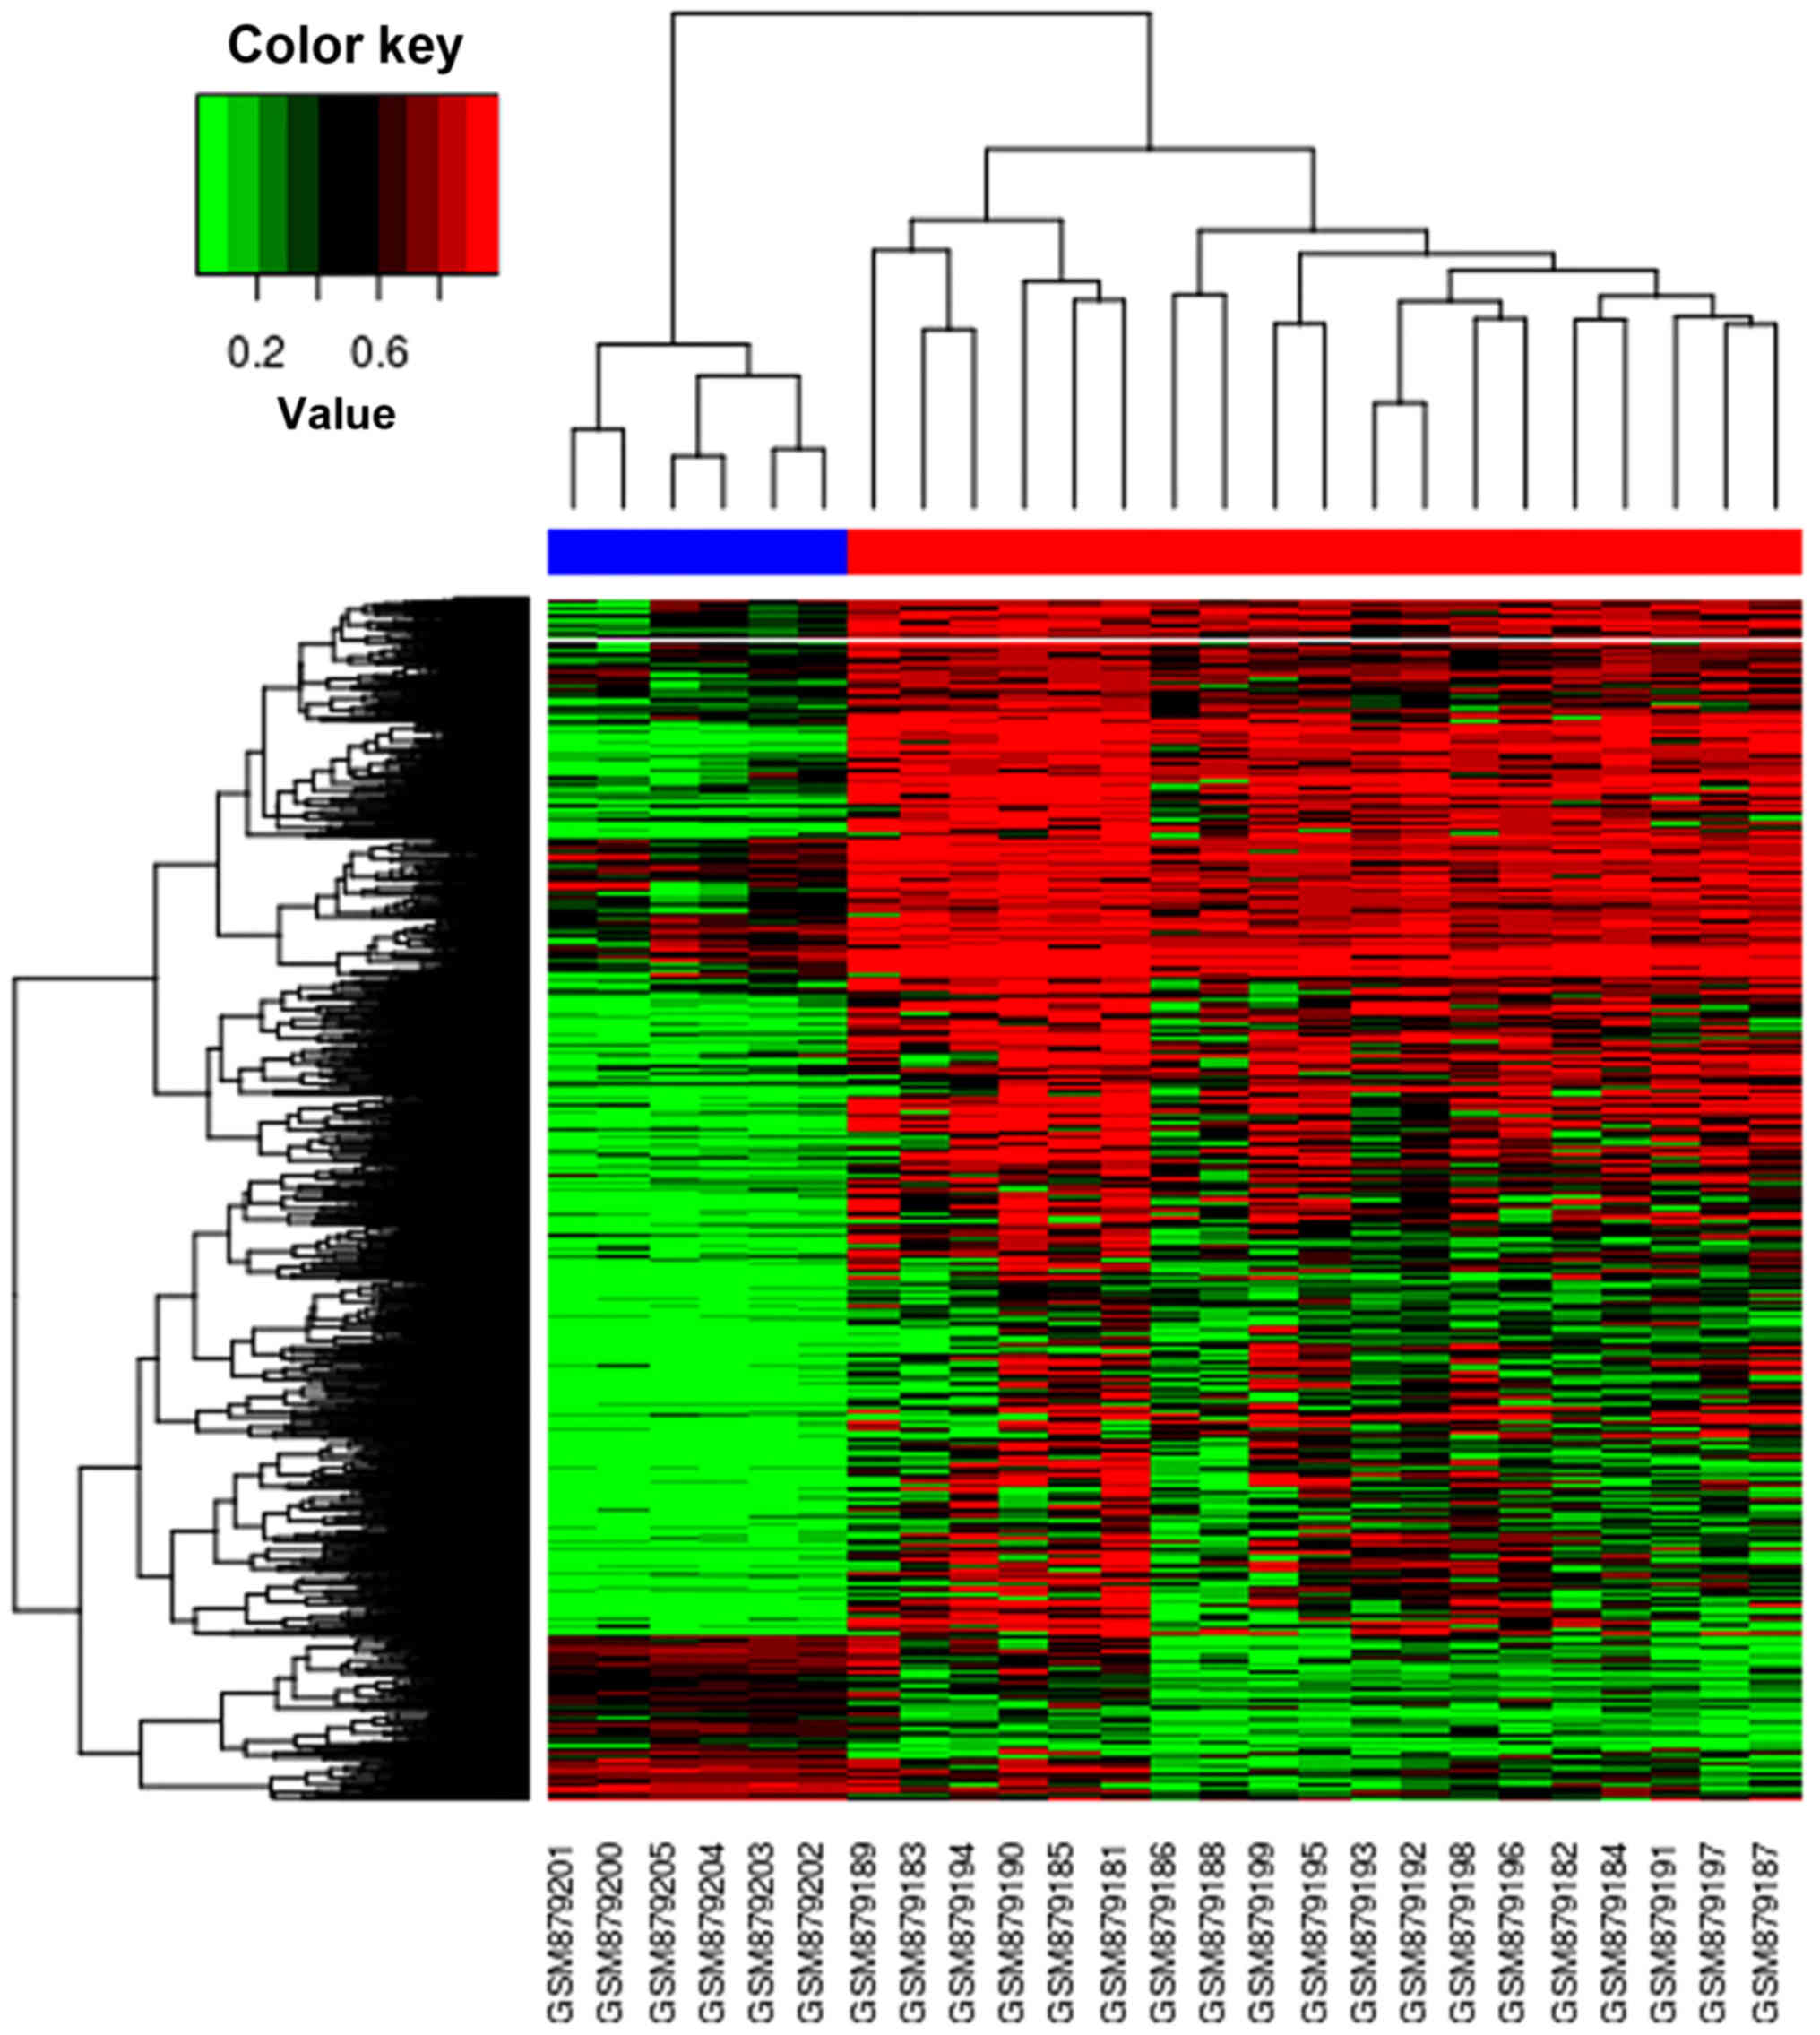
Cluster analysis of the differentially
methylated genes
The cluster heat map is presented in Fig. 2. In this figure, it was observed
that there were distinctive methylation patterns in OS and normal
samples, which segregated samples into two distinct groups
comprising those from OS and normal populations.
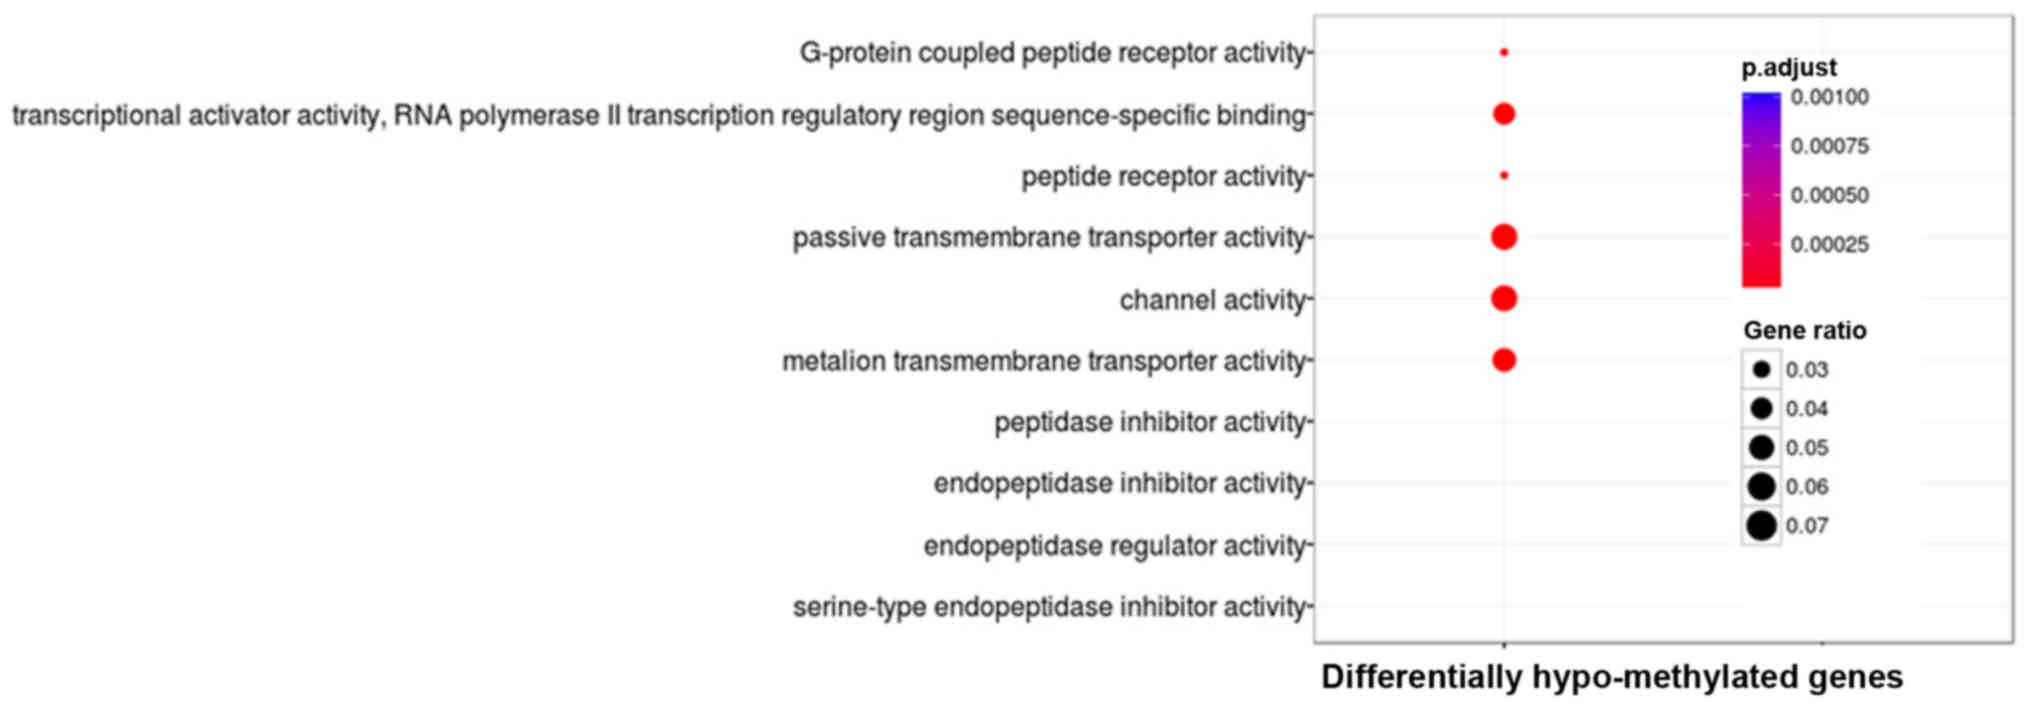
GO enrichment of differentially
methylated genes
In order to better understand the potential
biological functions of the differentially methylated genes, all
the genes were annotated using GO annotation based on DAVID
software. GO categories with FDR <0.01 and gene count >10
were regarded as significantly enriched. Overall, 20 GO terms were
significantly enriched by differentially hypermethylated genes, as
presented in Fig. 3. These GO
terms were sorted in ascending order based on FDR value, and the
top 3 most significantly enriched differentially hypermethylated
genes were associated with potassium ion transport. For
differentially hypomethylated genes, GO functions primarily
included passive transmembrane transporter activity, channel
activity and metal ion transmembrane transporter activity, as
described in Fig. 4.
KEGG pathway analysis for
differentially methylated genes
Pathway enrichment analysis of all differentially
methylated genes was performed based on the KEGG automatic
annotation server. Based on FDR <0.01 and gene count >10, no
KEGG pathways were enriched by the differentially hypermethylated
genes. Notably, differentially hypomethylated genes were enriched
in 10 KEGG pathways, including neuroactive ligand-receptor
interaction (FDR=3.5×10⁻⁹; gene count=80), pathway in
cancer (FDR=3.2×10⁻⁷; gene count=96) and Rap1 signaling
pathway (FDR=6.5×10⁻⁶; gene count=58). The specific
enrichment results are presented in Table I.
 | Table I.KEGG pathway analysis for
differentially methylated genes, based on FDR <0.01 and gene
count >10. |
Table I.
KEGG pathway analysis for
differentially methylated genes, based on FDR <0.01 and gene
count >10.
| Terms | Gene count | FDR |
|---|
| Neuroactive
ligand-receptor interaction | 80 |
3.5×10⁻⁹ |
| Pathways in
cancer | 96 |
3.2×10⁻⁷ |
| Rap1 signaling
pathway | 58 |
6.5×10⁻⁶ |
| Calcium signaling
pathway | 58 |
1.9×10⁻⁴ |
| Morphine
addiction | 31 |
2.1×10⁻³ |
| MAPK signaling
pathway | 36 |
2.4×10⁻³ |
| Cholinergic
synapse | 46 |
3.9×10⁻³ |
| Circadian
entrainment | 50 |
6.4×10⁻³ |
| cAMP signaling
pathway | 30 |
6.5×10⁻³ |
| Cell adhesion
molecules | 27 |
7.1×10⁻³ |
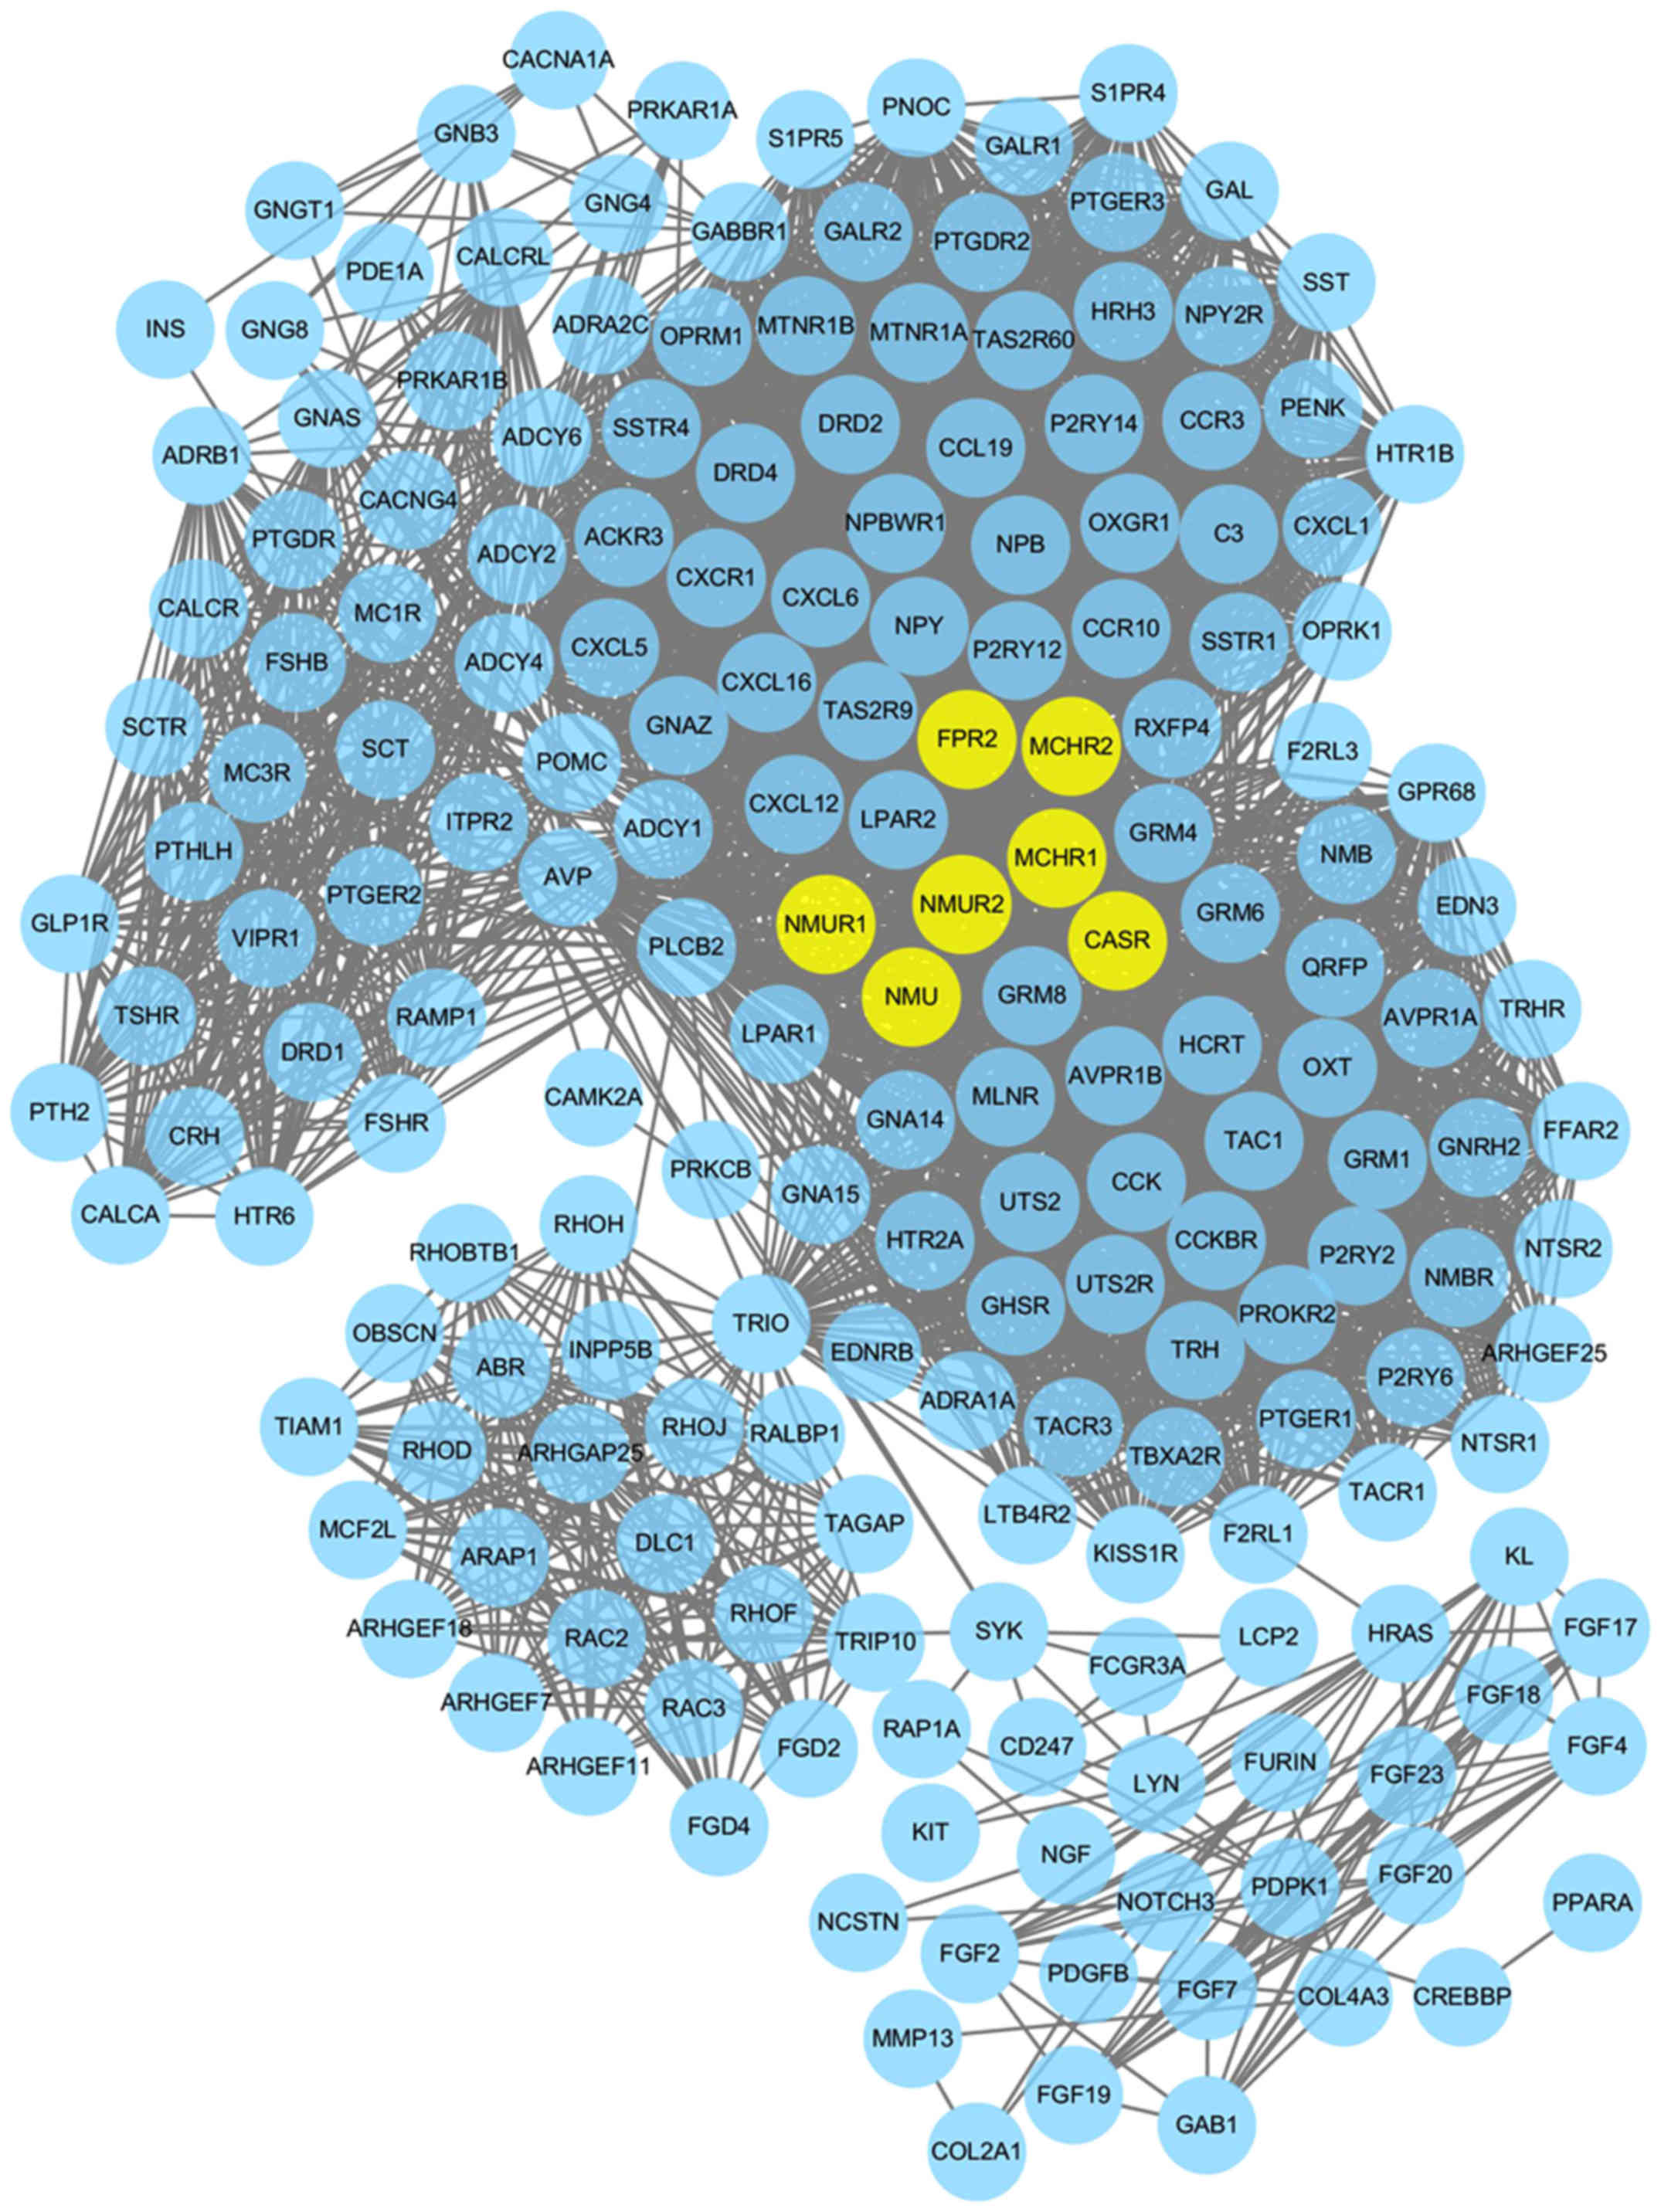
PPI network construction and hub genes
identification
With the goal of analyzing the association between
differentially methylated genes, STRING software was used to
establish the PPI network. When the differentially methylated genes
with required confidence (combined score) >0.8 were submitted
into STRING, a total of 3,775 PPI interactions (covering 195 nodes)
were obtained, as presented in Fig.
5. The hub genes in the networks with connectivity degree
>90 were identified. A total of 7 hub genes were selected from
the PPI network, which included neuromedin U (NMU; degree=103), NMU
receptor 1 (NMUR1; degree=103), NMUR2 (degree=103), calcium sensing
receptor (degree=103), formyl peptide receptor 2 (degree =92),
melanin concentrating hormone receptor (MCHR) 2 (degree=91) and
MCHR1 (degree=91).
Discussion
The analysis of DNA methylation data has been widely
used to identify abnormally methylated genes associated with OS and
has enabled the extraction of targets for therapeutic strategies.
In the present study, OS pathogenesis was analyzed using
bioinformatics, including the detection of differentially
methylated genes, functional analyses of the differentially
methylated genes, PPI construction, and hub genes identification.
According to the results, the potential mechanisms of OS were
revealed, which provided novel insights into OS diagnosis and
therapy.
Following implementation of the pathway functional
analyses for differentially hypomethylated genes, the pathway of
neuroactive ligand-receptor interaction was selected as the most
significant pathway. Neuroactive steroids act as mediators of
neurotransmitter receptors to regulate neuronal activity (28). The effect of steroids indicates a
ligand-receptor interaction. Previous studies have reported that
neuroactive steroids have been suggested to affect the modulation
of γ-aminobutyric acid (GABA) receptors (29,30).
Notably, studies have reported that GABA receptors control cell
proliferation and have suggested that there may be an association
between the GABAergic system and oncogenesis (31,32).
In particular, GABA has been observed to be overexpressed in a
number of types of tumors, including gastric, colon, ovarian, and
breast cancer (32–34). At present, the pathway of
neuroactive ligand-receptor interaction has not been demonstrated
to be directly involved in OS. According to the results of the
present study, it may be inferred that neuroactive ligand-receptor
interaction might serve a role in OS, partially by regulating the
expression of GABA.
Notably, the GO results in the present study
indicated that the top 3 functions enriched by differentially
hypermethylated genes were associated with potassium ion transport.
A previous study suggested that ion channels may be involved in the
progression of cancer (35).
Potassium channels, a class of ion channel, have been demonstrated
to be aberrantly expressed in tumor cells and to be involved in
carcinogenesis (36,37). Potassium channels serve diverse
roles in cancer-associated processes, including cell survival,
proliferation, and migration (38,39).
Notably, a previous study demonstrated the roles of potassium
channels in the control of glioma cell survival, growth and
migration (40). Potassium
chloride cotransporter 2 has been indicated to increase cervical
cancer cell invasion through an ion transport-based mechanism
(41). A high level of potassium
expression has been reported in OS (42,43).
Accordingly, the results of the present study indicated a further
link between potassium ion transport and OS progression.
For differentially hypomethylated genes, GO
functions were associated with transmembrane transporter activity.
Facilitated glucose transporters regulate the energy-associated
transport of glucose across the plasma membrane (44). A previous study demonstrated that
the suppression of glucose transport was associated with apoptosis
(45). Apoptosis has been
implicated to exert an important role in the progression of OS.
Increasing evidence has suggested that the induction of apoptosis
may be an effective means of inhibiting tumor formation and
development (46–48). As reported, one cellular mechanism
which produces resistance to antineoplastic therapy involves the
efflux of drugs from cancer cells through specific transmembrane
transporters (49). Therefore, it
may be inferred that transmembrane transporter activity is
associated with OS progression.
Based on the degree distribution in the PPI network,
NMU and NMUR1 exhibited the highest degrees. NMU, a neuropeptide,
has potent activity in energy homeostasis (50). A previous study demonstrated that
NMU may cause the release of inflammatory cytokines from T cells or
macrophages (51). Notably,
cytokine-releasing immune cells may stimulate neovascularization to
promote the growth of human neoplasms. Studies have indicated that
NMU is associated with tumorigenesis. For example, NMU has been
reported to stimulate the migration of renal cancer cells (52,53),
and acts as a potential growth factor for myeloid leukemia
(54). NMUR1, a receptor of NMU,
has been demonstrated to be expressed in renal cancer cells
(52). The potential role of NMU
and NMUR1 in OS has not been documented. According to the results
of the present study, it may be inferred that NMU and NMUR1 may
serve an important role in OS.
In the present study, the data were recruited from
the DNA methylation dataset GSE36002, which was analyzed by Kresse
et al (15). Consistent
with the study of Kresse et al, differentially methylated
genes between OS and normal samples were extracted in the present
study, and GO functional and pathway enrichment analyses were
implemented to examine the underlying mechanism of OS. However,
there remain certain discrepancies. On the basis of the study of
Kresse et al, further analyses using bioinformatics were
performed in the present study, including the construction of the
PPI network and hub gene analysis.
However, the present study had certain limitations.
There was a small amount of sample data. Additionally, the data
used in the present study were recruited from the GEO database, and
not collected specifically for the present study. Since GEO is a
large data repository, a meta-analysis of the relevant datasets for
OS may be performed in the future. Additionally, the OS samples
were obtained from cell lines, while normal samples were obtained
from the human bones of different donors. In addition, the findings
were bioinformatics-based identification and were not validated
using biological experiments. Therefore, further experimental
studies are required.
In conclusion, the present study provided a
comprehensive bioinformatics analysis of differentially methylated
genes which may be involved in the development and progression of
OS. The results of the present study may provide an insight into
the potential pathogenesis of OS. Additionally, functional terms
(potassium ion transport, transmembrane transporter activity and
neuroactive ligand-receptor interaction) and hub genes (NMU and
NMUR1) may serve as potential therapeutic targets for OS. However,
further work is required to improve the diagnosis and treatment of
OS by regulating functional terms.
References
|
1
|
Kobayashi E, Hornicek FJ and Duan Z:
MicroRNA Involvement in Osteosarcoma. Sarcoma. 2012:3597392012.
View Article : Google Scholar : PubMed/NCBI
|
|
2
|
Posthumadeboer J, Witlox MA, Kaspers GJ
and van Royen BJ: Molecular alterations as target for therapy in
metastatic osteosarcoma: A review of literature. Clin Exp
Metastasis. 28:493–503. 2011. View Article : Google Scholar : PubMed/NCBI
|
|
3
|
He Y, Cui Y, Wang W, Gu J, Guo S, Ma K and
Luo X: Hypomethylation of the hsa-miR-191 locus causes high
expression of hsa-mir-191 and promotes the
epithelial-to-mesenchymal transition in hepatocellular carcinoma.
Neoplasia. 13:841–853. 2011. View Article : Google Scholar : PubMed/NCBI
|
|
4
|
Geiman TM and Robertson KD: Chromatin
remodeling, histone modifications and DNA methylation-how does it
all fit together? J Cell Biochem. 87:117–125. 2002. View Article : Google Scholar : PubMed/NCBI
|
|
5
|
Flores K, Wolschin F, Corneveaux JJ, Allen
AN, Huentelman MJ and Amdam GV: Genome-wide association between DNA
methylation and alternative splicing in an invertebrate. BMC
Genomics. 13:4802012. View Article : Google Scholar : PubMed/NCBI
|
|
6
|
Zhao Y, Sun J, Zhang H, Guo S, Gu J, Wang
W, Tang N, Zhou X and Yu J: High-frequency aberrantly methylated
targets in pancreatic adenocarcinoma identified via global DNA
methylation analysis using methylCap-seq. Clin Epigenetics.
6:182014. View Article : Google Scholar : PubMed/NCBI
|
|
7
|
Jiang F, Todd NW, Li R, Zhang H, Fang H
and Stass SA: A panel of sputum-based genomic marker for early
detection of lung cancer. Cancer Prev Res (Phila). 3:1571–1578.
2010. View Article : Google Scholar : PubMed/NCBI
|
|
8
|
Guo S, Wang YL, Li Y, Jin L, Xiong M, Ji
QH and Wang J: Significant SNPs have limited prediction ability for
thyroid cancer. Cancer Med. 3:731–735. 2014. View Article : Google Scholar : PubMed/NCBI
|
|
9
|
Zhu J and Yao X: Use of DNA methylation
for cancer detection: Promises and challenges. Int J Biochem Cell
Biol. 41:147–154. 2009. View Article : Google Scholar : PubMed/NCBI
|
|
10
|
Hou P, Ji M, Yang B, Chen Z, Qiu J, Shi X
and Lu Z: Quantitative analysis of promoter hypermethylation in
multiple genes in osteosarcoma. Cancer. 106:1602–1609. 2006.
View Article : Google Scholar : PubMed/NCBI
|
|
11
|
Lim S, Yang MH, Park JH, Nojima T,
Hashimoto H, Unni KK and Park YK: Inactivation of the RASSF1A in
osteosarcoma. Onco Rep. 10:897–901. 2003.
|
|
12
|
Patiño-García A, Piñeiro ES, Díez MZ,
Iturriagagoitia LG, Klüssmann FA and Ariznabarreta LS: Genetic and
epigenetic alterations of the cell cycle regulators and tumor
suppressor genes in pediatric osteosarcomas. J Pediatr Hematol
Oncol. 25:362–367. 2003. View Article : Google Scholar : PubMed/NCBI
|
|
13
|
Sonaglio V, de Carvalho AC, Toledo SR,
Salinas-Souza C, Carvalho AL, Petrilli AS, de Camargo B and Vettore
AL: Aberrant DNA methylation of ESR1 and p14ARF genes could be
useful as prognostic indicators in osteosarcoma. OncoTargets Ther.
6:713–723. 2013.
|
|
14
|
Lu J, Song G, Tang Q, Zou C, Han F, Zhao
Z, Yong B, Yin J, Xu H, Xie X, et al: IRX1 hypomethylation promotes
osteosarcoma metastasis via induction of CXCL14/NF-κB signaling. J
Clin Invest. 125:1839–1856. 2015. View
Article : Google Scholar : PubMed/NCBI
|
|
15
|
Kresse SH, Rydbeck H, Skårn M, Namløs HM,
Barragan-Polania AH, Cleton-Jansen AM, Serra M, Liestøl K,
Hogendoorn PC, Hovig E, et al: Integrative analysis reveals
relationships of genetic and epigenetic alterations in
osteosarcoma. PLoS One. 7:e482622012. View Article : Google Scholar : PubMed/NCBI
|
|
16
|
Du P, Kibbe WA and Lin SM: Lumi: A
pipeline for processing Illumina microarray. Bioinformatics.
24:1547–1548. 2008. View Article : Google Scholar : PubMed/NCBI
|
|
17
|
Du P, Zhang X, Huang CC, Jafari N, Kibbe
WA, Hou L and Lin SM: Comparison of Β-value and M-value methods for
quantifying methylation levels by microarray analysis. BMC
Bioinformatics. 11:5872010. View Article : Google Scholar : PubMed/NCBI
|
|
18
|
Teschendorff AE, Marabita F, Lechner M,
Bartlett T, Tegner J, Gomez-Cabrero D and Beck S: A β-mixture
quantile normalization method for correcting probe design bias in
Illumina Infinium 450 k DNA methylation data. Bioinformatics.
29:189–196. 2013. View Article : Google Scholar : PubMed/NCBI
|
|
19
|
Wu P, Farrell WE, Haworth KE, Emes RD,
Kitchen MO, Glossop JR, Hanna FW and Fryer AA: Maternal genome-wide
DNA methylation profiling in gestational diabetes shows distinctive
disease-associated changes relative to matched healthy pregnancies.
Epigenetics. Mar 16–2016.(Epub ahead of print). View Article : Google Scholar :
|
|
20
|
Olson CF: Parallel Algorithms for
Hierarchical Clustering. Pattern An Mach Int IEEE Trans.
12:1088–1092. 1990. View
Article : Google Scholar
|
|
21
|
Sturn A, Quackenbush J and Trajanoski Z:
Genesis: Cluster analysis of microarray data. Bioinformatics.
18:207–208. 2002. View Article : Google Scholar : PubMed/NCBI
|
|
22
|
Ashburner M, Ball CA, Blake JA, Botstein
D, Butler H, Cherry JM, Davis AP, Dolinski K, Dwight SS, Eppig JT,
et al: Gene ontology: Tool for the unification of biology. The Gene
Ontology Consortium. Nat Genet. 25:25–29. 2000. View Article : Google Scholar : PubMed/NCBI
|
|
23
|
da Huang W, Sherman BT and Lempicki RA:
Systematic and integrative analysis of large gene lists using DAVID
bioinformatics resources. Nat Protoc. 4:44–57. 2009. View Article : Google Scholar : PubMed/NCBI
|
|
24
|
Benjamini Y, Drai D, Elmer G, Kafkafi N
and Golani I: Controlling the false discovery rate in behavior
genetics research. Behav Brain Res. 125:279–284. 2001. View Article : Google Scholar : PubMed/NCBI
|
|
25
|
Kanehisa M and Goto S: KEGG: Kyoto
Encyclopedia of Genes and Genomes. Nucleic Acids Res. 28:27–30.
2000. View Article : Google Scholar : PubMed/NCBI
|
|
26
|
von Mering C, Huynen M, Jaeggi D, Schmidt
S, Bork P and Snel B: STRING: A database of predicted functional
associations between proteins. Nucleic Acids Res. 31:258–261. 2003.
View Article : Google Scholar : PubMed/NCBI
|
|
27
|
Smoot ME, Ono K, Ruscheinski J, Wang PL
and Ideker T: Cytoscape 2.8: New features for data integration and
network visualization. Bioinformatics. 27:431–432. 2011. View Article : Google Scholar : PubMed/NCBI
|
|
28
|
Smith SS: Female sex steroid hormones:
From receptors to networks to performance-actions on the
sensorimotor system. Prog Neurobiol. 44:55–86. 1994. View Article : Google Scholar : PubMed/NCBI
|
|
29
|
Chisari M, Eisenman LN, Krishnan K,
Bandyopadhyaya AK, Wang C, Taylor A, Benz A, Covey DF, Zorumski CF
and Mennerick S: The influence of neuroactive steroid lipophilicity
on GABAA receptor modulation: Evidence for a low-affinity
interaction. J Neurophysiol. 102:1254–1264. 2009. View Article : Google Scholar : PubMed/NCBI
|
|
30
|
Smith SS: Withdrawal properties of a
neuroactive steroid: Implications for GABA A receptor gene
regulation in the brain and anxiety behavior. Steroids. 67:519–528.
2002. View Article : Google Scholar : PubMed/NCBI
|
|
31
|
Watanabe M, Maemura K, Oki K, Shiraishi N,
Shibayama Y and Katsu K: Gamma-aminobutyric acid (GABA) and cell
proliferation: Focus on cancer cells. Histol Histopathol.
21:1135–1141. 2006.PubMed/NCBI
|
|
32
|
Szczaurska K, Mazurkiewicz M and Opolski
A: The role of GABA-ergic system in carcinogenesis. Postepy Hig Med
Dosw. 57:485–500. 2003.PubMed/NCBI
|
|
33
|
Moon MS, Cho EW, Byun HS, Jung IL and Kim
IG: GAD 67KD antisense in colon cancer cells inhibits cell growth
and sensitizes to butyrate and pH reduction and H2O2 and
gamma-radiation. Arch Biochem Biophys. 430:229–236. 2004.
View Article : Google Scholar : PubMed/NCBI
|
|
34
|
Kleinrok Z, Matuszek M, Jesipowicz J,
Matuszek B, Opolski A and Radzikowski C: GABA content and GAD
activity in colon tumors taken from patients with colon cancer or
from xenografted human colon cancer cells growing as s.c. Tumors in
athymic nu/nu mice. J Physiol Pharmacol. 49:303–310.
1998.PubMed/NCBI
|
|
35
|
Kunzelmann K: Ion Channels and Cancer. J
Membr Biol. 205:159–173. 2005. View Article : Google Scholar : PubMed/NCBI
|
|
36
|
Pardo LA and Stuhmer W: Eag1: An emerging
oncological target. Cancer Res. 68:1611–1613. 2008. View Article : Google Scholar : PubMed/NCBI
|
|
37
|
Voloshyna I, Besana A, Castillo M, Matos
T, Weinstein IB, Mansukhani M, Robinson RB and Cordon-Cardo C:
TREK-1 is a novel molecular target in prostate cancer. Cancer Res.
68:1197–1203. 2008. View Article : Google Scholar : PubMed/NCBI
|
|
38
|
Weaver AK, Bomben VC and Sontheimer H:
Expression and function of calcium-activated potassium channels in
human glioma cells. Glia. 54:223–233. 2006. View Article : Google Scholar : PubMed/NCBI
|
|
39
|
Pluznick JL and Sansom SC: BK channels in
the kidney: Role in K(+) secretion and localization of molecular
components. Am J Physiol Renal Physiol. 291:F517–F529. 2006.
View Article : Google Scholar : PubMed/NCBI
|
|
40
|
Weaver AK, Liu X and Sontheimer H: Role
for calcium-activated potassium channels (BK) in growth control of
human malignant glioma cells. J Neurosci Res. 78:224–234. 2004.
View Article : Google Scholar : PubMed/NCBI
|
|
41
|
Wei WC, Akerman CJ, Newey SE, Pan J,
Clinch NW, Jacob Y, Shen MR, Wilkins RJ and Ellory JC: The
potassium-chloride cotransporter 2 promotes cervical cancer cell
migration and invasion by an ion transport-independent mechanism. J
Physiol. 589:5349–5359. 2011. View Article : Google Scholar : PubMed/NCBI
|
|
42
|
Rezzonico R, Schmid-Alliana A, Romey G,
Bourget-Ponzio I, Breuil V, Breittmayer V, Tartare-Deckert S, Rossi
B and Schmid-Antomarchi H: Prostaglandin E2 induces interaction
between hSlo potassium channel and Syk tyrosine kinase in
osteosarcoma cells. J Bone Miner Res. 17:869–878. 2002. View Article : Google Scholar : PubMed/NCBI
|
|
43
|
Wu J, Zhong D, Wu X, Sha M, Kang L and
Ding Z: Voltage-gated potassium channel Kv1.3 is highly expressed
in human osteosarcoma and promotes osteosarcoma growth. Int J Mol
Sci. 14:19245–19256. 2013. View Article : Google Scholar : PubMed/NCBI
|
|
44
|
Macheda ML, Rogers S and Best JD:
Molecular and cellular regulation of glucose transporter (GLUT)
proteins in cancer. J Cell Physiol. 202:654–662. 2005. View Article : Google Scholar : PubMed/NCBI
|
|
45
|
Moley KH and Mueckler MM: Glucose
transport and apoptosis. Apoptosis. 5:99–105. 2000. View Article : Google Scholar : PubMed/NCBI
|
|
46
|
Lorenz HM, Herrmann M, Winkler T, Gaipl U
and Kalden JR: Role of apoptosis in autoimmunity. Apoptosis.
5:443–449. 2000. View Article : Google Scholar : PubMed/NCBI
|
|
47
|
Schulze-Bergkamen H and Krammer PH:
Apoptosis in cancer-implications for therapy. Semin Oncol.
31:90–119. 2004. View Article : Google Scholar : PubMed/NCBI
|
|
48
|
Wyllie AH: Apoptosis and the regulation of
cell numbers in normal and neoplastic tissues: An overview. Cancer
Metastasis Rev. 11:95–103. 1992. View Article : Google Scholar : PubMed/NCBI
|
|
49
|
Deeley RG, Westlake C and Cole SP:
Transmembrane transport of endo-and xenobiotics by mammalian
ATP-binding cassette multidrug resistance proteins. Physiol Rev.
86:849–899. 2006. View Article : Google Scholar : PubMed/NCBI
|
|
50
|
Fujii R, Hosoya M, Fukusumi S, Kawamata Y,
Habata Y, Hinuma S, Onda H, Nishimura O and Fujino M:
Identification of neuromedin U as the cognate ligand of the orphan
G protein-coupled receptor FM-3. J Biol Chem. 275:21068–21074.
2000. View Article : Google Scholar : PubMed/NCBI
|
|
51
|
Moriyama M, Sato T, Inoue H, Fukuyama S,
Teranishi H, Kangawa K, Kano T, Yoshimura A and Kojima M: The
neuropeptide neuromedin U promotes inflammation by direct
activation of mast cells. J Exp Med. 202:217–224. 2005. View Article : Google Scholar : PubMed/NCBI
|
|
52
|
Harten SK, Esteban MA, Shukla D, Ashcroft
M and Maxwell PH: Inactivation of the von Hippel-Lindau tumour
suppressor gene induces Neuromedin U expression in renal cancer
cells. Mol Cancer. 10:892011. View Article : Google Scholar : PubMed/NCBI
|
|
53
|
Kohno Y: Oral cancer in vivo gene
expression profiling assisted by laser capture microdissection and
microarray analysis. Oncogene. 20:6196–6204. 2001. View Article : Google Scholar : PubMed/NCBI
|
|
54
|
Shetzline SE, Rallapalli R, Dowd KJ, Zou
S, Nakata Y, Swider CR, Kalota A, Choi JK and Gewirtz AM:
Neuromedin U: A Myb-regulated autocrine growth factor for human
myeloid leukemias. Blood. 104:1833–1840. 2004. View Article : Google Scholar : PubMed/NCBI
|