Introduction
Renal cancer is the seventh most common cancer in
men and the tenth most common cancer in women, accounting for 5 and
3% of all malignant tumors in men and women, respectively (1). Renal cell carcinoma (RCC) is a major
subtype of renal cancer, and accounts for ~90% of all renal cancers
(2,3), with a male-to-female ratio of ~2:1
(4). Clear cell RCC is an
aggressive form with a prevalence of 85% and is the most common
histological type of RCC (5,6).
Although the etiology of RCC is not well understood, some risk
factors of RCC are well known, including hypertension, obesity and
smoking (7). There were 5,900 new
cases of RCC diagnosed in Canada in 2012 and >65,150 new cases
were reported in the United States in 2013 (4,8).
Following surgical treatment, recurrence and metastasis still occur
in 50% of patients with RCC (9).
It is inefficient to use chemotherapy or radiotherapy to treat RCC
(10); therefore, it is important
to identify a useful tumor marker to assist the diagnosis of
RCC.
MicroRNAs (miRNAs) are non-coding RNAs that are
20-23 nucleotides in length, which are cleaved from hairpin-shaped
pre-miRNA (11). Through binding
to the 3′-untranslated regions of messenger RNA, miRNAs serve a
crucial role in a number of biological processes, including cell
growth, proliferation, apoptosis, differentiation, migration and
metabolism (11–14). Previous studies have demonstrated
that dysregulated miRNA expression occurred in a variety of cancers
and miRNAs may act as oncogenes when upregulated or tumor
suppressors when downregulated (15–17).
Owing to the imperfect complementarity between miRNAs and mRNAs,
one mRNA may be regulated by several miRNAs and one miRNA is able
to regulate several mRNAs (16).
Therefore, miRNAs have a potential value in clinical practice, such
as tumor markers for diagnosis, prognosis and possibly novel
treatments.
Previous studies have revealed that miRNA
(miR)-660-5p expression is dysregulated in many human malignancies,
such as lung cancer (18), breast
cancer (19), multiple myeloma
(20) and chronic lymphocytic
leukemia (21). However, the
clinical significance and function of miR-660-5p in RCC remained to
be explored. Four previous microarray chip studies have
demonstrated that miR-660-5p was downregulatd in RCC (18,19,22,23).
In the present study, the expression of miR-660-5p in RCC tissues
and cell lines was detected by reverse transcription-quantitative
polymerase chain reaction (RT-qPCR), followed by functional
analyses of miR-660-5p in RCC cell migration, proliferation,
invasion and apoptosis.
Materials and methods
Human patient sample collection
A total of 25 paired RCC tissues and normal adjacent
tissues (NATs; which were located 2 cm outside of the visible RCC
lesions) were collected in the Peking University Shenzhen Hospital
(Shenzhen, China) between 2012 and 2014. Clinicopathological and
histological diagnostics for patients with RCC were determined
according to the 2009 American Joint Committee on Cancer staging
system (Table I) (24). Patients with RCC enrolled in the
present study received neither chemotherapy nor radiotherapy prior
to tissue sampling. Once removed, all tissue samples were
immediately immersed in RNAlater (Qiagen GmbH, Hilden, Germany) and
frozen in liquid nitrogen (−80°C) for further study. The present
study was approved by the Ethics Committee of Peking University
Shenzhen Hospital, and written informed consent was obtained from
all patients.
 | Table I.Clinicopathological features of
patientsa with renal
cell carcinoma. |
Table I.
Clinicopathological features of
patientsa with renal
cell carcinoma.
| Characteristic | n |
|---|
| Sex |
|
|
Male | 18 |
|
Female | 7 |
| Histological
type |
|
| Clear
cell | 21 |
|
Papillary | 4 |
| Primary tumor
stage |
|
| T1 | 14 |
| T2 | 6 |
|
T3+T4 | 5 |
| Fuhrman grade |
|
| I | 12 |
| II | 9 |
|
III+IV | 4 |
| AJCC clinical
stages |
|
| I | 12 |
| II | 8 |
|
III+IV | 5 |
Cell culture
The human RCC cell lines 786-O and ACHN line were
obtained from American Type Culture Collection (Manassas, VA, USA),
and were seeded and grown in Dulbecco's modified Eagle's medium
(DMEM; Gibco; Thermo Fisher Scientific, Inc., Waltham, MA, USA)
supplemented with 10% fetal bovine serum (FBS; Gibco; Thermo Fisher
Scientific, Inc.), 1% glutamate (Gibco; Thermo Fisher Scientific,
Inc.) and 1% antibiotics (100 U/ml penicillin; 100 mg/ml
streptomycin). All cells were cultured in a humidified atmosphere
containing 5% CO2 at 37°C.
Cell transfection
A total of 3×10⁵ cells were seeded into
6-well plates and cultured for 24 h at 37°C prior to transfection.
To upregulate or downregulate miR-660-5p expression, 200 pmol
synthesized miR-660-5p mimic or inhibitor (Shanghai GenePharma Co.,
Ltd., Shanghai, China; Table II),
respectively, as well as 200 pmol mimic and inhibitor negative
controls (NCs), were transfected into cells (once the cells had
reached 60–80% confluence) using Lipofectamine 2000 (Invitrogen;
Thermo Fisher Scientific, Inc.) for 6 h, which were mixed in the
Opti-MEM I Reduced Serum Medium (Gibco; Thermo Fisher Scientific,
Inc.) according to the manufacturer's protocol. After transfection
for 6 h, transfection efficiency was verified by RT-qPCR
subsequently (25). The different
concentrations of RNA used for transfection in subsequent assays
have been used according to the manufacturer's protocol for use
with different size plates.
| Table II.Sequences of components used in the
study. |
Table II.
Sequences of components used in the
study.
| Component | Sequence
(5′-3′) |
|---|
| qPCR primer |
|
|
miR-660-5p | F:
TACCCATTGCATATCGGAGTTG |
|
| R: Universal
primera |
| U6 | F:
CTCGCTTCGGCAGCACA |
|
| R:
ACGCTTCACGAATTTGCGT |
| Transfection |
|
|
miR-660-5p inhibitor |
CAACUCCGAUAUGCAAUGGGUA |
|
Inhibitor NC |
CAGUACUUUUGUGUAGUACAA |
|
miR-660-5p mimic | Sense:
UACCCAUUGCAUAUCGGAGUUG |
|
| Antisense:
ACUCCGAUAUGCAAUGGGUAUU |
| Mimics
NC | Sense:
UUCUCCGAACGUGUCACGUTT |
|
| Antisense:
ACGUGACACGUUCGGAGAATT |
Total RNA extraction, cDNA synthesis
and RT-qPCR
Total RNA was extracted from cells
(2.0×10⁶ cells) and tissues (25 paired RCC samples and
normal tissue) with TRIzol Reagent (Invitrogen; Thermo Fisher
Scientific, Inc.) and purified with the RNeasy Maxi kit (Qiagen
GmbH), according to the manufacturer's protocol. RNA concentration
was measured on a NanoDrop 2000c (Thermo Fisher Scientific, Inc.);
RNA samples with a 260/280 ratio between 1.8 and 2.1 were used for
further investigation. Total RNA (1 µg) from each sample was
reverse transcribed into cDNA using the miScript Reverse
Transcription kit (Qiagen GmbH), according to the manufacturer's
protocol. miR-660-5p expression levels were detected with miScript
SYBR-Green PCR kit (Qiagen GmbH) and qPCR using the Roche
LightCycler 480 Real-Time PCR system (Roche Diagnostics, Basel,
Switzerland), according to the manufacturer's protocol. Primer
sequences used in the present study are shown in Table II; U6 small nuclear RNA was used
as the internal control. PCR thermocycling conditions were as
follows: Initial denaturation at 95°C for 15 min, followed by 40
cycles of 94°C for 15 sec, 55°C for 30 sec and 72°C for 30 sec. The
expression levels of miR-660-5p were analyzed using the
2−ΔΔCq method (26).
qPCR was performed in triplicate for each set. The log2
ratio (RCC/NAT) expression of miR-660-5p was calculated by log2
fold-change (FC)=the above FC in log2 scale=log2 of ratio of
treatment and control data=log2 (treatment/control)
(2−ΔΔCT: ΔCT=CTmiR-660-5p-CTU6,
ΔΔCT=CTRCC-CTNAT) (24).
Wound-healing assay
The wound-healing assay was performed to examine the
migratory ability of 786-O and ACHN cells in vitro. Cells
(3×10⁵ cells/well) were seeded into each well of 12-well
plate. Cells were grown to 80–85% confluence at 37°C and
subsequently transfected with 40 pmol of chemically synthesized
miR-660-5p inhibitors, miR-660-5p mimic, inhibitor NC or mimic NC
using Lipofectamine 2000. Following 6 h of transfection at 37°C, a
sterile 200 µl pipette tip was used to scratch a clear line through
the cell monolayer. Cells were rinsed with PBS and cultured in
serum-free DMEM in a humidified chamber containing 5%
CO2 at 37°C. Images of the scratches were acquired with
a digital camera system at 0 and 24 h post-scratch. The experiments
were performed in triplicate and repeated at least three times. Two
parallel lines were made on the edge of the scratch, and then the
distance between two parallel lines was measured on the Adobe
Photoshop CS6 software package (Adobe Systems, Inc., San Jose, CA,
USA). Relative migratory distance of cells was calculated as
follows: (D1-D2)/(D3-D4). The percentage change was calculated as
follows: -%=[(D1-D2)-(D3-D4)]/(D3-D4). D1, the average distance of
mimic/inhibitor at 0 h; D2, the average distance of mimic/inhibitor
at 24 h; D3, the average distance of mimic NC/inhibitor NC at 0 h;
D4, the average distance of mimic NC/inhibitor NC at 24 h.
MTT assay and Cell Counting kit-8
(CCK-8) assay
The MTT assay was performed to examined cell
proliferative ability of 786-O and ACHN cells in vitro.
Cells (5×10³ cells/well) were seeded in each well of
96-well plate and transfected with 5 pmol miR-660-5p inhibitor,
miR-660-5p mimic, inhibitor NC or mimic NC for 0, 24, 48 or 72 h at
37°C according to the manufacturer's protocol. Cell growth was
examined by adding 20 µl MTT (5 mg/ml; Sigma-Aldrich; Merck KGaA,
Darmstadt, Germany) into each well post-transfection, followed by
incubation at 37°C for 4 h. Formazan crystals were dissolved with
the addition of 150 µl dimethylsulfoxide (Sigma-Aldrich; Merck
KGaA) for 15 min at room temperature with agitation. The optical
density of each well was measured using a microplate reader
(Bio-Rad Laboratories, Inc., Hercules, CA, USA) at a wavelength of
490/630 nm.
Cell proliferation was also assessed with the CCK-8
assay (Beyotime Institute of Biotechnology, Haimen, China),
following the manufacturer's protocol. Cells (5×10³)
were seeded into each well of 96-well plate and incubated for 24 h
at 37°C. The cells were transfected with 5 pmol miR-660-5p
inhibitor, miR-660-5p mimic, inhibitor NC or mimic NC for 6 h at
37°C. At 0, 24, 48 and 72 h post-transfection CCK-8 solution (15
µl) was added into the wells and cells were incubate an additional
2 h at 37°C. The optical density of each well was measured using
microplate reader (Bio-Rad Laboratories, Inc.) at a wavelength of
490/630 nm. The percentage changes for both the CCK-8 and MTT
assays were performed as follows: -%=(OD1-OD2)/OD2, where OD1=the
average optical density value of mimic/inhibitor and OD2=the
average optical density value of mimic NC/inhibitor NC.
Transwell assay
Transwell assays with or without Matrigel were
performed to assess the cell invasion and migration, respectively,
of 786-O and ACHN cells in vitro. Transwell chamber inserts
(BD Biosciences, Franklin Lakes, NJ, USA) with (for invasion) or
without (for migration) Matrigel (BD Biosciences) were used in the
assay according to the manufacturer's protocol. Cells
(3×10⁵ cells/well) were seeded into 6-well plates for 24
h at 37°C until 70–80% confluent, and were transfected with 200
pmol miR-660-5p inhibitors, miR-660-5p mimic, inhibitor NC or mimic
NC for 6 h at 37°C. Subsequently, transfected cells
(1×10⁴ cells) were seeded in the upper chamber of the
insert in 200 µl serum-free DMEM in 24-well plates. The bottom of
the inserts was incubated in the medium containing 10% FBS. Cells
were allowed to migrate for 40 h and to invade for 60 h at 37°C. An
extended incubation period was used as the condition of the cells
it was deemed to be poor. The cells that had migrated or invaded to
the bottom of the inserts were stained with crystal violet and
counted using a Leica DMIRB inverted microscope (DP70; Olympus
Corporation, Tokyo, Japan). The relative cell number/field was
calculated as follows: The cell number/field=the mean ± standard
deviation from three independent experiments; mimic/inhibitor
group: Relative cell number per field=N1/N2; mimic NC/inhibitor NC
group: Relative cell number per field=N2/N2 (N1=the cell
number/field of mimic/inhibitor; N2=the cell number/field of mimic
NC/inhibitor NC). The experiments were performed in triplicate and
repeated at least three times.
Flow cytometry
Flow cytometry was performed to evaluate the early
apoptotic rate of 786-O and ACHN cells cultured with the various
treatments, according to the manufacturer's protocol. Cells
(3×10⁵ cells/well) were seeded into 6-well plates for 24
h at 37°C until ~70% confluent, and were transfected with 200 pmol
miR-660-5p inhibitors, miR-660-5p mimic, inhibitor NC or mimic NC
for 6 h at 37°C. At 48 h post-transfection, all cells, including
floating and adherent cells, were harvested by centrifugation at
503.1 × g for 5 min at 37°C and washed with cold PBS for twice.
Cells were resuspended in 100 µl 1X binding buffer, 5 µl Annexin
V-fluorescein isothiocyanate (FITC) and 3 µl propidium iodide (PI;
Invitrogen; Thermo Fisher Scientific, Inc.) were added into each
cell suspension. Following 15 min incubation at room temperature,
400 µl binding buffer was added to each tube, and cells were
examined on an EPICS XL Flow Cytometer (Beckman Coulter, Inc.,
Brea, CA, USA) to analyze the apoptotic rates. Experiments were
performed in triplicate and repeated at least three times.
Statistical analysis
Paired t-test was used to compare the expression
levels of miR-660-5p in matched RCC and NAT samples. The relative
expression of miR-660-5p in tissues is presented as mean ± standard
error of the mean as this improved the clarity of the graphical
representation. Other data are presented as the mean ± standard
deviation from three independent experiments. All the statistical
analyses were carried out with SPSS 19.0 statistical software
package (IBM Corp., Armonk, NY, USA). Statistical significance was
determined with Student's t-test. P<0.05 was considered to
indicate a statistically significant difference.
Results
miR-660-5p expression is downregulated
in RCC tissues compared with NATs
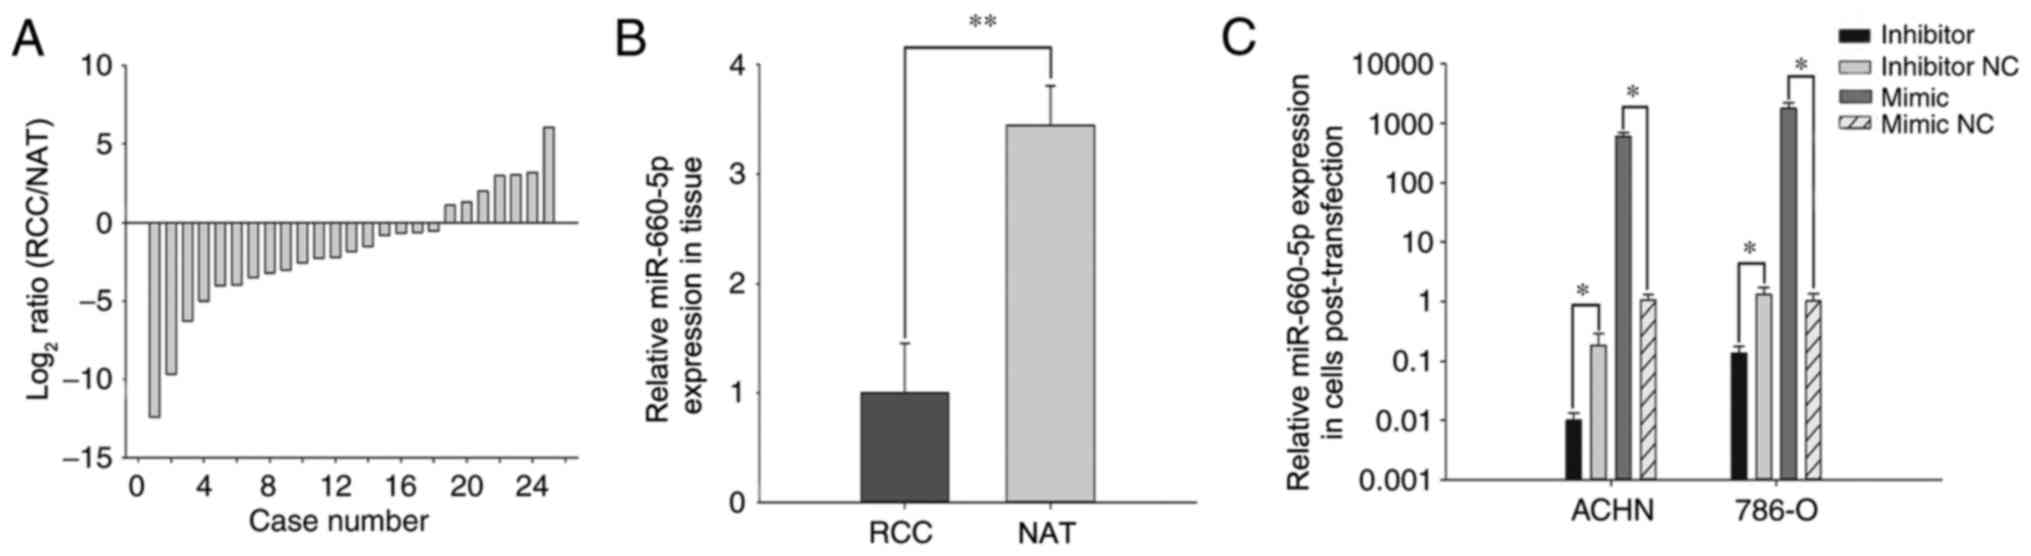
miR-660-5p expression in the 25 RCC tissues and NATs
was examined by RT-qPCR. The log2 ratio (RCC/NAT)
expression of miR-660-5p is provided in Fig. 1A, and the overall relative
expression levels of miR-660-5p in RCC tissues compared with NATs
is demonstrated in Fig. 1B. These
results demonstrated that the expression of miR-660-5p in RCC
tissues (mean relative expression, 3.44) was lower than in the NATs
(P<0.01).
Validation of cell transfection
efficiency
The relative transfection efficiency of miR-660-5p
inhibitors or mimic compared with inhibitor NC or mimic NC was
performed by RT-qPCR. miR-660-5p expression levels in the ACHN and
786-O cells transfected with miR-660-5p inhibitors were 0.01 and
0.13, respectively, whereas expression in cells transfected with
miR-660-5p mimic was 590.19 and 1762.10, respectively (Fig. 1C).
Effects of miR-660-5p mimic and
inhibitor treatments RCC cell proliferation
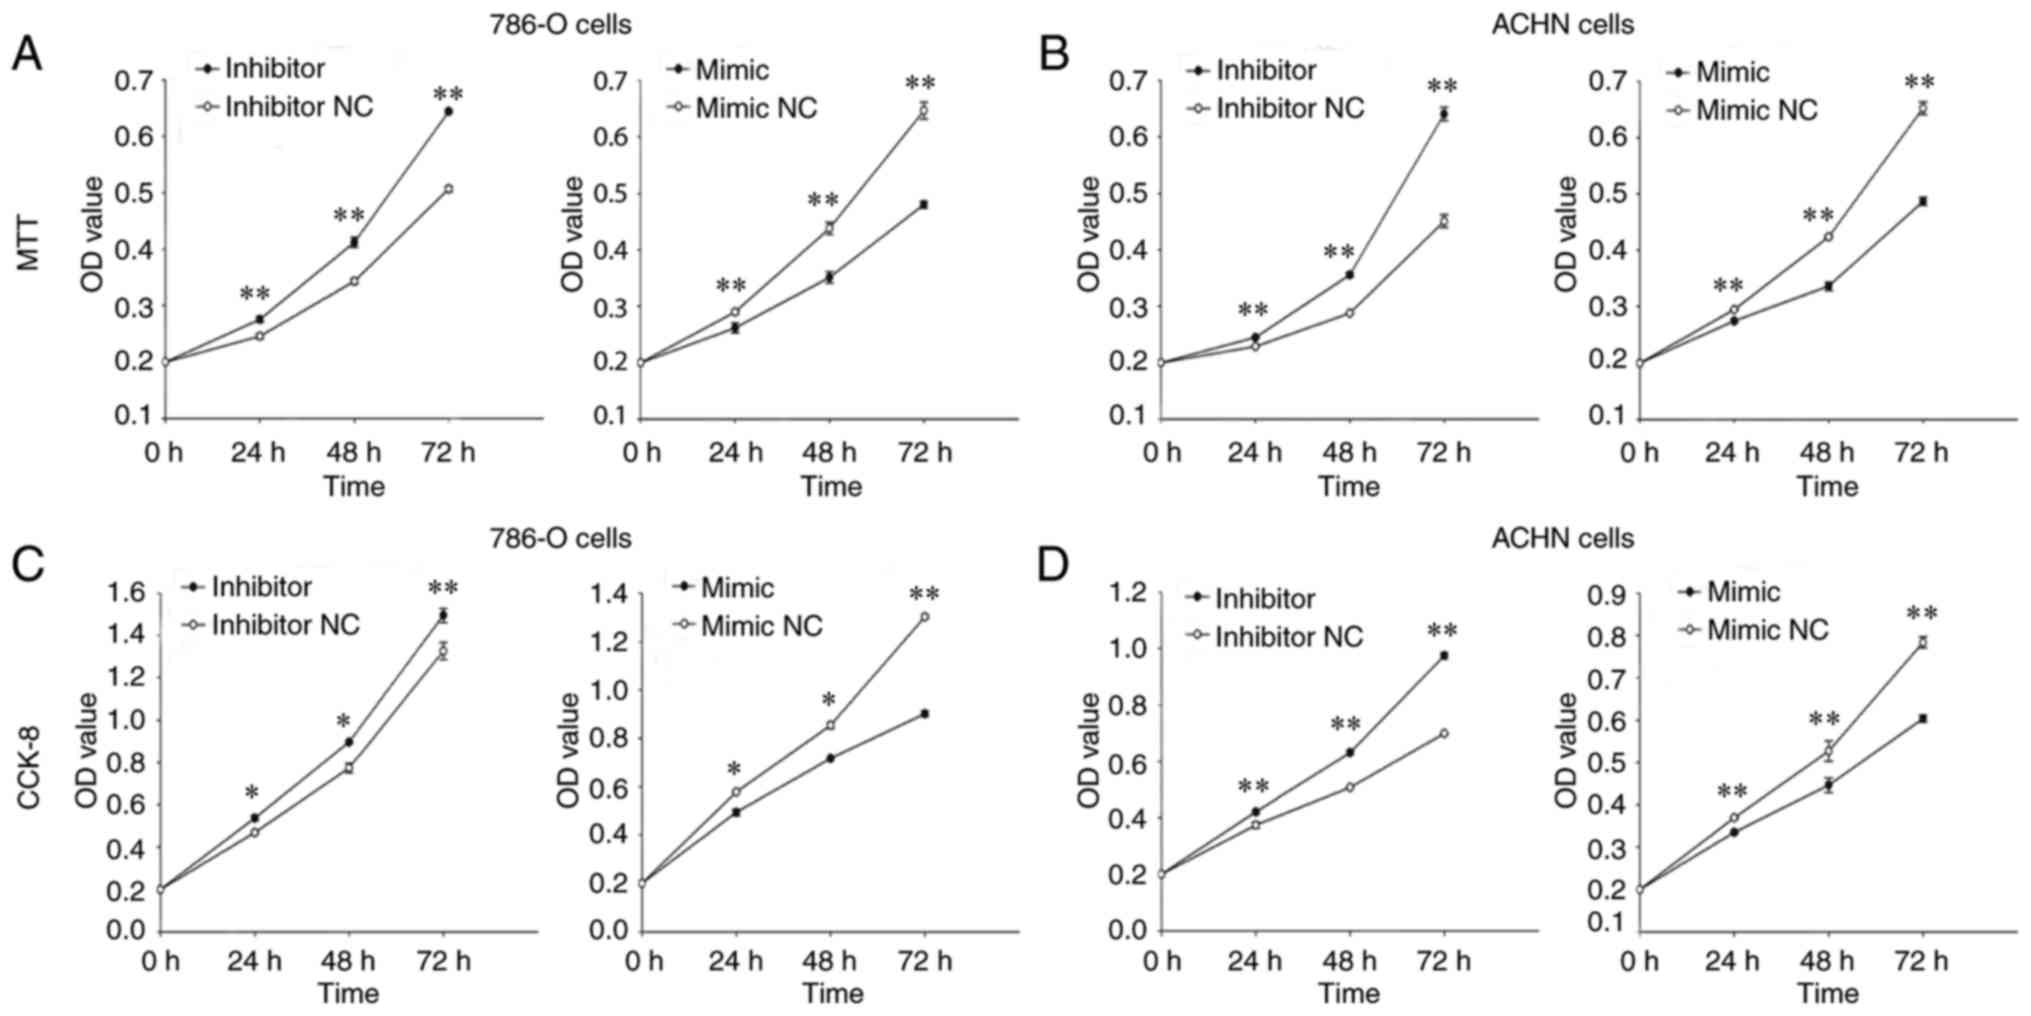
MTT and CCK-8 assays were performed to examine cell
proliferative ability of 786-O and ACHN cells in vitro. MTT
assay results indicated that proliferation in 786-O cells treated
with the miR-660-5p inhibitor was promoted by 12.14% (P<0.01),
20.14% (P<0.01) and 27.04% (P<0.01), at 0, 24, 48 and 72 h
post-transfection, respectively, compared with the proliferation
rates of cells transfected with inhibitor NC (Fig. 2A). Proliferation in the miR-660-5p
mimic-treated group was decreased by 10.84% (24 h; P<0.01),
24.83% (48 h; P<0.01) and 34.71% (72 h; P<0.01) compared with
mimic NC-treated cells (Fig. 2A).
Similarly, the MTT assay demonstrated that cell proliferation of
ACHN cells in the miR-660-5p inhibitor group was promoted by 7.04%
(P<0.01), 23.59% (P<0.01) and 42.16% (P<0.01) at 0, 24, 48
and 72 h, respectively, compared with cells in the inhibitor
NC-treated group (Fig. 2B);
proliferation was decreased by 6.80% (P<0.01), 20.61%
(P<0.01) and 25.35% (P<0.01) in cells treated with miR-660-5p
mimic compared with mimic NC-treated cells (Fig. 2B).
In the CCK-8 assay, 786-O cell proliferation was
promoted by 14.59% (P<0.05), 15.80% (P<0.05) and 12.77%
(P<0.01) in the miR-660-5p inhibitor group at 24, 48 and 72 h
post-transfection, respectively, compared with inhibitor NC-treated
cells (Fig. 2C), whereas
proliferation in the miR-660-5p mimic-treated group decreased by
14.55% (24 h; P<0.05), 16.03% (48 h; P<0.01) and 30.74% (72
h; P<0.01), compared with those transfected with mimic NC.
Similarly, the CCK-8 assay demonstrated that proliferation of ACHN
cells in the miR-660-5p inhibitor group was promoted by 12.57% (24
h; P<0.01), 24.40% (48 h; P<0.01) and 39.39% (72 h;
P<0.001), compared with cells in the inhibitor NC group
(Fig. 2D); proliferation in the
miR-660-5p mimic-treated group was decreased by 9.26% (P<0.01),
15.30% (P<0.01) and 22.95% (P<0.01) at 24, 48 and 72 h
post-transfection, respectively, compared with the mimic NC-treated
group.
Effects of miR-660-5p mimic and
inhibitor treatments on RCC cell migration
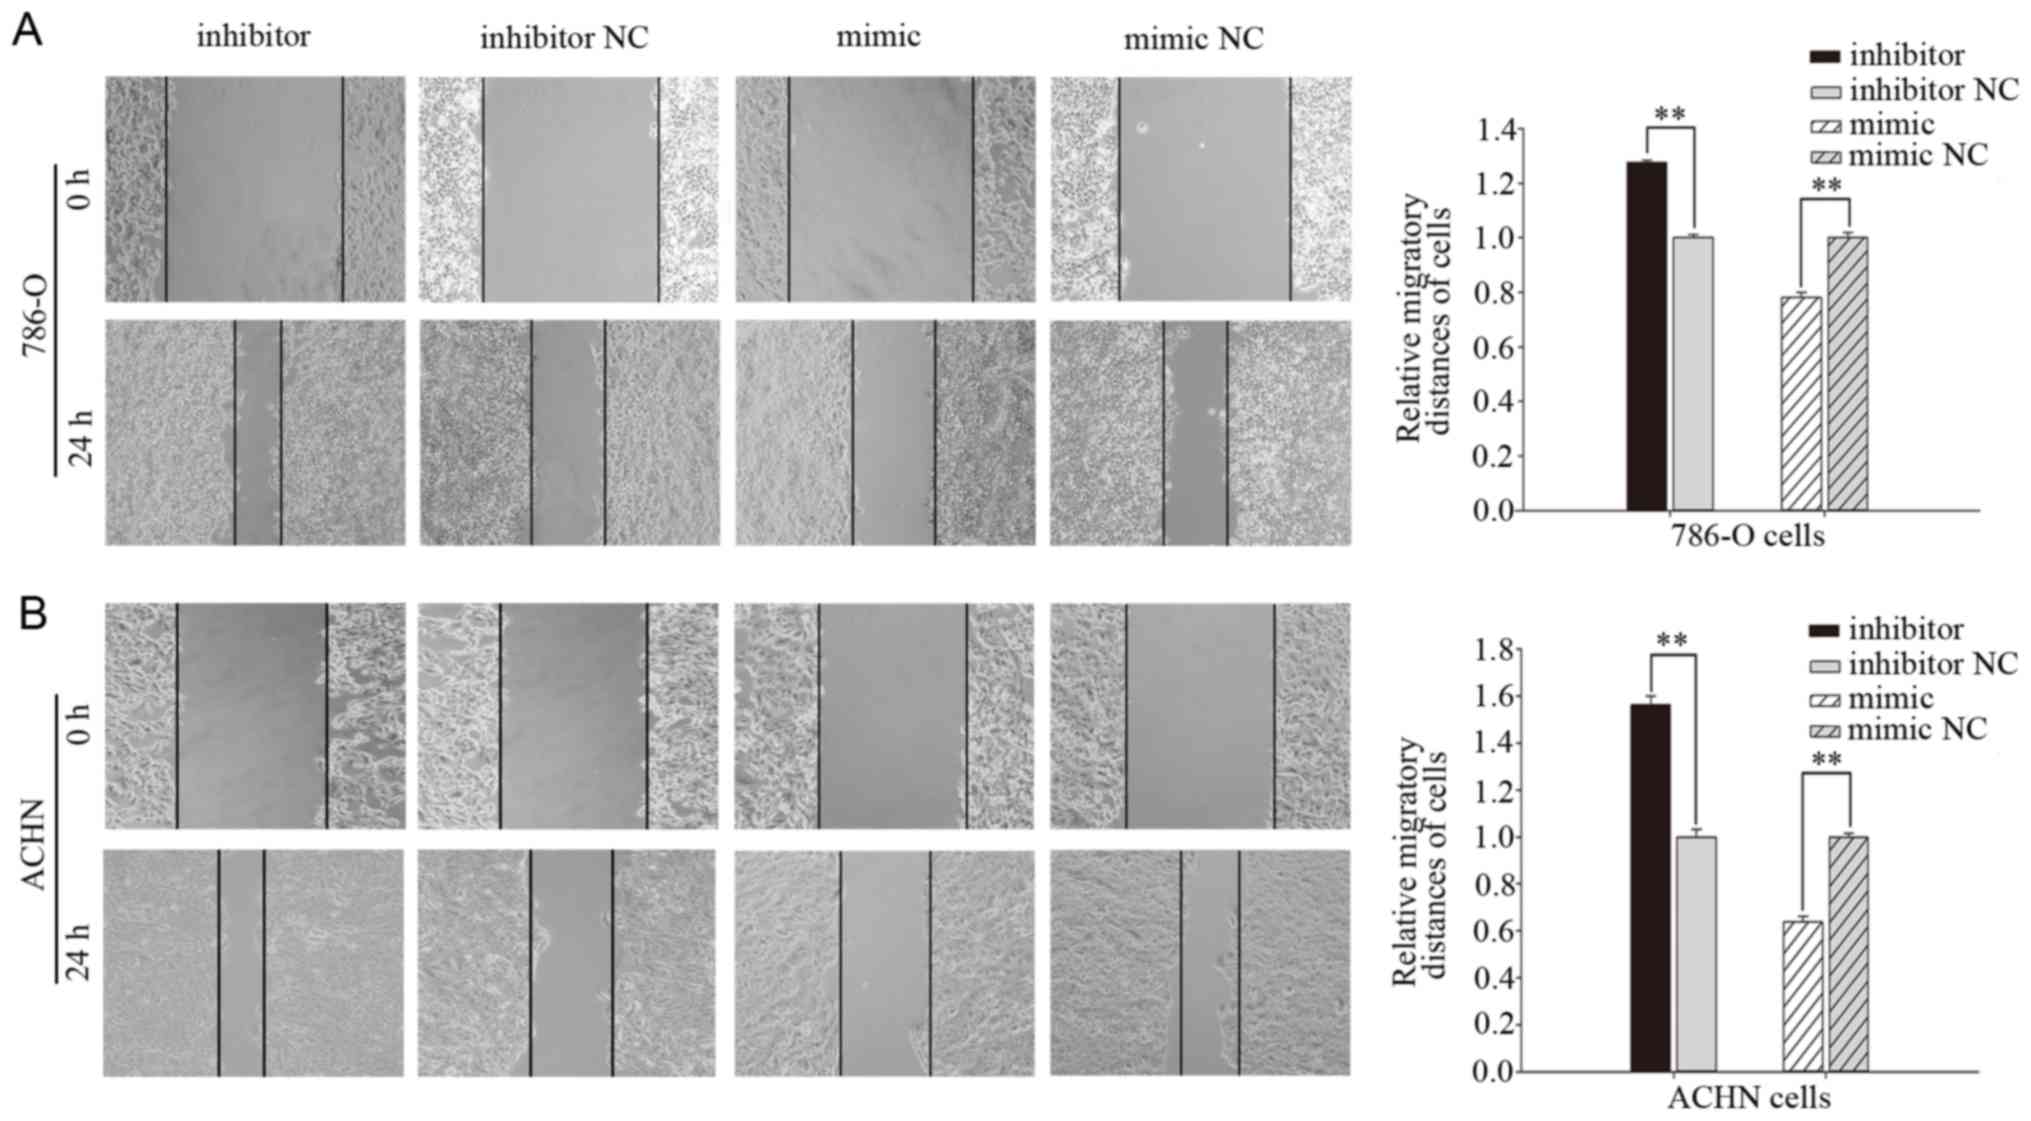
Wound-healing and Transwell assays were performed to
examine the migratory ability of 786-O and ACHN cells in
vitro. In the wound-healing assay, cells transfected with
miR-660-5p inhibitors for 24 h exhibited significantly increased
migration compared with those transfected with inhibitor NC
(Fig. 3): The migratory distance
was increased by 27.67% for 786-O cells (P<0.01; Fig. 3A) and 56.26% for ACHN cells
(P<0.01; Fig. 3B). By contrast,
compared with cells transfected with mimic NC (Fig. 3), cell migration was significantly
reduced in cells transfected with miR-660-5p mimic, for which the
migratory distance was reduced by 21.87% for 786-O cells
(P<0.01; Fig. 3A) and 36.24%
for ACHN cells (P<0.01; Fig.
3B).
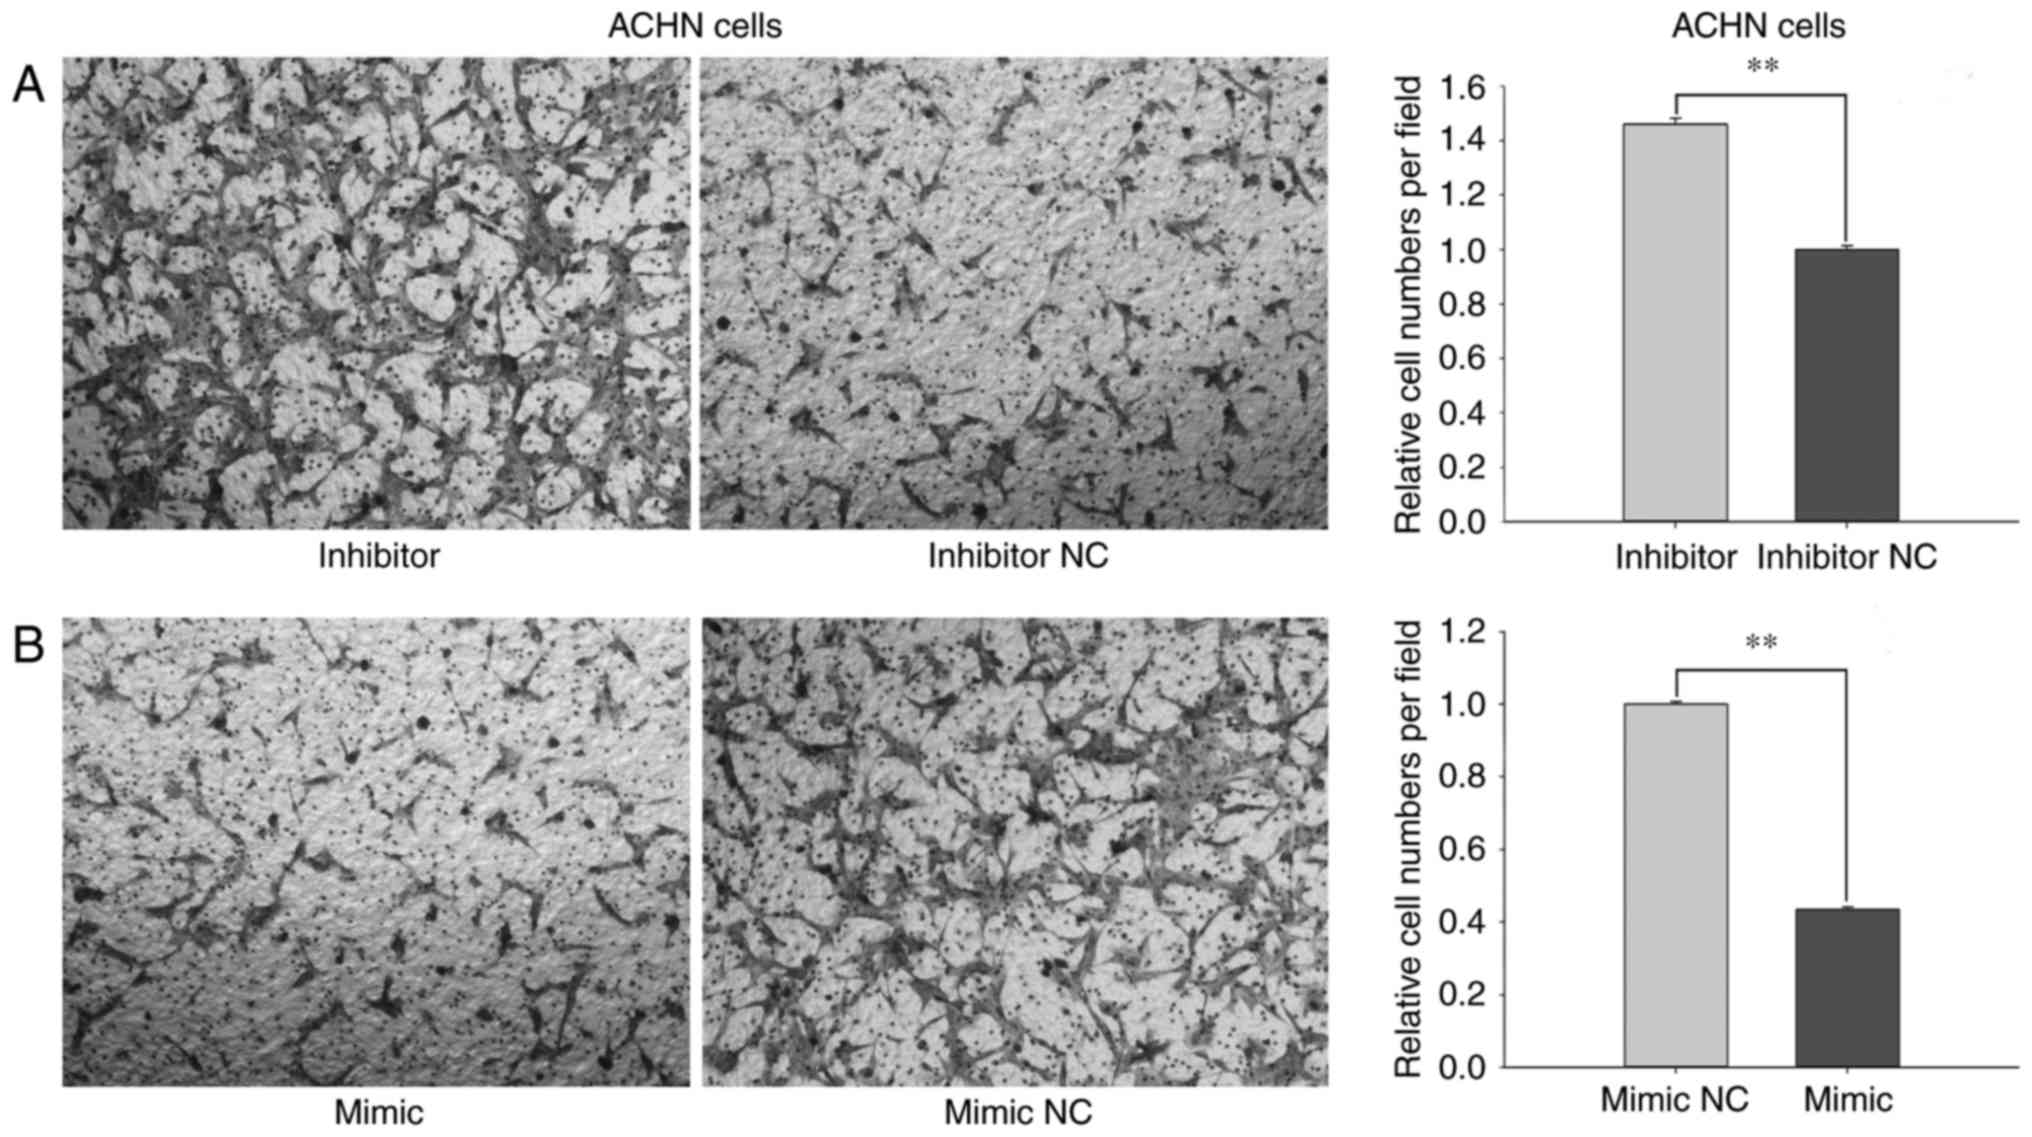
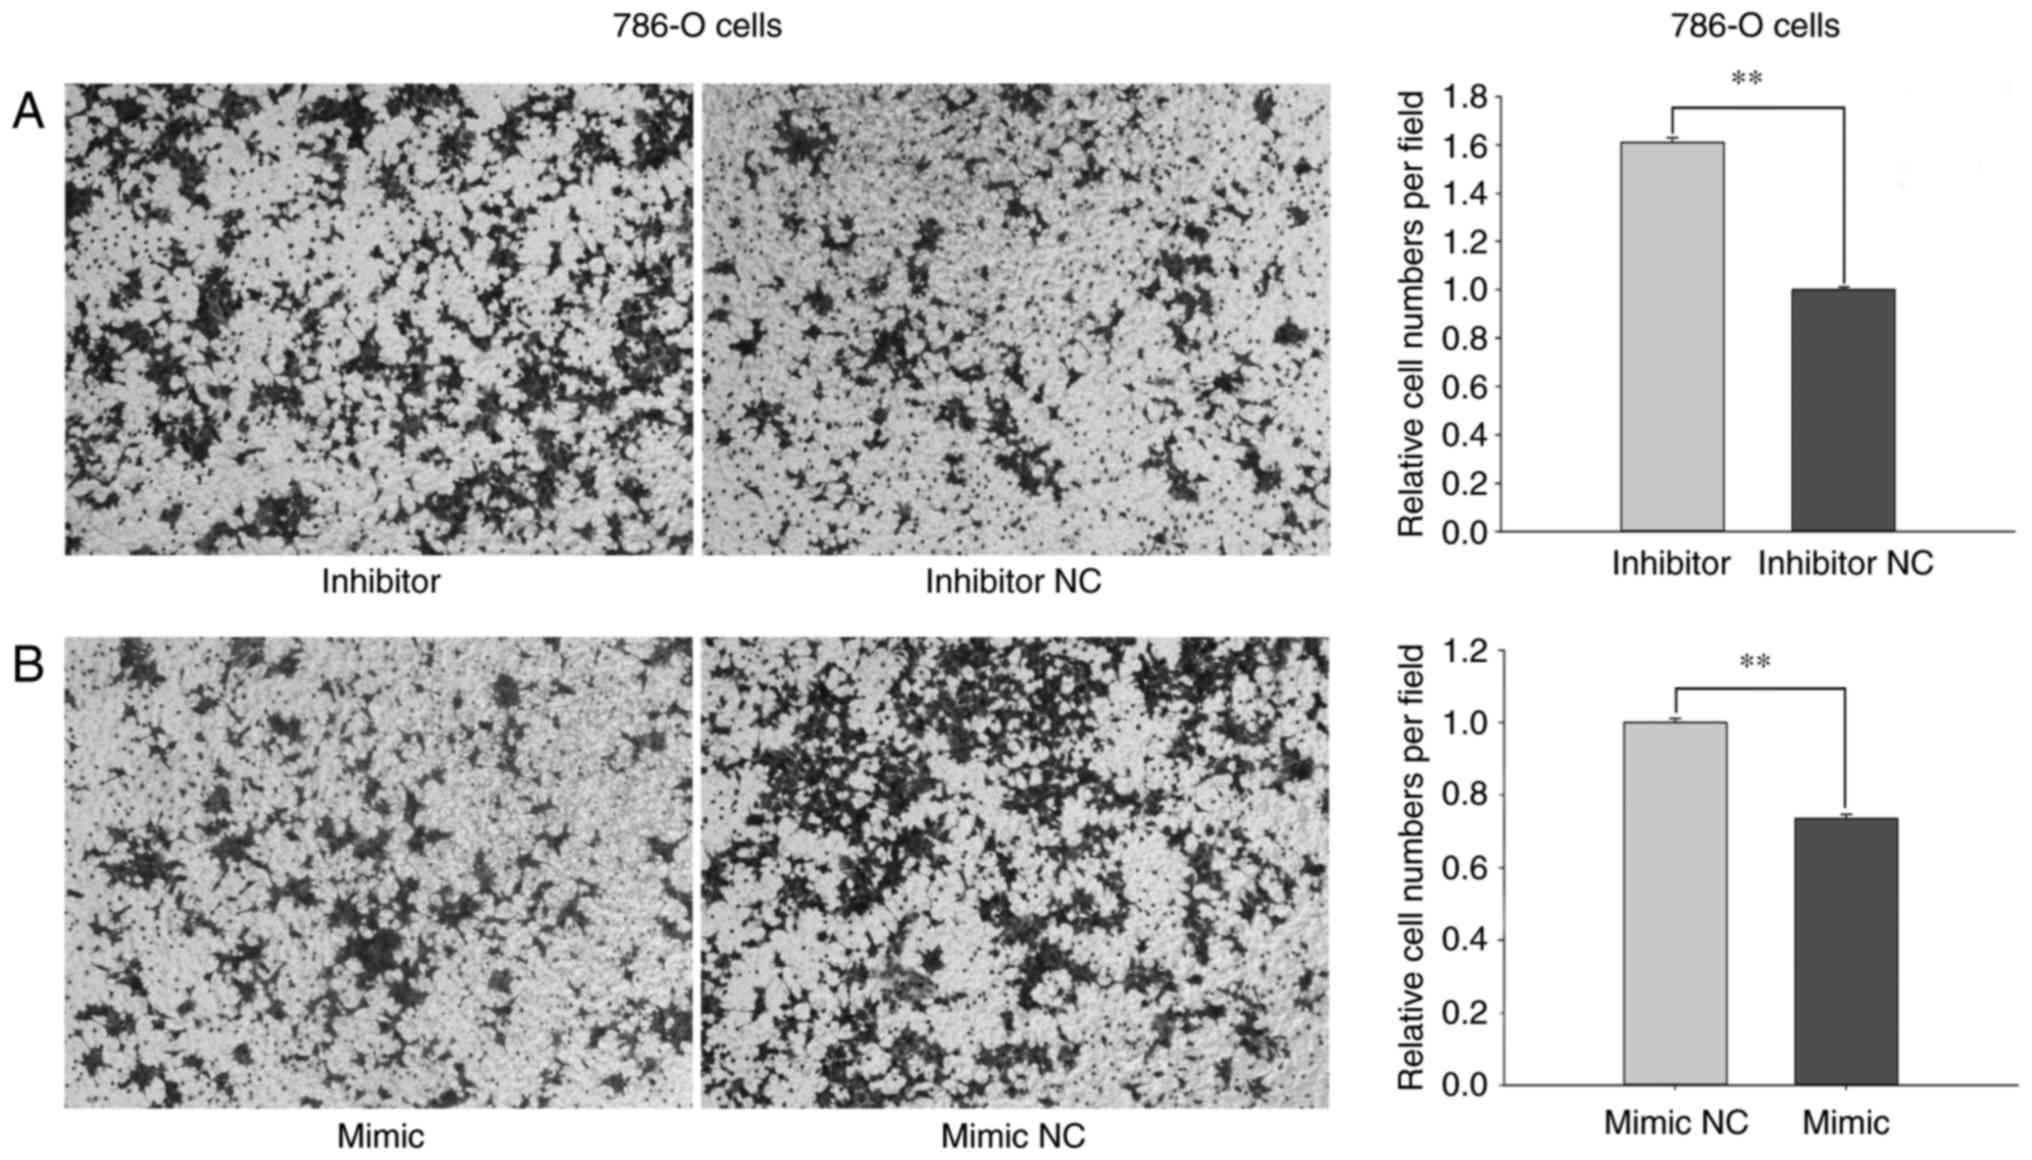
In Transwell assays, the migratory ability of 786-O
cells transfected with miR-660-5p inhibitors was increased by
29.18% (P<0.01; Fig. 4A) and
reduced by 36.71% (P<0.01; Fig.
4B) in cells transfected with miR-660-5p mimic compared with
the respective inhibitor NC- or mimic NC-treated cells. In ACHN
cells, the migratory ability of cells transfected with miR-660-5p
inhibitors was promoted by 45.99% (P<0.01; Fig. 5A) and reduced by 56.55% (P<0.01;
Fig. 5B) following transfection
with miR-660-mimic compared with cells transfected with inhibitor
NC or mimic NC.
Results from the Transwell and wound-healing assays
revealed that miR-660-5p may inhibit the migratory ability of RCC
cell.
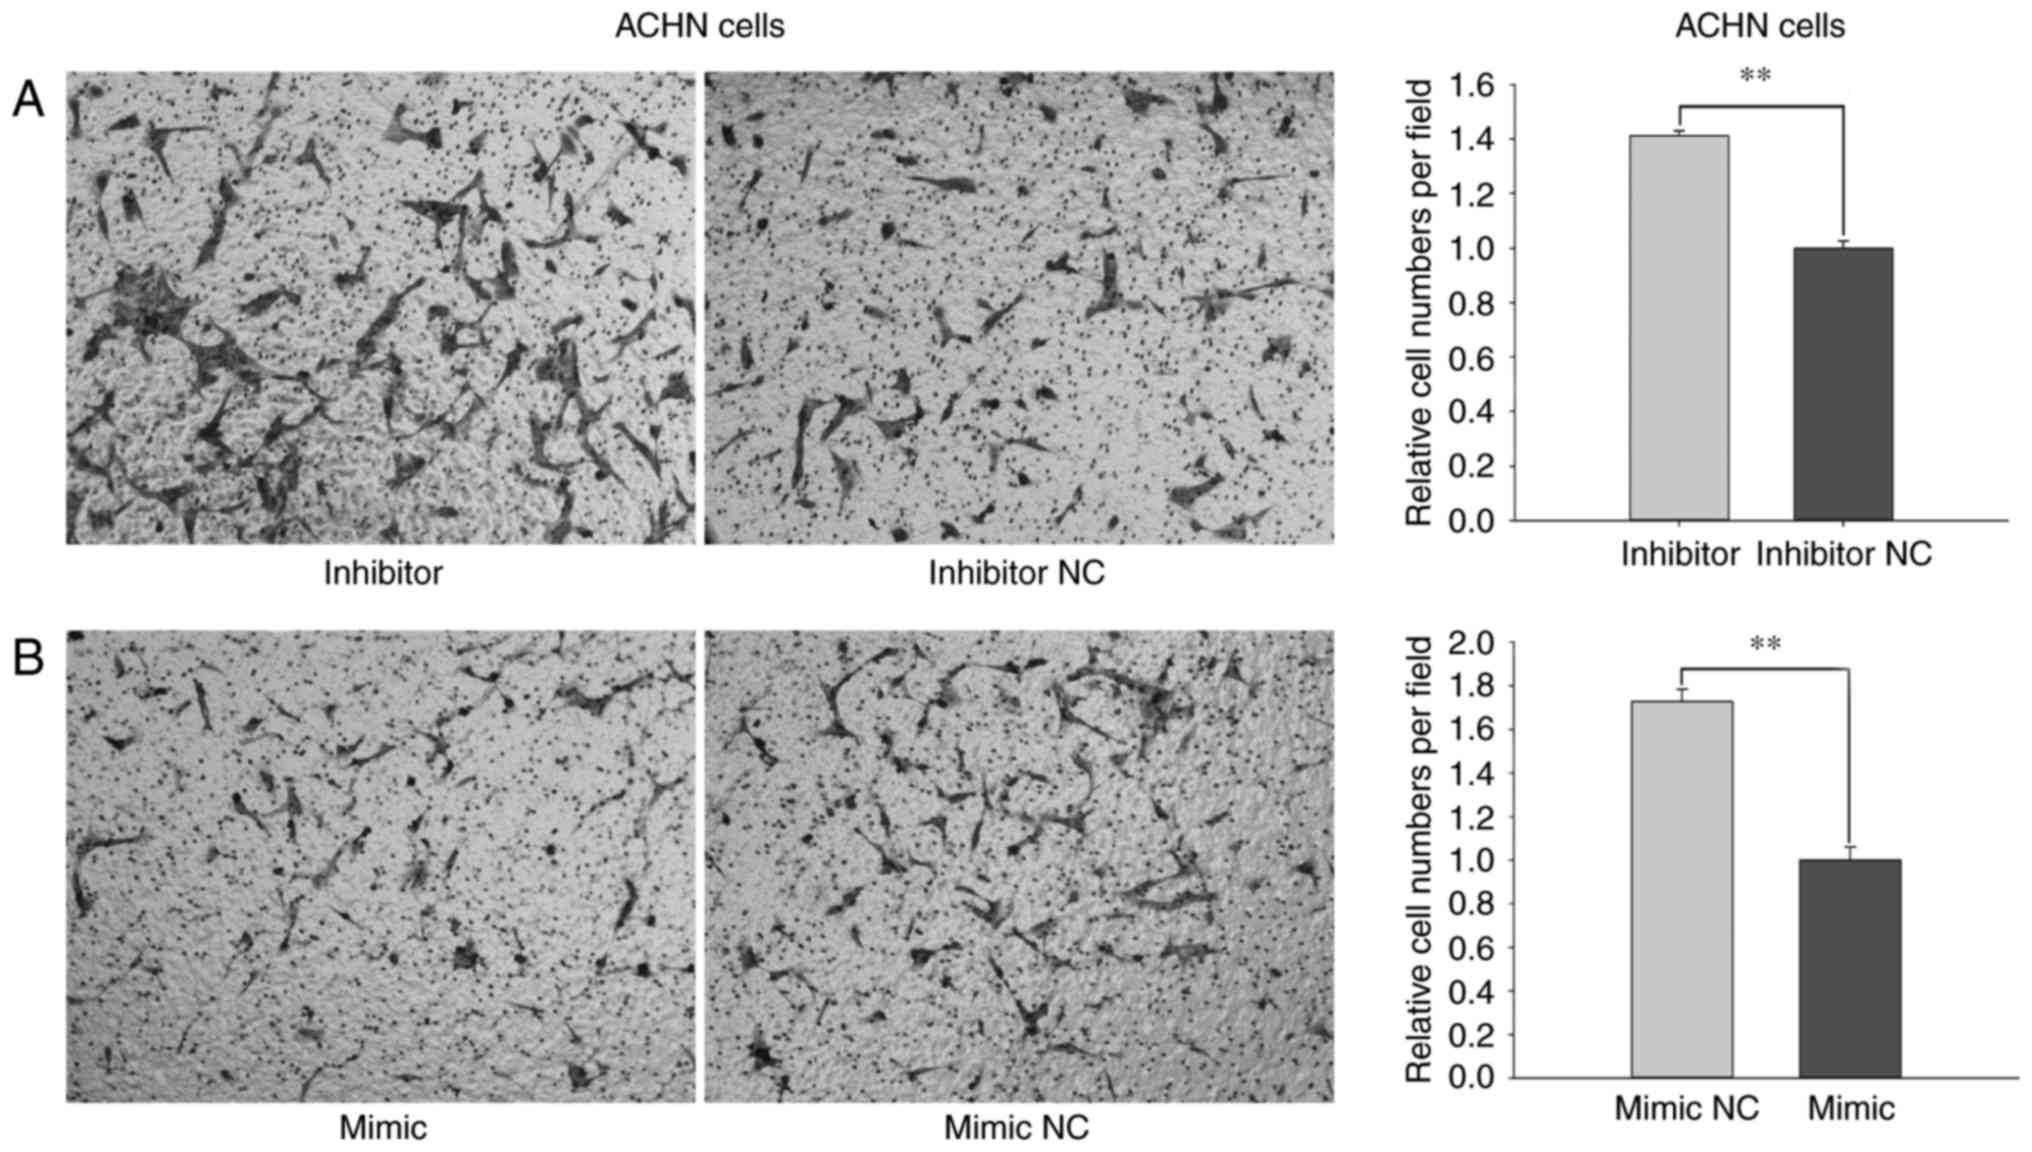
Effects of miR-660-5p mimic and
inhibitor treatment on RCC cell invasion
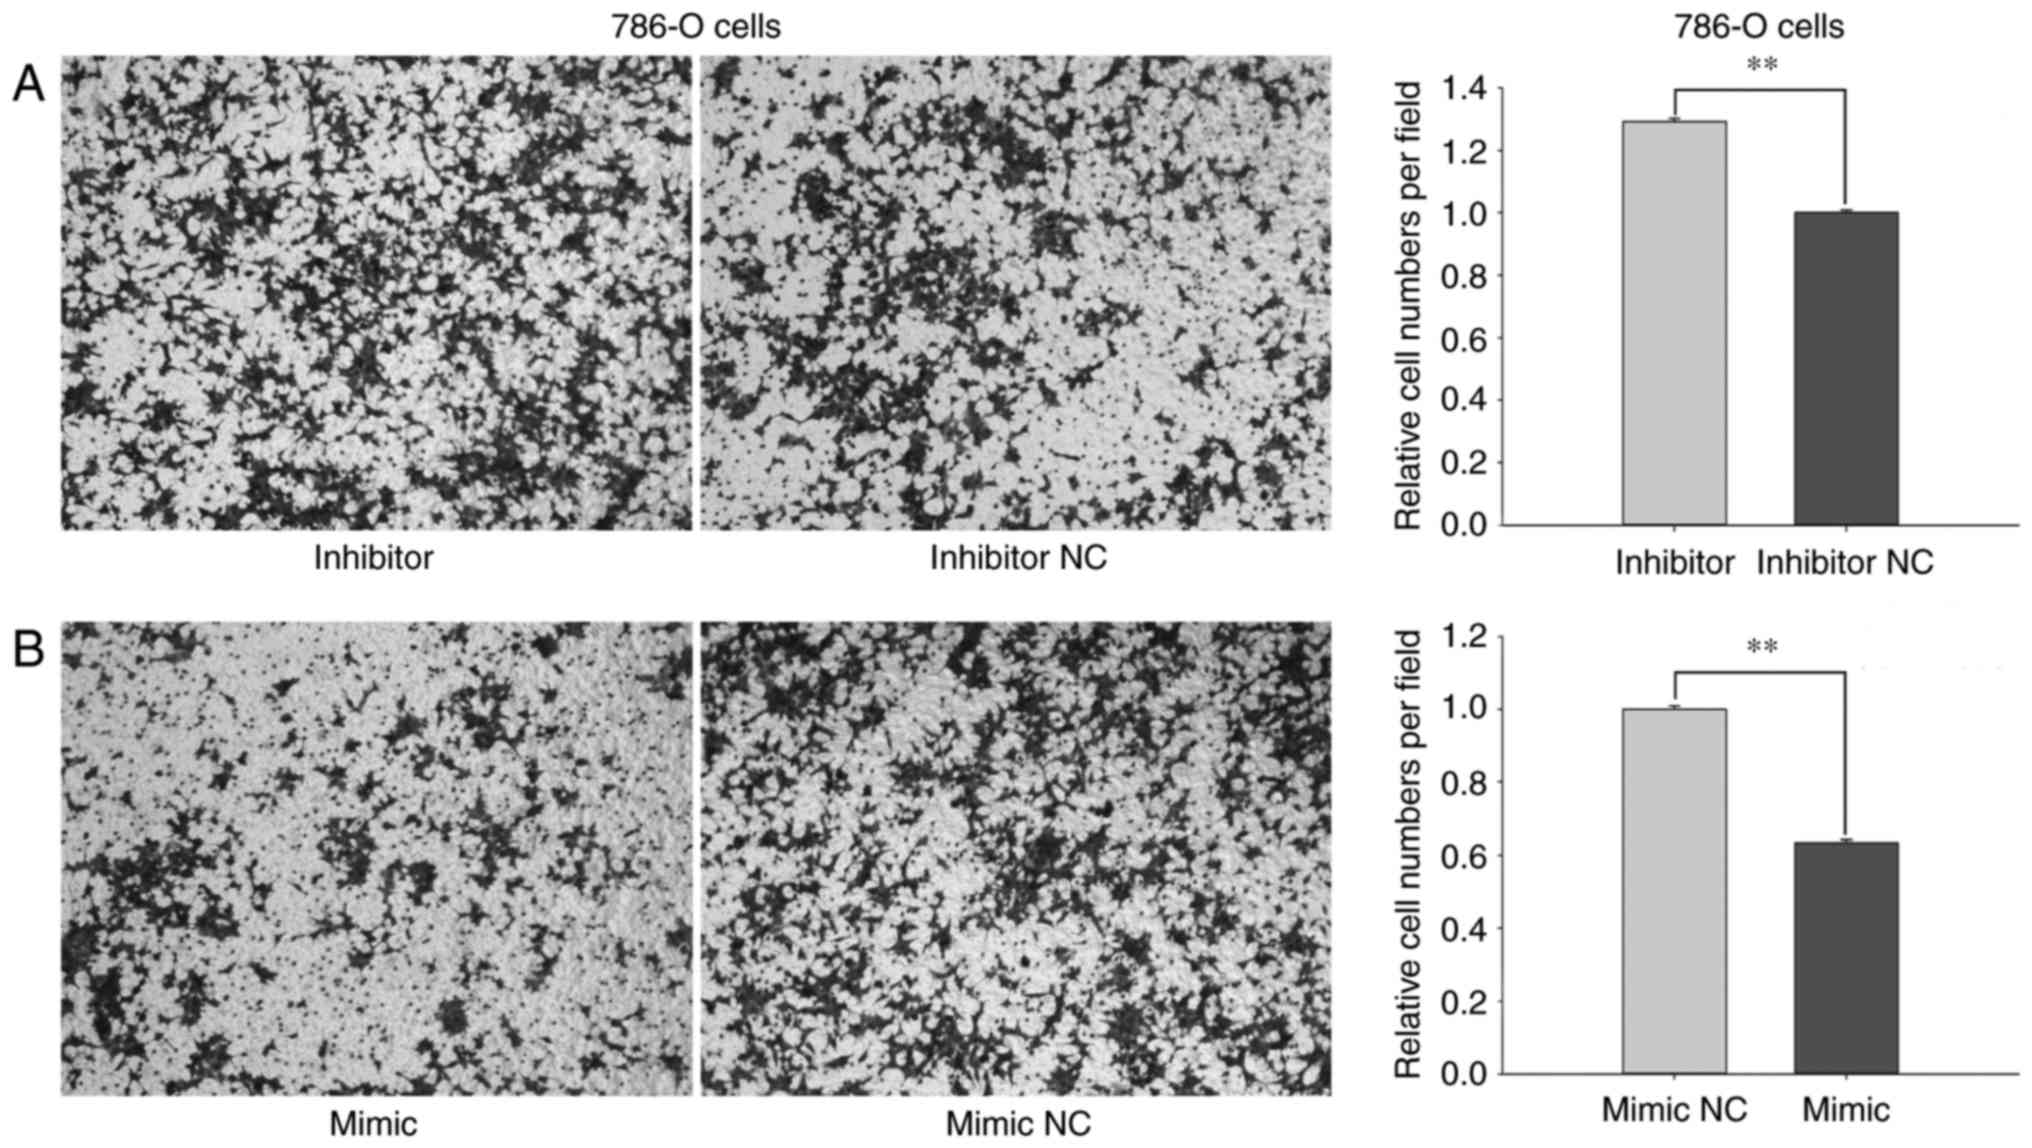
Transwell assay with Matrigel was performed to
assess the invasive ability of 786-O and ACHN cells in
vitro. For 786-O cells, the results indicated that the invasive
ability was promoted by 60.99% (P<0.01) when transfected with
miR-660-5p inhibitors for 24 h, compared with cells transfected
with inhibitor NC (Fig. 6A). By
contrast, the invasive ability of 786-O cells transfected with
miR-660-5p mimic was significantly reduced by 26.39% (P<0.01)
compared with cells transfected with mimic NC (Fig. 6B). In ACHN cells, the results
indicated that the invasive ability of cells transfected with
miR-660-5p inhibitors was increased by 31.76% (P<0.01) and
decreased by 40.09% (P<0.01) in cells transfected with
miR-660-5p mimic compared with the respective inhibitor NC- or
mimic NC-treated cells (Fig. 7A and
B, respectively). The results of the Matrigel assays
demonstrated that miR-660-5p expression may inhibit the invasive
ability of RCC cells.
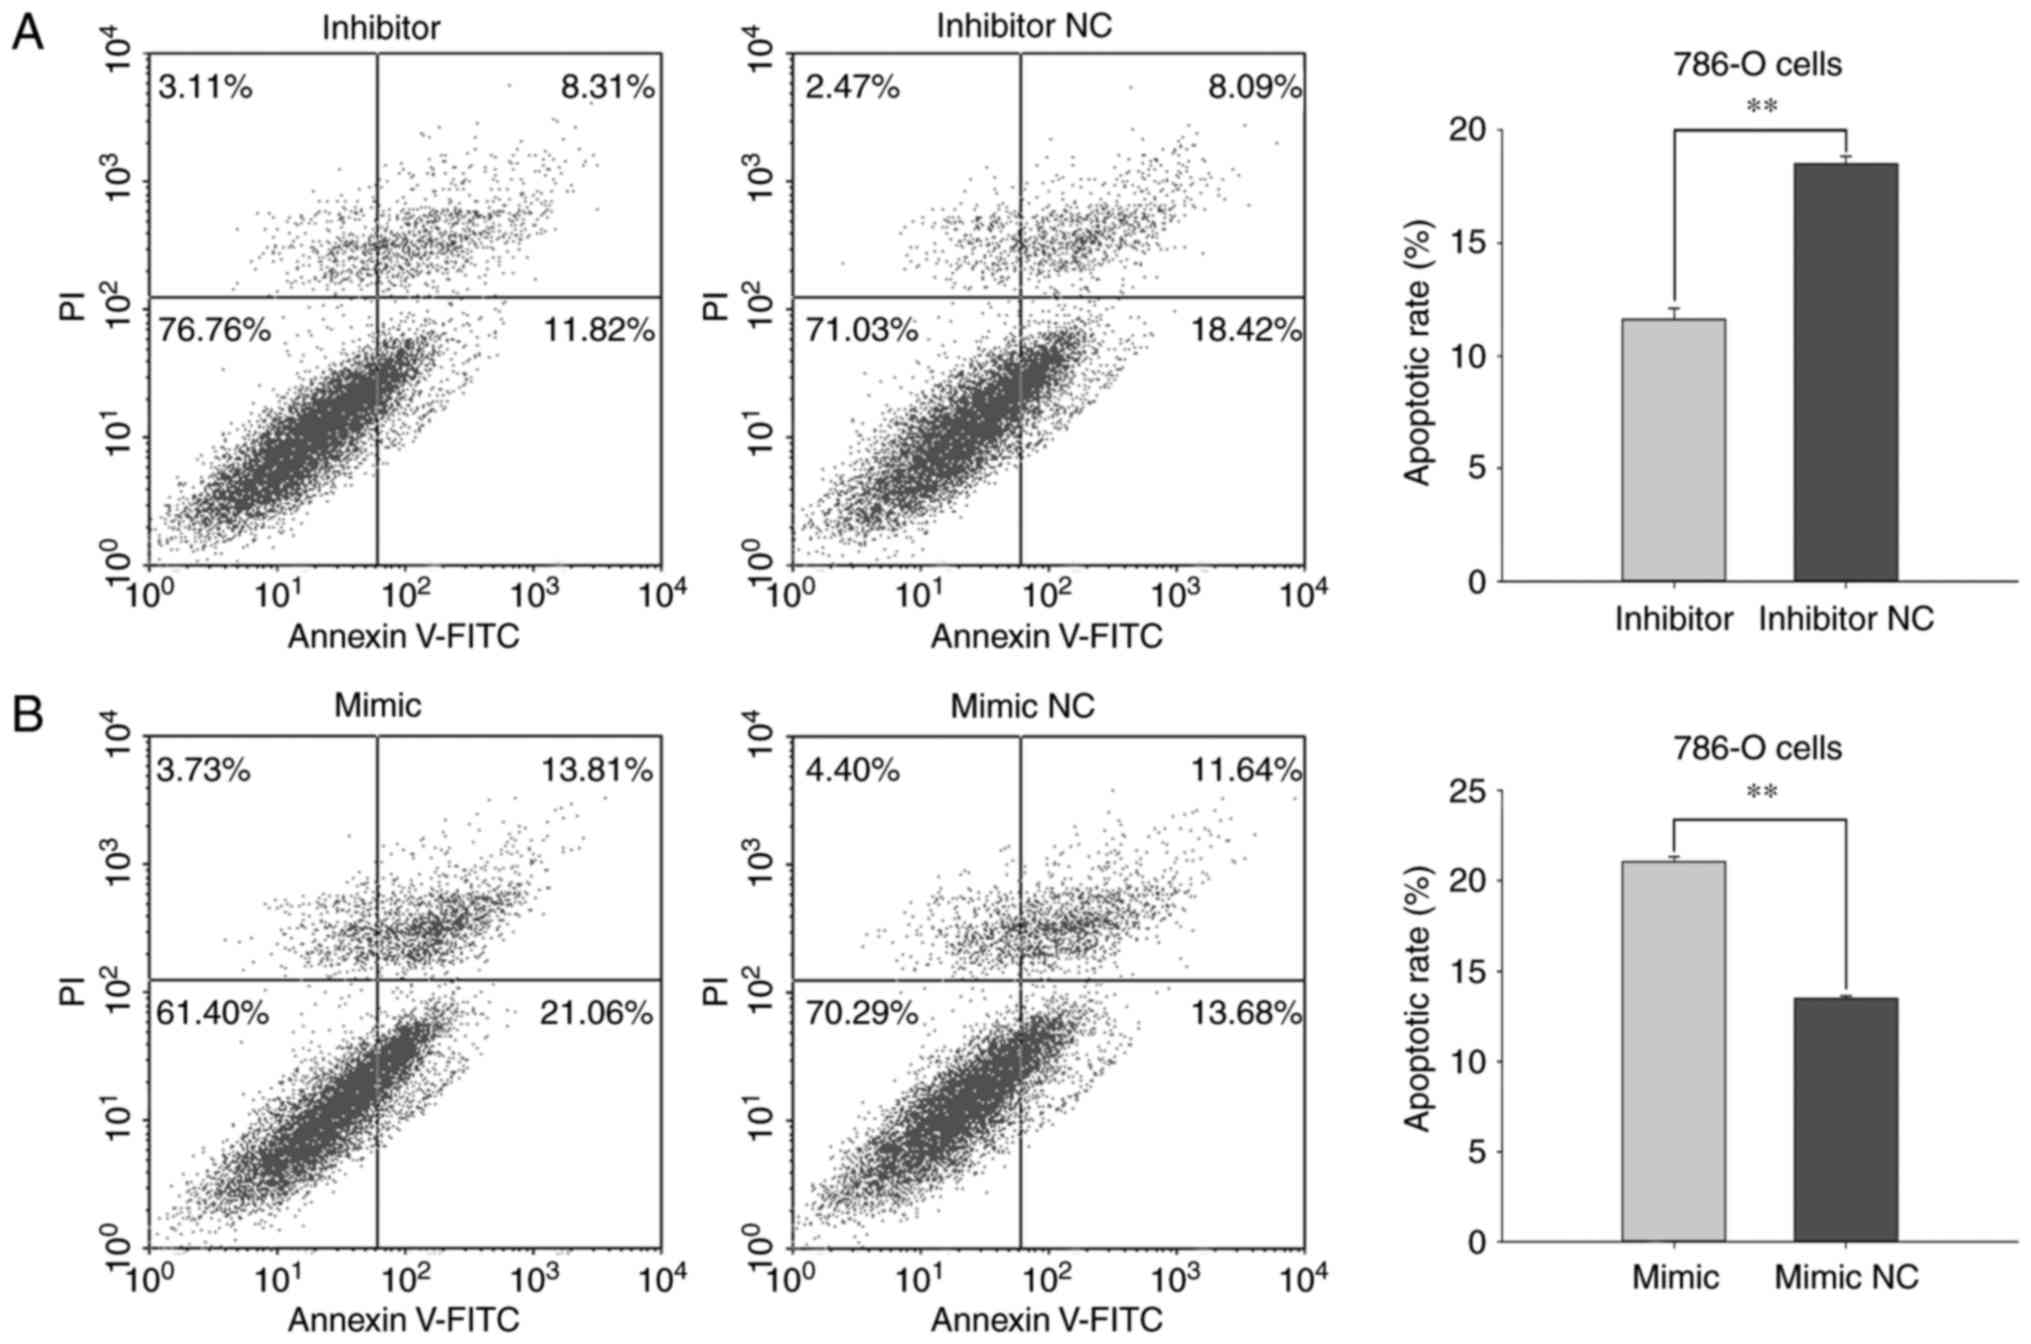
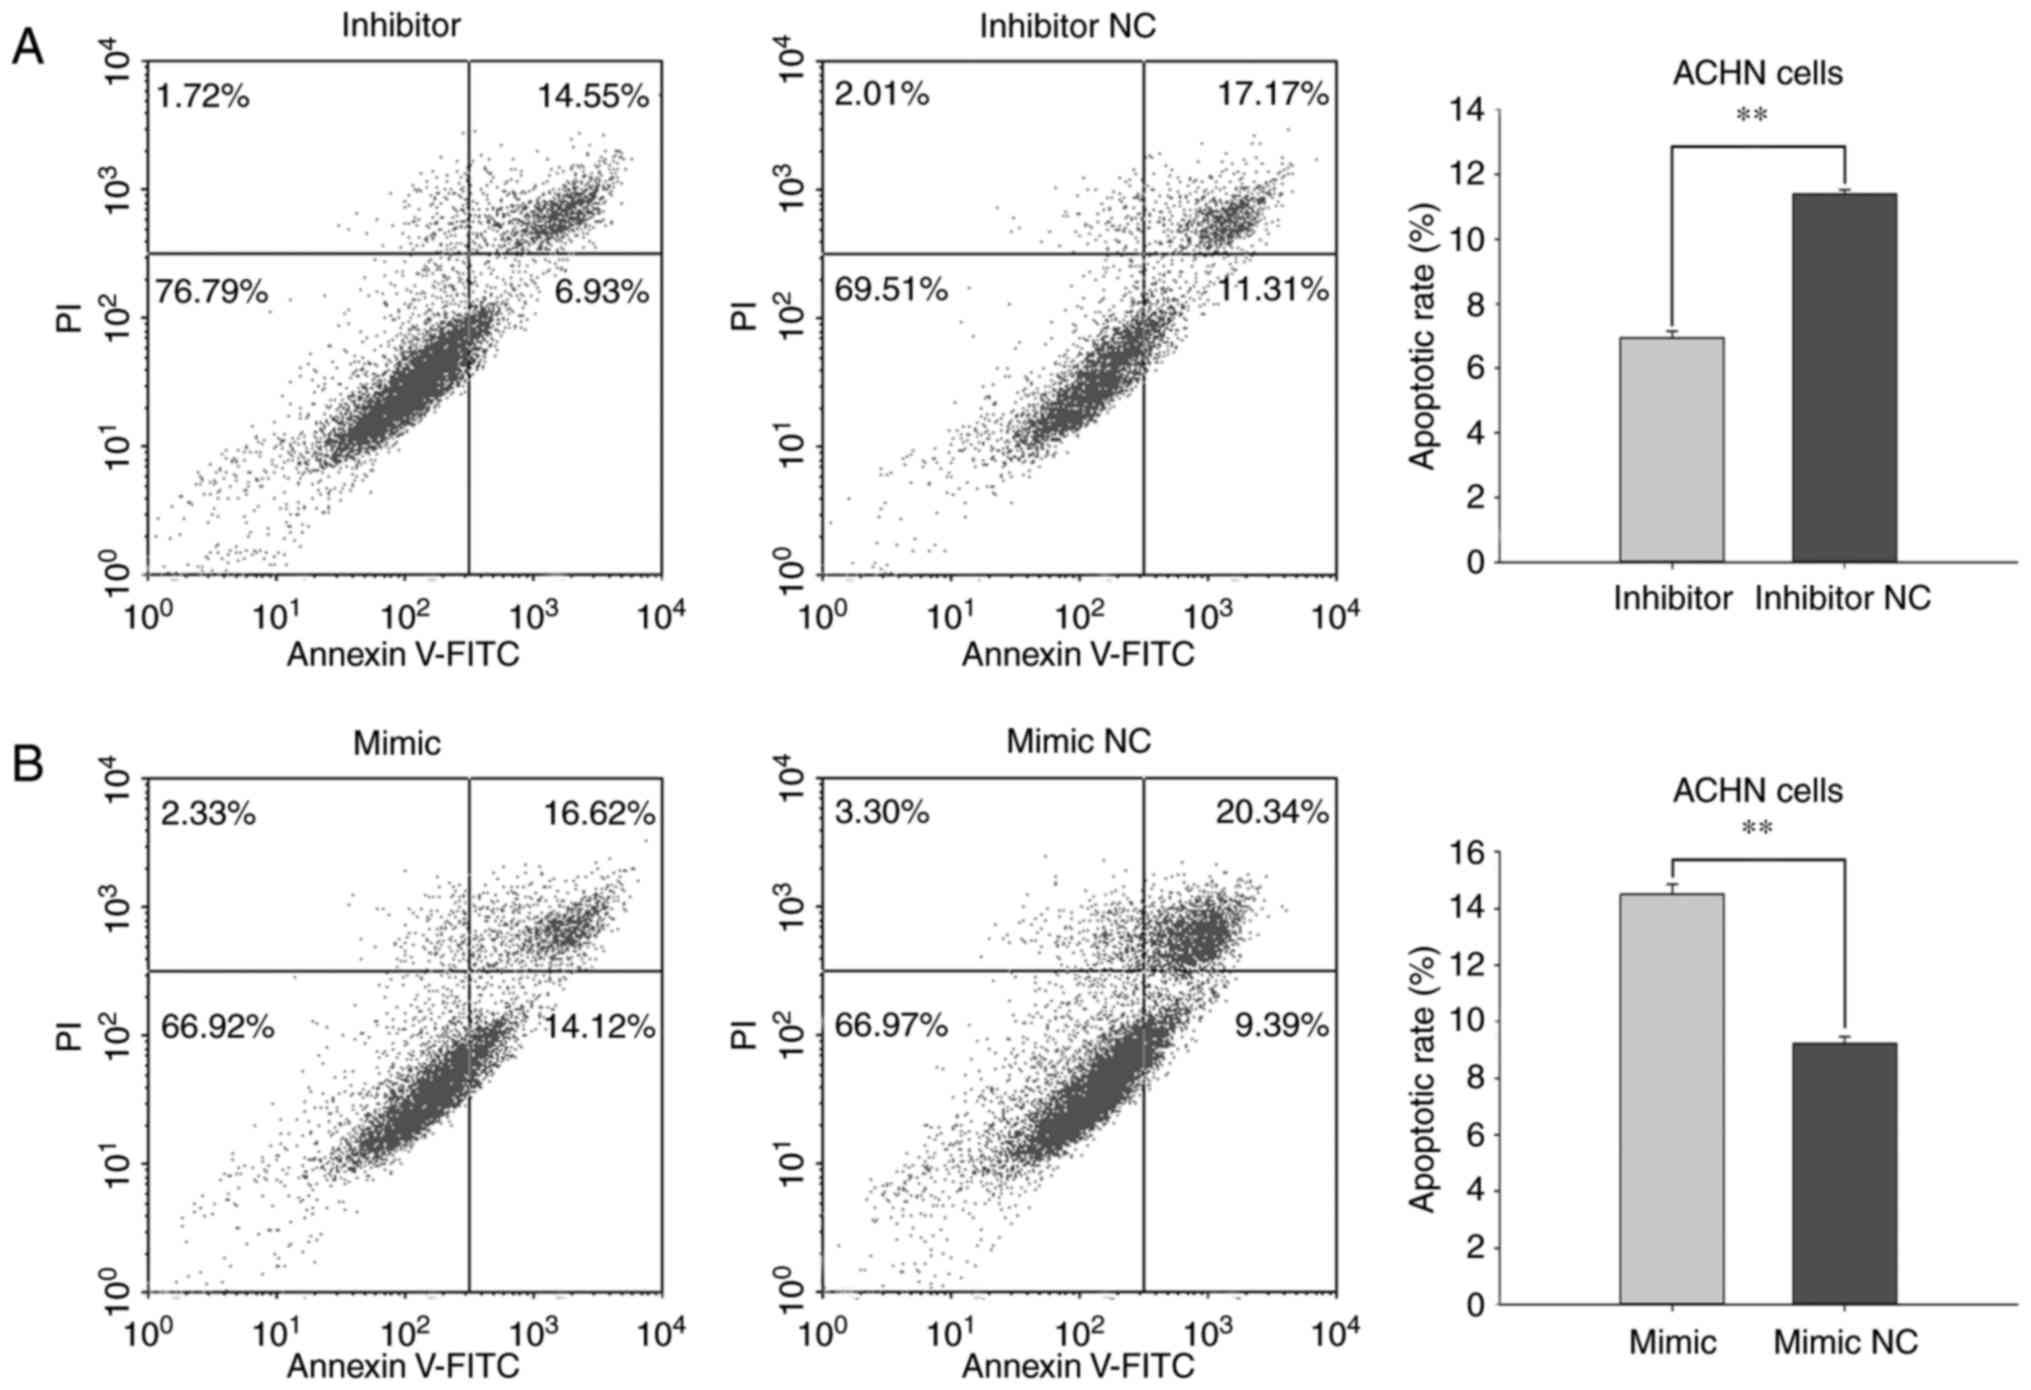
Effects of miR-660-5p on RCC cell
apoptosis
Flow cytometry was used to evaluate the early
apoptotic rates of 786-O and ACHN cells under the various
transfection treatments. The average apoptotic rates of 786-Ocells
transfected with miR-660-5p inhibitor or inhibitor NC were 11.60
and 18.50%, respectively (P<0.01; Fig. 8A). The apoptotic rates of cells
transfected with miR-660-5p mimic or mimic NC were 21.08 and
13.47%, respectively (P<0.01; Fig.
8B). In ACHN cells transfected with miR-660-5p inhibitor, the
average apoptotic rate was 6.95% and cells transfected with
inhibitor NC exhibited an apoptotic rate of 11.40% (P<0.01;
Fig. 9A). The apoptotic rates of
cells transfected with miR-660-5p mimic or mimic NC were 14.49 and
9.24%, respectively (P<0.01; Fig.
9B). These results suggested that miR-660-5p expression may
stimulate RCC cell apoptosis.
Discussion
RCC accounts for ~30% of all malignancies in adults
and has a high mortality rate (27); there are no specific characteristic
clinical features in the early stage of RCC, and ~30% of patients
with RCC exhibit metastatic symptoms at presentation (28). As advanced-stage RCC is not
sensitive to the traditional treatments, such as chemotherapy and
radiation, it is essential to explore the underlying molecular
mechanisms of RCC metastasis, and to identify a useful tumor
biomarker that may aid in the early diagnosis of RCC.
Oncogenes or tumor suppressor genes serve an
important role in the initiation and development of cancer. miRNAs
have been demonstrated to serve important roles in different types
of cancers by regulating gene expression (14). Upregulated miRNA expressions may be
considered as oncogenes, whereas downregulated miRNA expressions
may be regarded as tumor suppressors. Recent studies have
demonstrated that several miRNAs functions as either oncogenes or
tumor suppressors in the progression of RCC. For example, miR-130b,
miR-886-3p and miR-16 have been reported to be oncogenes that are
associated with cellular migration, proliferation and apoptosis in
RCC (29–31). By contrast, miR-30a-5p, miR-149-5p
and miR-125a-5p have been identified as tumor suppressors in RCC
progression (32–34). Results from the present study
indicate that miR-660-5p is a tumor suppressor in RCC.
Previous studies have revealed that miR-660-5p is
dysregulated in a number of human malignancies. For example,
miR-660 was reported to be downregulated in patients with lung
cancer, and the overexpression of miR-660-5p in lung cancer cells
transfected with miRNA mimic inhibited the migration, invasion and
proliferation properties and induced apoptosis in p53 wild-type
lung cancer cells by targeting MDM2 (18). Another study reported that
miR-660-5p is upregulated in breast cancer and that it may be a
potential novel prognostic marker for breast cancer (19); miR-660 expression was also revealed
to be downregulated in chronic lymphocytic leukemia (21). In addition, dysregulated miR-660-5p
expression was also reported in Hodgkin lymphoma (35) and multiple myeloma (20). These results suggested that
miR-660-5p may be a novel biomarker that is closely related with
tumorigenesis, which serves a role as an oncogene or tumor
suppressor. However, the expression and function of miR-660-5p in
RCC remains unclear.
Based on previous microarray chip results (22), the present study performed RT-qPCR
to quantify the relative expression levels of miR-660-5p in 25
paired RCC tissues and NATs, as well as in human RCC cell lines.
The functions of miR-660-5p on cellular migration, invasion,
proliferation and apoptosis were analyzed by performing
wound-healing assay, Transwell and Matrigel assays, MTT and CCK-8
assays and flow cytometry. The results demonstrated that miR-660-5p
expression was significantly downregulated in RCC tissues compared
with NATs. In addition, downregulation of miR-660-5p expression by
treating cells with a chemically synthesized miR-660-5p inhibitor
significantly promoted cell migration, invasion and proliferation,
and reduced apoptosis in both 786-O and ACHN cells. By contrast,
overexpression of miR-660-5p by miR-660-5p mimic transfections
inhibited 786-O and ACHN cell migration, invasion and
proliferation, and induced apoptosis. These results suggested that
miR-660-5p may act as a tumor suppressor in RCC. However, the
miR-660-5p-mediated molecular pathways that affect cell migration,
proliferation and apoptosis remains to be further explored.
miR-660-5p has also been reported to serve roles in
other diseases besides tumors. For example, miR-660-5p was revealed
to be downregulated in thyroid tissues of patients with Graves'
disease, which suggested a potential involvement of miR-660-5p in
the pathogenesis of this disease (36). Aberrant expression of miR-660-5p,
as detected by RT-qPCR, demonstrated a relationship with the
prediction or diagnosis of myocardial infarction or chronic heart
failure (37,38).
In conclusion, to the best of our knowledge, the
present study was the first to demonstrate that miR-660-5p acted as
a tumor suppressor in RCC and may regulate cell migration,
proliferation and apoptosis. Further analyses are needed to
determine the target genes of miR-660-5p and to elucidate the
molecular mechanisms in RCC, and may be used as a biomarker to aid
in the early diagnosis of RCC.
Acknowledgements
This work was supported by the National Natural
Science Foundation of China (grant no. 81101922), The Science and
Technology Development Fund Project of Shenzhen (grant nos.
JCYJ20150403091443329 and JCYJ20170307111334308), the fund of
“San-ming”project of medicine in Shenzhen and the fund of Guangdong
Key medical subject.
References
|
1
|
Siegel RL, Miller KD and Jemal A: Cancer
statistics, 2016. CA Cancer J Clin. 66:7–30. 2016. View Article : Google Scholar
|
|
2
|
Yan Y, Yang FQ, Zhang HM, Che J and Zheng
JH: Up-regulation of flotillin-2 is associated with renal cell
carcinoma progression. Tumour Biol. 35:10479–10486. 2014.
View Article : Google Scholar
|
|
3
|
Patel C, Ahmed A and Ellsworth P: Renal
cell carcinoma: A reappraisal. Urol Nurs. 32:182–191. 2012.
|
|
4
|
Siegel R, Naishadham D and Jemal A: Cancer
statistics, 2013. CA Cancer J Clin. 63:11–30. 2013. View Article : Google Scholar
|
|
5
|
Rini BI, Campbell SC and Escudier B: Renal
cell carcinoma. Lancet. 373:1119–1132. 2009. View Article : Google Scholar
|
|
6
|
Yin B, Zeng Y, Wang X, Liu G, Zhang M and
Song Y: Expression and clinical significance of cancer-testis genes
in clear cell renal cell carcinoma. Int J Clin Exp Pathol.
7:4112–4119. 2014.
|
|
7
|
Escudier B, Porta C, Schmidinger M,
Rioux-Leclercq N, Bex A, Khoo V, Gruenvald V and Horwich A: ESMO
Guidelines Committee: Renal cell carcinoma: ESMO clinical practice
guidelines for diagnosis, treatment and follow-up. Ann Oncol. 27
Suppl 5:v58–v68. 2016. View Article : Google Scholar
|
|
8
|
Rendon RA, Kapoor A, Breau R, Leveridge M,
Feifer A, Black PC and So A: Surgical management of renal cell
carcinoma: Canadian kidney cancer forum consensus. Can Urol Assoc
J. 8:E398–E412. 2014. View Article : Google Scholar :
|
|
9
|
Yim NH, Jung YP, Kim A, Kim T and Ma JY:
Induction of apoptotic cell death by betulin in multidrug-resistant
human renal carcinoma cells. Oncol Rep. 34:1058–1064. 2015.
View Article : Google Scholar
|
|
10
|
Hong MH, Kim HS, Kim C, Ahn JR, Chon HJ,
Shin SJ, Ahn JB, Chung HC and Rha SY: Treatment outcomes of
sunitinib treatment in advanced renal cell carcinoma patients: A
single cancer center experience in Korea. Cancer Res Treat.
41:67–72. 2009. View Article : Google Scholar :
|
|
11
|
Carthew RW and Sontheimer EJ: Origins and
mechanisms of miRNAs and siRNAs. Cell. 136:642–655. 2009.
View Article : Google Scholar :
|
|
12
|
Huntzinger E and Izaurralde E: Gene
silencing by microRNAs: Contributions of translational repression
and mRNA decay. Nat Rev Genet. 12:99–110. 2011. View Article : Google Scholar
|
|
13
|
Bartel DP: MicroRNAs: Target recognition
and regulatory functions. Cell. 136:215–233. 2009. View Article : Google Scholar :
|
|
14
|
Krol J, Loedige I and Filipowicz W: The
widespread regulation of microRNA biogenesis, function and decay.
Nat Rev Genet. 11:597–610. 2010.
|
|
15
|
Garzon R, Calin GA and Croce CM: MicroRNAs
in cancer. Annu Rev Med. 60:167–179. 2009. View Article : Google Scholar
|
|
16
|
Shenouda SK and Alahari SK: MicroRNA
function in cancer: Oncogene or a tumor suppressor? Cancer
Metastasis Rev. 28:369–378. 2009. View Article : Google Scholar
|
|
17
|
Guil S and Esteller M: DNA methylomes,
histone codes and miRNAs: Tying it all together. Int J Biochem Cell
Biol. 41:87–95. 2009. View Article : Google Scholar
|
|
18
|
Fortunato O, Boeri M, Moro M, Verri C,
Mensah M, Conte D, Caleca L, Roz L, Pastorino U and Sozzi G:
Mir-660 is downregulated in lung cancer patients and its
replacement inhibits lung tumorigenesis by targeting MDM2-p53
interaction. Cell Death Dis. 5:e15642014. View Article : Google Scholar :
|
|
19
|
Krishnan P, Ghosh S, Wang B, Li D,
Narasimhan A, Berendt R, Graham K, Mackey JR, Kovalchuk O and
Damaraju S: Next generation sequencing profiling identifies
miR-574-3p and miR-660-5p as potential novel prognostic markers for
breast cancer. BMC Genomics. 16:7352015. View Article : Google Scholar :
|
|
20
|
Navarro A, Diaz T, Tovar N, Pedrosa F,
Tejero R, Cibeira MT, Magnano L, Rosiñol L, Monzó M, Bladé J and de
Larrea Fernández C: A serum microRNA signature associated with
complete remission and progression after autologous stem-cell
transplantation in patients with multiple myeloma. Oncotarget.
6:1874–1883. 2015. View Article : Google Scholar :
|
|
21
|
Ferrer G, Navarro A, Hodgson K, Aymerich
M, Pereira A, Baumann T, Monzo M, Moreno C and Montserrat E:
MicroRNA expression in chronic lymphocytic leukemia developing
autoimmune hemolytic anemia. Leuk Lymphoma. 54:2016–2022. 2013.
View Article : Google Scholar
|
|
22
|
Tang K and Xu H: Prognostic value of
meta-signature miRNAs in renal cell carcinoma: An integrated miRNA
expression profiling analysis. Sci Rep. 5:102722015. View Article : Google Scholar :
|
|
23
|
Ge YZ, Wu R, Xin H, Zhu M, Lu TZ, Liu H,
Xu Z, Yu P, Zhao YC, Li MH, et al: A tumor-specific microRNA
signature predicts survival in clear cell renal cell carcinoma. J
Cancer Res Clin Oncol. 141:1291–1299. 2015. View Article : Google Scholar
|
|
24
|
Martinez-Salamanca JI, Huang WC, Millán I,
Bertini R, Bianco FJ, Carballido JA, Ciancio G, Hernández C,
Herranz F, Haferkamp A, et al: Prognostic impact of the 2009
UICC/AJCC TNM staging system for renal cell carcinoma with venous
extension. Eur Urol. 59:120–127. 2011. View Article : Google Scholar
|
|
25
|
Su Z, Chen D, Zhang E, Li Y, Yu Z, Shi M,
Jiang Z, Ni L, Yang S, Gui Y, et al: MicroRNA-509-3p inhibits
cancer cell proliferation and migration by targeting the
mitogen-activated protein kinase kinase kinase 8 oncogene in renal
cell carcinoma. Mol Med Rep. 12:1535–1543. 2015.
|
|
26
|
Livak KJ and Schmittgen TD: Analysis of
relative gene expression data using real-time quantitative PCR and
the 2(-Delta Delta C(T)) method. Methods. 25:402–408. 2001.
View Article : Google Scholar
|
|
27
|
Murai M and Oya M: Renal cell carcinoma:
Etiology, incidence and epidemiology. Curr Opin Urol. 14:229–233.
2004. View Article : Google Scholar
|
|
28
|
Rasmussen F: Metastatic renal cell cancer.
Cancer Imaging. 13:374–380. 2013. View Article : Google Scholar :
|
|
29
|
Li Y, Chen D, Li Y, Jin L, Liu J, Su Z, Qi
Z, Shi M, Jiang Z, Gui Y, et al: Identification of miR-130b as an
oncogene in renal cell carcinoma. Mol Med Rep. 13:1902–1908. 2016.
View Article : Google Scholar
|
|
30
|
Yu Z, Chen D, Su Z, Li Y, Yu W, Zhang Q,
Yang L, Li C, Yang S, Ni L, et al: miR-886-3p upregulation in clear
cell renal cell carcinoma regulates cell migration, proliferation
and apoptosis by targeting PITX1. Int J Mol Med. 34:1409–1416.
2014.
|
|
31
|
Chen D, Li Y, Yu Z, Su ZYW, Li Y, Yang S,
Gui Y, Ni L and Lai Y: Upregulated microRNA-16 as an oncogene in
renal cell carcinoma. Mol Med Rep. 12:1399–1404. 2015. View Article : Google Scholar
|
|
32
|
Li Y, Li Y, Chen D, Jin L, Su Z, Liu J,
Duan H, Li X, Qi Z, Shi M, et al: miR-30a-5p in the tumorigenesis
of renal cell carcinoma: A tumor suppressive microRNA. Mol Med Rep.
13:4085–4094. 2016. View Article : Google Scholar
|
|
33
|
Jin L, Li Y, Liu J, Yang S, Gui Y, Mao X,
Nie G and Lai Y: Tumor suppressor miR-149-5p is associated with
cellular migration, proliferation and apoptosis in renal cell
carcinoma. Mol Med Rep. 13:5386–5392. 2016. View Article : Google Scholar
|
|
34
|
Chen D, Li Y, Su Z, Yu Z, Yu W, Li Y, Gui
Y, Yang S and Lai Y: Identification of miR-125a-5p as a tumor
suppressor of renal cell carcinoma, regulating cellular
proliferation, migration and apoptosis. Mol Med Rep. 11:1278–1283.
2015. View Article : Google Scholar
|
|
35
|
Paydas S, Acikalin A, Ergin M, Celik H,
Yavuz B and Tanriverdi K: Micro-RNA (miRNA) profile in Hodgkin
lymphoma: Association between clinical and pathological variables.
Med Oncol. 33:342016. View Article : Google Scholar
|
|
36
|
Qin Q, Wang X, Yan N, Song RH, Cai TT,
Zhang W, Guan LJ, Muhali FS and Zhang JA: Aberrant expression of
miRNA and mRNAs in lesioned tissues of Graves' disease. Cell
Physiol Biochem. 35:1934–1942. 2015. View Article : Google Scholar
|
|
37
|
Bye A, Røsjø H, Nauman J, Silva GJ,
Follestad T, Omland T and Wisløff U: Circulating microRNAs predict
future fatal myocardial infarction in healthy individuals-The HUNT
study. J Mol Cell Cardiol. 97:162–168. 2016. View Article : Google Scholar
|
|
38
|
Li H, Fan J, Yin Z, Wang F, Chen C and
Wang DW: Identification of cardiac-related circulating microRNA
profile in human chronic heart failure. Oncotarget. 7:33–45. 2016.
View Article : Google Scholar
|