Introduction
The prevalence of transgenic animals, including
medical experimental animals and agricultural domestic animals, has
increased following the development of transgenic crops (1). Transgenic technology is able to
quickly introduce advantageous traits in distantly-related species,
which may not be accomplished via traditional cross-breeding
(2). In agricultural research,
transgenic technology is developing rapidly, although there is a
bottleneck in the extension of transgene husbandry (1). The exploitation of
economically-important traits in addition to meat production, milk
production and other directly food-associated traits has become a
focus for reforming the association between genetically modified
organisms and livestock production (3). Notably, medical research requires the
establishment of a large number of animal models of human
disease-associated pathologies (3). In previous years, researchers have
used pioneering transgenic editing technologies to prepare animal
models, including mice and rats, to transform and humanize their
genetic features (3–9). However, pigs are genetically closer
to humans compared with rodents, particularly in terms of anatomy,
physiology, pathology and metabolic dynamics (10). Therefore, swine have great
potential economic value in fundamental medical research. Although
rodents cannot be adapted to perform tests directly, such as human
heterogeneous organ transplantation, and drug development findings
in rodents may be invalid, mouse model research is important for
animal husbandry and medical assessment.
Over the past decade, transgenic livestock have been
used to investigate human disease, employing models including
Alzheimer's disease-associated amyloid precursor protein (APP)
K670Nt/M671L transgenic pig models (3), polycystic kidney disease polycystin-2
transgenic miniature pig models (11) and autosomal dominant polycystic
kidney disease Myc proto-oncogene transgenic pig models (12). Regarding the delivery of a
transgene, or the application of genome editors to modify
endogenous genes, these models may be used to efficiently model a
subset of desired traits, particularly when considering monogenic
human diseases. However, it is difficult to produce desired traits
by altering the expression of a single specific gene, particularly
when considering polygenic diseases, including Alzheimer's disease,
Cushing's syndrome and type II diabetes. Therefore,
multi-transgenic animal models are required. Previous studies have
demonstrated that in a polycistronic system (single vector mounting
polygenes), a vector with multiple genes connected by 2A peptides
(13) may be more effective and
efficient for the random integration of polygenes into the animal
genome (14). It is important to
characterize multi-transgenic animal integration. Fortunately,
exogenous gene copy numbers are one of the important factors
affecting the level of expression and genetic stability (15,16).
The transgene copy number indicates the number of genomic transgene
copies (17). In a
multi-transgenic organism, prior to breeding, it is important to
determine the levels of integration and their associations in terms
of whether the different copies of integrated genes are consistent
(18). An accurate measurement of
exogenous gene copy number is important for establishing a
transgenic animal model, in addition to being a prerequisite for
follow-up phenotype and gene function analyses (19).
The single standard curve-absolute method [with
internal reference (representative of the genomic copy number)] is
an efficient method for the detection of transgene copy numbers
(7,20). Fluorescent quantitative polymerase
chain reaction (qPCR) analysis is used to draw a
logaN-ΔCq absolute quantification standard curve (N
indicates the copy number; ΔCq represents the difference in the
fluorescence threshold between the exogenous gene and the reference
gene; and ΔCq=Cqtransgene-Cqinternal)
(21). Therefore, copy number is
primarily calculated according to the ΔCq of the sample.
The present study investigated the integrated copy
number variations in two multi-transgenic mouse models (K3 and L3)
and two multi-transgenic miniature pig models [Z2 (6) and Z3 (5)]. K3 is an 11β-hydroxysteroid
dehydrogenase-1 (11β-HSD1)-C/EBP homologous protein (CHOP)-human
islet amyloid polypeptide (hIAPP) multi-transgenic mouse; L3 is an
11β-HSD1-dominant-negative gastric inhibitory polypeptide receptor
(GIPRdn)-hIAPP multi-transgenic mouse; Z2 is a
GIPRdn−hIAPP transgenic miniature pig; and Z3 is an
11β-HSD1-CHOP-hIAPP transgenic miniature pig. All four animals were
subjected to random insertion. The exogenous genes are important
for adipogenesis (11β-HSD1) (9,22),
insulinogenesis (GIPRdn) (23,24)
and cellular apoptosis [hIAPP (25), and CHOP (26)]. Previous studies have sought to use
the coexpression of these genes to generate transgenic miniature
pig models simulating human obesity or diabetes (5,6). The
copy number of each gene in these multi-transgenic animals may
provide valuable information to help construct more consistent
genetic backgrounds of multi-transgenic pedigrees. Whether the
features of these organisms are similar will be assessed based on
the results of the present study.
Materials and methods
Multi-transgenic animals and insertion
vectors
The multi-transgenic animals included two male and
female multi-transgenic mice (K3 and L3; age, 7–8 weeks; weight,
18–22 g) and two male and female multi-transgenic miniature pigs
(Z2 and Z3), which were supplied by the laboratory (Key Laboratory
of Farm Animal Genetic Resource and Germplasm Innovation of the
Ministry of Agriculture, Beijing, China) (27). Mice were housed at a temperature of
20–22°C and relative humidity of 30–70%, under 12-h light/dark
cycles with free access to food and water. Pigs were housed at a
temperature of 15–25°C, relative humidity of 30–70%, under 12-h
light/dark cycles with free access to food and water. The animals
received humane care, and the present study was performed in strict
accordance with the recommendations outlined in the Guide for the
Care and Use of Laboratory Animals (Institute of Animal Sciences,
Chinese Academy of Agricultural Sciences, Beijing, China). All
procedures involving animals were approved by the Animal Care and
Use Committee of the Germplasm Resource Center for Chinese
Experimental Miniature Pigs (permit no. ACGRCM 2013-035). All
efforts were made to minimize suffering. The ear pieces of piglets
were collected after birth with rapid operation.
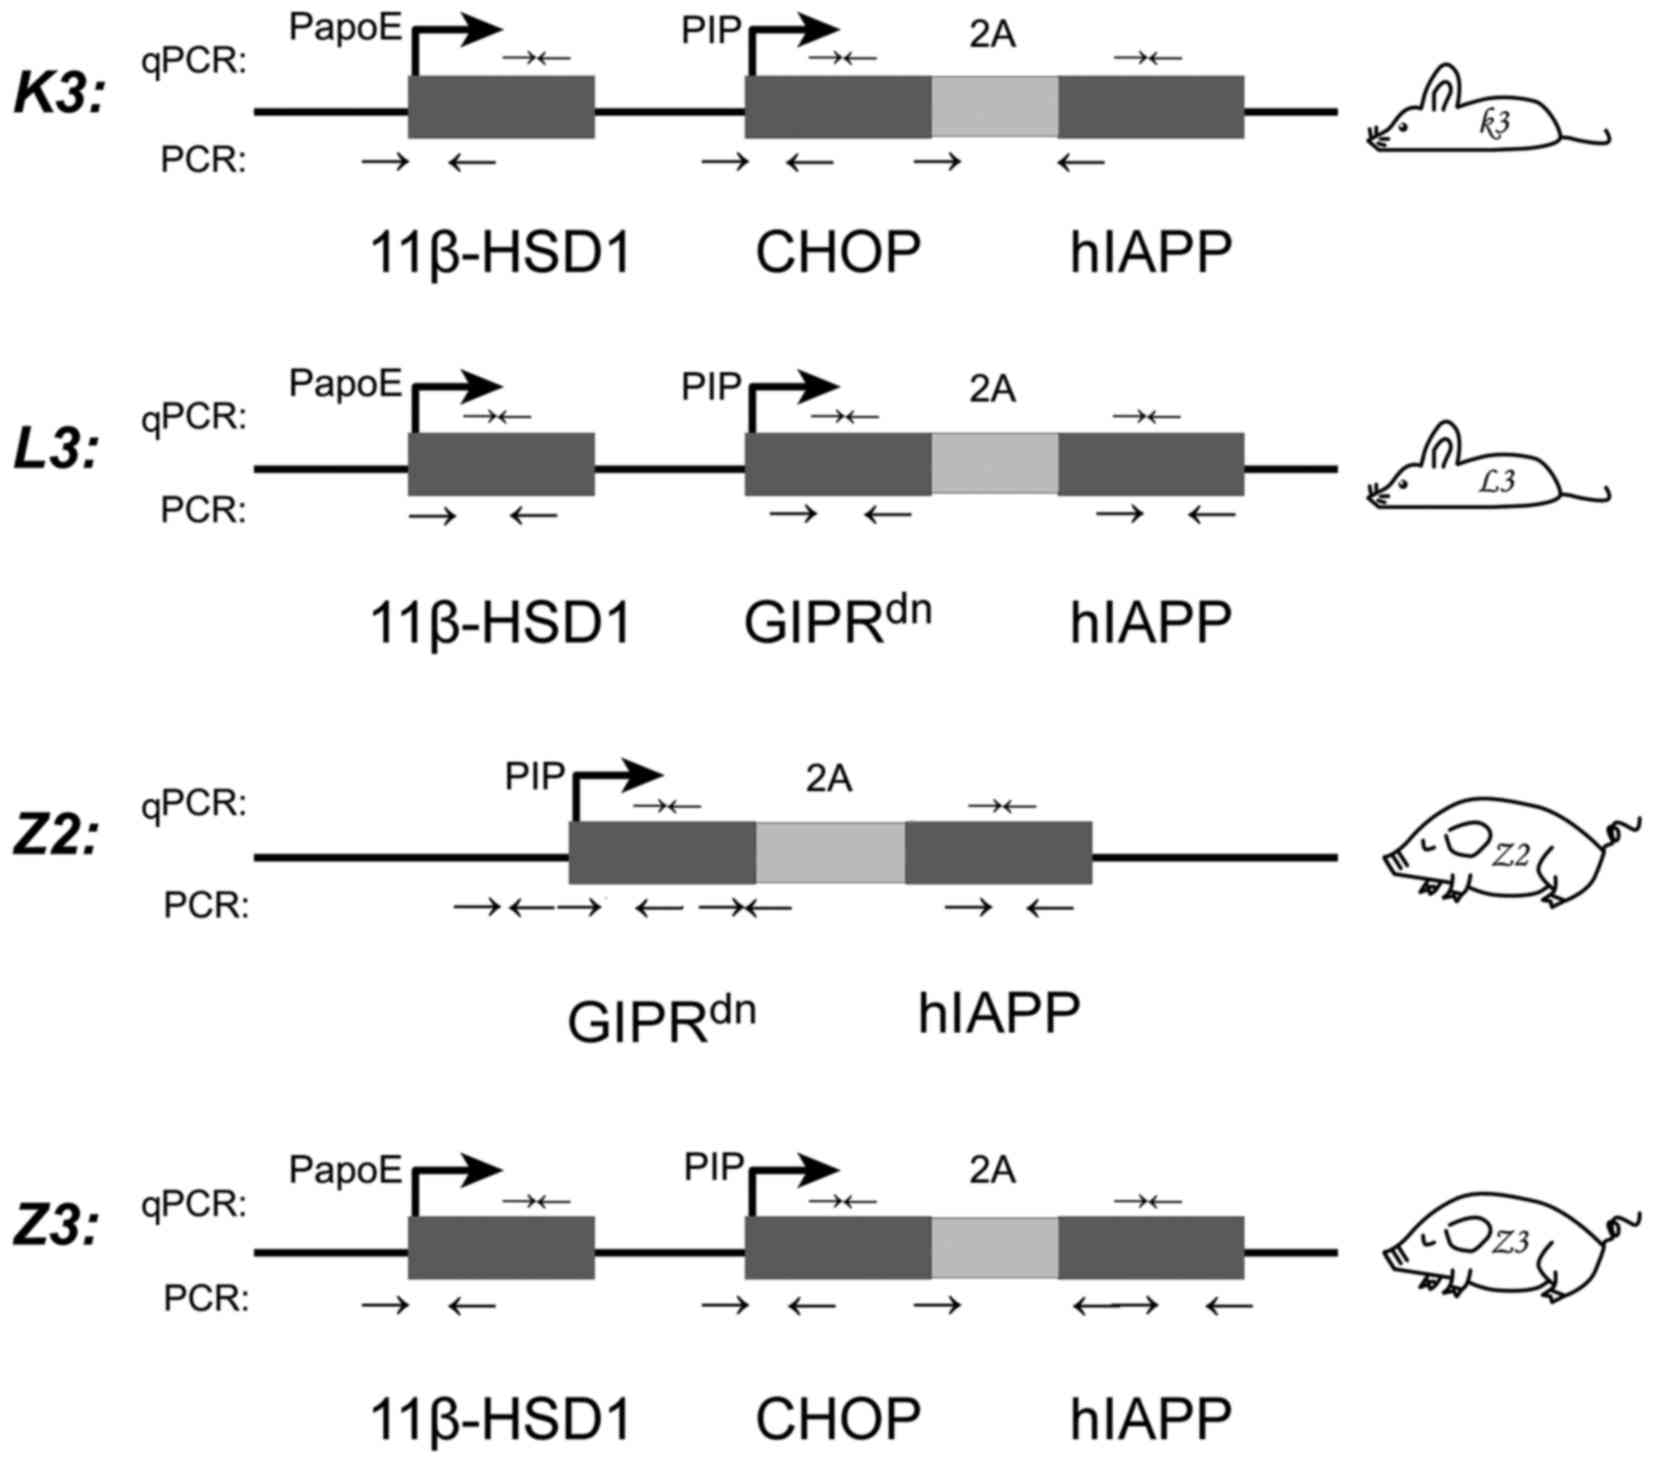
The insertion in K3 was mediated by the
pcDNA3.1–11β-HSD1-CHOP-2A-hIAPP vector, in which 11β-HSD1 was
driven by the liver-specific promoter porcine apolipoprotein E
promoter, and CHOP and hIAPP were linked to the 2A peptide and
driven by the pancreas-specific promoter porcine insulin promoter
(PIP) (5); the insertion in L3 was
mediated by the pcDNA3.1–11β-HSD1-GIPRdn−2A-hIAPP
vector, which was the same as the vector for K3, except that
GIPRdn replaced CHOP; the insertion in Z2 was mediated
by the pGL3-GIPRdn−2A-hIAPP vector, in which
GIPRdn and hIAPP, linked to 2A, were driven by PIP
(6); and the insertion in Z3 was
mediated by the pcDNA3.1–11β- HSD1-CHOP-2A-hIAPP vector, as in K3
(Fig. 1) (5). The four multi-transgenic mice and
miniature pig vectors are presented in Fig. 1, all of which are single-molecule
polycistronic systems. These transgenic animals are models of human
diabetes. K3 and L3 mice were generated via zygote microinjection
(2). Oosperm was used for
microinjection (vectors were directly injected into the
pronucleus), which are able to produce a transgenic pure line. Z2
and Z3 miniature pigs were produced through somatic cell nuclear
transfer (SCNT) (17). The mouse
strain was C57BL/6J, and the miniature pig strain was Wuzhishan
(28).
Re-identification of multi-transgenic
animals
An efficient high-salt method was adopted to isolate
genomic DNA. A total of 300 µl saturated NaCl solution was added to
a completely lyzed 1.5-ml tissue sample (K3 and L3 mouse tail
pieces; Z2 and Z3 pig ear pieces) using tissue lysis buffer
(BioTeke Corporation, Beijing, China) with proteinase K (Thermo
Fisher Scientific, Inc., Waltham, MA, USA) and incubated overnight,
followed by centrifugation at 12,400 × g, for 25–30 min at 4°C. The
supernatant was transferred to a new centrifuge tube and 700 µl
isopropanol was added, followed by mixing to form the flocculent
DNA precipitate. The DNA concentrations were determined using an
automatic UV spectrophotometer (Promega Corporation, Madison, WI,
USA). The DNA quality was verified by 1% agarose gel
electrophoresis. The gel was stained with 5X Gel Red (Generay
Biotech Co., Ltd., Shanghai, China) and visualized using Gel Doc
XR+ Gel Documentation system (Bio-Rad Laboratories, Inc., Hercules,
CA, USA). Pairs of primers were designed using Primer Premier 5.0
(Premier Biosoft International, Palo Alto, CA, USA) for transgene
fragments (Table I). The primers
for K3 and Z3 were described in a previous study (5). Primer specificities were determined
using Primer-BLAST (www.ncbi.nlm.nih.gov/tools/primer-blast). The
exogenous genes were amplified via PCR (Beijing Eastwin Innovation
Biotech Co., Ltd., Beijing, China), with the following components
in each reaction (20 µl): 2 µl DNA template (500–1,000 ng/µl); 1 µl
Primer F (10 µM); 1 µl Primer R (10 µM); 10 µl 2X Taq Mastermix
(Takara Biotechnology Co., Ltd., Dalian, China); and 6 µl
H2O. The reaction parameters were as follows: 95°C
denaturation for 5 min; 30 cycles of 95°C denaturation for 30 sec,
annealing for 30 sec at the temperature stated in Table I, and 72°C extension for 45 sec;
followed by 72°C extension for 10 min. The PCR products were
evaluated via 1% agarose gel electrophoresis and stained with 5X
Gel Red using a digital gel imaging system (Bio-Rad Laboratories,
Inc.).
 | Table I.Primer sequences for the
amplification and copy number quantification of exogenous
genes. |
Table I.
Primer sequences for the
amplification and copy number quantification of exogenous
genes.
| Primer name | Primer sequence,
5′-3′ | Ta, °C | Product, bp | Organism |
|---|
| Amplification |
|
11βHSD1-F |
GTTCTGGAGGAGTGGGC | 58 | 1,085 | L3 multi-transgenic
mice |
|
11βHSD1-R |
TAGGAAAGGACAGTGGGAG |
|
|
|
|
GIPRdn−F |
CAGGAGCAAGTGACCAGGAG | 58 | 862 | L3 multi-transgenic
mice |
|
GIPRdn−R |
GAGCAGGTAGTAGCGGAAGTG |
|
|
|
|
hIAPP-F |
CTTCCTCAGCTCCTTCCA | 58 | 910 | L3 multi-transgenic
mice |
|
hIAPP-R |
CTCCGCTCCATCGTTCA |
|
|
|
|
PIP-F |
CGATGTTGGGCAAAGTATGA | 58 | 424 | Z2 multi-transgenic
miniature pigs |
|
PIP-R |
GGTCTTGACGGATGAGTAGGA |
|
|
|
|
PIP-GIPRdn−F |
CTCAGGCCGCTCGTTAAGAC | 58 | 952 | Z2 multi-transgenic
miniature pigs |
|
PIP-GIPRdn−R |
GAGACAGGGAGTAGCCGACAGT |
|
|
|
|
GIPRdn'-F |
CATCAACAAGGAGGTGCAGTCG | 58 | 265 | Z2 multi-transgenic
miniature pigs |
|
GIPRdn'-R |
CAGCAGGTCGAAGTTCAGGGT |
|
|
|
|
hIAPP'-F |
CCATTTGGTGGATTATACGGA | 58 | 899 | Z2 multi-transgenic
miniature pigs |
|
hIAPP'-R |
TGTTATCATGTCTGCTCGAAG |
|
|
|
| Copy number
quantification |
|
11β-HSD1-F |
GGCTCCCTGAATCCTACTC | 60 | 167 | L3 multi-transgenic
mice |
|
11β-HSD1-R |
TCTTTCCTCGAAGCATCTC |
|
|
|
|
hIAPP-F |
AGCTACACCCATTGAAAGTC | 60 | 100 | L3 multi-transgenic
mice and Z2 multi-transgenic miniature pigs |
|
hIAPP-R |
GTTGCTGGAATGAACTAAAA |
|
|
|
|
GIPRdn−F |
TGTCGGCTACTCCCTGTC | 60 | 144 | L3 multi-transgenic
mice and Z2 multi-transgenic miniature pigs |
|
GIPRdn−R |
CGGTCTCGGCTGAGAATG |
|
|
|
|
GAPDH-F |
AGGGCATCCTGGGCTACACT | 60 | 166 | K3 and L3
multi-transgenic mice |
|
GAPDH-R |
TCCACCACCCTGTTGCTGTAG |
|
|
|
|
TFRC-F |
GAGACAGAAACTTTCGAAGC | 60 | 81 | Z2 and Z3
multi-transgenic miniature pigs |
|
TFRC-R |
GAAGTCTGTGGTATCCAATCC |
|
|
|
Development of gradient copy standard
curves and determination of copy numbers
Escherichia coli DH5α competent cells (Takara
Biotechnology Co., Ltd.) containing transgenic vector plasmids were
incubated overnight on a shaker, and the plasmid DNA was extracted
using an Endo-free Plasmid Mini kit (E.Z.N.A; Omega Bio-Tek, Inc.,
Norcross, GA, USA). K3 mice are described below as a representative
example. The plasmid DNA concentration was measured (555 ng/µl).
Positive identification of plasmid DNA was conducted by PCR, as
aforementioned [Fig. 2; Z3
miniature pigs were verified positive in a previous study (5)]. Plasmid DNA was diluted by copy
number gradient: 105; 104; 103;
102; 10; 1; and 0.1. Additionally, 100 ng (L3 mice, Z2
and Z3 miniature pigs: 10 ng) wild-type mouse DNA [extracted form
mouse tail pieces of a C57BL/6 male mouse (age, 7–8 weeks; weight,
18–22 g) which was also housed at a temperature of 20–22°C and
relative humidity of 30–70%, under 12-h light/dark cycles with free
access to food and water], was added to each gradient solution so
that each solution system was more similar to the genomic DNA
solution directly extracted from the transgenic individuals, thus
homogenizing the reaction background (and introducing the wild-type
reference gene). It was assumed that multi-exogenous gene fragments
integrally inserted in the chromosome or transgene randomly as a
whole unit in the forward or reverse orientation. The required
vector mass was calculated using the following formula, which was
adapted from (7):
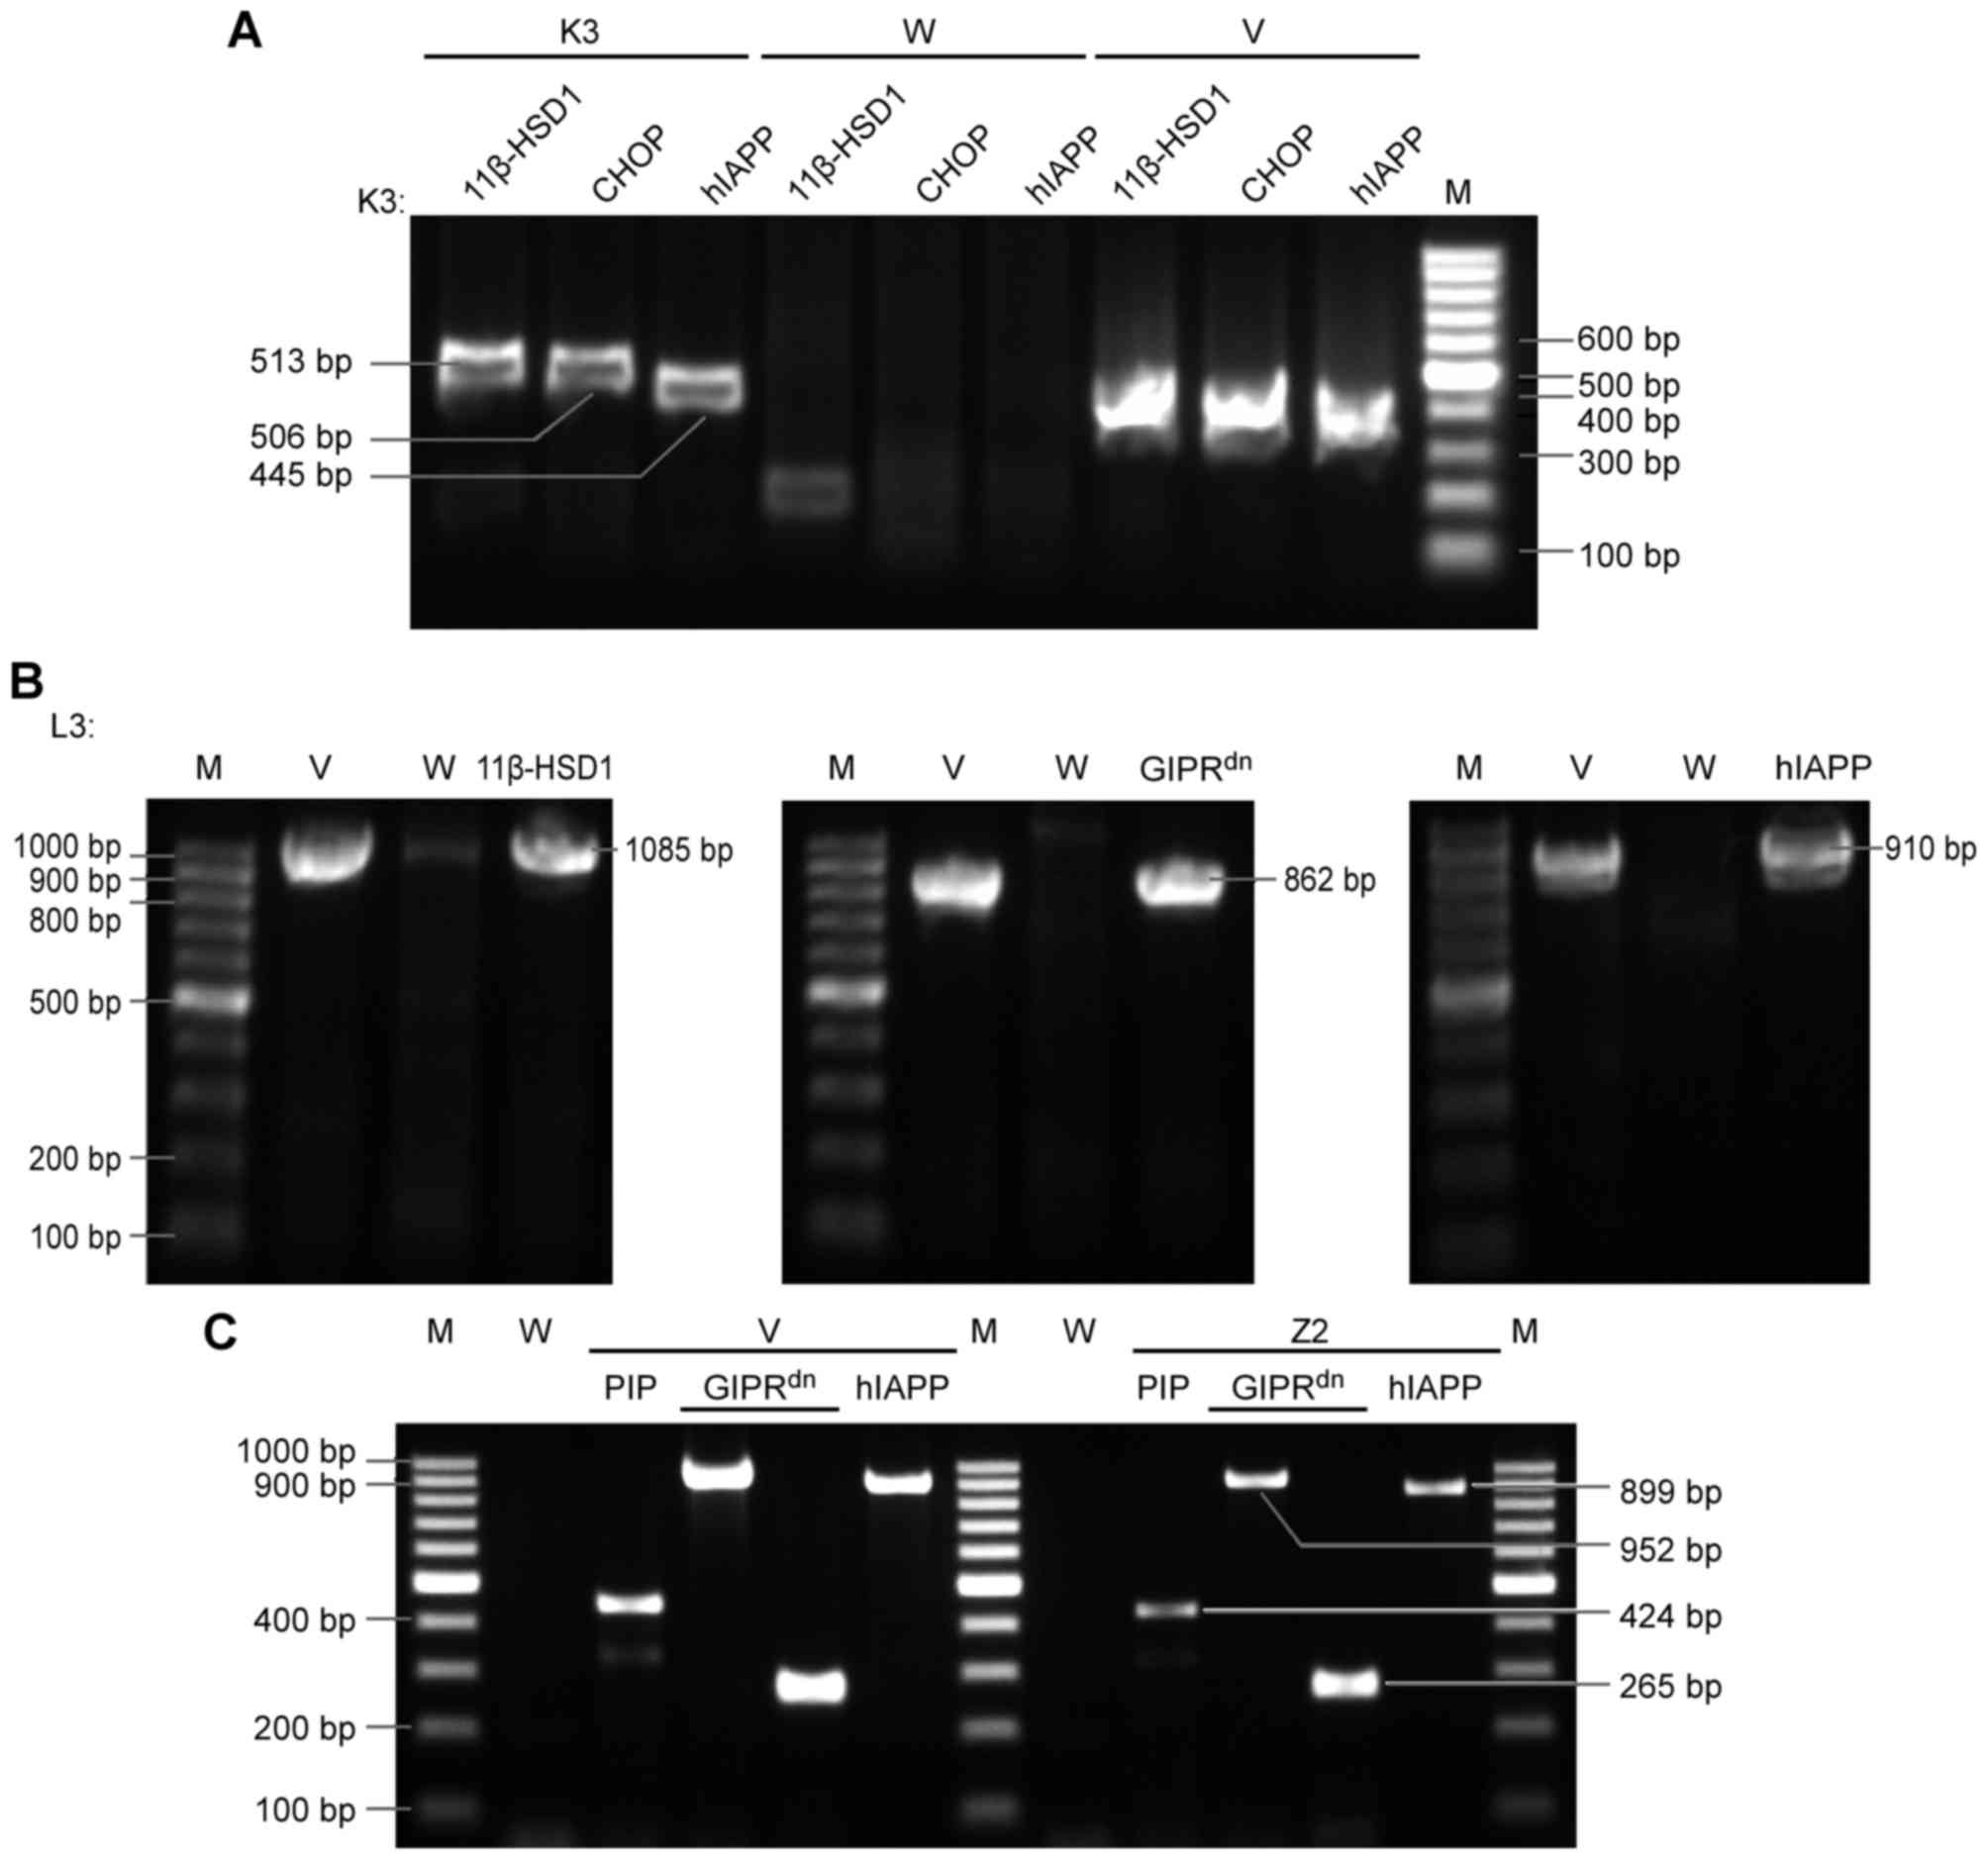 | Figure 2.PCR re-identification
electrophoretogram. (A) PCR analysis of triple transgenic K3 mice.
Three lanes/individual, with the following main fragment order:
11β-HSD1, CHOP, and hIAPP. A total of three simultaneous bands was
regarded as a positive result. (B) PCR analysis of triple
transgenic L3 mice. Three exogenous main gene fragments were
detected individually. (C) PCR analysis of dual transgenic Z2
miniature pigs. Four simultaneous bands were regarded as positive.
The primers are listed in Table I.
Marker, 100 bp DNA ladder. M, marker; V, positive control plasmid
vector; W, negative control wild-type mice; 11β-HSD1,
11β-hydroxysteroid dehydrogenase-1; CHOP, C/EBP homologous protein;
hIAPP, human islet amyloid polypeptide; GIPRdn,
dominant-negative gastric inhibitory polypeptide receptor; PIP,
porcine insulin promoter; PCR, polymerase chain reaction. |
Transgenic plasmid vector massCopy
number×transgenic plasmid vector length=Wild-type mouse genomic
massMouse haploid genomic DNA length×2
The total vector length was 13,525 bp, and the mouse
haploid genome size was 3×10⁹ bp (7). According to the equation above,
10-fold gradient vector copy solutions were produced (Table II). Prior to the standard curve
detection, solutions 1–7 were produced and 1 µl solutions A-G was
added to each reaction system (Table
II).
| Table II.Positive plasmid standard curve: Copy
number gradient solutions. |
Table II.
Positive plasmid standard curve: Copy
number gradient solutions.
| Serial numbers | Copy numbers | Product, ng | Standard linear
construction |
|---|
| 1 | 105 | 22.54 | Solution A (3 µl of
555 ng/µl vector solution mixed with 70.87 µl ddH2O):
22.54 ng/µl |
| 2 | 104 | 2.254 | Solution B (10 µl A
to dilute to 100 µl): 2.254 ng/µl |
| 3 | 103 |
2.254×10⁻¹ | Solution C (10 µl B
to dilute to 100 µl): 0.2254 ng/µl |
| 4 | 102 |
2.254×10⁻² | Solution D (10 µl C
to dilute to 100 µl): 2.254×10⁻² ng/µl |
| 5 | 101 |
2.254×10⁻³ | Solution E (10 µl D
to dilute to 100 µl): 2.254×10⁻³ ng/µl |
| 6 | 1 |
2.254×10⁻⁴ | Solution F (10 µl E
to dilute to 100 µl): 2.254×10⁻⁴ ng/µl |
| 7 | 0.1 |
2.254×10⁻⁵ | Solution G (10 µl F
to dilute to 100 µl): 2.254×10⁻⁵ ng/µl |
The exogenous gene copy number was determined via
qPCR. The mouse haploid genome single-copy gene GAPDH was selected
as an internal control for K3 and L3 (29,30).
The porcine haploid genome single-copy gene transferrin receptor
(TFRC) was selected as an internal control for Z2 and Z3 (16). The primer sequences are presented
in Table I [except for K3 and Z3,
which were described previously (5)]. qPCR was performed using the ABI 7500
Fast Real-Time PCR system (Applied Biosystems; Thermo Fisher
Scientific, Inc.) and the SYBR® Premix Ex
Taq™ kit (Takara Biotechnology Co., Ltd.) was used to
generate the absolute quantification standard curve. The 20-µl qPCR
reactions consisted of the following: 10 µl SYBR® Premix
Ex Taq GC (2X); PCR forward primer (10 µM), 0.4 µl; PCR reverse
primer (10 µM) 0.4 µl; ROX Reference Dye II (50X), 0.4 µl; template
DNA 2.0 µl; ddH2O, 6.8 µl. The experiment was repeated
three times, and the results were averaged. The two-step PCR
amplification procedure consisted of the following: Stage 1,
initial denaturation of 95°C for 30 sec; stage 2, 40 cycles of 95°C
for 10 sec and 60°C for 30 sec. ΔCq-LgN standard curves (the
targeted gene copy number logarithm corresponding to ΔCq; 11β-HSD1:
K3 or L3 a=10, Z3 a=2; CHOP, hIAPP and GIPRdn a=10;
outliers were eliminated) were generated using GraphPad Prism 5.0
(GraphPad Software, Inc., La Jolla, CA, USA). DNA samples of 100 ng
(L3 mice, Z2 and Z3 miniature pigs: 10 ng) were used. The ΔCq for
each gene was quantified based on the difference in fluorescence
(ΔCq=Cqtransgene-Cqinternal), which may be
calculated based on the standard curve to obtain the copy
number.
Statistical analysis
One-way analysis of variance followed by a post hoc
Duncan's new multiple range test was used to determine numerical
differences in transgene copy numbers between different pedigrees
to assess gene and individual integration capacity and diversity,
using SPSS version 22.0 (IBM Corp., Armonk, NY, USA). ∆Cq-LgN
standard curves and graphs were drawn using GraphPad Prism version
6.01. The dissociation curves were generated with ABI7500 SDS
system software version 1.4.1 (Applied Biosystems, Thermo Fisher
Scientific, Inc.). P<0.05 was considered to indicate a
statistically significant difference.
Results
Re-identification of multi-transgenic
mice and miniature pigs
A total of two multi-transgenic mice and two
multi-transgenic miniature pigs were generated via random insertion
of polycistronic vectors (Fig. 1).
DNA samples were isolated from the F0 and F1 generations. The DNA
(260/280 nm) absorbance ratios ranged from 1.8 to 2.0, which
indicated that the DNA purity was optimal. PCR analysis using
genomic DNA was used to re-identify positive samples (Fig. 2), and Z3 was been described
previously (5). DNA samples from
the positive individuals were used to determine the copy
numbers.
Transgene gradient copy number
standard curves
A qPCR dissolution curve demonstrated the
specificity of the three primer pairs (Fig. 3A). Unimodal dissolution curves
indicated that the primer specificities were good and that the
subsequent results were reliable. For the four multi-transgenic
animals, every target gene was associated with one plasmid standard
curve for the calculation (Fig.
3B).
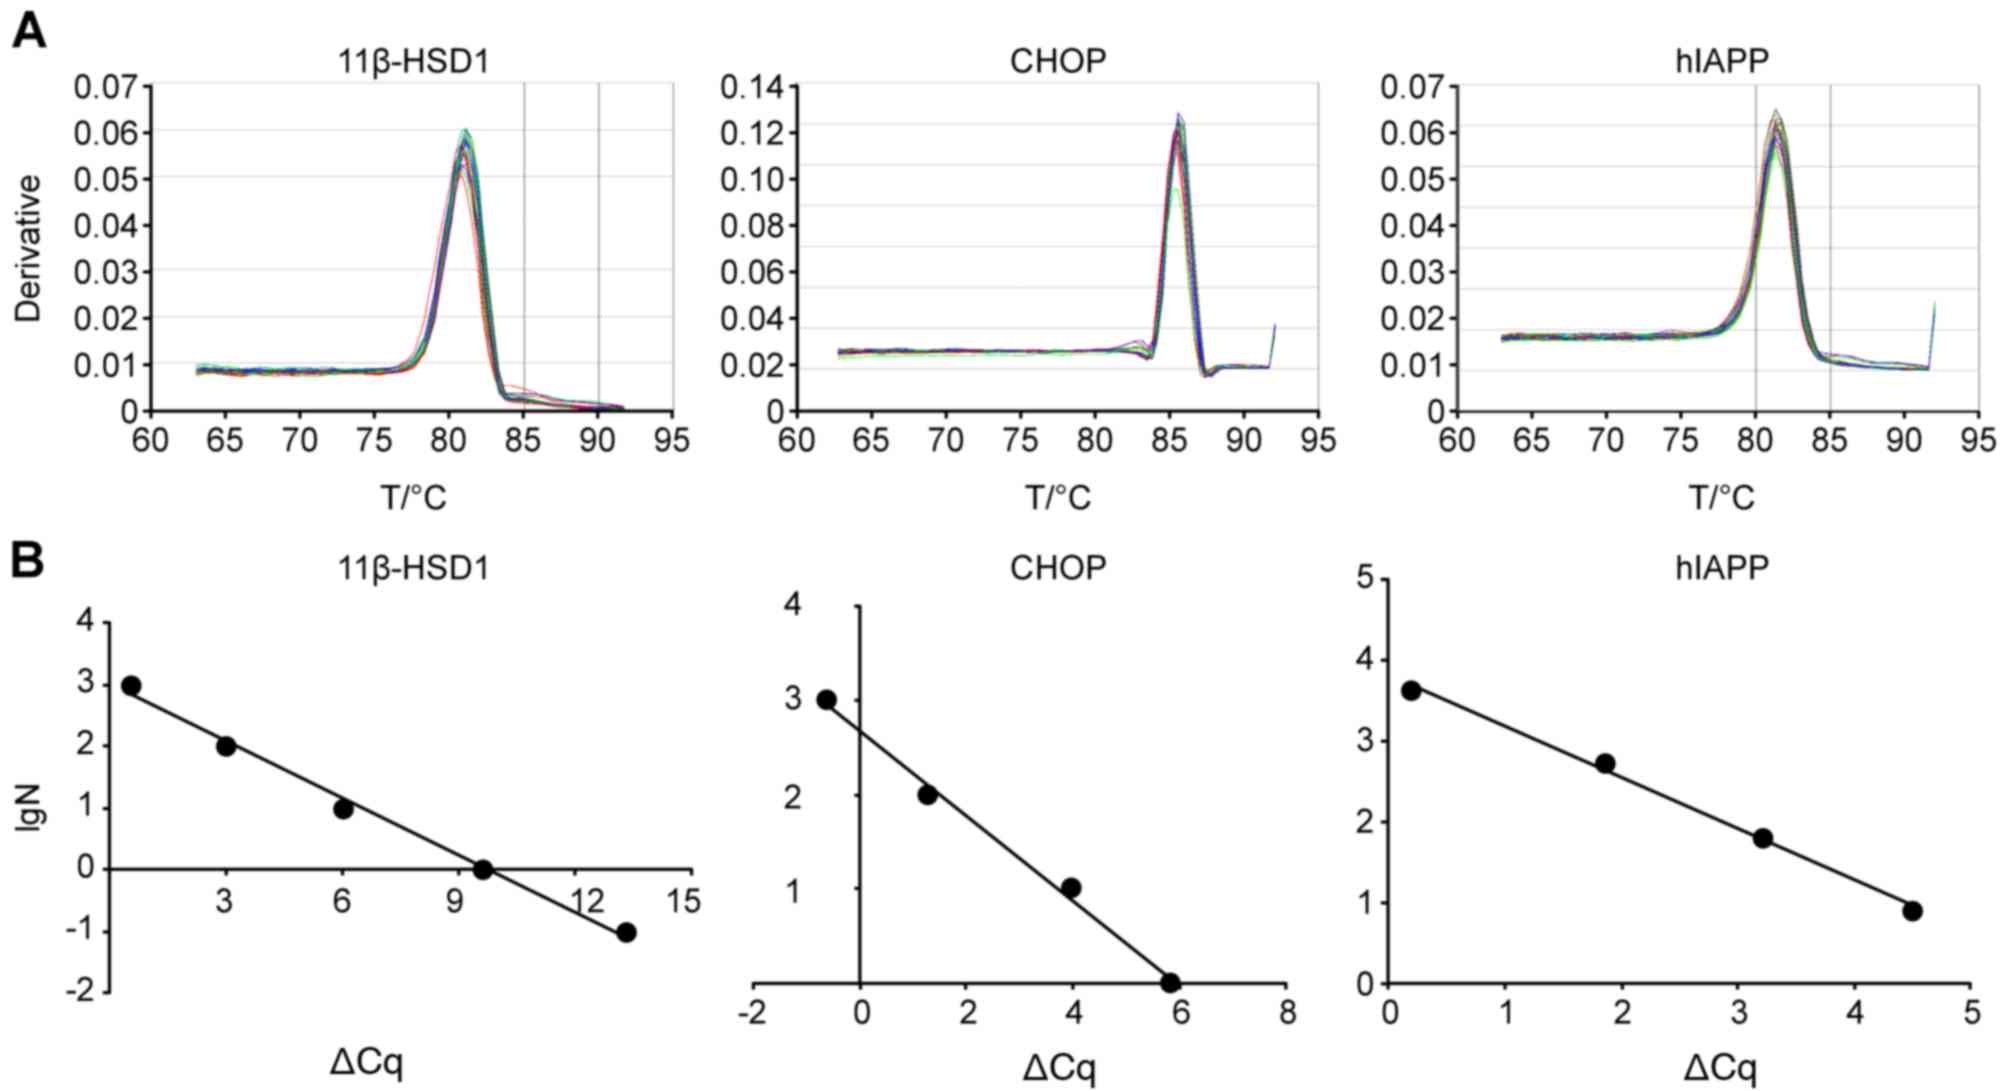 | Figure 3.Representative dissociation curves
and ∆Cq-LgN standard curves. (A) Primer specificities of three
exogenous primers for K3 11β-HSD1-hIAPP-CHOP multi-transgenic mice.
(B) ∆Cq-LgN standard curves of three transgenes.
∆Ct=Cqtransgene-Cqinternal. 11βHSD1,
y=−0.309× + 3.0101, R2=0.9932; CHOP, y=−0.4509× +
2.6794, R2=0.9947; and hIAPP, y=−0.6984× + 4.2135,
R2=0.996. L3 mice and Z2 and Z3 miniature pigs exhibited
consistent results. 11β-HSD1, 11β-hydroxysteroid dehydrogenase-1;
CHOP, C/EBP homologous protein; hIAPP, human islet amyloid
polypeptide; T, temperature; lgN, decadic logarithm of the number
of copies. |
Determination of multi-transgenic copy
numbers
The F0 transgene (11β-HSD1, hIAPP,
GIPRdn, CHOP) copy numbers of the four multi-transgenic
animals (K3 and L3 mice; and Z2 and Z3 swine) are listed in
Table III. In the F0 generation,
for all transgenic genes, the copy numbers of the genes directly
reflected the integrated situations of the four polycistronic
systems. It was observed that the copy numbers of three genes
(11β-HSD1, hIAPP, CHOP) in K3 mice were <90 (maximum copy number
of all three genes=44.51; <90), indicated as K3<90.
Additionally, the copy numbers of three genes (11β-HSD1, hIAPP,
GIPRdn) were >90 in L3 mice (minimum copy number of
all three genes=94.19; >90) and <90 in Z3 miniature pigs
(maximum copy number of all three genes=54.68; <90). In Z2
miniature pigs, the hIAPP copy number was <90, whereas the
GIPRdn copy number was >90 (Table III). It is of note that 90 is
simply a default threshold that is easy to compare, without having
a specific meaning. On the other hand, for single selected genes,
the copy numbers of 11β-HSD1 (in K3, L3 and Z3 animals), hIAPP (in
K3, L3, Z2 and Z3 animals), CHOP (in K3 and Z3 animals) and
GIPRdn (in L3 and Z2 animals) were not consistent among
the various genomes (copies compared in the same column, Table III). In addition, the following
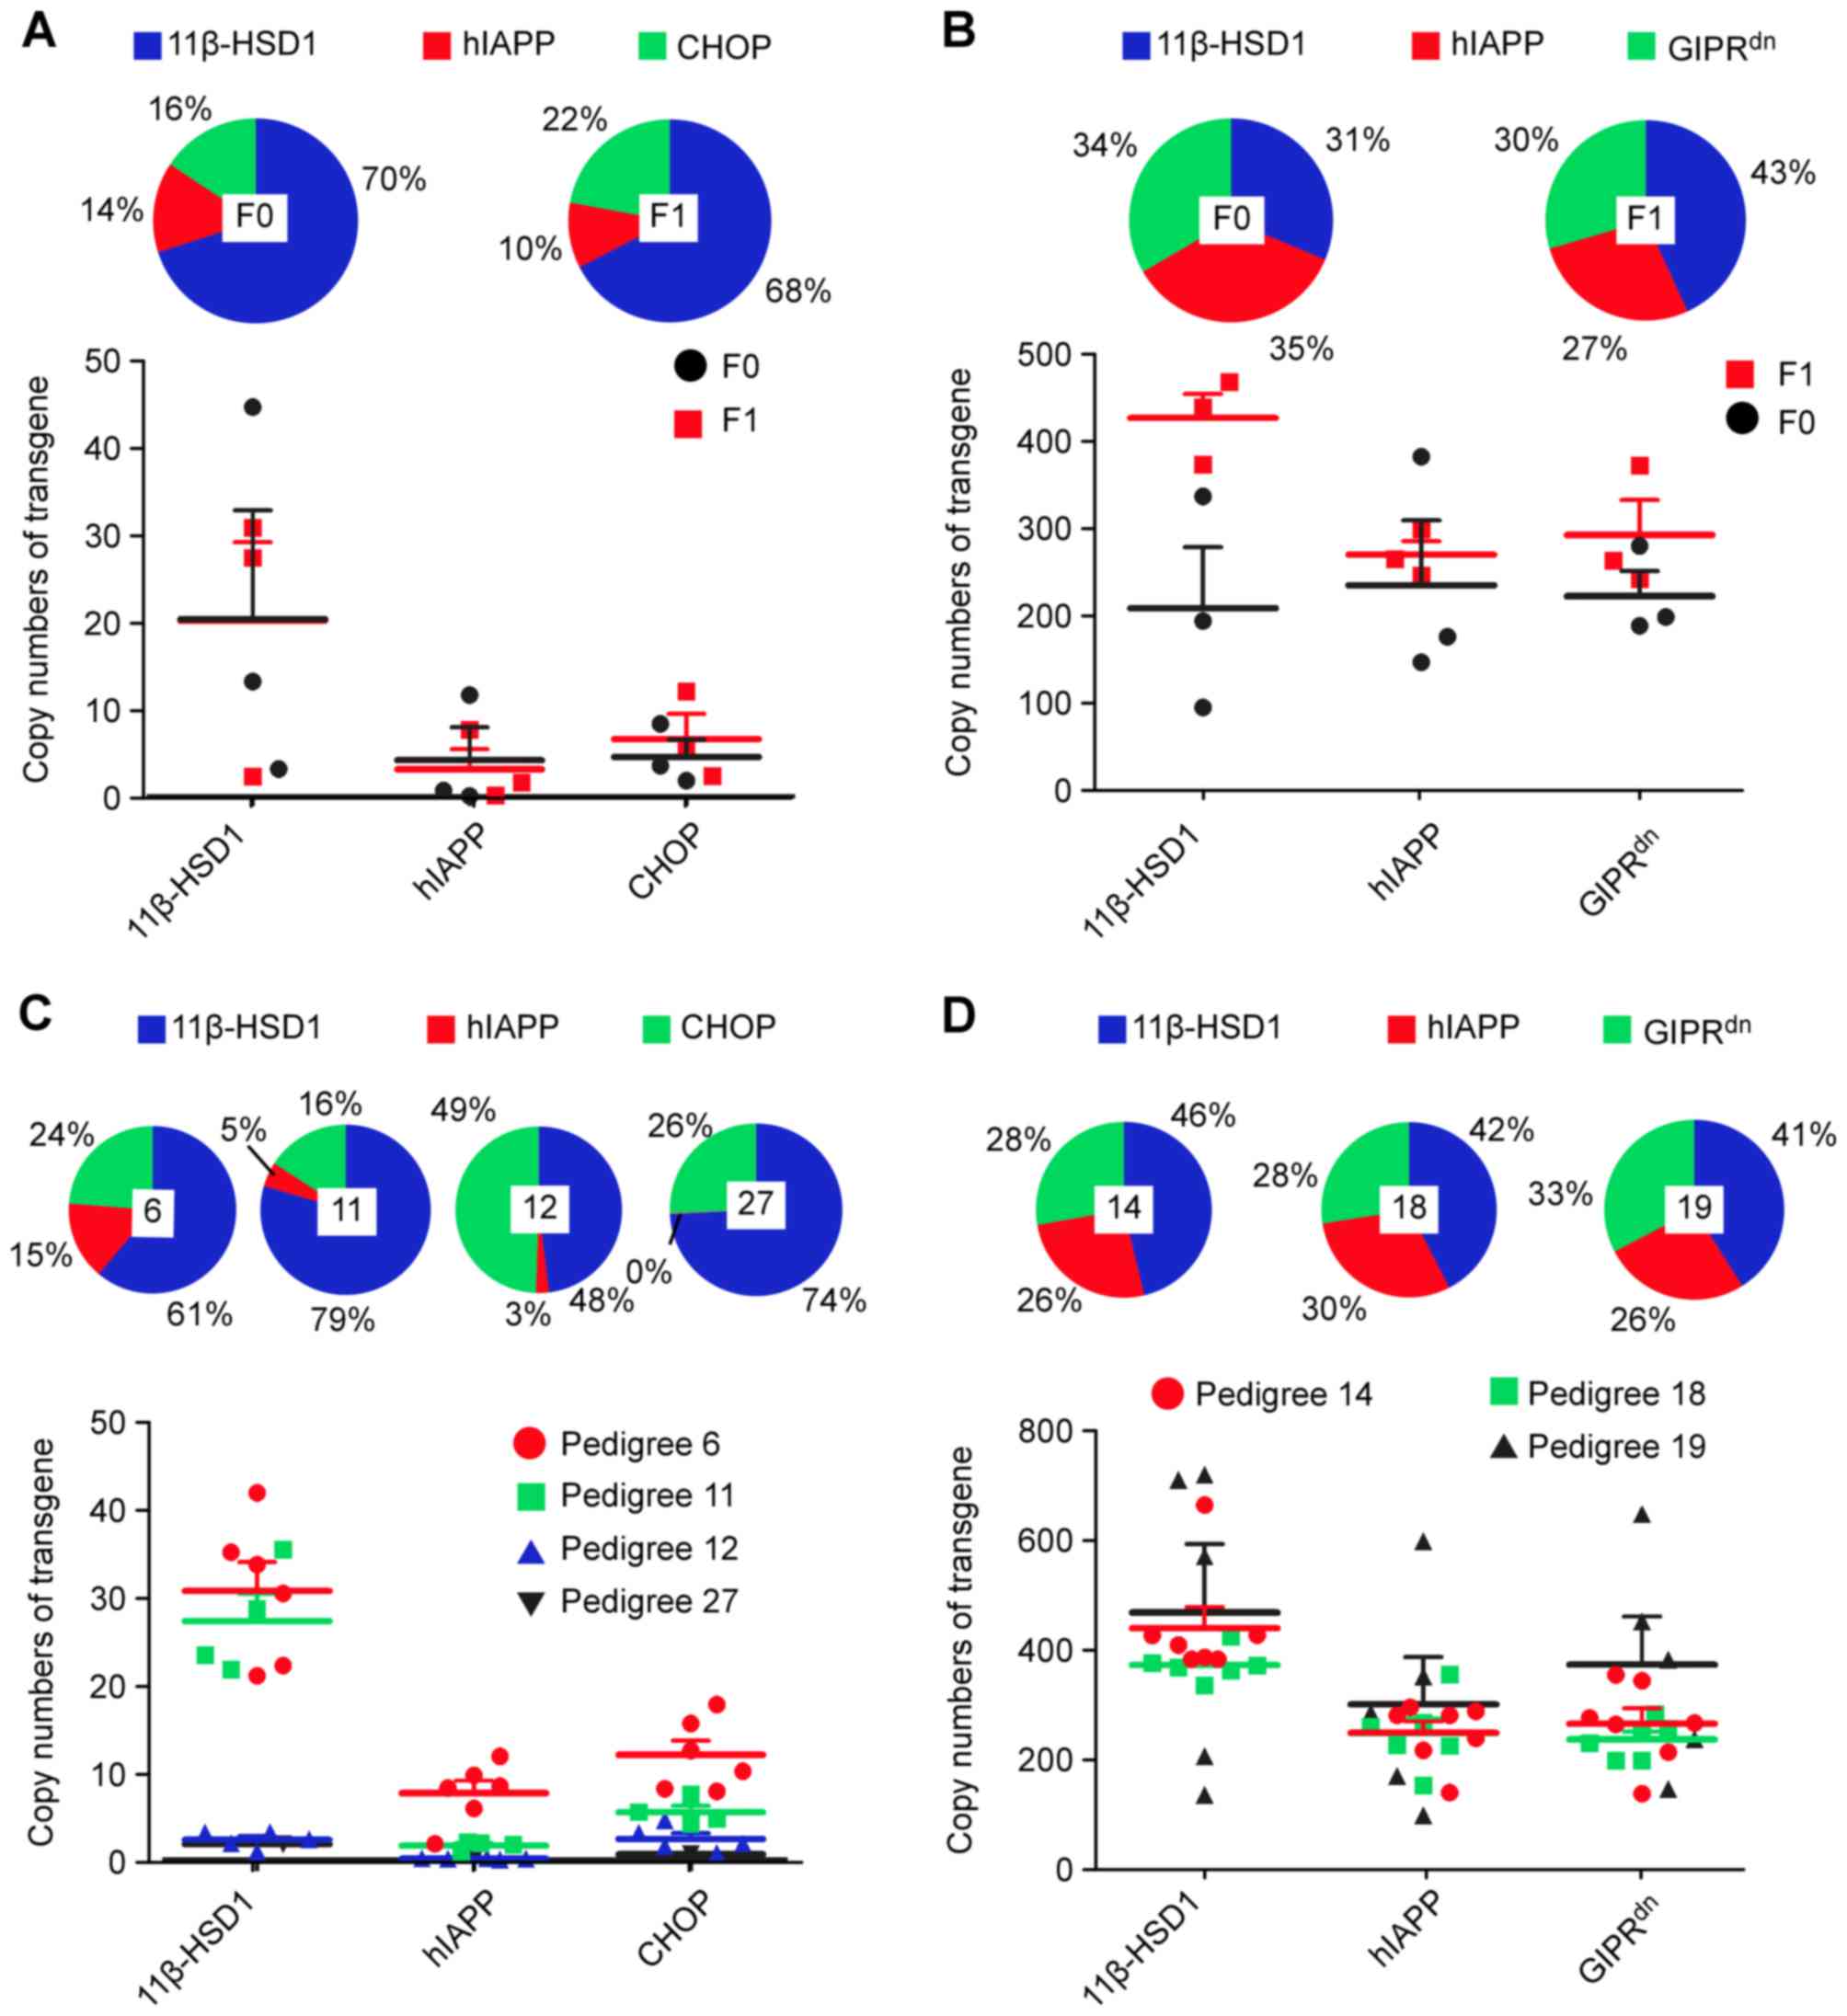
average copy numbers were observed in K3 mice (Fig. 4): 11β-HSD1, 20.27; hIAPP, 4.13; and
CHOP, 4.54. Among the copy numbers of all three genes, 11β-HSD1
accounted for the largest proportion (70%) (among the proportions
of all transgene copies from the same multi-transgenic animal),
while those of the other two genes were small (~15%; Fig. 4A). Taken together with the observed
F1 generation copy numbers, the results of the present study
indicated that the capacity of pcDNA3.1–11β-HSD1-CHOP-hIAPP to
integrate into these mice was as follows: 11β-HSD1>CHOP≈hIAPP
(Fig. 4A and C). Similarly, in L3
mice: 11β-HSD1, 207.61; GIPRdn, 221.45; and hIAPP,
234.06. These results demonstrated that the three transgenes were
present in approximately equal proportions (31, 35 and 33%),
potentially due to the pcDNA3.1–11β-HSD1-GIPRdn−hIAPP
integration capacity in mice: 11β-HSD1≈GIPRdn≈hIAPP
(Fig. 4B). For Z2 miniature pigs:
hIAPP, 70.57; and GIPRdn, 117.10, and the two genes were
also inconsistent (38%<62%; Fig.
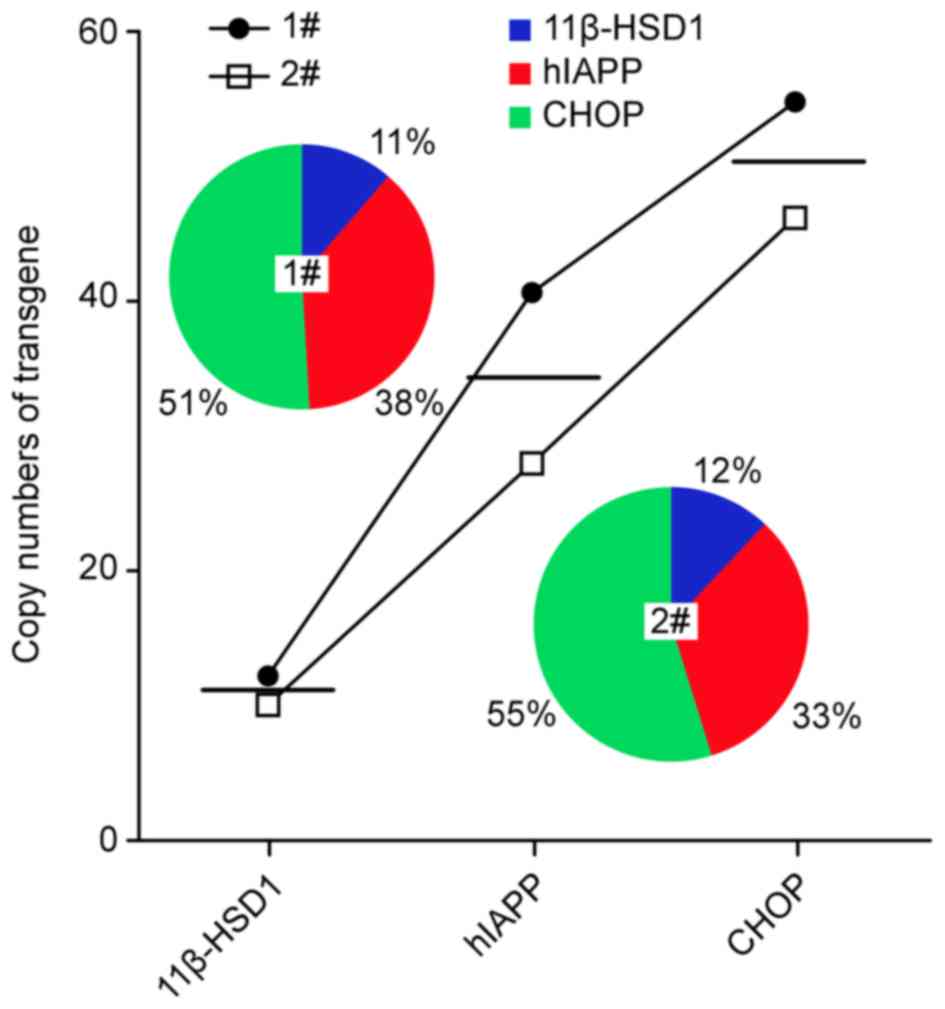
5). For Z3 miniature pigs: 11β-HSD1, 11.13; hIAPP, 34.26; and
CHOP, 50.41, demonstrating their inequality in Z3 pigs (5). This result may have been due to the
integration capacity of pcDNA3.1–11β-HSD1-CHOP-hIAPP in miniature
pigs (11β-HSD1<hIAPP<CHOP) compared with mice
(11β-HSD1>CHOP≈hIAPP) (Fig. 6).
No defined patterns were observed regarding multi-transgenic copy
number integration. If these transgenes were replaced, or the host
was changed, or even the structure of the polycistronic system
(vector) was transformed, it may result in different copy numbers
and insertion patterns. However, a single gene representing the
overall integration was not feasible; i.e., one gene may not be
representative of the integration capacities of other genes, even
on the same vector.
| Table III.Copy numbers of exogenous genes for
F0 transgenic mice (K3, L3) and transgenic miniature pigs (Z2,
Z3). |
Table III.
Copy numbers of exogenous genes for
F0 transgenic mice (K3, L3) and transgenic miniature pigs (Z2,
Z3).
| Category | Number | 11β-HSD1 | hIAPP |
GIPRdn | CHOP |
|---|
| K3 | 6 | 44.51 | 11.62 | n/a | 8.31 |
| K3 | 11 | 13.15 | 0.70 | n/a | 3.51 |
| K3 | 12 | 3.15 | 0.08 | n/a | 1.80 |
| K3 | 27 | 1.79 | 0.00 | n/a | 0.50 |
| K3 average |
| 20.27±10.17 | 4.13±3.06 |
| 4.54±1.59 |
| L3 | 14 | 94.19 | 145.98 | 187.72 | n/a |
| L3 | 18 | 192.97 | 175.06 | 197.69 | n/a |
| L3 | 19 | 335.66 | 381.15 | 278.93 | n/a |
| L3 average |
| 207.61±57.23 | 234.06±60.44 | 221.45±23.58 |
|
| Z2 | 4012 | n/a | 70.57 | 117.10 | n/a |
| Z3 | 1# | 12.16 | 40.52 | n/a | 54.68 |
| Z3 | 2# | 10.09 | 28.01 | n/a | 46.13 |
| Z3 average |
| 11.13±0.73 |
34.26±4.42a |
|
50.41±3.02a |
F1 generation copies may reflect the integration
status to some extent and may additionally reveal detailed
differences among pedigrees, generations and organisms. The F1
generation was the descendant of a positive F0 male parent and
several negative control female parents. The name of the F1
pedigree arises from the F0 male parental mark, excluding the Z2
miniature pigs from a negative female parental mark. Z2 miniature
pig 4012 was the only positive F0 father. The copy numbers of
exogenous genes in the F1 transgenic mice K3 and L3 and the
transgenic miniature pigs Z2 and Z3 are presented in Table IV. The F1 integration trends of
the different genes generally corresponded to the F0 male parents
(Fig. 4A), excluding the L3 mice
(Fig. 4B). L3 exhibited a copy
number share of 11β-HSD1>GIPRdn>hIAPP. However, L3
F0 was 11β-HSD1≈GIPRdn≈hIAPP. Therefore, it was
speculated that the copy number of 11β-HSD1 likely increased, which
may directly influence the middle gene, GIPRdn, due to
their mostly collinear orientation in the genome (i.e., mediated by
the same polycistronic vectors).
| Table IV.Copy numbers of exogenous genes in F1
transgenic mice (K3, L3) and transgenic miniature pigs (Z2,
Z3). |
Table IV.
Copy numbers of exogenous genes in F1
transgenic mice (K3, L3) and transgenic miniature pigs (Z2,
Z3).
| Category | Pedigree | Number | 11β-HSD1 | hIAPP |
GIPRdn | CHOP |
|---|
| K3 | 6 | 2 | 22.17 | 1.83 | n/a | 7.83 |
| K3 | 6 | 6 | 30.42 | 11.81 | n/a | 15.56 |
| K3 | 6 | 49 | 21.00 | 5.86 | n/a | 10.12 |
| K3 | 6 | 55 | 35.14 | 9.64 | n/a | 17.74 |
| K3 | 6 | 56 | 41.95 | 8.39 | n/a | 8.09 |
| K3 | 6 | 58 | 33.74 | 8.17 | n/a | 12.46 |
| Average | 6 |
| 30.74±2.99 |
7.62±1.28a |
|
11.97±1.51a |
| K3 | 11 | 9 | 35.45 | 1.89 | n/a | 5.42 |
| K3 | 11 | 12 | 28.64 | 0.85 | n/a | 4.10 |
| K3 | 11 | 46 | 21.71 | 1.72 | n/a | 4.68 |
| K3 | 11 | 47 | 23.36 | 2.00 | n/a | 7.46 |
| Average | 11 |
| 27.29±2.68 |
1.615±0.23a |
|
5.415±0.63a |
| K3 | 12 | 15 | 0.93 | 0.03 | n/a | 3.05 |
| K3 | 12 | 16 | 3.15 | 0.16 | n/a | 0.75 |
| K3 | 12 | 18 | 2.34 | 0.12 | n/a | 1.86 |
| K3 | 12 | 23 | 1.87 | 0.18 | n/a | 1.55 |
| K3 | 12 | 62 | 3.10 | 0.11 | n/a | 4.54 |
| Average | 12 |
| 2.28±0.37 |
0.12±0.02a |
| 2.35±0.59 |
| K3 | 27 | 27 | 1.79 | 0.01 | n/a | 0.62 |
| Total average
(K3) | 6, 11, 12, 27 |
| 20.33±3.72 |
3.76±1.10a |
|
7.13±1.41a |
| L3 | 14 | 5 | 383.90 | 284.93 | 351.76 | n/a |
| L3 | 14 | 6 | 662.23 | 292.57 | 341.01 | n/a |
| L3 | 14 | 48 | 406.19 | 277.63 | 261.24 | n/a |
| L3 | 14 | 50 | 424.48 | 213.41 | 210.13 | n/a |
| L3 | 14 | 51 | 423.92 | 277.34 | 263.53 | n/a |
| L3 | 14 | 63 | 380.35 | 235.76 | 273.31 | n/a |
| L3 | 14 | 68 | 380.12 | 136.24 | 134.58 | n/a |
| Average | 14 |
| 437.31±35.36 |
245.41±19.63a |
262.22±26.09a |
|
| L3 | 18 | 28 | 359.46 | 149.99 | 194.98 | n/a |
| L3 | 18 | 41 | 332.14 | 223.24 | 195.22 | n/a |
| L3 | 18 | 56 | 420.85 | 264.37 | 279.89 | n/a |
| L3 | 18 | 84 | 369.04 | 257.04 | 250.97 | n/a |
| L3 | 18 | 88 | 364.89 | 221.75 | 226.59 | n/a |
| L3 | 18 | 91 | 372.92 | 352.40 | 253.03 | n/a |
| Average | 18 |
| 369.88±10.76 |
244.80±24.77a |
233.45±12.73a |
|
| L3 | 19 | 78 | 708.31 | 596.20 | 646.08 | n/a |
| L3 | 19 | 81 | 568.38 | 282.64 | 379.75 | n/a |
| L3 | 19 | 92 | 132.04 | 94.97 | 142.98 | n/a |
| L3 | 19 | 94 | 717.64 | 349.28 | 449.98 | n/a |
| L3 | 19 | 100 | 203.02 | 166.74 | 234.45 | n/a |
| Average | 19 |
| 465.88±111.93 | 297.97±77.52 | 370.65±78.13 |
|
| Total average
(L3) | 14, 18, 19 |
| 422.77±36.7 |
259.81±27.91a |
282.75±30.55a |
|
| Z2 | 11–9 | 2051 | n/a | 68.45 | 163.42 | n/a |
| Z2 | 11-9 | 2053 | n/a | 47.22 | 147.47 | n/a |
| Z2 | 10–86 | 2075 | n/a | 101.98 | 369.98 | n/a |
| Z2 | 10–86 | 2078 | n/a | 35.16 | 154.85 | n/a |
| Z2 | 10–86 | 2080 | n/a | 115.48 | 403.55 | n/a |
| Z2 | 10–86 | 2081 | n/a | 126.82 | 473.91 | n/a |
| Z2 | 10–86 | 2082 | n/a | 59.39 | 211.11 | n/a |
| Z2 | 10–86 | 2083 | n/a | 104.10 | 355.35 | n/a |
| Z2 | 11–61 | 2054 | n/a | 47.17 | 174.66 | n/a |
| Z2 | 11–61 | 2056 | n/a | 56.48 | 210.23 | n/a |
| Z2 | 11–61 | 2059 | n/a | 71.71 | 396.92 | n/a |
| Z2 | 156 | 2062 | n/a | 65.07 | 234.96 | n/a |
| Z2 | 156 | 2064 | n/a | 63.27 | 195.52 | n/a |
| Z2 | 11–15 | 2069 | n/a | 58.17 | 205.92 | n/a |
| Z2 | 11–15 | 2071 | n/a | 63.01 | 284.71 | n/a |
| Z2 | 11–15 | 2072 | n/a | 65.78 | 235.67 | n/a |
| Z2 | 182 | 2138 | n/a | 57.16 | 154.17 | n/a |
| Z2 | 132 | 2124 | n/a | 45.25 | 160.65 | n/a |
| Z2 | 132 | 2126 | n/a | 52.01 | 157.65 | n/a |
| Z2 | 132 | 2128 | n/a | 56.35 | 174.98 | n/a |
| Z2 | 132 | 2129 | n/a | 77.34 | 178.44 | n/a |
| Z2 | 10–83 | 2148 | n/a | 25.25 | 110.39 | n/a |
| Z2 | 10–83 | 2149 | n/a | 80.98 | 151.69 | n/a |
| Z2 | 8–12 | 2111 | n/a | 67.11 | 170.73 | n/a |
| Z2 | 8–12 | 2113 | n/a | 0.37 | 0.45 | n/a |
| Z2 | 8–12 | 2115 | n/a | 15.75 | 155.17 | n/a |
| Z2 | 8–12 | 2116 | n/a | 15.72 | 170.84 | n/a |
| Z2 | 8–12 | 2120 | n/a | 39.93 | 140.99 | n/a |
| Z2 | 160 | 2144 | n/a | 67.48 | 191.21 | n/a |
| Z2 | 160 | 2146 | n/a | 30.96 | 117.46 | n/a |
| Z2 | 6–35 | 2132 | n/a | 30.23 | 132.43 | n/a |
| Z2 | 6–35 | 2133 | n/a | 45.28 | 137.91 | n/a |
| Z2 | 12-7 | 2139 | n/a | 42.10 | 79.43 | n/a |
| Z2 | 12-7 | 2140 | n/a | 38.33 | 130.59 | n/a |
| Z2 | 6–48 | 2152 | n/a | 38.22 | 131.22 | n/a |
| Z2 | 6–48 | 2154 | n/a | 46.32 | 135.71 | n/a |
| Z2 | 11–16 | 2155 | n/a | 49.79 | 149.55 | n/a |
| Z2 | 164 | 2158 | n/a | 97.21 | 297.92 | n/a |
| Z2 | 164 | 2159 | n/a | 41.00 | 112.77 | n/a |
| Z2 | 164 | 2160 | n/a | 67.01 | 184.96 | n/a |
| Z2 | 164 | 2162 | n/a | 42.13 | 155.77 | n/a |
| Total average
(Z2) | all Z2 |
|
| 56.55±4.07 |
192.71±14.47b |
|
In order to identify intergenerational connections,
the F0 and F1 generation copy numbers of multi-transgenic mice were
compared (Fig. 4A and B). Although
the L3 transgene copy number proportion was different between the
F0 and F1 generations, the percentages of these genes in F1
pedigrees were approximately consistent (Fig. 4B and D). In K3 mice, the F1 copy
numbers were equal to those in F0 (Fig. 4A), indicating that the three
transgenes in K3 mice were likely a consequence of single locus
integration. In L3 mice, the number of transgene copies was greater
in F1 compared with F0 (Fig. 4B),
particularly 11β-HSD1 (P<0.05; Table IV). The same phenomenon was
observed in Z2 miniature pigs (GIPRdn; Fig. 5C and D). In the F1 generation, the
K3 inter-pedigree gene copy numbers were not consistent (Table IV). The multiple transgene copies
in pedigrees 6 and 11 were greater than those in pedigrees 12 and
27 (Fig. 4C). The multi-transgenic
percentages of the four pedigrees varied greatly in K3 (Table IV; Fig. 4C). Consequently, the F0 and F1
generations are sometimes not ideal for direct use as experimental
subjects. The F2 or F3, or even subsequent generations, may be more
suitable if the copy number is more consistent. Pie charts were
generated to demonstrate the integration capacity in K3 mice
(11β-HSD1>CHOP>hIAPP), which was concordant with the results
obtained for the F0 generation (Fig.
4A and C). Specifically, in K3 pedigree 11, the hIAPP copy
number was ~1; its vector likely fractured, resulting in decreased
hIAPP insertion following integration. Additionally, the copies of
hIAPP in pedigrees 12 and 27 were <0.2; thus, intact hIAPP may
not have integrated in F0 12 and 27 K3 mice (Tables III and IV; Fig.
4C). However, the copy numbers of L3 mice were very large, and
the transgene integration was more ordered than that in K3 mice
(Fig. 4D). It is possible that the
partial sequence fragment change impacted the characteristics of
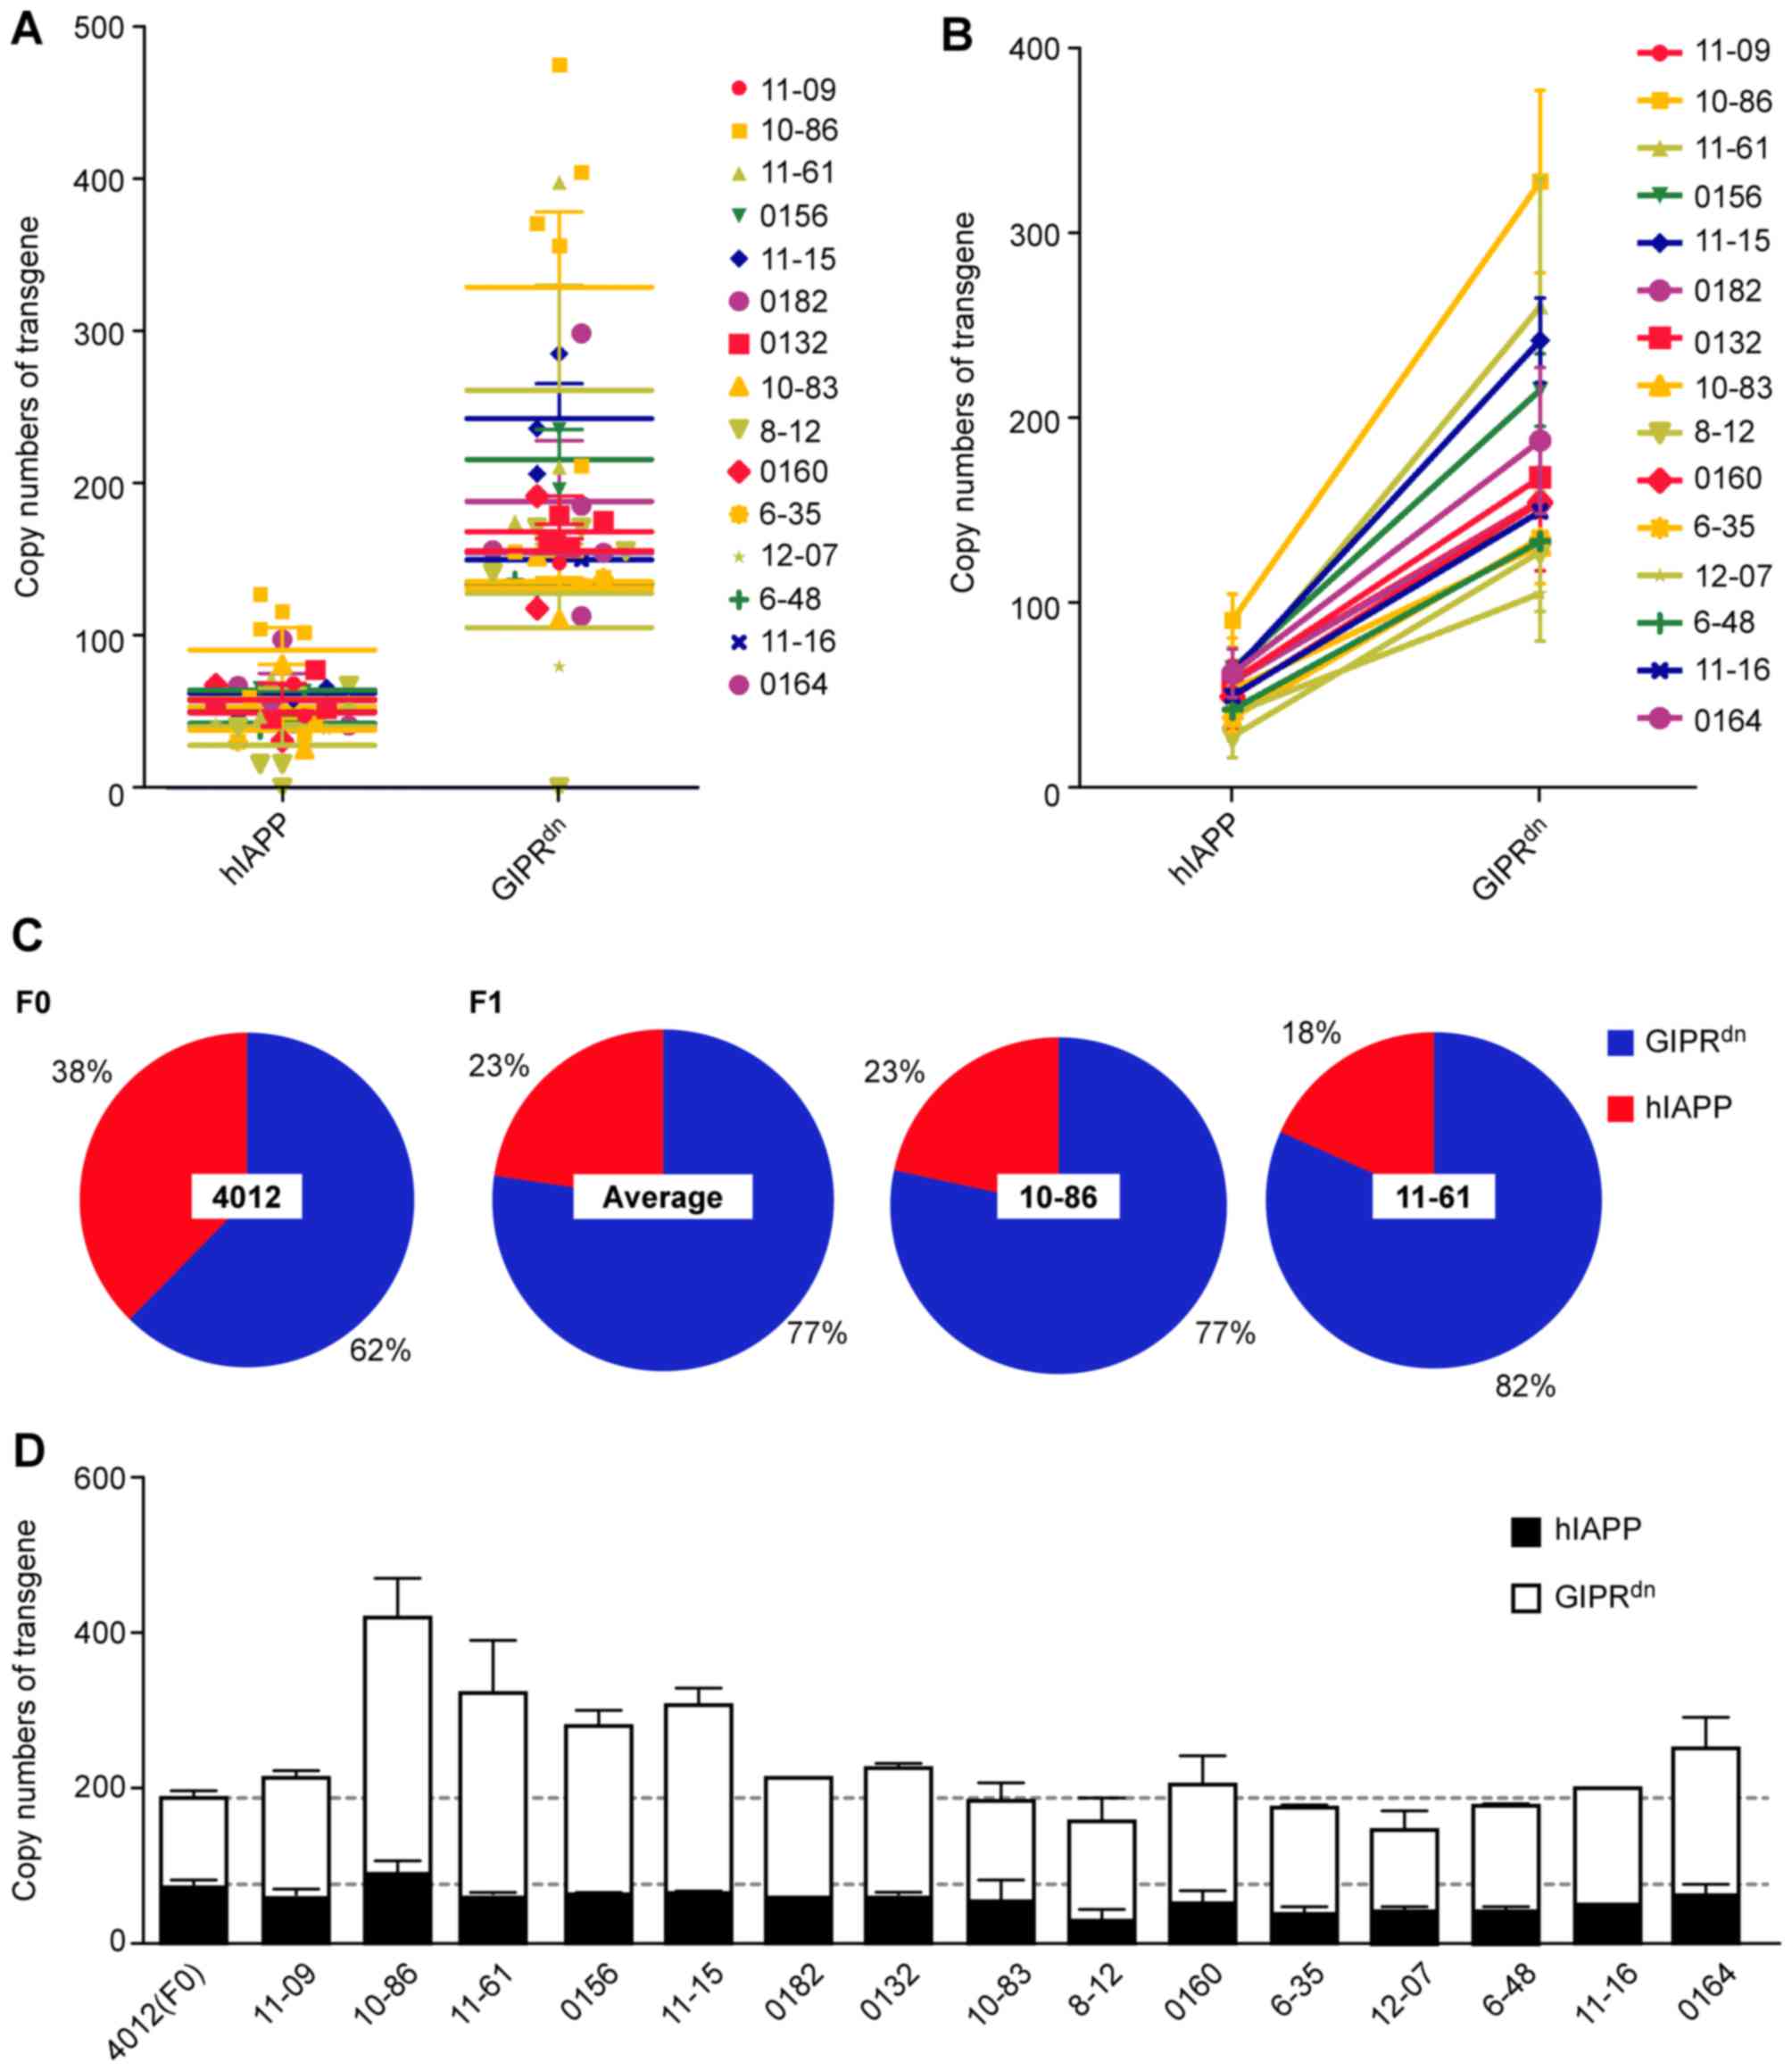
the entire vector. Additionally, Z2 miniature pigs
(pGL3-GIPRdn−hIAPP) were subjected to the distinguishing
vector (Fig. 1), which carried
only two transgenes, GIPRdn and hIAPP (the two genes
were the same as in L3). The present study obtained only one living
F0 generation that was positive for Z2 (Fig. 2C). F0 was mated with 15 female
wild-type miniature pigs, who delivered 41 transgenic, positive F1
piglets (Table IV). The transgene
scatter was convergent (Fig. 5A).
The copy number of GIPRdn clearly exceeded that of
hIAPP, and the vector may have fractured during integration.
Connecting two points of the same pedigree (for example, 1086)
demonstrated that the slopes among pedigrees were approximately
equivalent (Fig. 5B). The copy
numbers of the two genes, GIPRdn and hIAPP, were altered
almost proportionately as the F1 pedigrees resulted from only one
positive male parent (Fig. 5B).
The pie charts exhibited the percentages for the F0 male parent
4012, the average percentages for the F1 generation, and the
percentages for specific individuals 10–86 and 11–61 (Fig. 5C). The proportions determined for
the F1 generation were consistent (GIPRdn ~20% vs. hIAPP
~80%), although the F0 percentage ratio was 40% vs. 60%. Therefore,
in Z2 miniature pigs, transgenic integration was as follows:
GIPRdn>hIAPP, and the number of GIPRdn
copies increased between the F0 generation and the F1 generation.
For Z3 triple-transgenic piglets, only two F0 individuals, 1# and
2#, were obtained (Fig. 6). The
vectors used for the Z3 pigs were the same as those applied in the
K3 mice (Fig. 1). Comparison of
these two F0 individuals revealed that the integration capacity of
the same vector was superior in Z3 pigs compared with K3 mice
(Figs. 4A and 6; Table
III). Additionally, transgene integration in Z3 was consistent
among individuals (Fig. 6).
Consequently, it was suggested that Z3 descendant F1 generations
may serve directly as experimental subjects.
Discussion
The present study describes the analysis of
multi-transgenic animals via qPCR based on the number of each
integrated transgene. The premise upon which the present study was
based is that to achieve regulated expression of multiple different
transgenes in a single organism, large constructs containing all
transgenes (either under the control of a specific promoter or
linked by 2A-type sequences) are required, although such constructs
may potentially fragment during the transgenesis process. Analysis
of integrated transgenes is therefore required (generally via qPCR)
to understand potential future research or breeding strategies. In
the present study, the methodology for the polycistronic vector
systems was evaluated in diabetes-associated polygenic (11β-HSD11,
hIAPP, CHOP and GIPRdn) mice and miniature pigs,
assuming that each construct integrated randomly as a whole unit
into the genome. In the present study, real-time fluorescent single
standard curve-absolute quantification (with an internal reference)
was performed to determine the copy numbers in multi-transgenic
animals (5,7,8,17,18,31).
In a number of transgene copy number detection methods, a
semi-quantitative technique is used, including traditional Southern
blotting, and copy numbers are calculated through gray intensity
analysis (4,32). As Southern blotting is
time-consuming and semi-quantitative grey analysis may be
inaccurate, this method may not be used alone to obtain an accurate
copy number; other methods are required for confirmation. Absolute
quantification methods can be broadly divided into a single
standard curve (without an internal reference) quantification
method, a single standard curve (with an internal reference)
quantification method and a double standard curve
(Cqtransgene/Cqinternal) quantification
method. All these methods are based on qPCR. Since qPCR is quick
and sensitive, it has been applied widely for copy number detection
(33). The single standard curve
(without an internal reference) method provides a positive gradient
copy logaN-Cq absolute quantification standard curve (N
indicates the copy number) (4).
The sample copy numbers are subsequently calculated according to
the Cq. The background solution of the standard curve system is
pure water, although the transgenic sample background solutions are
the genomic DNA solutions. Thus, the background solutions are
inconsistent, and only approximate results may be obtained. The
single standard curve (with an internal reference) method provides
a positive gradient copy logaN-ΔCq absolute
quantification standard curve. The difference in the fluorescence
threshold, ΔCq, is substituted into the standard curve to derive
the copy number directly (5,7,8,31).
The common point of these two methods is sufficient to draw a
standard curve for a particular gene, and they differ because the
former considers only the exogenous gene fluorescence threshold,
Cq, as an independent variable, while the latter considers the
difference, ΔCq, between the exogenous gene and the reference gene
as the independent variable. Since the reference gene represents
the background -the wild-type genome- the latter copy numbers are
corrected according to the wild-type control for improved accuracy.
This correction step is one of the reasons why the present method
was adopted. Additionally, in the double standard curve
(Cqtransgene/Cqinternal) method for the
target gene and reference gene, two known copy gradient standard
curves are established using qPCR, which provides simultaneous
quantitative detection of the exogenous and reference genes. The
copy numbers of the exogenous and reference genes in the sample are
subsequently determined; the number of copies of the exogenous gene
in the haploid genome is the ratio of the copy number of the
exogenous gene to that of the internal reference gene (34). Here, we note that ΔCq and
Cqtransgene/Cqinternal represent a reference
gene correction strategy. One is corrected in the reaction system
(by relative quantitation of the control reaction system error by
benchmarking the fluorescence threshold of the reference gene), and
the other is corrected by copy number mathematical correction (thus
ΔCq is optimal). In addition,
Cqtransgene/Cqinternal requires the
construction of two standard lines with error reduplicates. In
addition, the relative quantification (2−ΔΔCq) method,
which completely adopts the idea of relative quantitation of
expression, is also based on algorithm correction (35). Specifically, the negative control
group genomic DNA is mixed with an equal copy number of positive
plasmid solution as a reference sample. The reference gene is used
to adjust the system error (also ΔCq). The transgenic sample ΔCq
and the reference sample ΔCq are then compared (2−ΔΔCq),
where 2−ΔΔCq represents the number of transgene copies
inserted (18). Since this method
is based on logarithms, the reaction trends of the data are very
reliable, although their digital accuracy is less consistent. The
relative quantification (2−ΔΔCq) method requires a more
stringent internal gene copy (must be 1), and the error is larger.
Comparison of these methods revealed that the single standard
curve-absolute quantification method (with an internal reference)
is ideal for determining the copy number in transgenic pigs and
mice (5,7,8,31).
The copy numbers of randomly integrated transgenes
in multi-transgenic mice and miniature pigs were determined. In the
present study, the quantitative dissociation curves were unimodal,
confirming the specificity of the primers (15,35,36).
In the development of the gradient copy standard curve, it was
assumed that PCR efficiency is generally equal between a plasmid
template and genomic DNA (7,8,31).
The statistical results indicated that the pedigree copy numbers in
K3 F1 mice were significantly different. For the same exogenous
gene, the copy numbers in F1 mice from different founder (F0)
generations varied widely. Therefore, the F1 with the ideal,
consistent copy number was able to be selected for future research
(deleting the individuals with failure of multi-gene integration).
The screening policy ought not to focus solely on high copy
numbers. It has been reported that high transgene copy numbers may
result in co-suppression between genes, mainly due to
transcriptional or post-transcriptional silencing (37,38).
It is necessary to eliminate individuals carrying multi-genes that
are not integrated or individuals with very low transgene copy
numbers. However, the positive individuals with either two or three
gene copies exhibited a lack of regularity in terms of integration
numbers. In addition, the copy number in the offspring (F1) with an
F0 parent exhibiting a high transgene copy number was high,
particularly in L3. However, the copy number of integrated hIAPP
was lower in K3 mice, providing a value of zero in several
pedigrees (12,27). Three-gene integrations of hIAPP in
K3 and L3 were both low. In Z2 miniature pigs, hIAPP integration
was also decreased compared with GIPRdn (Fig. 5), suggesting that the integration
of hIAPP is more difficult. However, in Z3 miniature pigs, the
hIAPP copy number was not the lowest (Fig. 6). Therefore, it may involve
numerous biological factors (including homology of the transgene to
the host). However, it is of note that considering integrated sites
and late phenotypes (including western blotting or certain later
research data) are also important factors in selecting ideal
multi-transgenic animals; copy number is only one of the
factors.
In polycistronic random integration series in
multi-transgenic animals, each gene integrates inconsistently in
the genome, resulting in the comparison of genetically modified
animals with multiple differences. The transgene preparation
vectors are too large for these animals. The integration of a
series of multiple genes, and particularly the occurrence of
different levels of fracture during the integration process, may
result in the integration of different gene-associated sequences of
various lengths (39). For
example, in Z2 F0 miniature pigs, transgenic copies were
GIPRdn>hIAPP, indicating that certain events may have
occurred, including fragmentation. Zhang et al (39) used whole genome sequencing to assay
transgenic cattle, which adopted a single transgene; they observed
that certain transgene fragments were indeed fragmented.
Fragmentation is an inherent shortcoming of polycistronic
vector-mediated technology, but the observed data in other studies
indicated that functional genes and even complete tandem gene
structures were present (5,6,14,17).
However, the copy number qPCR detection method from the present
study was widely used. Specifically, if fracturing of large
constructs during the transgenesis process is as significant a
factor as indicated by the analysis performed in the present study,
quantifying parts of each integrated transgene via qPCR may not be
satisfactory, as it will not demonstrate the entirety of the
transgene. Additionally, if fracturing is indeed such a problem for
large transgenes, then large transgenes are unlikely to be a
tenable platform for the reliable production of multi-transgenic
animals. However, a number of copies or incomplete fragments of
transgenes are likely to be integrated into different sites of the
genome, in the manner of a shotgun blast hitting an object,
increasing the difficulty and uncertainty associated with the
accurate detection of these gene copies (39). Nevertheless, qPCR remains an
important method for measuring the copy numbers of transgenes
(7,8), as numerous transgenic genes are
incomplete in the single-transgene genomes (39). In addition, the multi-transgenic Z2
and Z3 miniature pigs and multi-transgenic K3 and L3 mice (mouse
data awaiting publication) used in the present study exhibited the
expected phenotypes to a certain degree (5,6).
Deng et al (14) combined
the 2A peptide and double promoters to efficiently mediate the
co-expression of the four fluorescent proteins in pigs, and the
present study therefore considered this to be a promising
methodology for generating multi-transgenic pigs via a single
nuclear transfer. Tian et al (13) generated 2A peptide-mediated
tri-fluorescent protein gene-expressing transgenic sheep. Park
et al (17) successfully
generated transgenic pigs expressing soluble human tumor necrosis
factor receptor superfamily member 1A Fc fusion protein and human
heme oxygenase 1 using the F2A peptide, which demonstrated that
utilization of the F2A self-cleaving peptide polycistronic system
is a promising tool for generating multi-transgenic pigs. The
results of the present study further demonstrated the existence of
inconsistent copy numbers following random integration associated
with multiple genes loaded in a single carrier. Thus, the copy
number of one transgene may not be used to represent the copy
numbers of other co-loaded transgenes. As expected, it was observed
that polycistronic-mediated transgenes integrate as large
fragments, and it is difficult to determine the integrity of all
integrated gene sequences. Additionally, it remains questionable
whether this phenomenon is also due to the presence of promoters
(which may facilitate easier fragmentation) from heterogeneous
sources in these animals. If the carrier only contains sequences
from homologous species, different results (different forms of
fragmentation) may be obtained, potentially resulting in more
consistent multiple gene copy numbers. However, to answer these
questions, further research is required.
The detection principle of the method used in the
present study is derived from the average number of transgene
copies in the haploid genome. It was proposed that if F0 transgenic
events primarily occur in the same homologous chromosome, then
future generations will not comply with the copy number halved law,
and the F0 and F1 transgene copy numbers may be equal (individuals
with negative copy detection were eliminated from the results of
the present study presented in Tables III and IV). The transgene copy number of one of
the transgenes in L3 mice and Z2 pigs increased relative to the
other two transgenes during germline transmission (F0 to F1). F0
multi-transgenesis randomly inserted in mouse 40 chromosomes or
porcine 38 chromosomes. When meiosis occurs, the transgenes will
separate irregularly. It is possible that homologous recombination
between sister chromatin is one of the reasons why there may be a
difference in the F1 generation. The negative control parent may
influence the genomic background and thus lead copy number
half-and-half alterations mathematically. Certain gametes exhibit
high copy (even more than 2-fold) transgene, after mate with the
negative, some F1 still more than F1 average transgene copy number
level. However, homologous gametes would exhibit low copy numbers.
In addition, non-sister chromatid exchange may weaken the influence
of the negative control parent (as a way to reduce the F1
difference). Similarly, non-sister chromatid exchange may be the
single reason (as a way to enlarge the F1 difference), since the
proportions determined for the F1 generation were consistent
(GIPRdn ~20% vs. hIAPP ~80%), although the F0 percentage
ratio was 40% vs. 60%. qPCR analysis has been widely used in copy
number detection, although the limitation was that it used a pair
of primers, following amplification, which reflected the copy
number by fragment length 80–150 bp (the general product length of
qPCR), and is therefore not very accurate. The copy numbers in the
present study may reflect only a general value or trend. More
accurate copy number detection may be obtained with the help of
whole genome resequencing (39).
Additionally, certain other rare causes may be implicated. An
increasing copy number may be responsible for copy number variation
regions, which are similar to the integration of exogenous
fragments since as-yet-unclear events may occur during such a
random integration (40). For
example, whether restructuring exists, similar to the formation of
the genetic structure of an antibody (41), non-allelic homologous recombination
occurs during meiosis, which will generate repetitive copy
variation and structural rearrangements between sequences (42). DNA damage, like non-homologous
end-joining, may not be fully restored, or replication forks may be
stalled, generating copies of repeated sequence (43). Transposon jumping, followed by
their insertion at active hot spots, may additionally cause copy
generation and genomic instability (44,45).
Multi-gene copy detection, combined with other
detection methods, including site junction and later transgenic
expression, to direct selection will avoid intra-treatment
differences and indistinct phenotype data in subsequent
experiments. Copy detection is one of the important aspects for
transgene assessments, biosafety assessments and inspection
applications. In fact, reliance solely on qPCR results in
difficulties associated with accurate assessments of gene
integrity, integration sites and the precise number of integrated
gene copies. Notably, whole genome sequencing may be a good tool to
improve the effectiveness of transgene integration detection
(39). In order to completely
elucidate integration characteristics in multi-transgenic animals,
researchers may focus on site-targeting or copy-targeting of future
transgenes to avoid the various subsequent uncertainties [the
RNA-guided CRISPR Cas9 system (46) allows site-specific integration].
The present study used miniature pigs produced via somatic cell
nuclear transfer to measure copy numbers. However, all of the
analyses may be performed in donor cells, rather than in live
animals, which may decrease the cost.
In conclusion, the results of the present study
indicated that the integration capacities of different
polycistronic system-mediated vectors vary in different
multi-transgenic mice and miniature pigs, and the integration of
each gene via different vectors in different genomes is
inconsistent. In addition, although two or three genes were loaded
by the same vector, their integrated copy numbers were not
concordant, even in different genomes. The copy number of one gene
may not be used to represent that of other genes in the same
transgenic organism. In animal experiments utilizing random
multi-transgene incorporation, copy number is one of the most
important factors for consideration; if transgenic mice are
directly adopted for research following manufacture without
selection and future breeding, numerous differences and
miscellaneous data will emerge in subsequent research.
Acknowledgements
The present study was supported by the National
Natural Science Foundation of China (grant no. 31372276), the State
Key Laboratory of Animal Nutrition (grant no. 2004DA125184G1602),
the National Basic Research Program of China (grant no.
2015CB943100), the Agricultural Science and Technology Innovation
Program (grant nos. ASTIP-IAS05 and ASTIP-IAS-TS-4), and Shenzhen
Special Fund for the Strategic Emerging Industries Development
(grant no. CXZZ20140504105105077).
References
|
1
|
Tizard M, Hallerman E, Fahrenkrug S,
Newell-McGloughlin M, Gibson J, de Loos F, Wagner S, Laible G, Han
JY, D'Occio M, et al: Strategies to enable the adoption of animal
biotechnology to sustainably improve global food safety and
security. Transgenic Res. 25:575–595. 2016. View Article : Google Scholar : PubMed/NCBI
|
|
2
|
Miao X: Recent advances in the development
of new transgenic animal technology. Cell Mol Life Sci. 70:815–828.
2013. View Article : Google Scholar : PubMed/NCBI
|
|
3
|
Fan N and Lai L: Genetically modified pig
models for human diseases. J Genet Genomics. 40:67–73. 2013.
View Article : Google Scholar : PubMed/NCBI
|
|
4
|
Gao S, Yang Y, Wang C, Guo J, Zhou D, Wu
Q, Su Y, Xu L and Que Y: Transgenic sugarcane with a cry1Ac gene
exhibited better phenotypic traits and enhanced resistance against
sugarcane borer. PLoS One. 11:e01539292016. View Article : Google Scholar : PubMed/NCBI
|
|
5
|
Kong S, Ruan J, Xin L, Fan J, Xia J, Liu
Z, Mu Y, Yang S and Li K: Multi-transgenic minipig models
exhibiting potential for hepatic insulin resistance and pancreatic
apoptosis. Mol Med Rep. 13:669–680. 2016. View Article : Google Scholar : PubMed/NCBI
|
|
6
|
Kong S, Ruan J, Xin L, Fan J, Zhu W, Xia
J, Li L, Yang S and Li K: Type 2 diabetes model of minipig
generated by multi-gene transgenic technology. Diabetes Metab Res
Rev. 31:262015.
|
|
7
|
Luo W, Li Z, Huang Y, Han Y, Yao C, Duan
X, Ouyang H and Li L: Generation of AQP2-Cre transgenic mini-pigs
specifically expressing Cre recombinase in kidney collecting duct
cells. Transgenic Res. 23:365–375. 2014. View Article : Google Scholar : PubMed/NCBI
|
|
8
|
Luo W, Li Z, Li P, Huang Y, Han Y, Yao C,
Zhang Z, Yan H, Pang D, Ouyang H and Li L: Expression of Cre
recombinase in alveolar epithelial cells of the AQP2-Cre transgenic
mini-pigs. Cell Physiol Biochem. 34:1597–1613. 2014. View Article : Google Scholar : PubMed/NCBI
|
|
9
|
Paterson JM, Morton NM, Fievet C, Kenyon
CJ, Holmes MC, Staels B, Seckl JR and Mullins JJ: Metabolic
syndrome without obesity: Hepatic overexpression of
11beta-hydroxysteroid dehydrogenase type 1 in transgenic mice. Proc
Natl Acad Sci USA. 101:7088–7093. 2004. View Article : Google Scholar : PubMed/NCBI
|
|
10
|
Whyte JJ and Prather RS: Genetic
modifications of pigs for medicine and agriculture. Mol Reprod Dev.
78:879–891. 2011. View Article : Google Scholar : PubMed/NCBI
|
|
11
|
He J, Ye J, Li Q, Feng Y, Bai X, Chen X,
Wu C, Yu Z, Zhao Y, Hu X and Li N: Construction of a transgenic pig
model overexpressing polycystic kidney disease 2 (PKD2) gene.
Transgenic Res. 22:861–867. 2013. View Article : Google Scholar : PubMed/NCBI
|
|
12
|
Ye J, He J, Li Q, Feng Y, Bai X, Chen X,
Zhao Y, Hu X, Yu Z and Li N: Generation of c-Myc transgenic pigs
for autosomal dominant polycystic kidney disease. Transgenic Res.
22:1231–1239. 2013. View Article : Google Scholar : PubMed/NCBI
|
|
13
|
Tian Y, Li W, Wang L, Liu C, Lin J, Zhang
X, Zhang N, He S, Huang J, Jia B and Liu M: Expression of 2A
peptide mediated tri-fluorescent protein genes were regulated by
epigenetics in transgenic sheep. Biochem Biophys Res Commun.
434:681–687. 2013. View Article : Google Scholar : PubMed/NCBI
|
|
14
|
Deng W, Yang D, Zhao B, Ouyang Z, Song J,
Fan N, Liu Z, Zhao Y, Wu Q, Nashun B, et al: Use of the 2A peptide
for generation of multi-transgenic pigs through a single round of
nuclear transfer. PLoS One. 6:e199862011. View Article : Google Scholar : PubMed/NCBI
|
|
15
|
Zhu H, Wen F, Li P, Liu X, Cao J, Jiang M,
Ming F and Chu Z: Validation of a reference gene (BdFIM) for
quantifying transgene copy numbers in Brachypodium distachyon by
real-time PCR. Appl Biochem Biotechnol. 172:3163–3175. 2014.
View Article : Google Scholar : PubMed/NCBI
|
|
16
|
Kong QR, Wu ML, Zhu J, Bou G, Huan YJ, Yin
Z, Mu YS and Liu ZH: Transgene copy number and integration site
analysis in transgenic pig. Prog Biochem Biophys. 12:0162009.
|
|
17
|
Park SJ, Cho B, Koo OJ, Kim H, Kang JT,
Hurh S, Kim SJ, Yeom HJ, Moon J, Lee EM, et al: Production and
characterization of soluble human TNFRI-Fc and human HO-1 (HMOX1)
transgenic pigs by using the F2A peptide. Transgenic Res.
23:407–419. 2014. View Article : Google Scholar : PubMed/NCBI
|
|
18
|
Qian X, Kraft J, Ni Y and Zhao FQ:
Production of recombinant human proinsulin in the milk of
transgenic mice. Sci Rep. 4:64652014. View Article : Google Scholar : PubMed/NCBI
|
|
19
|
Webster NL, Forni M, Bacci ML, Giovannoni
R, Razzini R, Fantinati P, Zannoni A, Fusetti L, Dalprà L, Bianco
MR, et al: Multi-transgenic pigs expressing three fluorescent
proteins produced with high efficiency by sperm mediated gene
transfer. Mol Reprod Dev. 72:68–76. 2005. View Article : Google Scholar : PubMed/NCBI
|
|
20
|
Batista RI, Luciano MC, Teixeira DI,
Freitas VJ, Melo LM, Andreeva LE, Serova IA and Serov OL:
Methodological strategies for transgene copy number quantification
in goats (Capra hircus) using real-time PCR. Biotechnol Prog.
30:1390–1400. 2014. View Article : Google Scholar : PubMed/NCBI
|
|
21
|
Song P, Cai C, Skokut M, Kosegi B and
Petolino J: Quantitative real-time PCR as a screening tool for
estimating transgene copy number in WHISKERS™-derived transgenic
maize. Plant Cell Rep. 20:948–954. 2002. View Article : Google Scholar
|
|
22
|
Freude S, Heise T, Woerle HJ, Jungnik A,
Rauch T, Hamilton B, Schölch C, Huang F and Graefe-Mody U: Safety,
pharmacokinetics and pharmacodynamics of BI 135585, a selective
11β-hydroxysteroid dehydrogenase-1 HSD1 inhibitor in humans: Liver
and adipose tissue 11β-HSD1 inhibition after acute and multiple
administrations over 2 weeks. Diabetes Obes Metab. 18:483–490.
2016. View Article : Google Scholar : PubMed/NCBI
|
|
23
|
Campbell JE, Ussher JR, Mulvihill EE,
Kolic J, Baggio LL, Cao X, Liu Y, Lamont BJ, Morii T, Streutker CJ,
et al: TCF1 links GIPR signaling to the control of beta cell
function and survival. Nat Med. 22:84–90. 2016. View Article : Google Scholar : PubMed/NCBI
|
|
24
|
Herbach N: Clinical and pathological
characterization of a novel transgenic animal model of diabetes
mellitus expressing a dominant negative glucose-dependent
insulinotropic polypeptide receptor (GIPR dn). Ludwig Maximilians
Universitat Munchen; Munich, Germany: 2002
|
|
25
|
Matveyenko AV and Butler PC: Islet amyloid
polypeptide (IAPP) transgenic rodents as models for type 2
diabetes. ILAR J. 47:225–233. 2006. View Article : Google Scholar : PubMed/NCBI
|
|
26
|
Eizirik DL, Cardozo AK and Cnop M: The
role for endoplasmic reticulum stress in diabetes mellitus. Endocr
Rev. 29:42–61. 2008. View Article : Google Scholar : PubMed/NCBI
|
|
27
|
Yang SL, Xia JH, Zhang YY, Fan JG, Wang H,
Yuan J, Zhao ZZ, Pan Q, Mu YL, Xin LL, et al: Hyperinsulinemia
shifted energy supply from glucose to ketone bodies in early
nonalcoholic steatohepatitis from high-fat high-sucrose diet
induced Bama minipigs. Sci Rep. 5:139802015. View Article : Google Scholar : PubMed/NCBI
|
|
28
|
Fang X, Mou Y, Huang Z, Li Y, Han L, Zhang
Y, Feng Y, Chen Y, Jiang X, Zhao W, et al: The sequence and
analysis of a Chinese pig genome. GigaScience. 1:1–11. 2012.
View Article : Google Scholar : PubMed/NCBI
|
|
29
|
Bustin SA: Absolute quantification of mRNA
using real-time reverse transcription polymerase chain reaction
assays. J Mol Endocrinol. 25:169–193. 2000. View Article : Google Scholar : PubMed/NCBI
|
|
30
|
Lin WS, Wang P, Cheng X, Yuan SL, Chen HX,
Lin YL, Tao HX, Wang YC and Wang LC: Estimation of the copy numbers
of exogenous gene in transgenic mice using the real-time
fluorescence quantitative PCR based comparative Ct method. Lett
Biotechnol. 11:301–305. 2013.
|
|
31
|
Li L, Li Q, Bao Y, Li J, Chen Z, Yu X,
Zhao Y, Tian K and Li N: RNAi-based inhibition of porcine
reproductive and respiratory syndrome virus replication in
transgenic pigs. J Biotechnol. 171:17–24. 2014. View Article : Google Scholar : PubMed/NCBI
|
|
32
|
Armour JA, Sismani C, Patsalis PC and
Cross G: Measurement of locus copy number by hybridisation with
amplifiable probes. Nucleic Acids Res. 28:605–609. 2000. View Article : Google Scholar : PubMed/NCBI
|
|
33
|
D'haene B, Vandesompele J and Hellemans J:
Accurate and objective copy number profiling using real-time
quantitative PCR. Methods. 50:262–270. 2010. View Article : Google Scholar : PubMed/NCBI
|
|
34
|
Kai LI, Gao HL, Gao L, Xiaole QI, Gao YL,
Yanwei XU and Wang XM: Development of a real-time PCR for
determination of foreign gene copy number in genome of pichia
pastoris. Chin J Anim Vet Sci. 42:742–746. 2011.
|
|
35
|
Yu L, Liu JP, Zhuang ZX, Yang LQ, Zhang
RL, Ye XM and Cheng JQ: Quantitative analysis of real-time PCR
expression production by REST and 2~((−ΔΔCT)). J Trop Med.
10:0082007.
|
|
36
|
Haurogné K, Bach JM and Lieubeau B: Easy
and rapid method of zygosity determination in transgenic mice by
SYBR Green real-time quantitative PCR with a simple data analysis.
Transgenic Res. 16:127–131. 2007. View Article : Google Scholar : PubMed/NCBI
|
|
37
|
Tang W, Newton RJ and Weidner DA: Genetic
transformation and gene silencing mediated by multiple copies of a
transgene in eastern white pine. J Exp Bot. 58:545–554. 2007.
View Article : Google Scholar : PubMed/NCBI
|
|
38
|
Vaucheret H and Fagard M: Transcriptional
gene silencing in plants: Targets, inducers and regulators. Trends
Genet. 17:29–35. 2001. View Article : Google Scholar : PubMed/NCBI
|
|
39
|
Zhang R, Yin Y, Zhang Y, Li K, Zhu H, Gong
Q, Wang J, Hu X and Li N: Molecular characterization of transgene
integration by next-generation sequencing in transgenic cattle.
PLoS One. 7:e503482012. View Article : Google Scholar : PubMed/NCBI
|
|
40
|
Wu Y, Fan H, Jing S, Xia J, Chen Y, Zhang
L, Gao X, Li J, Gao H and Ren H: A genome-wide scan for copy number
variations using high-density single nucleotide polymorphism array
in Simmental cattle. Anim Genet. 46:289–298. 2015. View Article : Google Scholar : PubMed/NCBI
|
|
41
|
Arrossi AV, Merzianu M, Farver C, Yuan C,
Wang SH, Nakashima MO and Cotta CV: Nodular pulmonary light chain
deposition disease: An entity associated with Sjögren syndrome or
marginal zone lymphoma. J Clin Pathol. 69:490–496. 2016. View Article : Google Scholar : PubMed/NCBI
|
|
42
|
Tessereau C, Léoné M, Buisson M, Duret L,
Sinilnikova OM and Mazoyer S: Occurrence of a non deleterious gene
conversion event in the BRCA1 gene. Genes Chromosomes Cancer.
54:646–652. 2015. View Article : Google Scholar : PubMed/NCBI
|
|
43
|
Lachaud C, Moreno A, Marchesi F, Toth R,
Blow JJ and Rouse J: Ubiquitinated Fancd2 recruits Fan1 to stalled
replication forks to prevent genome instability. Science.
351:846–849. 2016. View Article : Google Scholar : PubMed/NCBI
|
|
44
|
Hastings PJ, Lupski JR, Rosenberg SM and
Ira G: Mechanisms of change in gene copy number. Nat Rev Genet.
10:551–564. 2009. View Article : Google Scholar : PubMed/NCBI
|
|
45
|
Alessio AP, Fili AE, Garrels W, Forcato
DO, Nicotra Olmos MF, Liaudat AC, Bevacqua RJ, Savy V, Hiriart MI,
Talluri TR, et al: Establishment of cell-based transposon-mediated
transgenesis in cattle. Theriogenology. 85:1297–1311. 2016.
View Article : Google Scholar : PubMed/NCBI
|
|
46
|
Ruan J, Li H, Xu K, Wu T, Wei J, Zhou R,
Liu Z, Mu Y, Yang S, Ouyang H, et al: Highly efficient
CRISPR/Cas9-mediated transgene knockin at the H11 locus in pigs.
Sci Rep. 5:142532015. View Article : Google Scholar : PubMed/NCBI
|