Introduction
Gastric cancer (GC, additionally termed stomach
cancer) is derived from gastric mucosa (1), 60% of which is induced by infection
with the bacterium Helicobacter pylori (2–4). GC
is characterized by several early signs (including heartburn, lack
of appetite, nausea and upper abdominal pain) and certain later
symptoms (including weight loss, dysphagia, vomiting and yellowing
of the whites of the eyes and skin) (5). If left untreated, GC may undergo
diffusion transfer to other parts of the body, including the lungs,
liver, lymph nodes and bones (6).
The 5-year survival rate of patients with GC is <10% worldwide,
and late discovery of illness may the worsen prognosis (7). Globally, there were 950,000 new cases
of GC and 723,000 mortalities in 2012 (3). Therefore, early diagnosis, reasonable
prognostic assessment, and timely and appropriate intervention are
very important to improving the outcomes of GC.
The study of large numbers of prognostic markers may
guide the clinical monitoring of patients at a high risk of
relapse, and further treatment may be administered to improve the
survival rate of patients with GC. Previous studies have
demonstrated that astrocyte elevated gene 1 overexpression serves
as a promising prognostic factor for GC, and targeted inhibition
thereof may be a novel therapeutic strategy for the disease
(8,9). The expression of human epidermal
growth factor receptor 2 can be used to predict sensitivity to
trastuzumab-based chemotherapy and the overall survival of patients
with advanced GC (10).
Adenine-thymine-rich interactive domain 1A is reported to be a
potential prognostic marker and therapeutic target for GC (11,12).
The accuracies of these different biomarkers were not the same,
thus more relevant prognostic factors are required. Okugawa et
al (13) reported that the
brain-derived neutrophic factor (BDNF)/neurotrophic receptor
tyrosine kinase 2 (TrkB) axis has an association with the prognosis
of patients with GC, and the BDNF/TrkB pathway may serve an
important role in the progression of GC. At present, the prognosis
of GC primarily depends on such factors as serum markers and the
clinical condition of a patient (14,15).
Combining multiple relevant genes and clinical factors may improve
prognostic accuracy in GC.
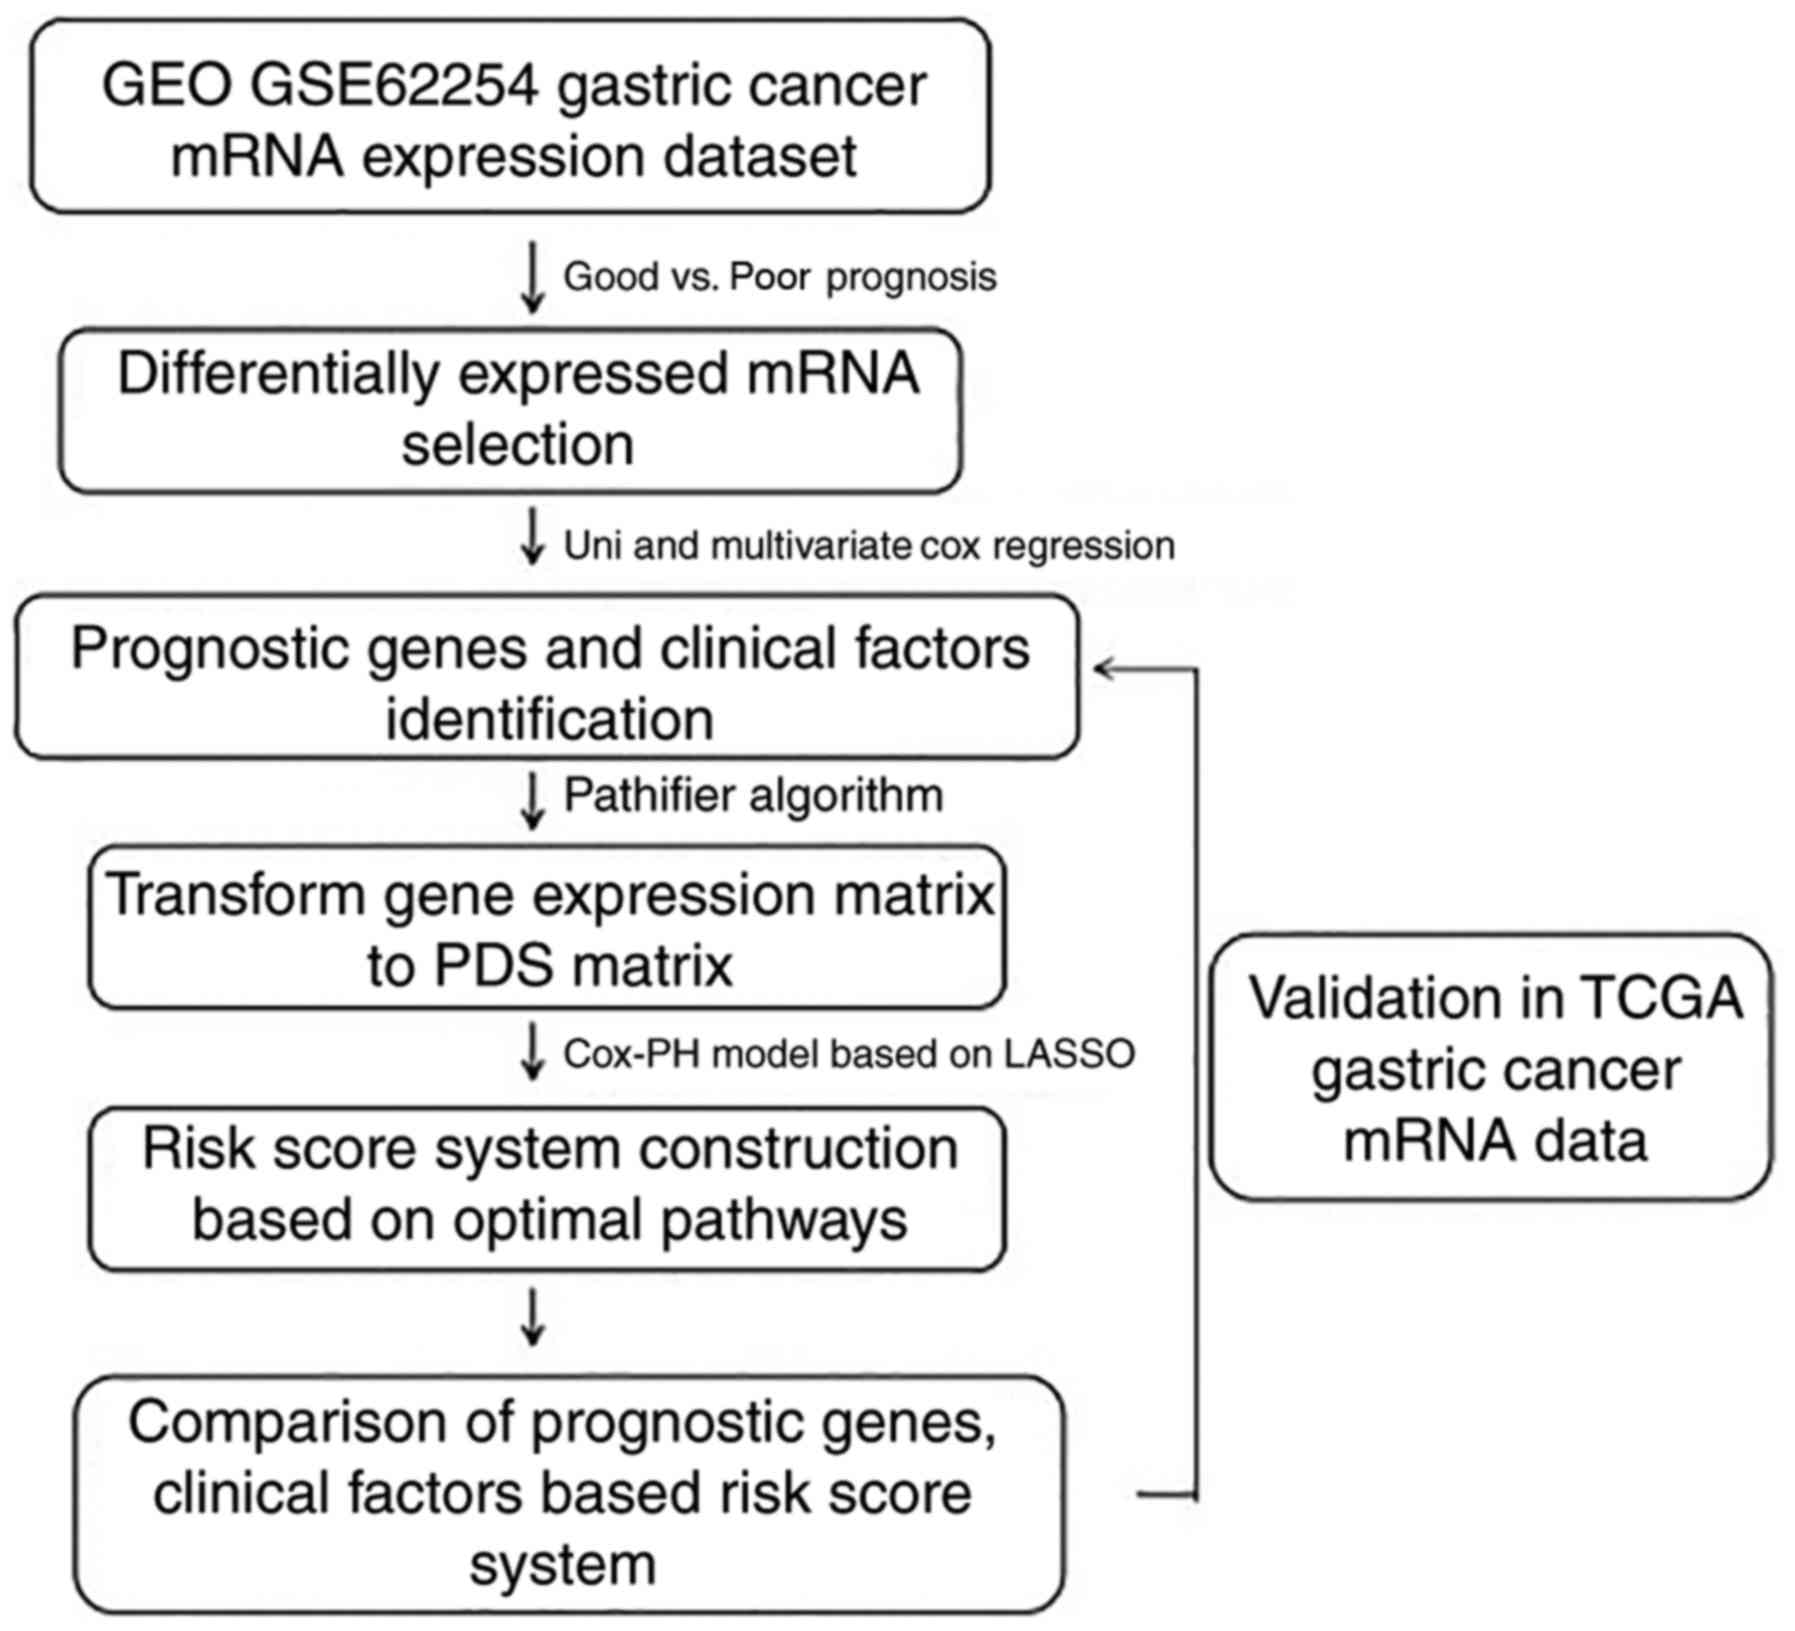
Huang et al (16) developed a novel computational model
for breast cancer prognosis by combining the pathway deregulation
score (PDS)-based pathifier algorithm, Cox proportional hazards
regression and the L1-lasso penalization method to select promising
targets for therapeutic intervention. Huang et al (17) developed a novel computational
method that uses personalized PDS with pathway-based metabolomics
data analysis for breast cancer diagnosis. However, few studies
have reported the value of pathway and clinical factor-based risk
models for GC prognosis. The present study adopted similar methods,
and aimed to investigate the prognostic ability of different risk
prediction models based on the identified pathways and clinical
factors associated with the prognosis of GC (Fig. 1).
Materials and methods
Data source
Gene expression profiles of the GSE62254 dataset
(18) [platform: GPL570
(HG-U133_Plus_2) Affymetrix (Thermo Fisher Scientific, Inc.,
Waltham, MA, USA) Human Genome U133 Plus 2.0 Array] were obtained
from the Gene Expression Omnibus (GEO; www.ncbi.nlm.nih.gov/geo) database. GSE62254 consisted
of 300 GC tissue samples and served as a training set in the
present study. These GC tissue samples were obtained from patients
during gastrectomy procedures at Samsung Medical Centre, Seoul,
Korea (2004–2007). Another mRNA-sequencing dataset for GC
[platform: Illumina, Inc. (San Diego, CA, USA) HiSeq 2000 RNA
Sequencing] was downloaded from The Cancer Genome Atlas (TCGA;
cancergenome.nih.gov). This
mRNA-sequencing dataset, containing 384 GC tissue samples, was
taken as a validation set. The demographic and clinical
characteristics of all samples in the training and validation set
are presented in Table I. In order
to eliminate the technology bias in systematic measurement between
the distinct datasets and platforms, these two datasets were
independently standardized (19).
 | Table I.Clinical characteristics of patients
in the training set (GSE62254) and the validation set (TCGA
dataset). |
Table I.
Clinical characteristics of patients
in the training set (GSE62254) and the validation set (TCGA
dataset).
| Clinical
characteristics | GSE62254
(n=300) | TCGA (n=384) |
|---|
| Age, years (mean ±
standard deviation) | 61.94±11.36 | 65.15±10.61 |
| Sex,
male/female | 199/101 | 243/133/8 |
| Pathologic_M,
M0/M1/- | 273/27 | 341/19/24 |
| Pathologic_N,
N0/N1/N2/N3 | 38/131/80/51 | 118/100/77/16 |
| Pathologic_T,
T1/T2/T3/T4/- | 2/186/91/21 |
20/74/172/107/11 |
| Pathologic_stage,
I/II/III/IV/- | 30/96/95/77/2 |
51/116/174/31/12 |
| Pathology type,
diffuse/intestinal/mixed/- | 134/146/17/3 | – |
| MLH1 mutation,
yes/no/- | 234/64/2 | 18/366 |
| EBV infection,
yes/no/- | 18/257/25 | – |
| Recurrence,
yes/no/- | 125/157/18 | 78/260/46 |
| Venous invasion,
yes/no/- | 44/129/127 | – |
| Lymphatic
lymphovascular invasion, yes/no/- | 205/73/22 | – |
| Subtypes,
MSS-TP53‒/MSS-TP53+/MSI-EMT/- | 107/79/68/46 | – |
| Mortality,
deceased/alive/- | 135/148//17 | 122/238/24 |
| Disease-free
survival, months (mean ± standard deviation) | 33.72±29.82 | 15.84±17.05 |
| Overall survival
time, months (mean ± standard deviation) | 50.59±31.42 | 16.17±16.96 |
Data preprocessing and differentially
expressed gene (DEG) screening
The background correction and data normalization of
GSE62254 were performed using the oligo package (www.bioconductor.org/packages/release/bioc/html/oligo.html)
(20) in R (21). Based on the prognostic information,
samples were divided into two groups: A poor prognosis group
(samples from patients who survived for <12 months and were
deceased), and a good prognosis group (samples from patients who
survived for >60 months and were alive). Subsequently, the
t-test (127.0.0.1:26738/library/stats/html/t.test.html)
(22) and the Wilcoxon test
(127.0.0.1:26738/library/stats/html/wilcox.test.html)
(23) in R were used for screening
the genes that were significantly differentially expressed between
the poor prognosis group and the good prognosis group. A false
discovery rate <0.05 and |log fold change| >0.263 were
considered to be the thresholds. Overlapping DEGs predicted by the
t-test and Wilcoxon test were selected for further analysis.
Identification of prognosis-associated
genes and clinical factors
Prognosis-associated genes and clinical factors were
selected using univariate and multivariate Cox regression analysis
in the R survival package (bioconductor.org/packages/survivalr) (24). A P-value <0.05 was set as the
cut-off criterion. The expression values of the
prognosis-associated genes were extracted to perform bidirectional
hierarchical clustering (25)
using the R heatmap package (cran.r-project.org/web/packages/pheatmap/index.html)
(26). The purpose of the
hierarchical clustering analysis was to intuitively observe the
differences in prognosis-associated gene expression between
samples.
Selection of prognosis-associated
pathways
The Gene Set Enrichment Analysis (GSEA) database
(www.broadinstitute.org/gsea)
(27) is a microarray data
analysis tool containing multiple functions and pathways. All the
pathway annotation files of 217 Biocarta pathways and 186 Kyoto
Encyclopedia of Genes and Genomes (KEGG) pathways in the GSEA
database (27) were downloaded and
taken as reference pathways. Subsequently, the expression matrix of
the prognosis-associated genes was converted into a pathway
deregulation score (PDS) matrix of the relevant pathways using the
principal components analysis algorithm in the R pathifier package
(bioconductor.org/packages/pathifier) (28). The optimal prognosis-associated
pathways were screened subsequent to importing the PDS matrix using
the Cox proportional hazards (Cox-PH) model in the R penalized
package (bioconductor.org/packages/penalized) (29). The parameter ‘lambda’ was obtained
upon performing 1,000 rounds of cross-validation likelihood (cvl)
(30) circular calculation.
Construction and validation of risk
prediction models
Based on the Cox-PH prognosis coefficients of the
optimal prognosis-associated pathways, the pathway-based risk
prediction model was constructed and the prognosis index (PI) score
of each sample was calculated. According to the median of the PI
scores, the samples in the training set were divided into high- and
low-risk groups. The correlations between the risk prediction model
and prognosis were estimated using the Kaplan-Meier (KM) method in
the R survival package (24). In
addition, the risk prediction model was validated using the
validation set.
Using the Cox-PH model in the R penalized package
(29), the optimal
prognosis-associated genes were identified following importing of
the gene expression matrix of the prognosis-associated genes. The
gene-based risk prediction model was built and the PI score of each
sample was calculated based on the Cox-PH prognosis coefficients of
the optimal prognosis-associated genes. The median of the PI scores
was considered the demarcation point, and the samples in the
training set were additionally divided into high- and low-risk
groups. Using KM survival curves, the correlations between the
gene-based risk prediction model and prognosis were evaluated in
the training set and the validation set. The predictive effects of
the gene-based risk prediction model were compared to those of the
pathway-based risk prediction model.
Using the Cox-PH model, the prognosis coefficients
of the prognosis-associated clinical factors were determined, and a
clinical factor-based risk prediction model was constructed. The PI
scores of the samples were calculated. Subsequently, the samples in
the training set were divided into high- and low-risk groups, with
their median PI as the demarcation point. Using KM survival curves,
the correlations between the clinical-factor-based risk prediction
model and prognosis were assessed in the training set and the
validation set. Furthermore, the predictive effects of the clinical
factor-based risk prediction model were compared with those of the
pathway-based risk prediction model.
When the Cox-PH prognosis coefficients of the
optimal prognosis-associated pathways had been integrated with
those of the prognosis-associated clinical factors, a risk
prediction model was constructed based on clinical factors and
pathways. The PI score of each sample was calculated, and their PI
median was taken as the demarcation point to divide the samples in
the training set into high- and low-risk groups. Additionally, the
correlations between the risk prediction model and prognosis were
estimated in the training set and the validation set. Finally, the
predictive effects of the risk prediction model based on clinical
factors and pathways were compared with those of the pathway-based
risk prediction model.
Results
DEG screening
According to the prognostic information, 48 samples
were classified into a poor prognosis group and 58 samples into a
good prognosis group. A total of 617 DEGs and 671 DEGs were
identified by the t-test and Wilcoxon test, respectively. The 382
overlapping DEGs (268 upregulated genes and 114 downregulated
genes) were used for further analysis.
Identification of the
prognosis-associated genes and clinical factors
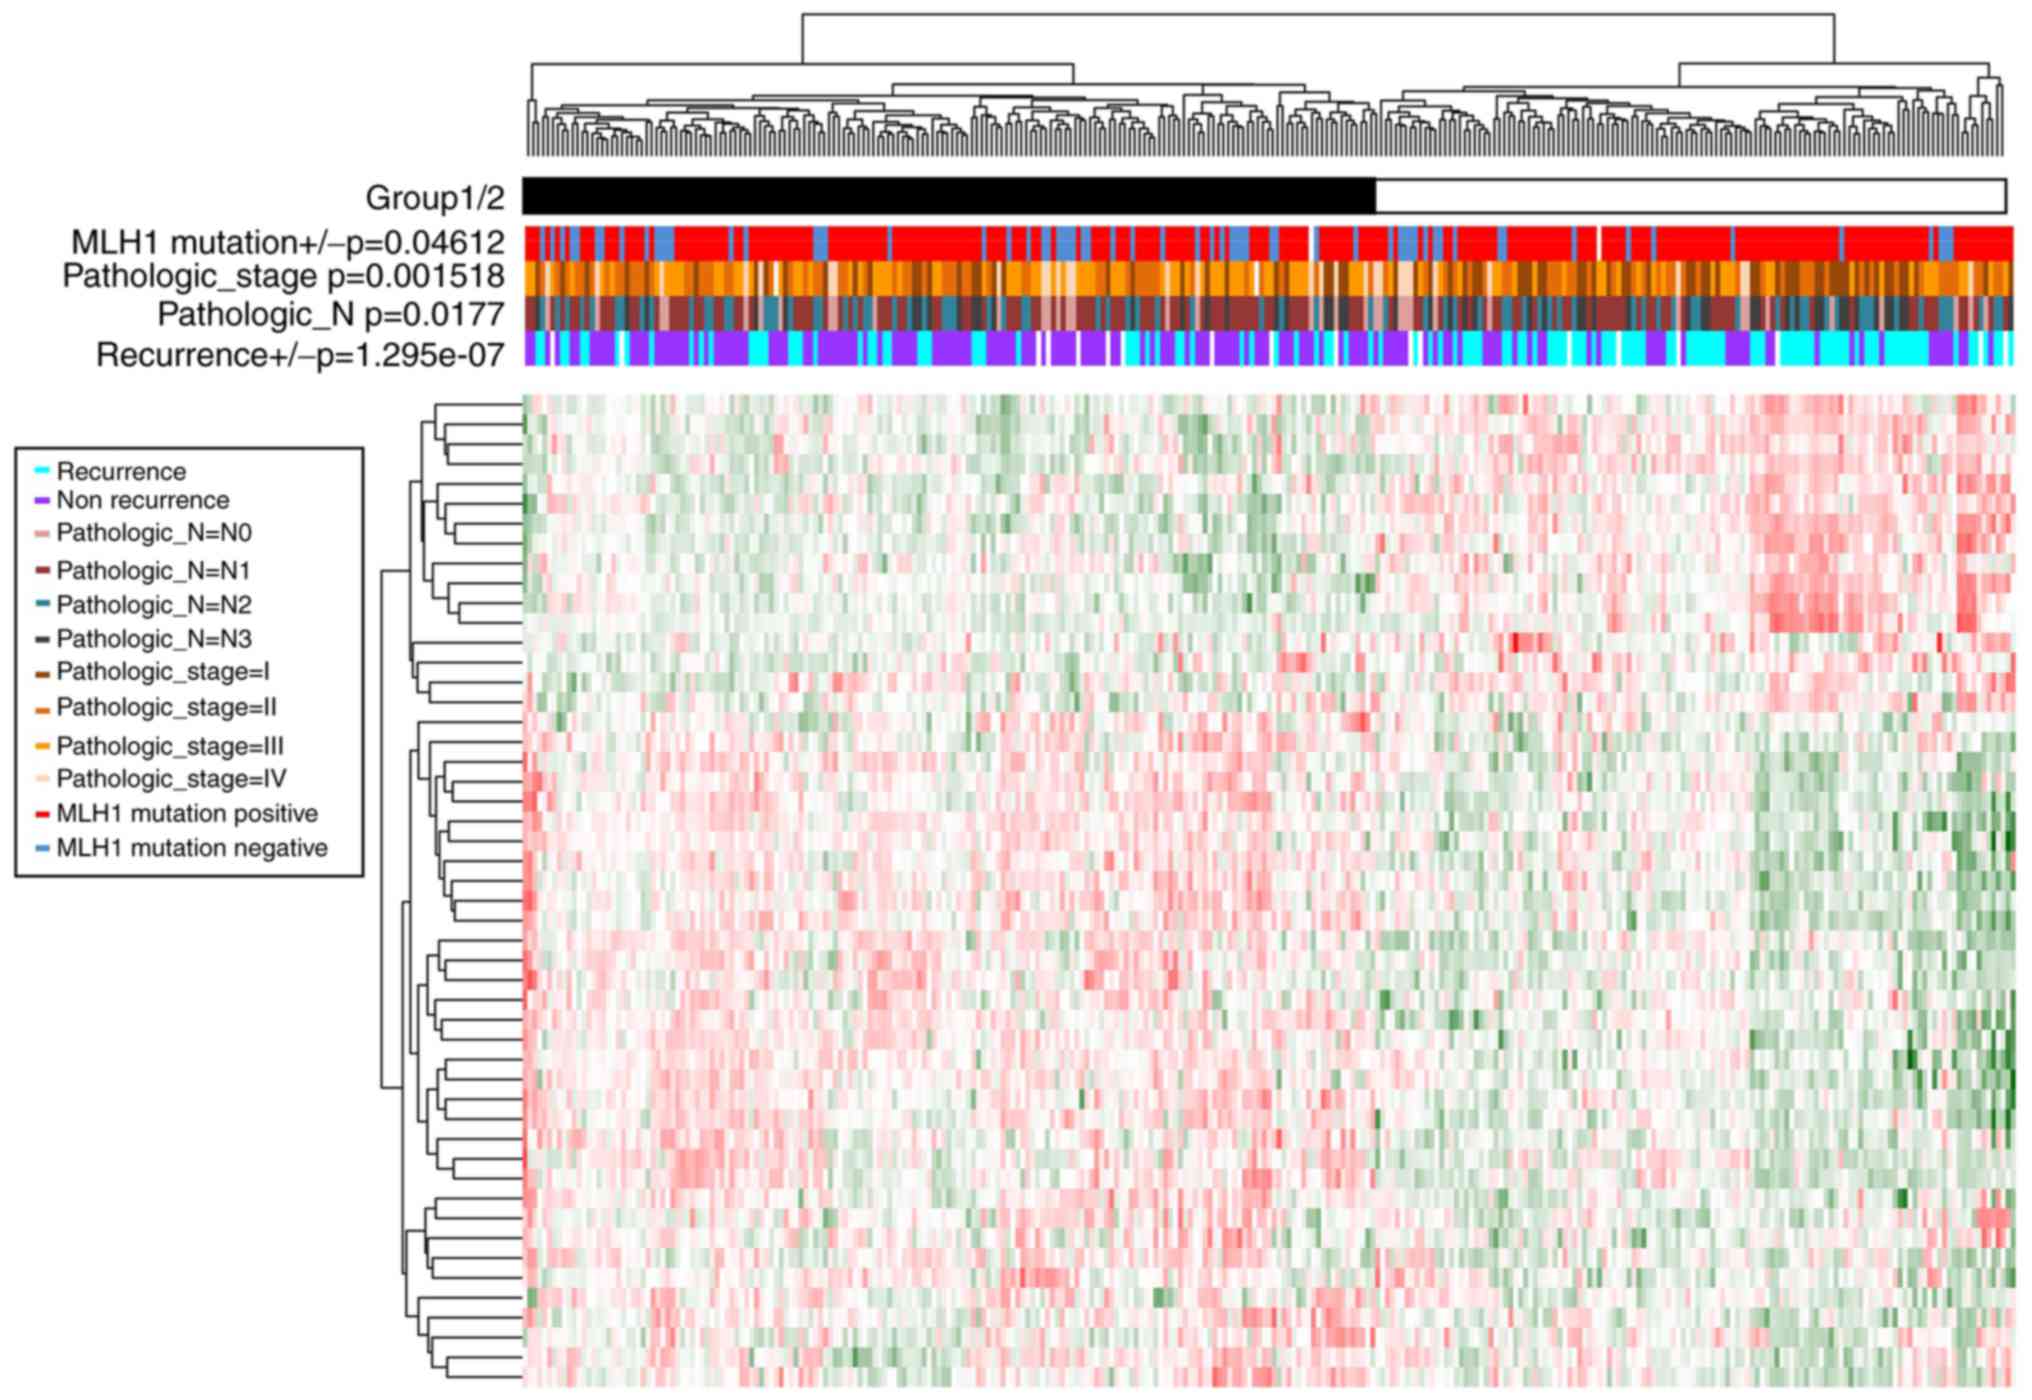
A total of 50 prognosis-associated genes (Table II) and four prognosis-associated
clinical factors [including Pathologic_N, Pathologic_stage, mutL
homolog 1 (MLH1) mutation, and recurrence] (Table III) were screened based on the
Cox regression analysis. Samples were divided into group 1
(including 173 GC samples) and group 2 (including 127 GC samples)
according to the clustering analysis of prognosis-associated genes
(Fig. 2). Moreover, significant
differences were observed in the recurrence
(P=1.29×10⁻⁷), Pathologic_N (P=1.77×10⁻²),
Pathologic_stage (P=1.52×10⁻³), and MLH1 mutation
(P=4.61×10⁻²) between the two groups. Group 1 had less
recurrence, less lymphatic metastasis, lower tumor stage and more
MLH1 mutations compared with group 2.
| Table II.Prognosis-associated genes (n=50)
identified by the Cox regression analysis. |
Table II.
Prognosis-associated genes (n=50)
identified by the Cox regression analysis.
| Gene | Univariate cox
P-value | Multivariate cox
P-value |
|---|
| TTC38 |
4.70×10‒02 |
3.62×10‒06 |
| DNAJC16 |
1.30×10‒04 |
1.87×10‒05 |
| RAB11FIP4 |
3.40×10‒06 |
1.09×10‒04 |
| CDC42EP5 |
1.00×10‒08 |
5.42×10‒04 |
| MYH14 |
3.20×10‒06 |
6.85×10‒04 |
| LRRC31 |
3.00×10‒02 |
7.77×10‒04 |
| SIAE |
2.90×10‒06 |
1.53×10‒03 |
| SP6 |
1.50×10‒03 |
1.76×10‒03 |
| PKD2 |
1.90×10‒06 |
2.03×10‒03 |
| UBE2E2 |
1.70×10‒04 |
2.13×10‒03 |
| TNFRSF11A |
2.20×10‒09 |
2.41×10‒03 |
| RBPMS2 |
4.90×10‒14 |
2.42×10‒03 |
| SLC45A3 |
3.30×10‒02 |
3.76×10‒03 |
| ANKRD6 |
4.50×10‒06 |
3.83×10‒03 |
| EGR2 |
3.60×10‒02 |
3.89×10‒03 |
| TMPRSS4 |
4.80×10‒03 |
4.44×10‒03 |
| TTC7B |
1.40×10‒04 |
4.57×10‒03 |
| INHBB |
1.10×10‒06 |
4.80×10‒03 |
| LYPD1 |
7.70×10‒05 |
5.76×10‒03 |
| C1orf216 |
1.00×10‒03 |
5.87×10‒03 |
| CTHRC1 |
3.20×10‒02 |
6.03×10‒03 |
| DHRS11 |
1.10×10‒02 |
6.35×10‒03 |
| PBX3 |
4.40×10‒07 |
6.61×10‒03 |
| PIK3R3 |
2.00×10‒03 |
7.17×10‒03 |
| PCSK7 |
4.50×10‒06 |
8.36×10‒03 |
| DFNA5 |
5.50×10‒06 |
9.16×10‒03 |
| CATSPERB |
5.30×10‒03 |
9.93×10‒03 |
| PPARG |
6.20×10‒05 |
1.06×10‒02 |
| SLC44A3 |
4.60×10‒03 |
1.38×10‒02 |
| STAMBPL1 |
2.20×10‒04 |
1.74×10‒02 |
| ALPK1 |
6.80×10‒07 |
1.76×10‒02 |
| SERAC1 |
5.70×10‒05 | 1.78×10v |
| BCAR3 |
1.60×10‒02 |
2.02×10‒02 |
| TJP3 |
1.90×10‒03 |
2.20×10‒02 |
| TMEM144 |
3.70×10‒06 |
2.22×10‒02 |
| STARD5 |
8.40×10‒04 |
2.33×10‒02 |
| BPNT1 |
8.20×10‒05 |
2.36×10‒02 |
| CCDC92 |
9.00×10‒07 |
2.52×10‒02 |
| RNF170 |
2.60×10‒03 |
2.58×10‒02 |
| FBXL6 |
1.20×10‒03 |
2.83×10‒02 |
| CASP7 |
6.70×10‒11 |
3.01×10‒02 |
| RILPL1 |
1.30×10‒07 |
3.17×10‒02 |
| KLHDC8B |
1.80×10‒07 |
3.34×10‒02 |
| HOXC4 |
3.40×10‒04 |
3.62×10‒02 |
| FAM83E |
1.10×10‒02 |
3.71×10‒02 |
| MFSD9 |
2.20×10‒04 |
3.98×10‒02 |
| ZNRF2 |
5.10×10‒07 |
4.01×10‒02 |
| NMNAT1 |
2.50×10‒08 |
4.18×10‒02 |
| BTNL3 |
5.40×10‒03 |
4.65×10‒02 |
| F12 |
5.30×10‒05 |
4.96×10‒02 |
| Table III.Prognosis-associated clinical factors
and the optimal prognosis-associated pathways in the Cox-PH
model. |
Table III.
Prognosis-associated clinical factors
and the optimal prognosis-associated pathways in the Cox-PH
model.
| Feature | Description | Coefficient | Hazard ratio | P-value (univariate
Cox-PH) |
|---|
| Pathway |
BIOCARTA_DEATH_PATHWAY | 0.115 | 1.966 |
8.73×10‒06 |
|
|
BIOCARTA_DNAFRAGMENT_PATHWAY | 0.188 | 1.716 |
1.51×10‒05 |
|
|
BIOCARTA_MITOCHONDRIA_PATHWAY | 0.614 | 3.156 |
4.62×10‒06 |
|
|
BIOCARTA_PARKIN_PATHWAY | 0.285 | 1.737 |
2.06×10‒05 |
|
|
KEGG_CHRONIC_MYELOID_LEUKEMIA | −0.029 | 0.398 |
1.36×10‒04 |
|
|
KEGG_ENDOMETRIAL_CANCER | −0.299 | 0.260 |
1.02×10‒02 |
|
|
KEGG_ERBB_SIGNALING_PATHWAY | −0.180 | 0.849 |
4.94×10‒03 |
|
|
KEGG_FC_EPSILON_RI_SIGNALING_PATHWAY | −0.096 | 0.619 |
6.39×10‒03 |
|
|
KEGG_FOCAL_ADHESION | −0.562 | 0.178 |
1.54×10‒02 |
|
|
KEGG_JAK_STAT_SIGNALING_PATHWAY | −0.256 | 0.374 |
4.50×10‒06 |
|
|
KEGG_LEUKOCYTE_TRANSENDOTHELIAL_MIGRATION | 0.344 | 1.031 |
2.22×10‒05 |
|
|
KEGG_NATURAL_KILLER_CELL_MEDIATED_CYTOTOXICITY | 0.024 | 1.062 |
1.33×10‒06 |
|
|
KEGG_NICOTINATE_AND_NICOTINAMIDE_METABOLISM | 0.359 | 1.569 |
8.86×10‒05 |
|
|
KEGG_PATHWAYS_IN_CANCER | −0.143 | 0.332 |
1.52×10‒06 |
|
|
KEGG_PPAR_SIGNALING_PATHWAY | −0.135 | 0.835 |
2.07×10‒04 |
|
|
KEGG_TIGHT_JUNCTION | 0.959 | 1.353 |
2.50×10‒13 |
| Clinical
factor | Recurrence | 2.074 | 2.574 |
2.00×10‒16 |
|
| Pathologic_N | 0.165 | 1.956 |
3.97×10‒13 |
|
|
Pathologic_stage | 0.233 | 2.215 |
6.66×10‒16 |
|
| MLH1 mutation | 0.024 | 2.027 |
2.69×10‒03 |
Selection of prognosis-associated
pathways
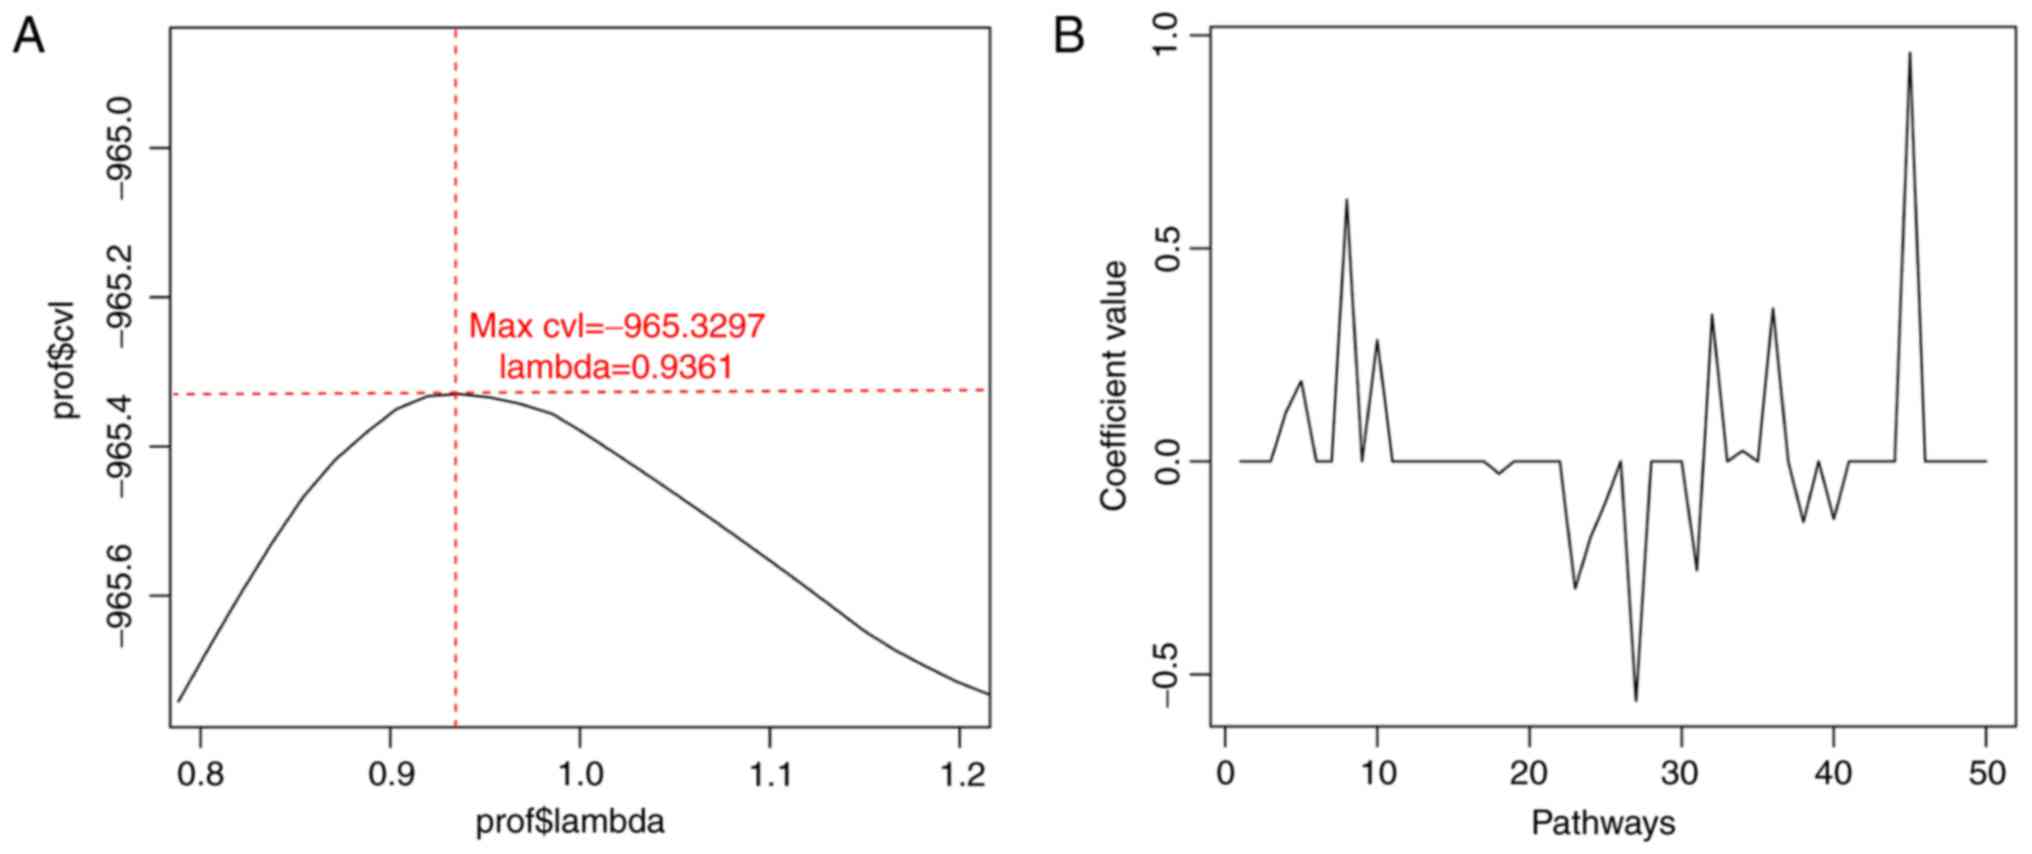
The expression matrix of the 50 prognosis-associated
genes was converted into a PDS matrix, and 118 GC-associated
pathways (including 26 Biocarta pathways and 92 KEGG pathways) were
selected. Based on cvl circular calculation, the maximum value of
cvl was −965.3297 (parameter ‘lambda’=0.9361) (Fig. 3). Furthermore, 16 optimal
prognosis-associated pathways including four Biocarta pathways
(including the mitochondrial pathway) and 12 KEGG pathways
[including the tyrosine-protein kinase JAK (JAK)-signal transducer
and activator of transcription (STAT) signaling pathway] were
obtained using the Cox-PH model with this parameter value (Table III). Meanwhile, 10
prognosis-associated genes [caspase 7 (CASP7), myosin heavy chain
14 (MYH14), nicotinamide nucleotide adenylyltransferase 1 (NMNAT1),
phosphoinositide-3-kinase regulatory subunit 3 (PIK3R3), peroxisome
proliferator activated receptor γ (PPARG), tight junction protein 3
(TJP3), cation channel sperm associated auxiliary subunit β
(CATSPERB), CDC43 effector protein 5 (CDC42EP5); collagen triple
helix repeat containing 1 (CTHRC1), and dehydrogenase/reductase 11
(DHRS11)] were involved in these 16 optimal prognosis-associated
pathways.
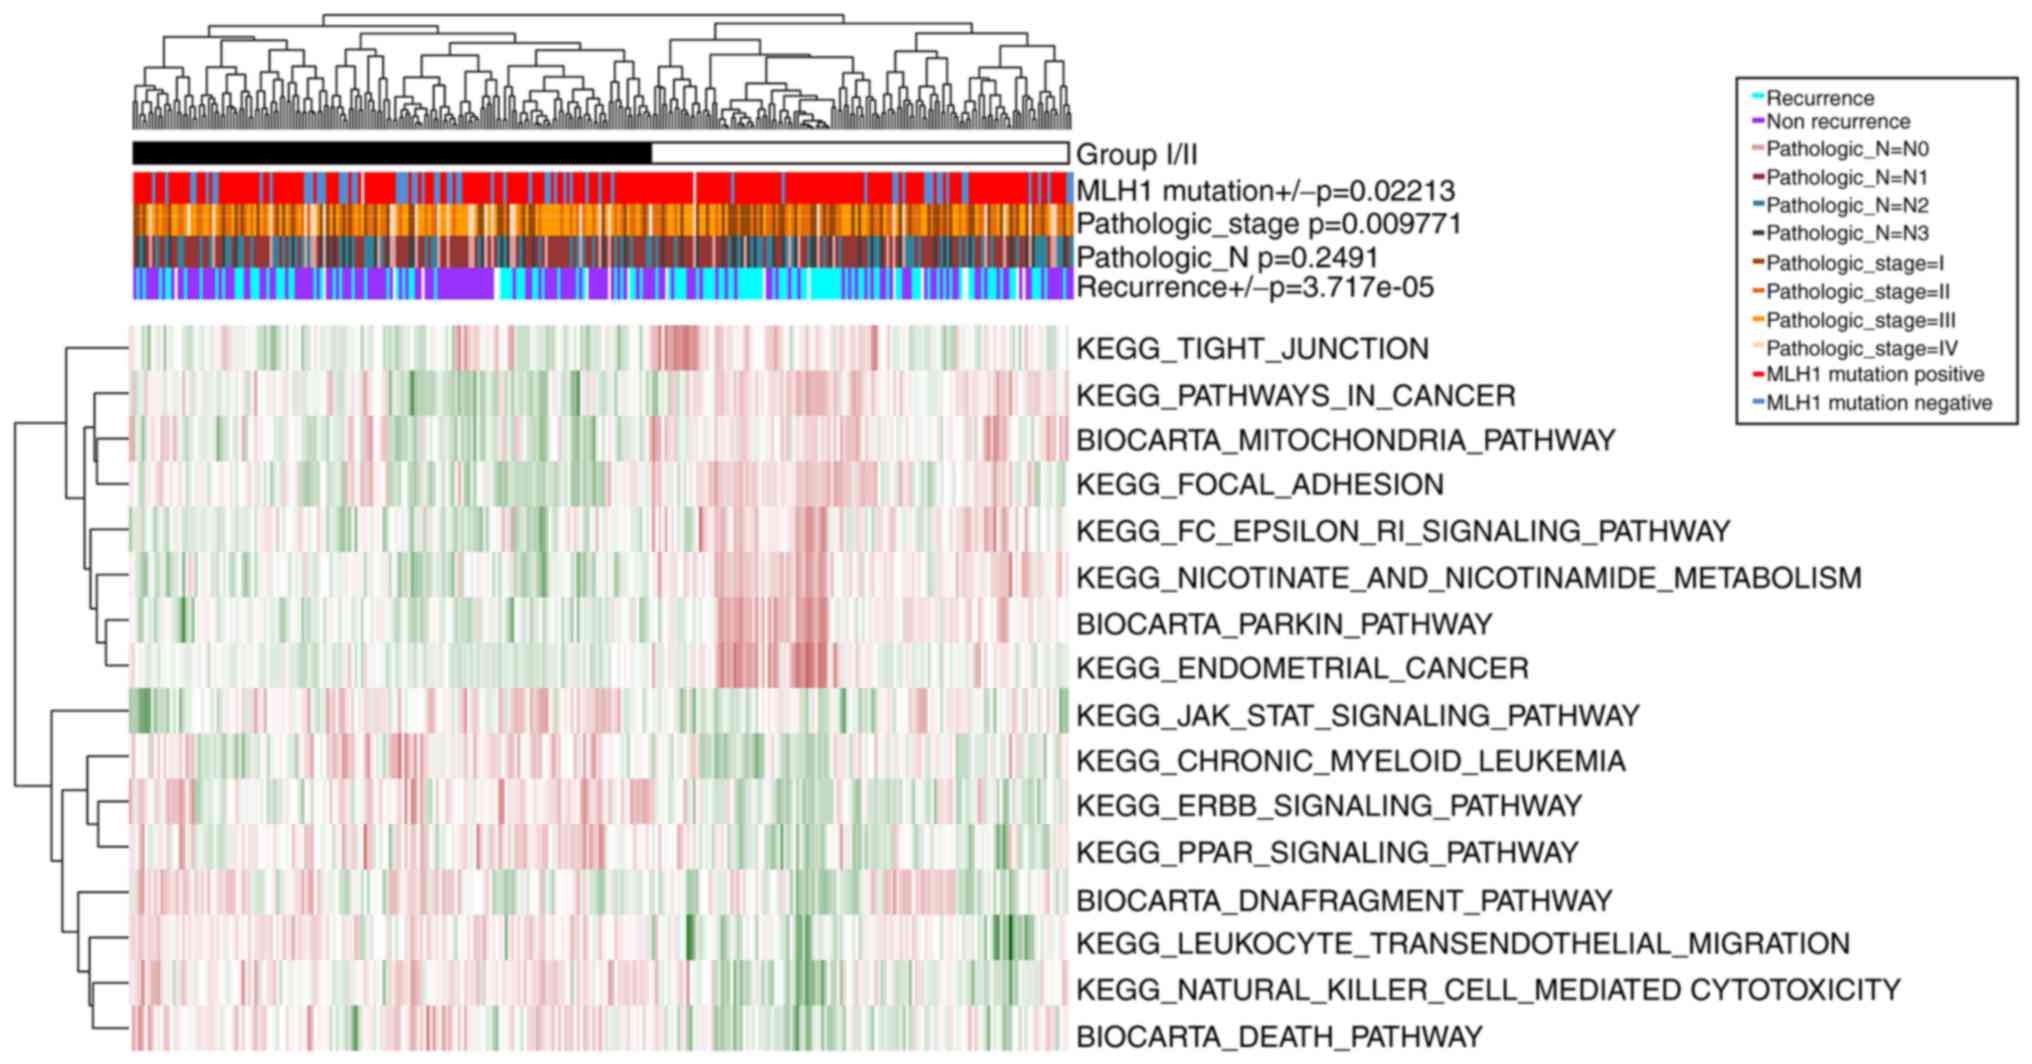
The samples in GSE62254 were divided into group I
(including 166 GC samples) and group II (including 134 GC samples),
according to the clustering analysis of the PDS matrix of the 16
optimal prognosis-associated pathways (Fig. 4). Similarly, there were significant
differences in recurrence (P=3.72×10⁻⁵),
Pathologic_stage (P=9.77×10⁻³), and MLH1 mutation
P=2.21×10⁻²) between these two groups. However, no
notable difference was observed in Pathologic_N
(P=2.49×10⁻¹). Thus, group I had less recurrence, lower
tumor stage and more MLH1 mutations compared with group II.
Construction and validation of risk
prediction models
The pathway-based risk prediction model was
constructed and the PI score of each sample was obtained.
Subsequently, the samples in the training set were divided into
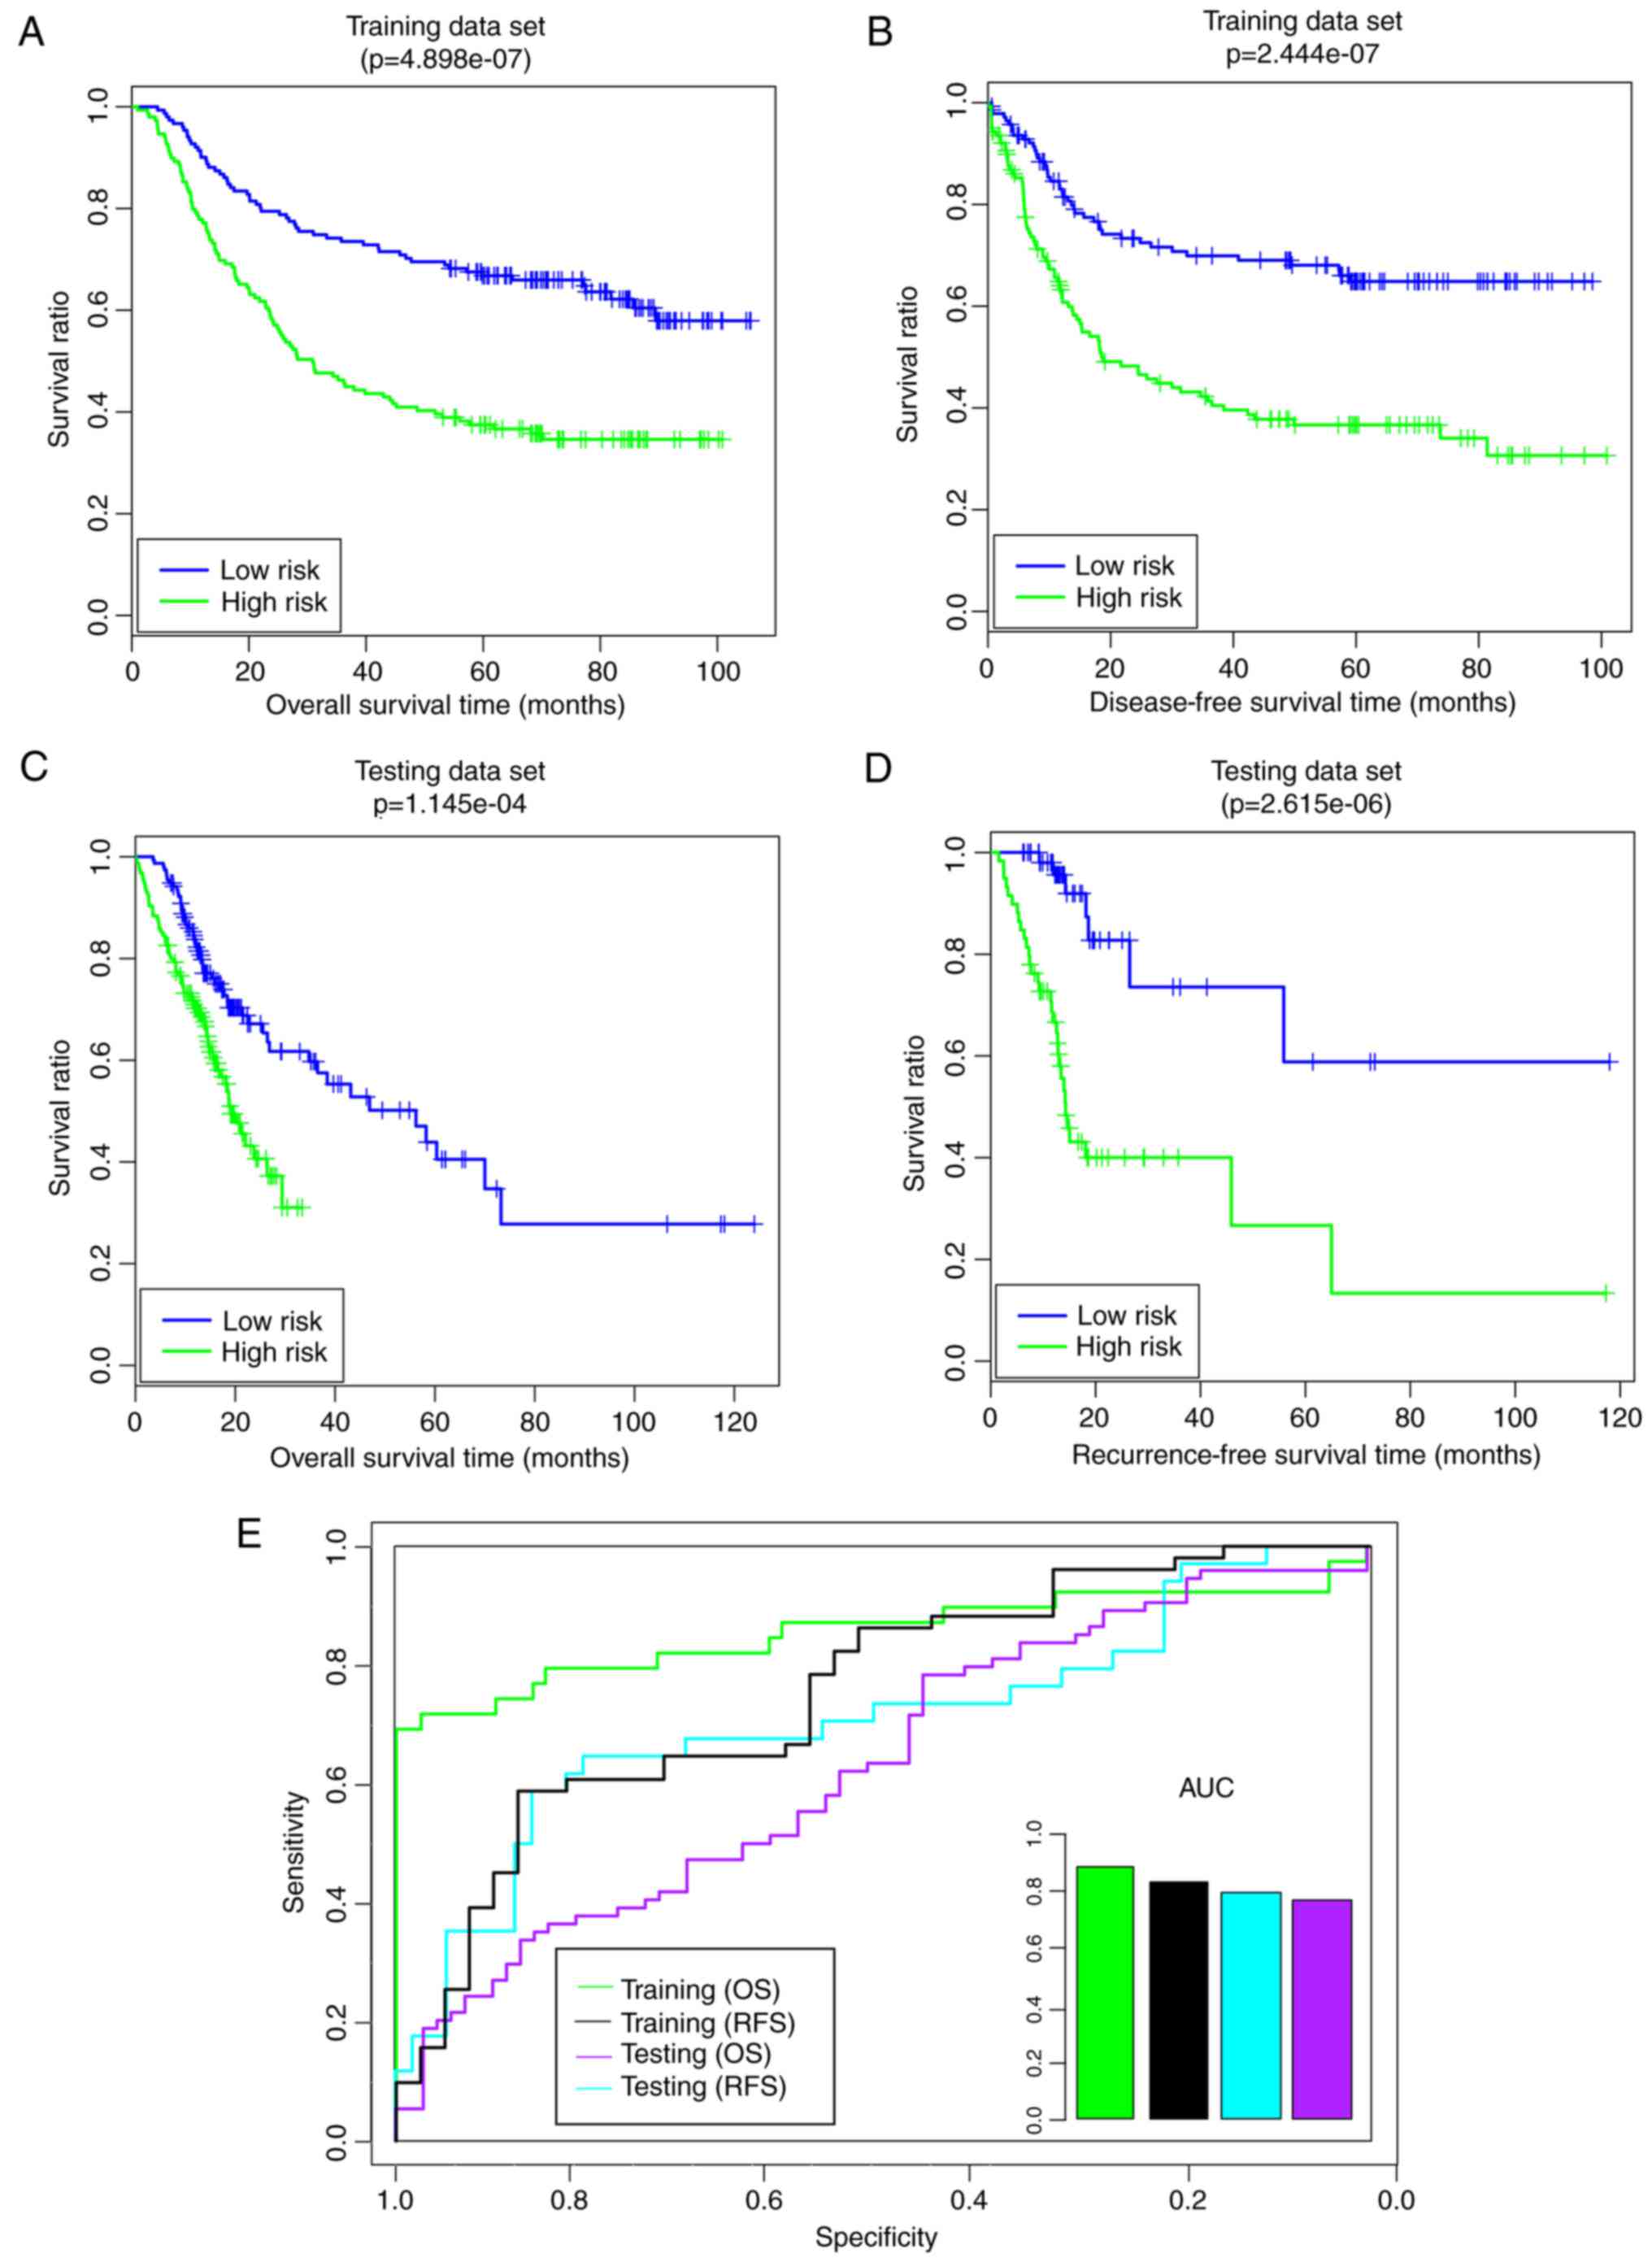
high- and low-risk groups (Fig.
5). Compared with the high-risk group, the low-risk group had a
longer overall survival (OS) time (59.85 29.87 months vs.
41.36±29.65 months) and recurrence-free survival (RFS) time
(44.65±28.99 months vs. 30.00±28.35 months) (Fig. 5A and B). The risk groups exhibited
significant correlations with OS time (P=4.90×10⁻⁷;
Fig. 5A) and RFS time
(P=2.44×10⁻⁷; Fig. 5B).
Furthermore, the area under the receiver operating characteristic
(AUROC) values of OS and RFS were 0.8554 and 0.809, respectively
(Fig. 5E). In the validation set,
the low-risk group additionally had a longer OS time (23.41±22.06
vs. 13.56±7.46 months) and RFS time (2.33±22.14 vs. 13.06±7.52
months) compared with the high-risk group (Fig. 5C and D). The risk groups had
significant correlations with OS time (P=1.15×10⁻⁴;
Fig. 5C) and RFS time
(P=2.62×10⁻⁶; Fig. 5D).
Furthermore, the AUROC values of OS and RFS were 0.733 and 0.7559,
respectively (Fig. 5E). These
results indicated that the pathway-based risk prediction model was
able to predict the consistent sample risk in the training set and
the validation set.
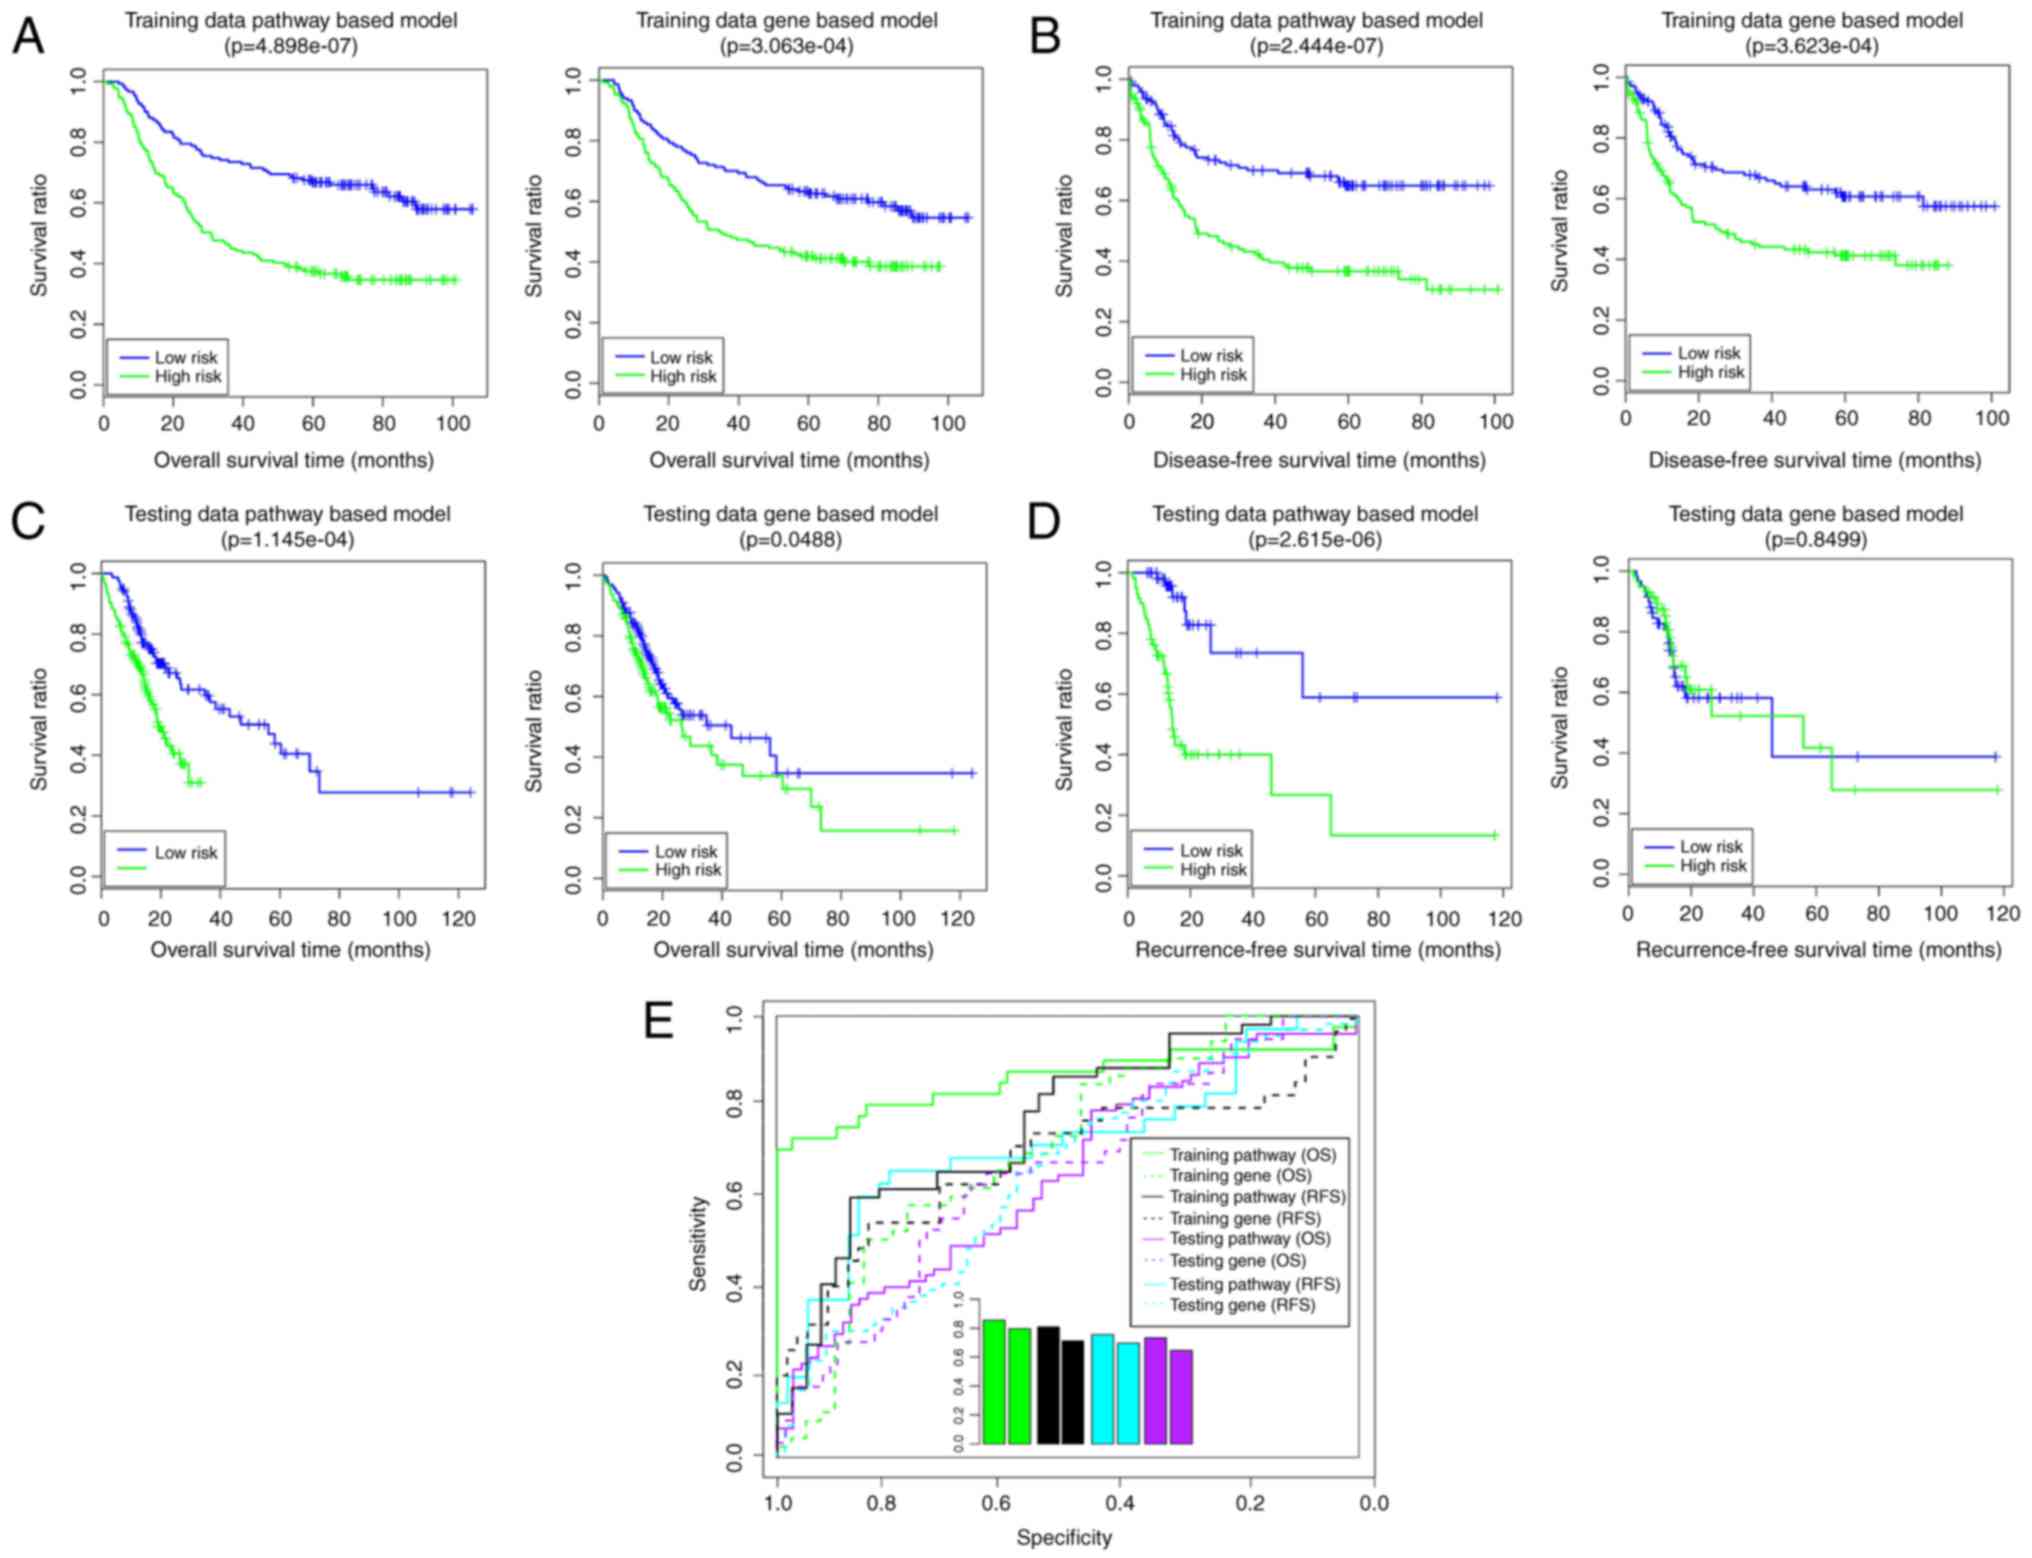
Using the Cox-PH model, 10 optimal
prognosis-associated genes were identified (Table IV). The gene-based risk prediction
model was built, and the samples in training set were divided into
high- and low-risk groups (Fig.
6). In the training set, the low-risk group had a longer OS
time (58.20±31.09 vs. 42.99±29.96 months) and RFS time (38.31±30.70
vs. 29.13±28.35 months) compared with the high-risk group (Fig. 6A and B). The risk groups had
significant correlations with OS time (P=3.06×10⁻⁴;
Fig. 6A) and RFS time
(P=3.62×10⁻⁴; Fig. 6B).
The AUROC values of OS and RFS were 0.7966 and 0.7129, respectively
(Fig. 6E). In the validation set,
the low-risk group had a longer OS time (23.85±23.02 vs.
18.18±21.58 months) and RFS time (18.95±17.73 vs. 18.78±19.48
months) compared with the high-risk group (Fig. 6C and D). The risk groups had a
significant correlation with OS time (P=4.88×10⁻²;
Fig. 6C), although not with RFS
time (P=8.50×10⁻¹; Fig.
6D). The AUROC values of OS and RFS were 0.6969 and 0.6453,
respectively (Fig. 6E). These
findings suggested that the gene-based risk prediction model was
not able to be completely verified in the validation set. In this
way, the pathway-based risk prediction model outperformed the
gene-based risk prediction model.
| Table IV.Optimal prognosis-associated genes
(n=10) identified by the Cox-PH model. |
Table IV.
Optimal prognosis-associated genes
(n=10) identified by the Cox-PH model.
| Gene | Coefficient | Hazard ratio | P-value (univariate
Cox-PH) |
|---|
| CATSPERB | −0.935 | 0.970 |
1.09×10‒04 |
| CDC42EP5 | 0.176 | 0.551 |
5.42×10‒04 |
| CTHRC1 | −0.457 | 0.761 |
2.13×10‒03 |
| DHRS11 | −0.160 | 1.232 |
2.42×10‒03 |
| EGR2 | −0.196 | 0.283 |
3.89×10‒03 |
| INHBB | 0.127 | 2.043 |
4.80×10‒03 |
| RAB11FIP4 | −0.224 | 1.058 |
6.03×10‒03 |
| RBPMS2 | 0.322 | 3.517 |
6.35×10‒03 |
| STAMBPL1 | −0.244 | 0.274 |
9.93×10‒03 |
| UBE2E2 | 0.303 | 4.114 |
1.74×10‒02 |
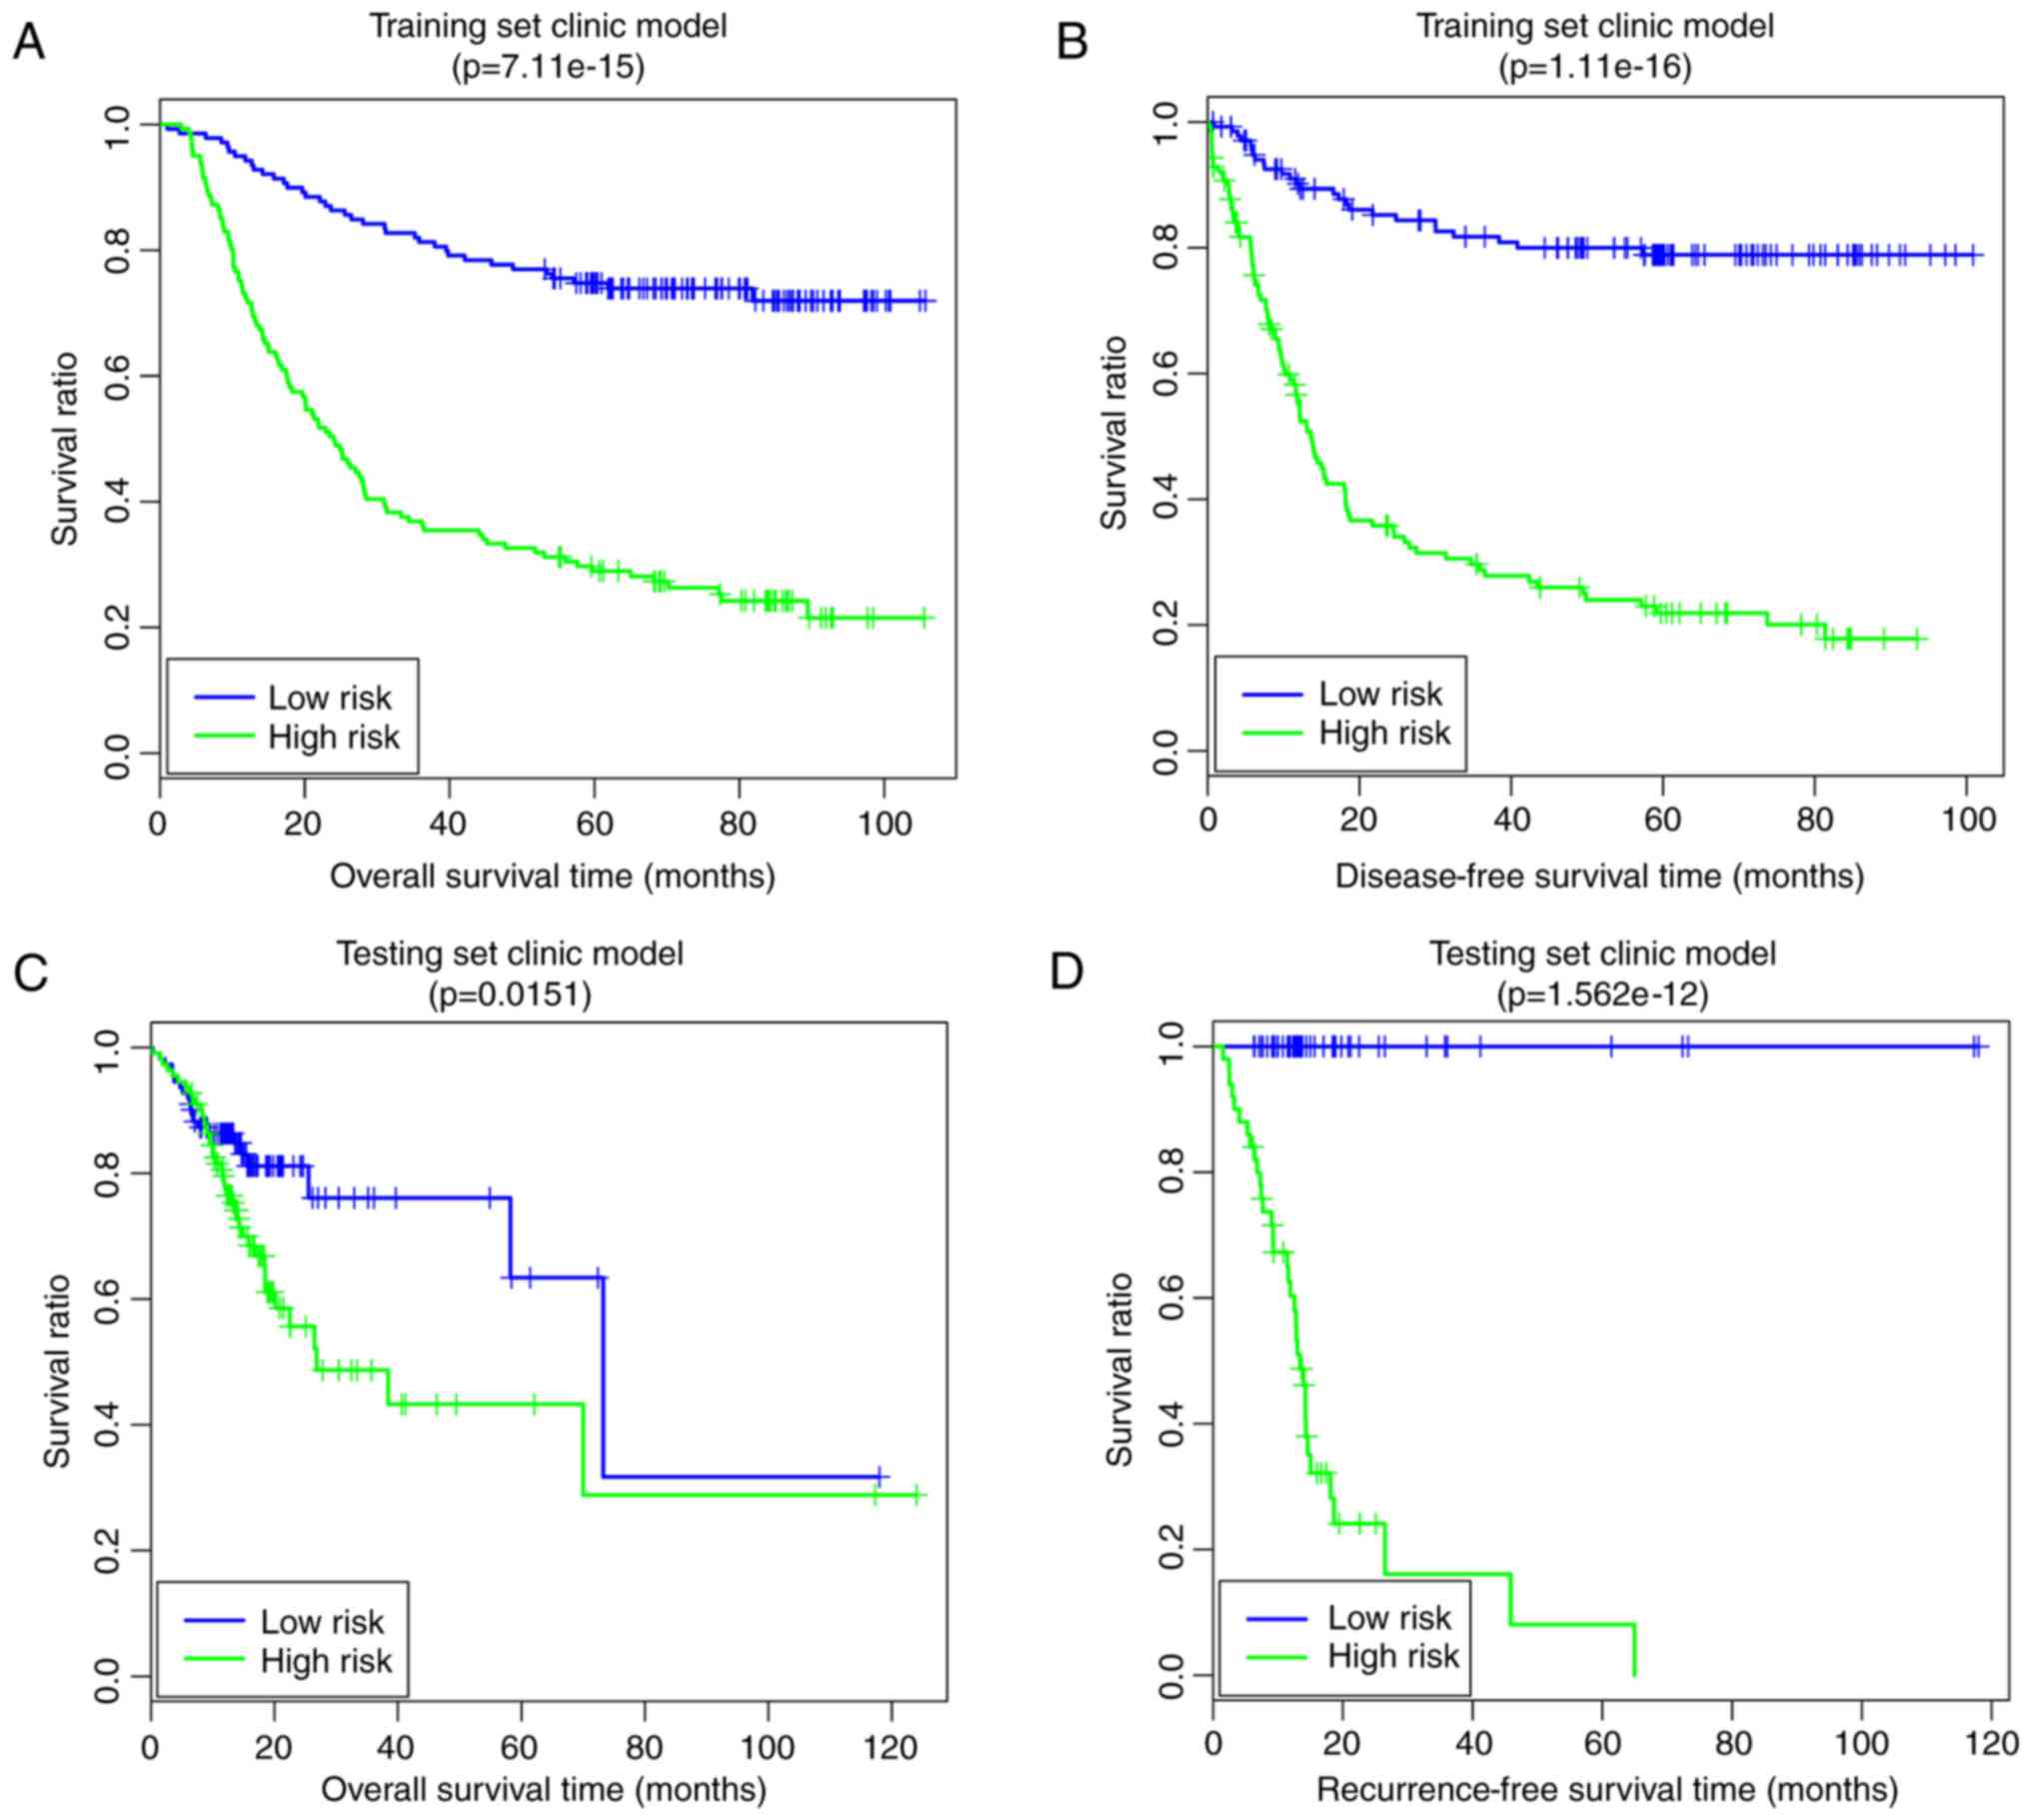
A clinical factor-based risk prediction model was
constructed based on the four prognosis-associated clinical
factors. In the training set, the low-risk group had a longer OS
time (63.55±26.36 vs. 6.41±30.24 months) and RFS time (48.21±28.19
vs. 22.55±25.59 months) compared with the high-risk group (Fig. 7A and B). The risk groups had
significant correlations with OS time (P=7.11×10⁻¹⁵;
Fig. 7A) and RFS time
(P=1.11×10⁻¹⁶; Fig.
7B). In the validation set, the low-risk group had a longer OS
time (20.06±16.33 vs. 18.66±17.75 months) and RFS time (22.52±24.23
vs. 16.93±10.74 months) compared with the high-risk group (Fig. 7C and D). The risk group had
significant correlations with OS time (P=1.51×10⁻²;
Fig; 7C) and RFS time
(P=1.56×10⁻¹²; Fig.
7D).
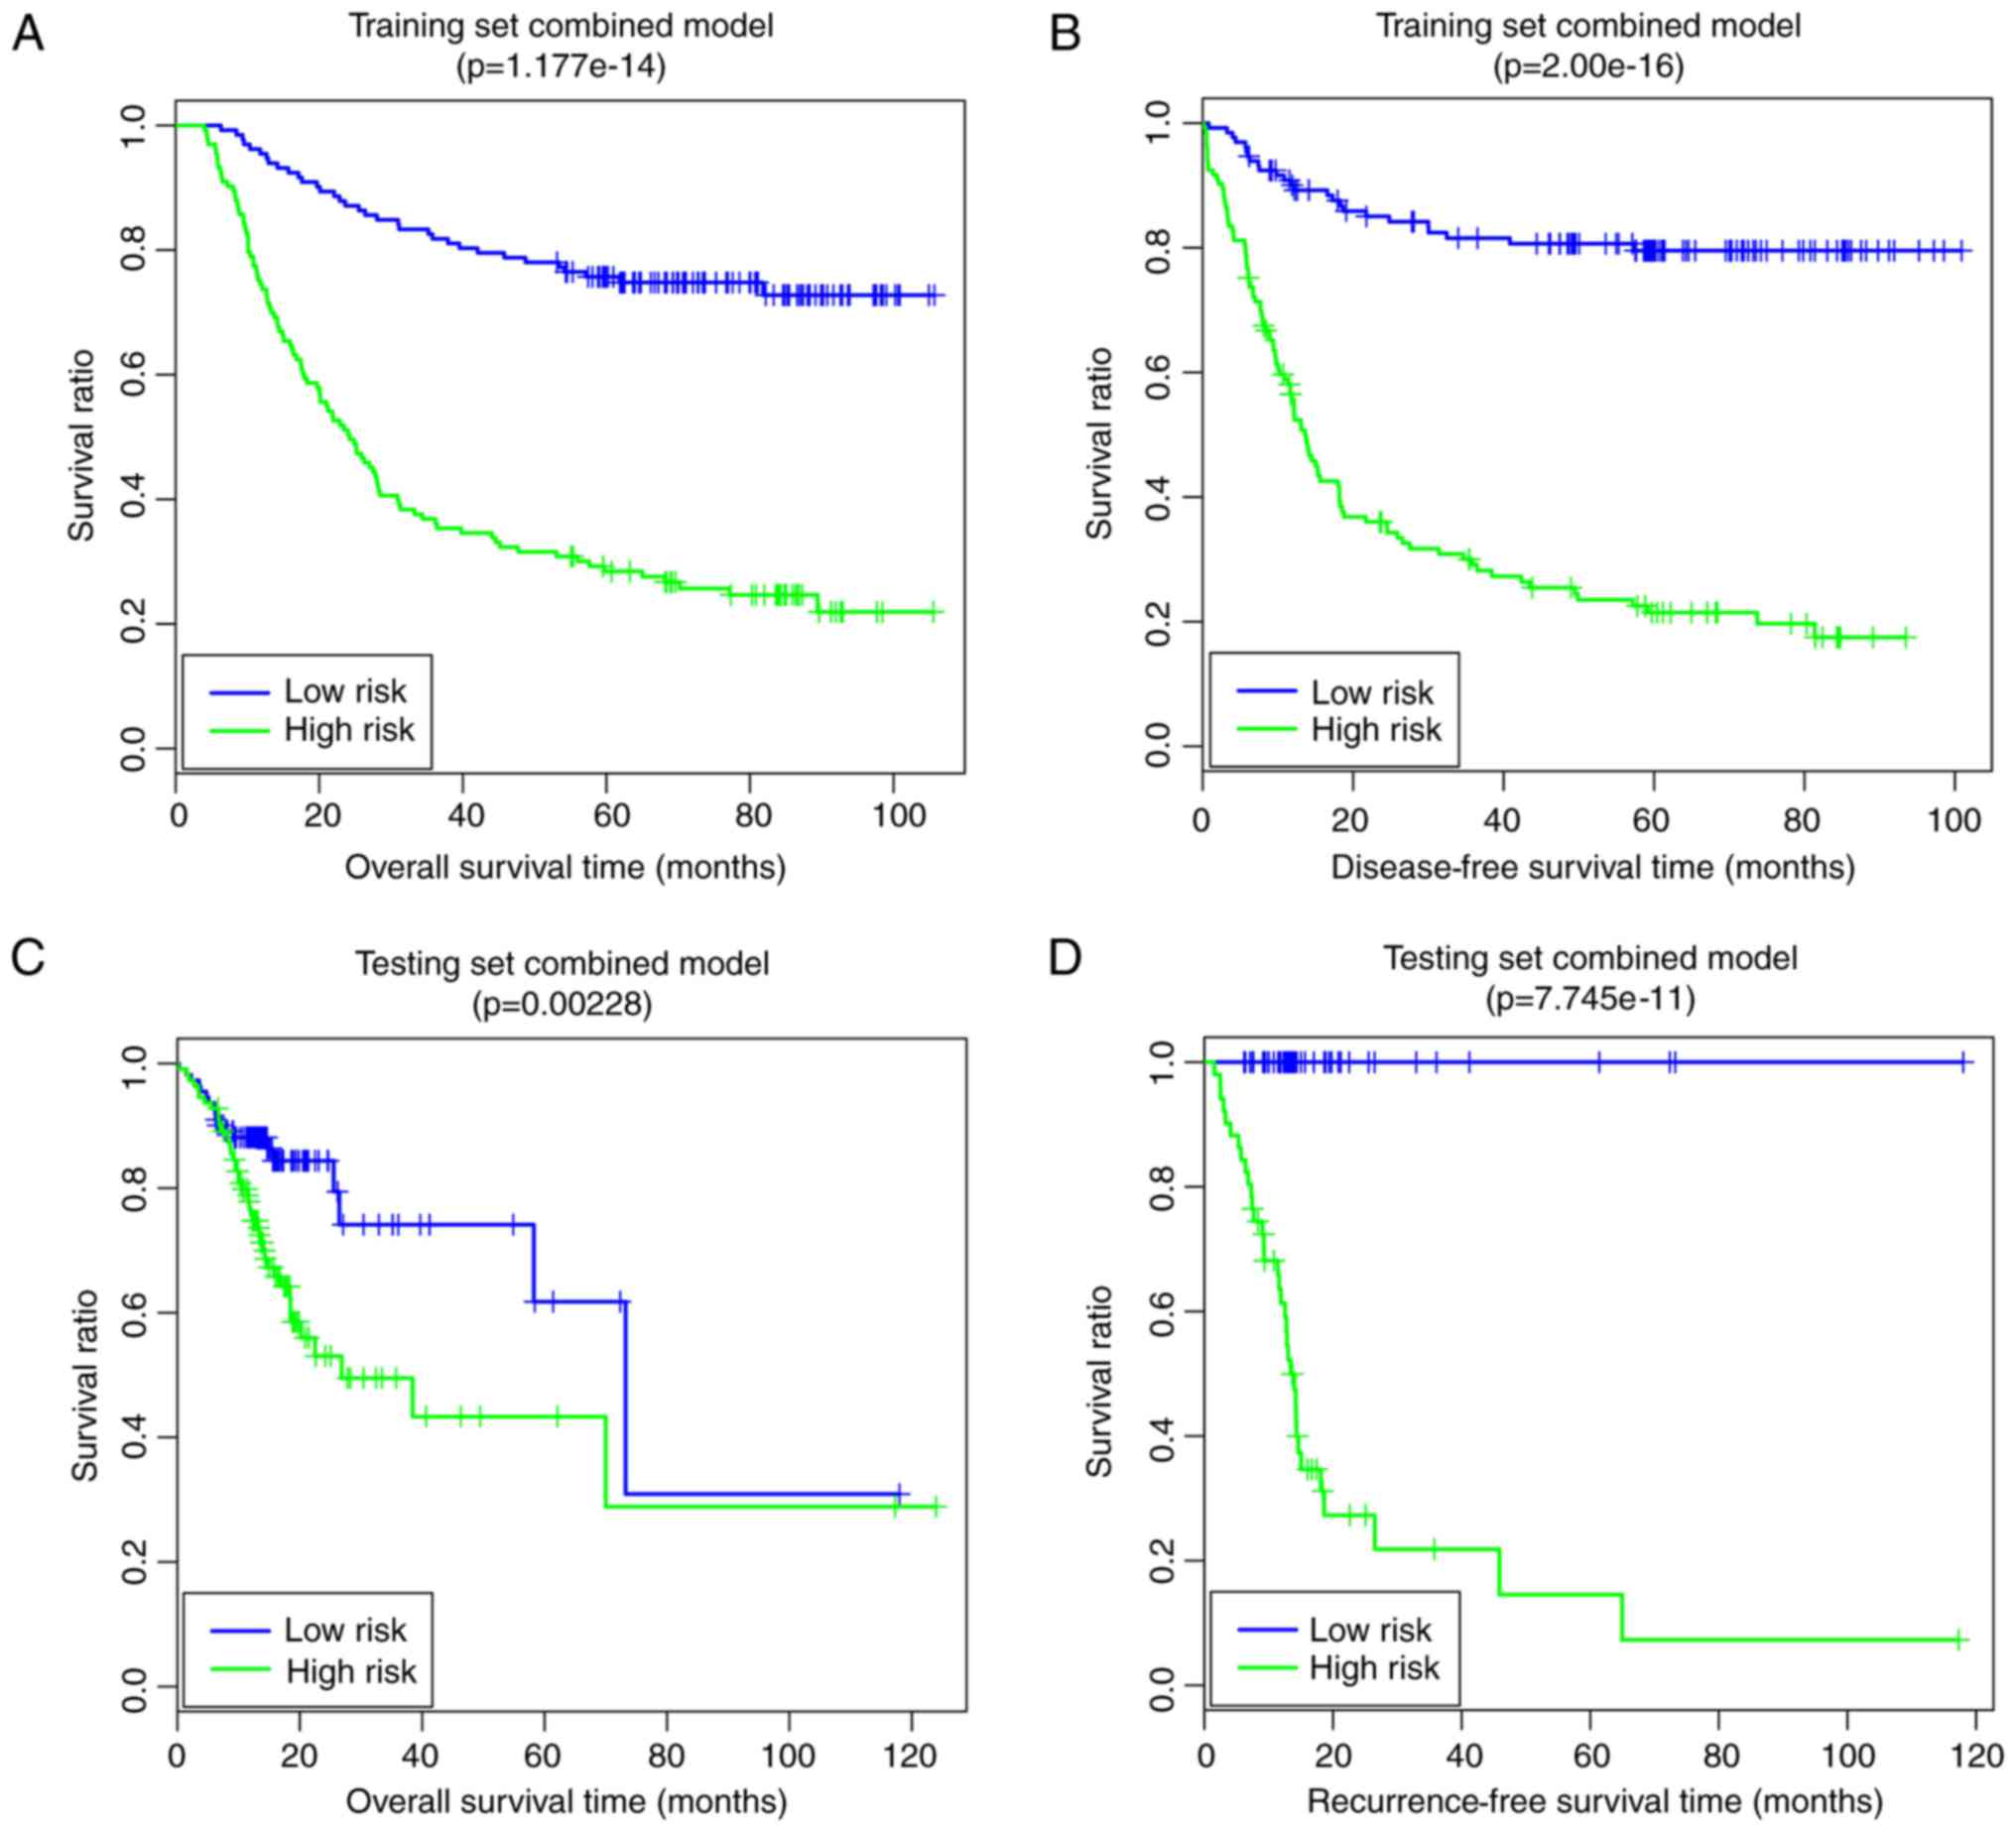
Finally, the comprehensive risk prediction model
based on the optimal prognosis-associated pathways and the
prognosis-associated clinical factors was constructed. In the
training set, the low-risk group had longer OS time (64.34±25.33
vs. 36.76±30.09 months) and RFS time (50.33±26.98 vs. 24.05±25.81
months) compared with the high-risk group (Fig. 8A and B). The risk groups had
significant correlations with OS time (P=1.18×10⁻¹⁴;
Fig. 8A) and RFS time
(P=2.00×10⁻¹⁶; Fig.
8B). In the validation set, the low risk group had a longer OS
time (21.37±16.41 vs. 18.35±17.68 months) and RFS time (22.01±20.32
vs. 19.35±17.73 months) compared with the high-risk group (Fig. 8C and D). The risk groups had
significant correlations with OS time (P=2.28×10⁻³;
Fig. 8C) and RFS time
(P=7.75×10⁻¹¹; Fig.
8D). The pathway- and clinical-factor-based risk prediction
model may have better prognostic accuracy, since it had better
robustness and more significant P-values.
Discussion
In the present study, the gene expression profiles
of the GSE62254 downloaded from GEO served as the training set and
another mRNA-sequencing dataset obtained from TCGA served as the
validation set. Although huge and heterogeneous collections
frequently dilute specific results and favor secondary effects,
these two datasets were independently standardized to partially
eliminate the technology bias in systematic measurement. The 382
overlapping DEGs were screened for further analysis, including 268
upregulated genes and 114 downregulated genes. In the present
study, 50 prognosis-associated genes and four prognosis-associated
clinical factors (including Pathologic_N, Pathologic_stage, MLH1
mutation and recurrence) were identified. Based on the
prognosis-associated genes, the samples in GSE62254 were divided
into group 1 and group 2. The present results demonstrated that
group 1 had less recurrence, less lymphatic metastasis, lower tumor
stage and more MLH1 mutations compared with group 2. Using the
Cox-PH model, 16 optimal prognosis-associated pathways (including
the mitochondrial pathway and the JAK-STAT signaling pathway,
involving CASP7, MYH14, NMNAT1, PIK3R3, PPARG, TJP3, CATSPERB,
CDC42EP5, CTHRC1 and DHRS11) were selected. Similarly, the samples
were divided into group I and II based on the 16 optimal
prognosis-associated pathways. Group I was observed to have less
recurrence, lower tumor stage and more MLH1 mutations compared with
group II.
The expression levels of CASP2, CASP6 and CASP7 are
decreased in GC cells, which may be associated with the
pathogenesis of GC (31). CASP7 in
the apoptosis pathway functions as a critical mediator and
executor, and its potential functional variants may increase the
risk of GC (32). Upregulated
PIK3R3 was demonstrated to contribute to cell cycle progression and
cell proliferation, indicating that PIK3R3 may be a promising
target for the treatment of GC (33). The phosphatidylinositol
3-kinase/RAC-α serine/threonine-protein
kinase/serine/threonine-protein kinase mTOR signaling pathway is
considered to have been implicated in the mechanisms of GC and
contributes to the identification of potential therapeutic targets
for the disease (34,35). Optimal prognosis-associated
pathways may serve important roles in the pathogenesis of GC via
CASP7 and PIK3R3.
PPARG, plasma gastrin and proinflammatory cytokines
have been reported to be correlated with GC development, and PPARG
agonists have the potential to be used for cancer therapy (36,37).
PPARG may suppress the proliferation and migration of GC cells by
inhibiting enabled homolog and telomerase reverse transcriptase
expression, thus PPARG may serve as a therapeutic target for GC
(38). CTHRC1 expression may be
regulated by transforming growth factor-β1 and promoter
demethylation, and high levels of CTHRC1 expression promote the
invasion and metastasis of tumor cells during gastric
carcinogenesis (39,40). The upregulated expression of CTHRC1
may independently predict the disease-free survival and overall
survival of patients with GC, demonstrating that the high levels of
expression of CTHRC1 are associated with the progression and
prognosis of GC (41). These
suggested that the optimal prognosis-associated pathways may be
associated with the development and progression of GC via PPARG and
CTHRC1.
Via a mitochondrial pathway, juglone has been
reported to be able to induce the apoptosis of GC SGC-7901 cells
(42). H. pylori infection
leads to activation of CASP3 and CASP9, and to apoptosis in GC
cells, and the mitochondrial pathway may be important to H.
pylori-induced apoptosis (43). CyclinB1 expression may be
downregulated by fucoxanthin in human GC MGC-803 cells, in which
the JAK-STAT signaling pathway serves an important role (44). The mitochondrial pathway and
JAK-STAT signaling pathway may be involved in the mechanisms of GC.
A previous study demonstrated that MLH1 methylation status and CpG
island methylator phenotype may be suitable prognostic biomarkers
for patients with GC (45).
Checkpoint with forkhead and ring finger domains methylation may be
considered to be a docetaxel-sensitive marker, and MLH1 methylation
is correlated with oxaliplatin resistance in patients with GC
(46). These findings indicated
that MLH1 mutation might serve as a prognostic biomarker for GC.
Taken together, the prognosis-associated genes involved in the
optimal-prognosis-associated pathways in the present prognosis
model are promising targets for therapeutic intervention.
In the present study, the pathway-based risk
prediction model and clinical-factor-based risk prediction model
outperformed the gene-based risk prediction model. Although the
gene-based risk prediction model had acceptable results in the
training set (OS: P=3.06×10⁻⁴, AUC = 0.7966; RFS:
P=3.62×10⁻⁴, AUC=0.7129), this model was not able to be
completely verified in the validation set (OS:
P=4.88×10⁻², AUC =0.6969; RFS: P>0.05). The results
of the pathway-based risk prediction model in the training set (OS:
P=4.90×10⁻⁷, AUC = 0.8554; RFS: P=2.44×10⁻⁷,
AUC = 0.809) and in the validation set (OS: P=1.15×10⁻⁴,
AUC = 0.733; RFS: P=2.62×10⁻⁶, AUC = 0.7559) indicated
that this model had good performance. Furthermore, the clinical
factor-based risk prediction model (training set, OS:
P=7.11×10⁻¹⁵, RFS: P=1.11×10⁻¹⁶; validation
set, OS: P=1.51×10⁻², RFS: P=1.56×10⁻¹²)
improved the P-values of prognosis prediction, rendering them
higher compared with those of the pathway-based risk prediction
model. The comprehensive risk prediction model, based on the
optimal prognosis-associated pathways and the prognosis-associated
clinical factors, yielded good predictive results (training set,
OS: P=1.18×10⁻¹⁴, RFS: P=2.00×10⁻¹⁶;
validation set, OS: P=2.28×10⁻³, RFS:
P=7.75×10⁻¹¹). In this way, the pathway and clinical
factor-based risk prediction model may be suitable for predicting
the prognosis of patients with GC.
In conclusion, 50 prognosis-associated genes, 16
optimal prognosis-associated pathways and four prognosis-associated
clinical factors were identified. The pathway and clinical
factor-based risk prediction model might be suitable for predicting
the prognosis of GC patients. The prognosis-associated genes
involved in the optimal prognosis-associated pathways in the
present prognostic model (including CASP7, PIK3R3, PPARG, CTHRC1
and MLH1) are promising targets for therapeutic intervention.
However, further study is required to validate the prognostic
prediction model, based on the optimal prognosis-associated
pathways and the prognosis-associated clinical factors, in an
independent patient cohort with gastric cancer.
Acknowledgements
Not applicable.
Funding
No funding was received.
Availability of data and materials
The datasets used and/or analyzed during the current
study are available from the corresponding author on reasonable
request.
Authors' contributions
MN and KY conceived and designed the study. JY and
LB designed and performed data analyses. TH collected the data and
wrote the manuscript. DD participated in study design and organized
the literature. All authors read and approved the final
manuscript.
Ethical approval and consent to
participate
Not applicable.
Consent for publication
Not applicable.
Competing interests
The authors declare that they have no competing
interests.
References
|
1
|
Hartgrink HH, Jansen EP, van Grieken NC
and van de Velde CJ: Gastric cancer. Lancet. 374:477–490. 2009.
View Article : Google Scholar : PubMed/NCBI
|
|
2
|
Sim F and Mckee M: Issues in Public
Health. Open University Press; 2011, View Article : Google Scholar
|
|
3
|
World Health Organization: World Cancer
Report. 2014.
|
|
4
|
Chang AH and Parsonnet J: Role of bacteria
in oncogenesis. Clin Microbiol Rev. 23:837–857. 2010. View Article : Google Scholar : PubMed/NCBI
|
|
5
|
Choi YY, An JY, Kim HI, Cheong JH, Hyung
WJ and Noh SH: Current practice of gastric cancer treatment. Chin
Med J. 127:547–553. 2014.PubMed/NCBI
|
|
6
|
Raymond W and Ruddon RW: Cancer Biology.
4th. Oxford University Press; Oxford: pp. 7912007
|
|
7
|
Orditura M, Galizia G, Sforza V,
Gambardella V, Fabozzi A, Laterza MM, Andreozzi F, Ventriglia J,
Savastano B, Mabilia A, et al: Treatment of gastric cancer. World J
Gastroenterol. 20:1635–1649. 2014. View Article : Google Scholar : PubMed/NCBI
|
|
8
|
Jian-bo X, Hui W, Yu-long H, Chang-hua Z,
Long-juan Z, Shi-rong C and Wen-hua Z: Astrocyte-elevated gene-1
overexpression is associated with poor prognosis in gastric cancer.
Med Oncol. 28:455–462. 2011. View Article : Google Scholar : PubMed/NCBI
|
|
9
|
Liang L, Li L, Tian J, Lee SO, Dang Q,
Huang CK, Yeh S, Erturk E, Bushinsky D, Chang LS, et al: Androgen
receptor enhances kidney stone-CaOx crystal formation via
modulation of oxalate biosynthesis & oxidative stress. Mol
Endocrinol. 28:1291–1303. 2014. View Article : Google Scholar : PubMed/NCBI
|
|
10
|
Gomez-Martin C, Plaza JC, Pazo-Cid R,
Salud A, Pons F, Fonseca P, Leon A, Alsina M, Visa L, Rivera F, et
al: Level of HER2 gene amplification predicts response and
overall survival in HER2-positive advanced gastric cancer treated
with trastuzumab. J Clin Oncol. 31:4445–4452. 2013. View Article : Google Scholar : PubMed/NCBI
|
|
11
|
Wang DD, Chen YB, Pan K, Wang W, Chen SP,
Chen JG, Zhao JJ, Lv L, Pan QZ, Li YQ, et al: Decreased expression
of the ARID1A gene is associated with poor prognosis in
primary gastric cancer. PLoS One. 7:e403642012. View Article : Google Scholar : PubMed/NCBI
|
|
12
|
Yan HB, Wang XF, Zhang Q, Tang ZQ, Jiang
YH, Fan HZ, Sun YH, Yang PY and Liu F: Reduced expression of the
chromatin remodeling gene ARID1A enhances gastric cancer
cell migration and invasion via downregulation of E-cadherin
transcription. Carcinogenesis. 35:867–876. 2014. View Article : Google Scholar : PubMed/NCBI
|
|
13
|
Okugawa Y, Tanaka K, Inoue Y, Kawamura M,
Kawamoto A, Hiro J, Saigusa S, Toiyama Y, Ohi M, Uchida K, et al:
Brain-derived neurotrophic factor/tropomyosin-related kinase B
pathway in gastric cancer. Br J Cancer. 108:121–130. 2013.
View Article : Google Scholar : PubMed/NCBI
|
|
14
|
Santoro R, Carboni F, Lepiane P, Ettorre
GM and Santoro E: Clinicopathological features and prognosis of
gastric cancer in young European adults. Br J Surg. 94:737–742.
2007. View
Article : Google Scholar : PubMed/NCBI
|
|
15
|
Shimada H, Noie T, Ohashi M, Oba K and
Takahashi Y: Clinical significance of serum tumor markers for
gastric cancer: A systematic review of literature by the Task Force
of the Japanese Gastric Cancer Association. Gastric Cancer.
17:26–33. 2014. View Article : Google Scholar : PubMed/NCBI
|
|
16
|
Huang S, Yee C, Ching T, Yu H and Garmire
LX: A novel model to combine clinical and pathway-based
transcriptomic information for the prognosis prediction of breast
cancer. PLoS Comput Biol. 10:e10038512014. View Article : Google Scholar : PubMed/NCBI
|
|
17
|
Huang S, Chong N, Lewis NE, Jia W, Xie G
and Garmire LX: Novel personalized pathway-based metabolomics
models reveal key metabolic pathways for breast cancer diagnosis.
Genome Med. 8:342016. View Article : Google Scholar : PubMed/NCBI
|
|
18
|
Cristescu R, Lee J, Nebozhyn M, Kim KM,
Ting JC, Wong SS, Liu J, Yue YG, Wang J, Yu K, et al: Molecular
analysis of gastric cancer identifies subtypes associated with
distinct clinical outcomes. Nat Med. 21:449–456. 2015. View Article : Google Scholar : PubMed/NCBI
|
|
19
|
Woo HG, Park ES, Cheon JH, Kim JH, Lee JS,
Park BJ, Kim W, Park SC, Chung YJ, Kim BG, et al: Gene
expression-based recurrence prediction of hepatitis B virus-related
human hepatocellular carcinoma. Clin Cancer Res. 14:2056–2064.
2008. View Article : Google Scholar : PubMed/NCBI
|
|
20
|
Irizarry RA, Bolstad BM, Collin F, Cope
LM, Hobbs B and Speed TP: Summaries of Affymetrix GeneChip probe
level data. Nucleic Acids Res. 31:e152003. View Article : Google Scholar : PubMed/NCBI
|
|
21
|
R Core Team: R: A language and environment
for statistical computing. Vienna, Austria: The R Foundation for
Statistical Computing. http://www.R-project.org/2017.
|
|
22
|
Kruschke JK: Bayesian estimation
supersedes the t test. J Exp Psychol Gen. 142:573–603. 2013.
View Article : Google Scholar : PubMed/NCBI
|
|
23
|
Nagarajan N and Keich U: Reliability and
efficiency of algorithms for computing the significance of the
Mann-Whitney test. Comput Stat. 24:6052009. View Article : Google Scholar
|
|
24
|
Therneau T: A package for survival
analysis in S. R package version. 2:37. 2014.
|
|
25
|
Farinelli A, Bicego M, Bistaffa F and
Ramchurn SD: A hierarchical clustering approach to large-scale
near-optimal coalition formation with quality guarantees. Eng Appl
Art Intell. 59:170–185. 2017. View Article : Google Scholar
|
|
26
|
Kolde R: Pheatmap: Pretty Heatmaps
[Software]. 2015.
|
|
27
|
Subramanian A, Tamayo P, Mootha VK,
Mukherjee S, Ebert BL, Gillette MA, Paulovich A, Pomeroy SL, Golub
TR, Lander ES and Mesirov JP: Gene set enrichment analysis: A
knowledge-based approach for interpreting genome-wide expression
profiles. Proc Natl Acad Sci USA. 102:pp. 15545–15550. 2005;
View Article : Google Scholar : PubMed/NCBI
|
|
28
|
Drier Y, Sheffer M and Domany E:
Pathway-based personalized analysis of cancer. Proc Natl Acad Sci
USA. 110:pp. 6388–6393. 2013; View Article : Google Scholar : PubMed/NCBI
|
|
29
|
Goeman JJ: L1 penalized estimation in the
Cox proportional hazards model. Biom J. 52:70–84. 2010.PubMed/NCBI
|
|
30
|
Bachoc F: Cross validation and maximum
likelihood estimations of hyper-parameters of Gaussian processes
with model misspecification. Comput Stat Data Anal. 66:55–69. 2013.
View Article : Google Scholar
|
|
31
|
Yoo NJ, Lee JW, Kim YJ, Soung YH, Kim SY,
Nam SW, Park WS, Lee JY and Lee SH: Loss of caspase-2, −6 and −7
expression in gastric cancers. APMIS. 112:330–335. 2004. View Article : Google Scholar : PubMed/NCBI
|
|
32
|
Wang MY, Zhu ML, He J, Shi TY, Li QX, Wang
YN, Li J, Zhou XY, Sun MH, Wang XF, et al: Potentially functional
polymorphisms in the CASP7 gene contribute to gastric
adenocarcinoma susceptibility in an eastern Chinese population.
PLoS One. 8:e740412013. View Article : Google Scholar : PubMed/NCBI
|
|
33
|
Zhou J, Chen GB, Tang YC, Sinha RA, Wu Y,
Yap CS, Wang G, Hu J, Xia X, Tan P, et al: Genetic and
bioinformatic analyses of the expression and function of PI3K
regulatory subunit PIK3R3 in an Asian patient gastric cancer
library. BMC Med Genomics. 5:342012. View Article : Google Scholar : PubMed/NCBI
|
|
34
|
Fang WL, Huang KH, Lan YT, Lin CH, Chang
SC, Chen MH, Chao Y, Lin WC, Lo SS, Li AF, et al: Mutations in
PI3K/AKT pathway genes and amplifications of PIK3CA are associated
with patterns of recurrence in gastric cancers. Oncotarget.
7:6201–6220. 2016. View Article : Google Scholar : PubMed/NCBI
|
|
35
|
Matsuoka T and Yashiro M: The role of
PI3K/Akt/mTOR signaling in gastric carcinoma. Cancers. 6:1441–1463.
2014. View Article : Google Scholar : PubMed/NCBI
|
|
36
|
Konturek PC, Kania J, Kukharsky V, Raithel
M, Ocker M, Rembiasz K, Hahn EG and Konturek SJ: Implication of
peroxisome proliferator-activated receptor gamma and
proinflammatory cytokines in gastric carcinogenesis: Link to
Helicobacter pylori-infection. J Pharmacol Sci. 96:134–143. 2004.
View Article : Google Scholar : PubMed/NCBI
|
|
37
|
Konturek PC, Kania J, Konturek JW,
Nikiforuk A, Konturek SJ and Hahn EG: H. pylori infection, atrophic
gastritis, cytokines, gastrin, COX-2, PPAR gamma and impaired
apoptosis in gastric carcinogenesis. Med Sci Monit. 9:SR53–SR66.
2003.PubMed/NCBI
|
|
38
|
Guo F, Ren X, Dong Y, Hu X, Xu D, Zhou H,
Meng F, Tian W and Zhao Y: Constitutive expression of PPARγ
inhibits proliferation and migration of gastric cancer cells and
down-regulates Wnt/β-Catenin signaling pathway downstream target
genes TERT and ENAH. Gene. 584:31–37. 2016.
View Article : Google Scholar : PubMed/NCBI
|
|
39
|
Wang P, Wang YC, Chen XY, Shen ZY, Cao H,
Zhang YJ, Yu J, Zhu JD, Lu YY and Fang JY: CTHRC1 is
upregulated by promoter demethylation and transforming growth
factor-β1 and may be associated with metastasis in human gastric
cancer. Cancer Sci. 103:1327–1333. 2012. View Article : Google Scholar : PubMed/NCBI
|
|
40
|
Yu J, Feng J, Zhi X, Tang J, Li Z, Xu Y,
Yang L, Hu Z and Xu Z: Let-7b inhibits cell proliferation,
migration, and invasion through targeting Cthrc1 in gastric cancer.
Tumour Biol. 36:3221–3229. 2015. View Article : Google Scholar : PubMed/NCBI
|
|
41
|
Gu L, Liu L, Zhong L, Bai Y, Sui H, Wei X,
Zhang W, Huang P, Gao D, Kong Y and Lou G: Cthrc1 overexpression is
an independent prognostic marker in gastric cancer. Hum Pathol.
45:1031–1038. 2014. View Article : Google Scholar : PubMed/NCBI
|
|
42
|
Ji YB, Qu ZY and Zou X: Juglone-induced
apoptosis in human gastric cancer SGC-7901 cells via the
mitochondrial pathway. Exp Toxicol Pathol. 63:69–78. 2011.
View Article : Google Scholar : PubMed/NCBI
|
|
43
|
Zhang H, Fang DC, Lan CH and Luo YH:
Helicobacter pylori infection induces apoptosis in gastric
cancer cells through the mitochondrial pathway. J Gastroenterol
Hepatol. 22:1051–1056. 2007. View Article : Google Scholar : PubMed/NCBI
|
|
44
|
Yu RX, Hu XM, Xu SQ, Jiang ZJ and Yang W:
Effects of fucoxanthin on proliferation and apoptosis in human
gastric adenocarcinoma MGC-803 cells via JAK/STAT signal pathway.
Eur J Pharmacol. 657:10–19. 2011. View Article : Google Scholar : PubMed/NCBI
|
|
45
|
Shigeyasu K, Nagasaka T, Mori Y, Yokomichi
N, Kawai T, Fuji T, Kimura K, Umeda Y, Kagawa S, Goel A and
Fujiwara T: Clinical significance of MLH1 methylation and CpG
island methylator phenotype as prognostic markers in patients with
gastric cancer. PLoS One. 10:e01304092015. View Article : Google Scholar : PubMed/NCBI
|
|
46
|
Li Y, Yang Y, Lu Y, Herman JG, Brock MV,
Zhao P and Guo M: Predictive value of CHFR and MLH1 methylation in
human gastric cancer. Gastric Cancer. 18:280–287. 2015. View Article : Google Scholar : PubMed/NCBI
|