Introduction
Animal studies have revealed that increasing heat
production in adipose tissue can offset obesogenic effects of a
high-fat diet, whereas reducing thermogenesis exacerbates them
(1). The existence of brown
adipose tissue (BAT) in adult humans has been reconfirmed by using
modern imaging techniques and tissue biopsies (2,3),
increasing the importance of understanding the pathophysiological
significance of brown and brown-like ‘beige’ adipocytes as players
for systemic metabolism and also neighboring tissue
thermo-regulation. In fact, the levels of detectable BAT negatively
correlate with age, body mass index (BMI) and diabetes conditions
(4). Thus, an increasing number of
factors and molecules have been identified to increase the numbers
or thermogenic activities of brown/beige adipocytes. In this
context, we recently identified a key thermogenesis inhibitor that
functions in response to changing environmental conditions and
particularly when thermogenic activity is enhanced in capable
tissues as a fine-tuning negative regulator (5).
Epicardial adipose tissue (EAT) is a cluster of
metabolically and thermogenetically unique fat cells among various
fat tissues (6). Accumulated
evidence for the gene expression patterns in human and animal
tissues have strengthened the biochemical findings (7,8) that
EAT is characterized by increased lipolytic property with
β-adrenergic activities (9,10).
Recent histochemical and cell-biological studies indeed have
demonstrated that human adult epicardial adipocytes share features
with the above-mentioned brown/beige adipocytes (11). Thus, how the unique character is
associated with cardiac thermo-stasis and systemic metabolism is an
issue to be solved, in order to exploit the regulation of
beige/brown adipocytes towards prevention and treatment of diabetes
and coronary artery diseases (CAD) in obese patients.
In the present study, we first investigated the
expression of genes involved in thermogenesis in human EAT, in
comparison to subcutaneous adipose tissue (SAT), from 15 autopsy
samples and also in mouse EAT. Furthermore, the sensitivities of
the gene expression in human mesenchymal cells (MCs)-derived brown
adipocytes prepared from EAT and SAT samples were elucidated.
Third, we evaluated the susceptibilities of EAT volume changes
against weight reduction using multi-detector computed tomography
(MDCT) in 10 obese patients in comparison to those of SAT and
visceral adipose tissue (VAT).
Materials and methods
Autopsy samples
The study protocol for the collection and analyses
of autopsy samples was approved by the Ethics Committee of Toho
University Sakura Medical Center, in accordance with the
Declaration of Helsinki. Each family gave informed consent before
the study began for the study use of autopsy subject sample.
Eighteen consecutive patients who underwent autopsy were originally
recruited in this study (Table I),
and among them, two cases were excluded because of treatment
histories with thyrotoxic crisis (sample no. 18), and intensive
therapy with long-time noradrenergic stimulation for acute
myocardial infarction (sample no. 3), respectively. As a result,
sixteen autopsy samples were included in this study. Samples of EAT
and SAT were obtained from the distal left anterior descending
artery at the apex of the heart, and upper abdominal wall,
respectively. Fat samples were trimmed of connective tissue and
superficial blood vessels, and stored at −80°C for the subsequent
gene expression analysis. The samples from 15 cases (sample nos. 1,
2, 4, 5, 6, 7, 8, 9, 10, 11, 12, 13, 15, 16, and 17) were used for
gene expression analysis, and the sample no. 14 was used for cell
culture experiments without gene expression analysis, because of
the volume limitation of prepared fat.
 | Table I.Backgrounds of autopsy samples. |
Table I.
Backgrounds of autopsy samples.
| No. | Age | Sex | Duration after death
(h) | CA | AA | Pathological
diagnosis | Height | Weight | BMI | DM | HT | DL | Smoking history | AD | NAD | DOA | DOB |
|---|
| 1 | 80 | 0 | 11:00 | ± | ± | Sepsis, acute
pyelonephritis | 148 | 50 | 22.8 | − | + | − | 0 | + | − | − | − |
| 2 | 88 | 0 | 6:27 | + | ++ | Sepsis | 155 | 60 | 25.0 | + | + | + | 0 | − | − | + | − |
| 3 | 72 | 0 | 15:17 |
| ++ | Acute myocardial
infarction | 149 | 56.9 | 25.6 | + | − | + | 0 | − | + | + | + |
| 4 | 65 | 1 | 15:98 | ± | ± | Lung
adenocarcinoma | 160 | 54.7 | 21.4 | − | + | + | 2 | − | − | − | − |
| 5 | 73 | 1 | 1:47 | + | ± | Interstitial
pneumonia | 157 | 38 | 15.4 | − | − | + | 2 | − | − | − | − |
| 6 | 69 | 1 | 3:55 | ± | ± | Pancreas
cancer | 164 | 55 | 20.5 | − | + | + | 0 | − | − | − | − |
| 7 | 81 | 1 | 7:50 | + | ± | Occult primary
cancer | 165 | 43.7 | 16.1 | − | + | − | 2 | − | − | − | − |
| 8 | 74 | 1 | 0:67 | ++ | ++ | Lung cancer | 163 | 53.4 | 20.1 | + | − | + | 1 | − | − | + | − |
| 9 | 79 | 1 | 19:00 | ± | ± | Hepatocellular
carcinoma, liver cirrhosis |
| 66.2 |
| + | + | + | 0 | + | − | − | − |
| 10 | 63 | 1 | 4:37 | ± | ± | Squamous cell
cancer of the lung | 165 | 70 | 25.7 | + | − | − | 2 | − | − | − | − |
| 11 | 67 | 1 | 13:20 | ± | ± | Malignant
pancreatic endocrine tumor | 163 | 46 | 17.3 | − | − | + | 2 | − | − | − | − |
| 12 | 68 | 1 | 5:22 | ± | ± | Prostate
cancer | 168 | 55.7 | 19.7 | − | − | − | 0 | − | − | − | − |
| 13 | 68 | 0 | 11:17 | ± | ± | Pulmonary
thromboembolism | 156.6 | 44.9 | 18.2 | − | − | − | 0 | + | − | − | − |
| 14 | 65 | 1 | 2:33 | ++ | ± | Acute heart
failure |
|
|
| − | + | − | − | + | − | − | − |
| 15 | 64 | 1 | 16:87 | ± | ± | Senile systemic
amyloidosis | 160 | 57 | 22.3 | + | + | − | 0 | + | + | − | − |
| 16 | 81 | 0 | 13:55 | ± | ± | Acute heart
failure, Dilated cardiomyopathy | 148 | 41.6 | 19.0 | − | − | − | 0 | − | − | − | − |
| 17 | 62 | 1 | 20:33 | ± | ± | Malignant
pancreatic endocrine tumor | 180 | 41.8 | 12.9 | − | − | − | 2 | − | − | − | − |
| 18 | 64 | 0 | 1:78 | ± | ± | Thyrotoxic
crisis | 163 | 45 | 16.9 | − | − | − | 0 | + | − | − | − |
Mouse experiments
All data were from work on male (56 weeks of age)
db/db mice, which were purchased from Clea (Tokyo,
Japan), and housed in a temperature-controlled room (22°C) with a
12-h light/dark cycle with free access to food and water. Standard
chow was administered ad libitum from weaning. EAT and SAT
were obtained as described in 2.1. autopsy samples, and
stored at −80°C for the subsequent gene expression analysis. All
animal procedures were approved by the local animal ethics
committee of the National Center for Global Health and
Medicine.
Cell culture
Experiments were performed with the adipose tissue
specimens obtained from an autopsy sample (sample no. 14; Table I). Human primary MCs were prepared
from the stromal vascular fraction of fat tissues, and cultured as
described by excision of the fat pad followed by mincing with
sterile surgical scissors and digestion at 37°C with shaking for 30
min (5). Digests were filtered and
left to sit on ice for 10 min. The upper fat layer was removed and
then the upper 2/3 of the supernatant washed twice in PBS (Wako)
before being plated. Cells were maintained at 37°C in 5%
CO2 in Dulbecco's modified Eagle's medium (Wako) with
10% fetal bovine serum (Gibco; Thermo Fisher Scientific, Tokyo,
Japan), 20 mM L-glutamine (Wako), 100 units/ml, penicillin, and 100
µg/ml streptomycin (both from Gibco; Thermo Fisher Scientific). The
cells were further incubated in the medium of the above composition
with/without 0.25 µM dexamethasone (Wako), 0.5 mM
3-isobutyl-1-methylxanthine (IBMX; Biovision, Milpitas, CA, USA),
125 µM indomethacin, 850 nm insulin (Wako), and 1 nM 3, 30,
5-Triiodo-thyronine (T3; Sigma-Aldrich, Tokyo, Japan)
for 2 days, accompanied by subsequent incubation with 850 nM
insulin and 1 nM T3 for 5 days for browning
differentiation. After 7 days, cells were fully differentiated
(validated by morphological appearance) and used for gene
expression experiments. The procedures were approved by the Ethical
Committee on human study, Toho University Sakura Medical
Center.
Reverse transcription-quantitative
polymerase chain reaction (RT-qPCR)
RT-qPCR experiments were performed as described
previously (12). Total RNA was
prepared from tissues or cultured cells using the
Maxwell® 16 LEV simply RNA Purification kit, and
immediately quantified using the Quantus™ Fluorometer (both
Promega, Tokyo, Japan). For cDNA synthesis, the reverse
transcription reaction was performed with the Affinity Script QPCR
cDNA Synthesis kit (Agilent Technologies Japan, Tokyo, Japan). The
target fragments of the cDNA samples were amplified by Applied
Biosystems® StepOnePlus™ using TaqMan Gene Expression
Assay with TaqMan Fast Advanced Master Mix (both Applied
Biosystems; Thermo Fisher, Yokohama, Japan) with the combinations
of primers and probes for UCP1 (Hs00222453_m1 or Mm01244861_m1),
β3-adrenergic receptor (AR) (Hs00609046_m1 or Mm02601819_g1),
leptin (Hs00174877_m1 and Mm00434759_m1), TNF-α (Hs00174128_m1 or
Mm00443258_ml), VEGF (Hs00900055_m1 or Mm00437304_m1) or 18S RNA
(Hs99999901_s1). For the experiments using MCs, samples obtained
from cells after browning stimulation treatment were used as
calibrator to allow comparison of relative mRNA levels in the
assays.
Human study
We prospectively enrolled ten consecutive obese
patients in this study, who were admitted to the Department of
Cardiology, Toho University Sakura Medical Center (Sakura, Japan)
due to stable angina or heart failure, and underwent a regular
weight reduction program using low-calorie diet and aerobic
exercise (Table II). Patients
with malignant diseases, inflammatory diseases, or under
hemodialysis, were excluded from the study. Diabetes mellitus was
defined by either a value >6.5% of glycosylated hemoglobin
(HbA1c) (13) or being under
medication with oral hypoglycemic drugs. Among the study subjects,
there were none on insulin therapy, five on oral hypoglycemic
agents, and one on dietary therapy alone. Patients with systolic
blood pressure (SBP) ≥140 mmHg or diastolic blood pressure (DBP)
≥90 mmHg (14), or under
anti-hypertensive medication were considered hypertensive.
Dyslipidemia was defined as low-density lipoprotein cholesterol
(LDL-C) ≥140 mg/dl, high-density lipoprotein cholesterol (HDL-C)
<40 mg/dl, or triglyceride ≥150 mg/dl (15), or being under treatment with
statins and/or lipid-lowering agents. We defined renal dysfunction
as an estimated glomerular filtration rate (eGFR) of <60
ml/min/1.73 m2 (16),
and calculated the eGFR using baseline serum creatinine. Eight
patients were treated with angiotensin receptor blockers, and three
patients received statins. Smoking habits and the amount of tobacco
consumed were examined in the questionnaire and subjects were
classified into three categories; non-smokers (those who have not
smoked more than 100 cigarettes in total or more than 6 months so
far), current smokers (those who have smoked more than 100
cigarettes in total or more than 6 months so far and who smoke
daily or occasionally in the past month), or ex-smokers (those who
have smoked more than 100 cigarettes in total or more than 6 months
so far and who have not smoked in the past month). The diagnosis of
CAD was based on a history of myocardial infarction or angina
pectoris. Obesity was defined as BMI ≥25 kg/m2 (17). The subjects had low calorie diet
with partial replacement of meal by Formula diet
(Microdiet®; Sunny Health, Tokyo, Japan) once a day at
dinner (974 kcal/day) for 3 weeks, and subsequently without the
replacement (1,200 kcal/day) until discharge. The exercise therapy
was continued for 20 min using an ergometer or a treadmill based on
the Borg scale. The body weights and lengths before and after the
program achievement for the periods ranging 3 weeks to 2 months
were measured together with other biochemical parameters.
Throughout the weight reduction program, the patients' compliance
with mandated calorie intake and aerobic exercise was monitored.
The study protocol was approved by the Ethics Committee of Toho
University Sakura Medical Center. All subjects gave informed
consent before the study began.
| Table II.Characteristics and biochemistry of
study subjects before and after weight reduction therapy. |
Table II.
Characteristics and biochemistry of
study subjects before and after weight reduction therapy.
| Variables | Before |
| After | P-value |
|---|
| Age (years) |
| 44.6±16.2 |
| − |
| Male |
| 8 (80%) |
| − |
| Weight loss
duration (days) |
| 44.1±27.6 |
| − |
| Current smoker |
| 5 (50%) |
| − |
| TC (mg/dl) | 177.3±45.8 |
| 160.5±32.1 | 0.235 |
| TG (mg/dl) | 118.1±40.1 |
| 105.4±23.1 | 0.445 |
| HDL-C (mg/dl) | 38.2±5.6 |
| 39.2±7.5 | 0.735 |
| LDL-C (mg/dl) | 117.5±43.4 |
| 99.6±32.0 | 0.097 |
| SBP (mmHg) | 136.0±19.8 |
| 129.7±17.7 | 0.144 |
| DBP (mmHg) | 80.7±13.1 |
| 75.7±10.6 | 0.216 |
| Heart rate
(beats/min) | 72.6±11.8 |
| 65.7±7.8 | 0.085 |
| FPG (mg/dl) | 112.5±35.4 |
| 98.4±18.4 | 0.234 |
| HbA1c (JDS)
(%) | 6.9±1.3 |
| 6.2±0.7 | 0.084 |
| Creatinine
(mg/dl) | 1.08±0.4 |
| 1.94±2.6 | 0.324 |
| Uric acid
(mg/dl) | 7.6±2.4 |
| 6.5±1.5 | 0.100 |
| Complications |
|
|
|
|
|
CAD |
| 2 (20%) |
|
|
| Renal
dysfunction |
| 3 (30%) |
|
|
| Medications |
| 5 (50%) |
|
|
|
Diabetes excluding
insulin |
|
|
|
|
| Insulin
supplementation |
| 0 (0%) |
|
|
|
Hypertension |
| 9 (90%) |
|
|
|
Dyslipidemia |
| 3 (30%) |
|
|
CT measurement
The volume of EAT with areas of SAT and VAT were
measured before and after the performance of the above weight
reduction program using MDCT. All scans were performed using a
64-slice CT scanner (Aquillion 64®; Toshiba, Tokyo,
Japan). A non-enhanced CT was performed by retrospective ECG gating
according to the following protocol; a tube voltage of 120 kV and
tube current 200 mA using ECG-correlated tube current modulation.
EAT volume was quantified by the sum of areas of EAT on
cross-sectional CT images from the root of coronary arteries to the
apex using the volume analysis software tool of a workstation
(18). In detail, the axial source
image was traced on the pericardial sac manually from the left main
trunk to the left ventricular apex. The 3-dimentional image of the
heart was constructed by totaling of these slices. Fat voxels were
identified using the threshold attenuation values of −150 to −50
HU. The total volume was EAT as a result of the processing. The
areas of SAT and VAT were determined by measuring a −150 to −50 HU
areas using a modification of the method of CT scanning at the
cross-sectional umbilical level (19).
Statistical analysis
Data in the text, tables, and figures are expressed
as mean ± SD For gene expression analysis, differences were
analyzed by unpaired Student t-test or Mann-Whitney U-test. For
human imaging study, differences in continuous variables were
analyzed by unpaired Student t-test. A t-test with 95% confidence
interval (CI) was used to calculate differences of EAT volume, VAT
and SAT area, and weight, between baseline and after weight
reduction. Reductions (%) in study parameters were presented by the
proportions (%) of reduced values at the endpoints of program from
the values before starting the program. Relations between the
reductions among weights, EAT, VAT, and SAT were analyzed using
correlation analysis with linear-regression analyses. These results
are presented as coefficient of determination (r2),
which indicates the percentage of variation in the dependent
variable that can be explained by the independent variables, with
the ranges of 95% CI. Statistical analyses were performed using
PASW Statistics 18 (SPSS Inc., Chicago, IL, USA), and P<0.05 was
considered to indicate a statisticaly significant difference.
Results
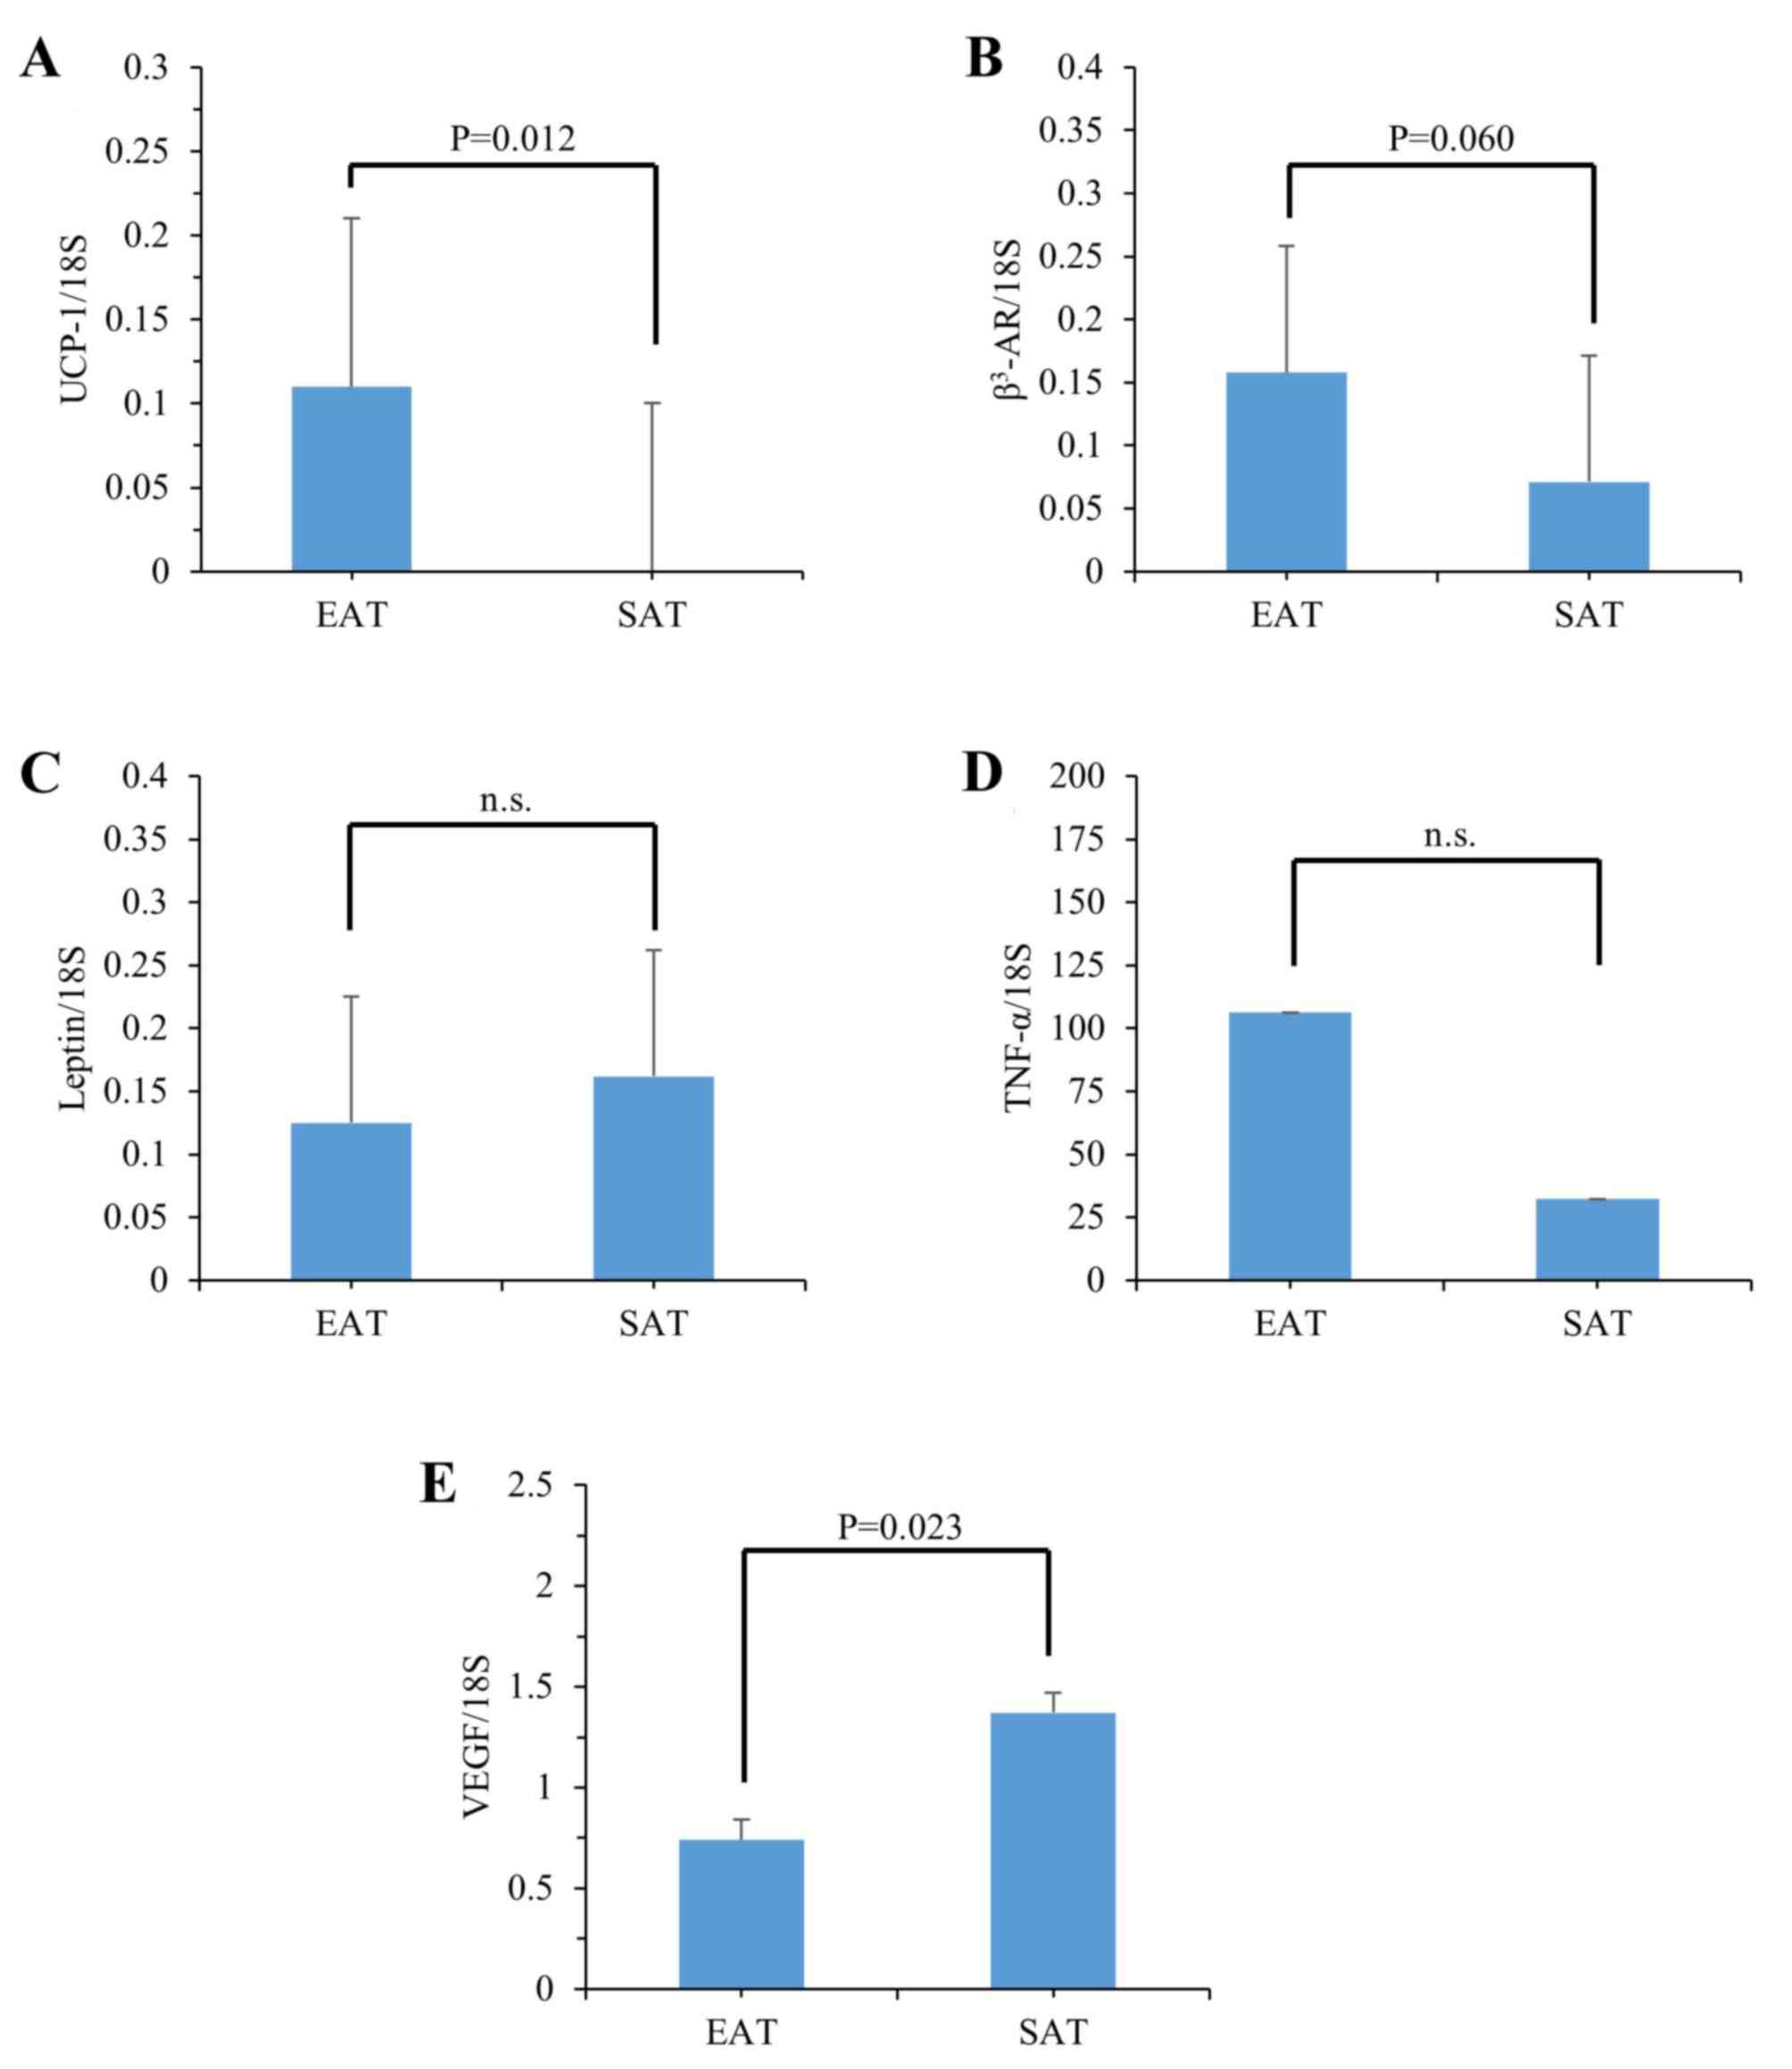
Thermogenesis genes are increased in
human autopsy EAT
In order to determine the expression of genes
involved in the thermogenetic function of EAT, we first studied two
genes essential for the thermogenic activity in brown/beige
adipocytes, i.e., uncoupling protein (UCP)-1 and β3-AR, and the
expression of leptin, TNF-α and VEGF as representative genes
involved in adipogenesis, inflammation, and angiogenesis,
respectively, in 15 autopsy EAT and SAT samples (Fig. 1; Table
I). The expression levels of UCP-1 were significantly increased
in EAT (Fig. 1A), and those of
β3-AR tended to be increased in EAT (Fig. 1B), compared with those of SAT,
respectively. There were no significant differences between EAT and
SAT in the expression of leptin (Fig.
1C) or TNF-α (Fig. 1D), and
the expression of VEGF was significantly decreased in EAT, compared
with that in SAT (Fig. 1E). These
results suggested that the expression of genes essential for
thermogenesis in brown/beige adipocytes was specifically induced in
EAT relative to SAT.
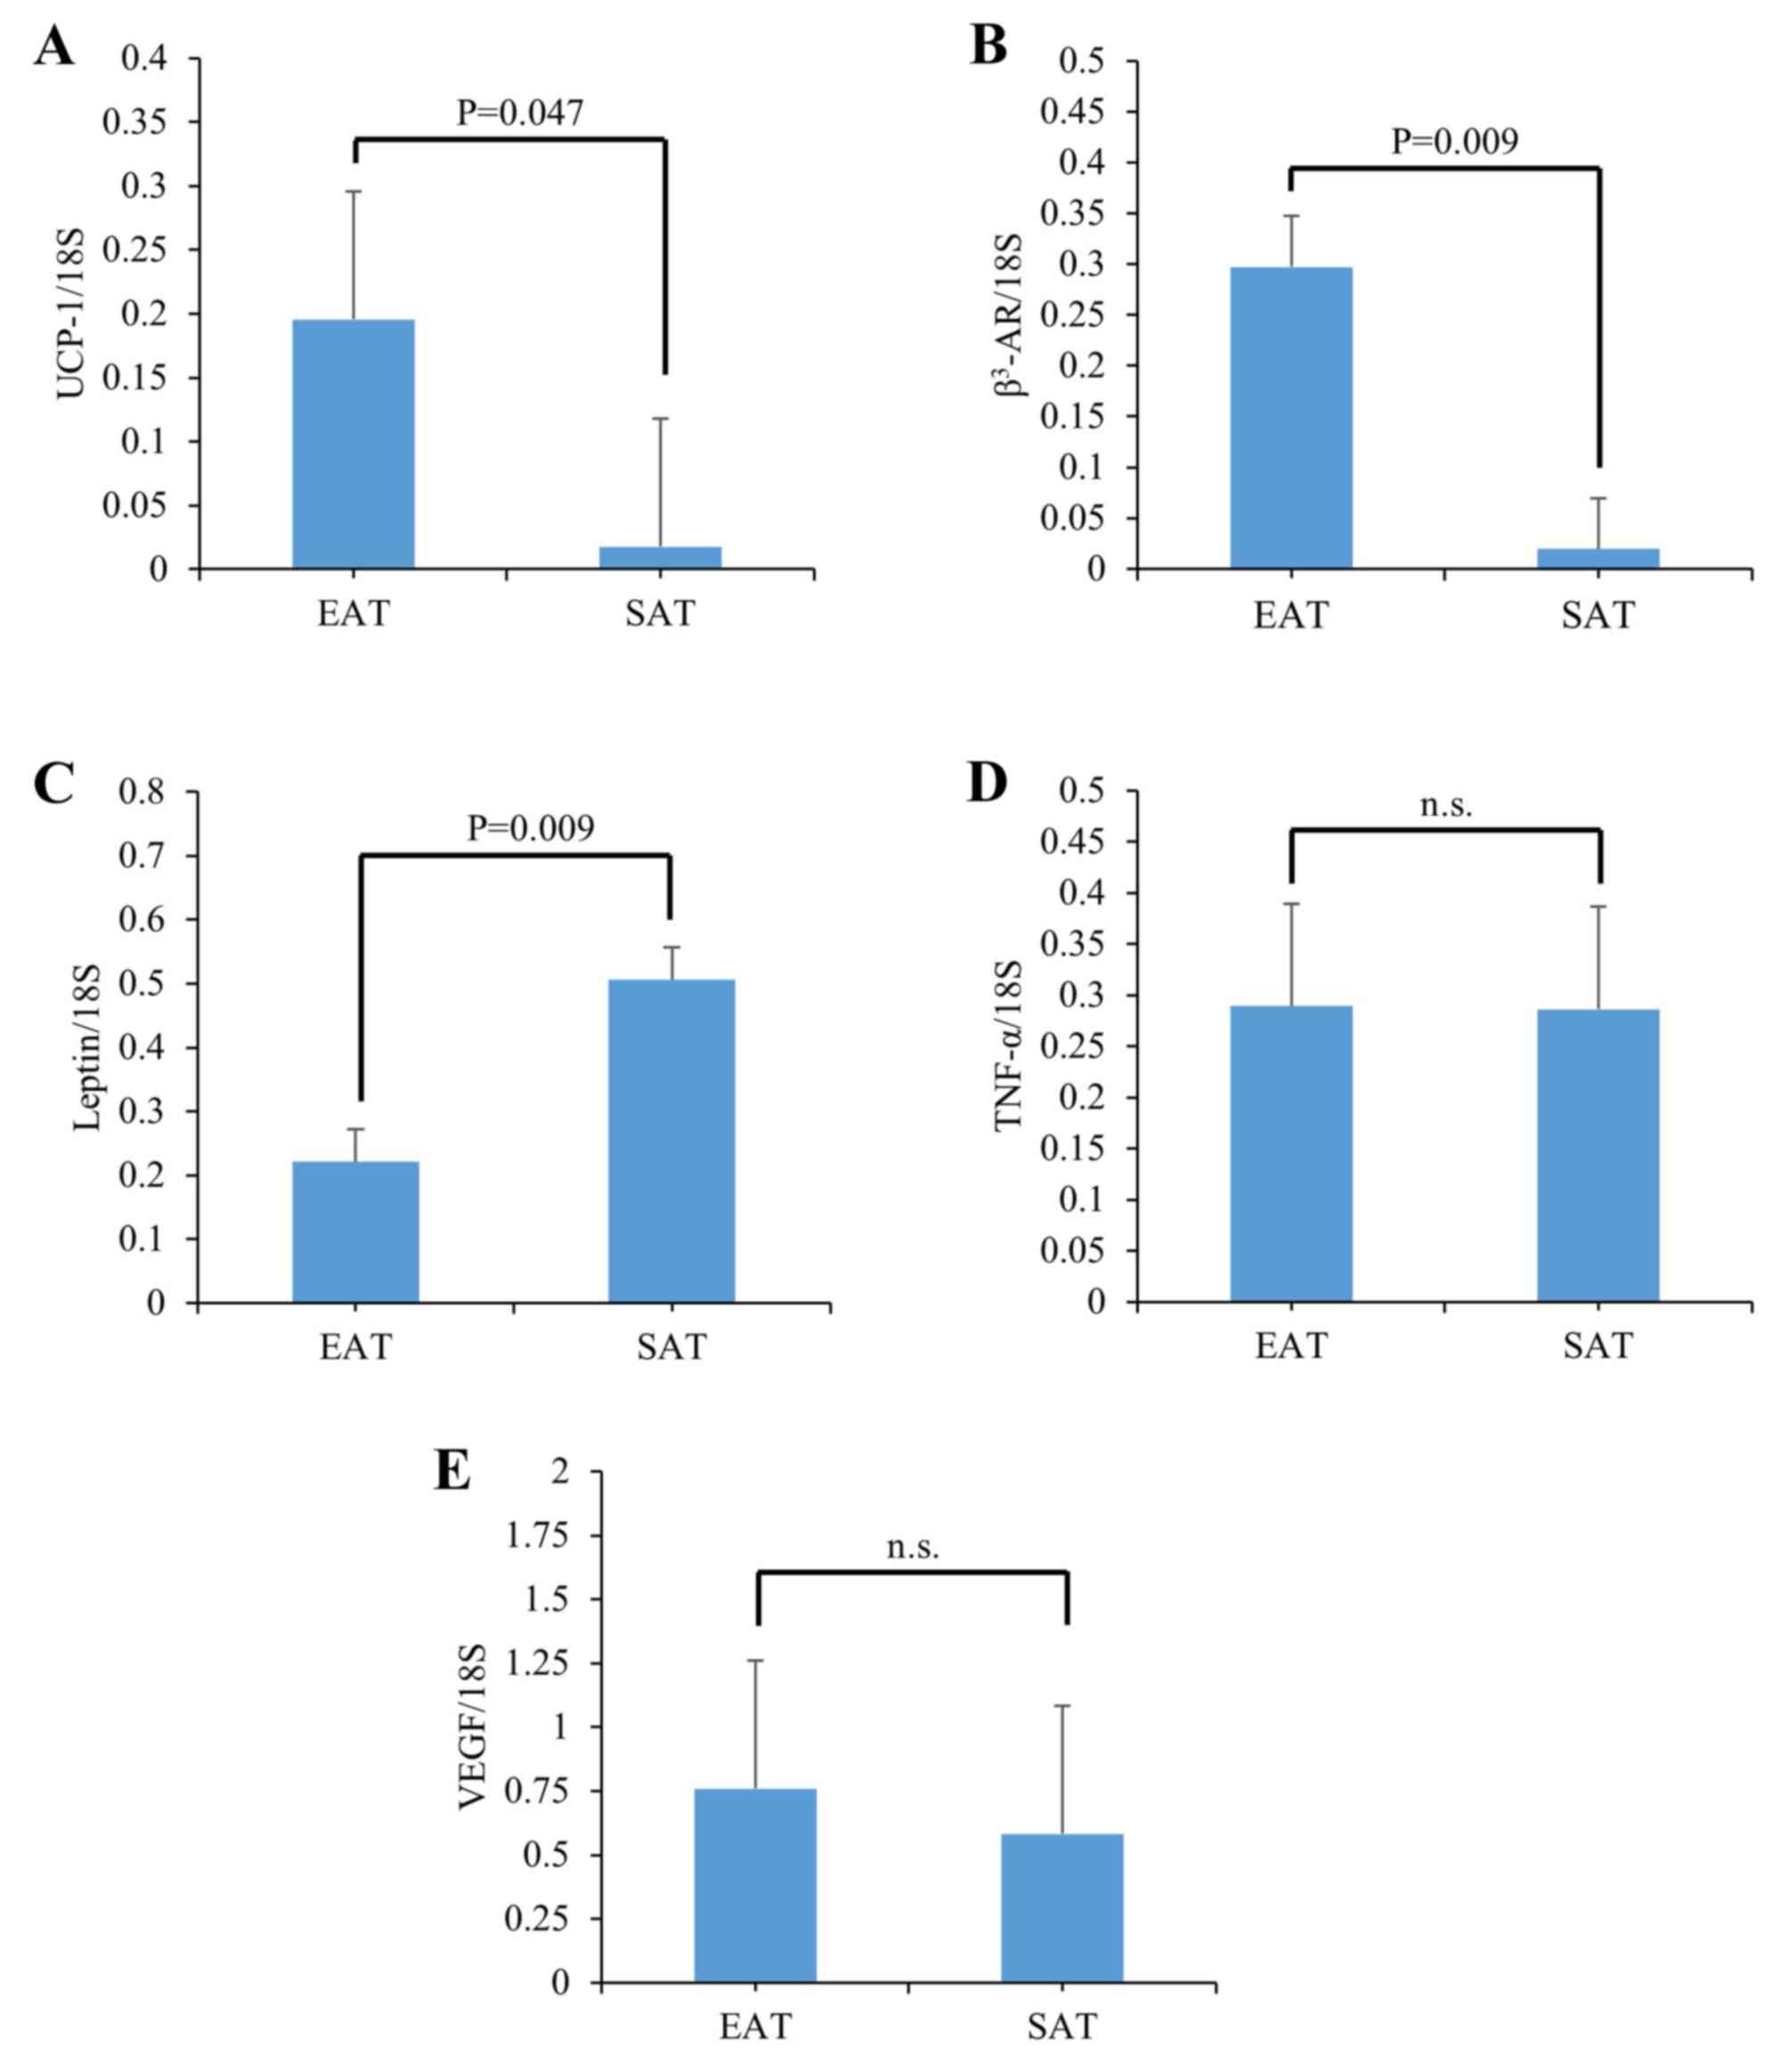
Thermogenesis genes are reproducibly
induced in mouse EAT
Because the heterogeneous pathological backgrounds
in human autopsy samples may cause the increased expression of
thermogenesis genes, we next analyzed the expression of the same
genes in a mouse model, i.e., db/db mice (Fig. 2), because considerable amounts of
EAT were observed under diabetic conditions in these animals (data
not shown). Significantly, the levels of UCP-1 and β3-AR were
increased 16.6-fold and 15.2-fold over those in SAT, respectively
(Fig. 2A and B). On the other
hand, leptin expression levels were significantly decreased in EAT
compared with those in SAT ((Fig.
2C). The TNF-α and VEGF levels were not different between EAT
and SAT ((Fig. 2D and E). Thus,
the increases of thermogenesis genes UCP-1 and β3-AR, observed in
the human autopsy EAT of various pathological backgrounds, were
reproduced in an analogous mouse model.
Expression of thermogenesis genes is
drastically induced in response to differentiation stimulation in
MCs from human autopsy EAT
In order to reveal the mechanism by which the
expression levels of thermogenesis genes were increased in the
human autopsy and murine EAT samples, we studied the regulation of
gene expression in response to the stimulation of differentiation
to brown mature adipocytes in MCs prepared from human autopsy EAT
and SAT samples (Fig. 3). The
UCP-1 expression levels were drastically increased in MCs both from
human EAT and SAT after differentiation stimulation when compared
with those in undifferentiated MCs (Fig. 3A). The expression levels of UCP-1
in differentiated adipocytes from EAT were 3.2-fold higher than
those in SAT, whereas the levels in undifferentiated MCs were not
significantly different between EAT and SAT. The β3-AR expression
levels were also increased in differentiated MCs, compared with
those in undifferentiated MCs, both from EAT and SAT (Fig. 3B). Finally, the β3-AR levels in EAT
were 12.6-fold higher than those in SAT, whereas the levels in
undifferentiated MCs from EAT or SAT were not significantly
different. These results indicate that the sensitivity change in
response to the differentiation stimulations to mature brown
adipocytes in MCs was much more pronounced in EAT than that in SAT,
and thus, the different sensitivity of MCs may cause the
differences in thermogenesis gene expression between EAT and SAT in
humans.
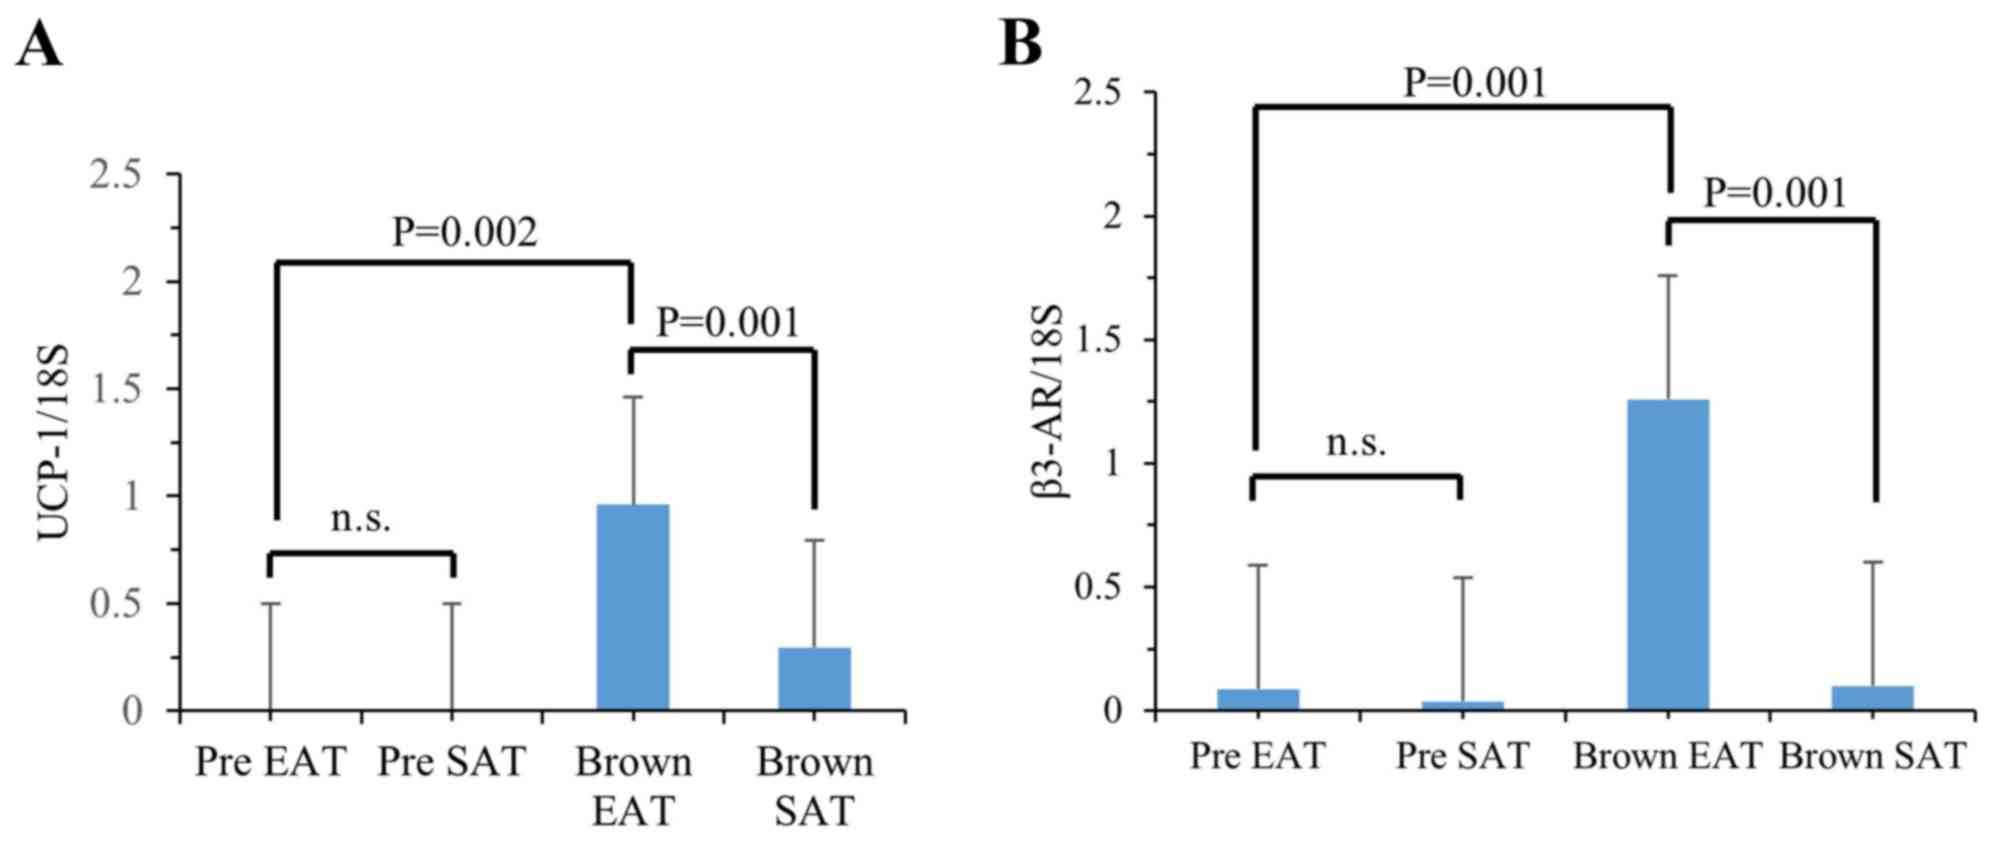 | Figure 3.The levels of mRNA for UCP-1 (A) and
β3-AR (B) in MCs from EAT or SAT of a human autopsy sample. mRNA
was prepared from the cells incubated with/without browning
differentiation stimulation for 8 days, and each mRNA level was
analyzed by reverse transcription-polymerase chain reaction, as
described in Materials and Methods. mRNA levels relative to 18S RNA
levels were calculated and expressed as the mean ± standard
deviation (n=3). The statistical differences were analyzed by the
unpaired Student t-test. Pre EAT, MCs from EAT without
differentiation stimulation; pre SAT, MCs from SAT without
differentiation stimulation; brown EAT, MCs from EAT with browning
differentiation stimulation; brown SAT, MCs from SAT with browning
differentiation stimulation. n.s., not significant; UCP, uncoupling
protein; MCs, mesenchymal cells; EAT, epicardial adipose tissue;
SAT, subcutaneous adipose tissue; β3-AR, β3-adrenergic
receptor. |
The sensitivity of the reduction in
accumulated EAT against weight reduction therapy is different from
those in SAT in obese patients
In order to define the pathophysiological properties
of human EAT in the clinical setting and considering the above
characterized differential features of cultured cells, we performed
a comparative MDCT imaging study in obese patients on a weight
reduction program for the evaluation of changes in the volumes of
EAT, and by CT in SAT and VAT. The 10 patients' (8 males and 2
females; 44.6±16.2 years old) body weights at the beginning and at
the end of the weight reduction (duration of therapy, 44.1 ±27.6
days) were 109.54±28.87 kg and 100.24±26.73 kg, respectively
(Tables II and III). After completion of the therapy,
in addition to body weight, values of SAT and VAT were also
significantly decreased in the patients when compared to the values
before therapy. However, the degrees of EAT were not significantly
different before and after the therapy. The proportions of
reductions in weights were clearly and positively correlated with
those in SAT (r2=0.487, P=0.025) and VAT
(r2=0.806, P<0.001), but not with those in EAT
(r2=0.103, P=0.365) (Table
IV). The reductions in EAT were not correlated with those in
SAT (r2=0.259, P=0.133), nor with those in VAT
(r2=0.158, P=0.256), whereas there was a clear positive
correlation between SAT and VAT (r2=0.614, P=0.007)
(Table V). These results, obtained
from a multiple imaging study using CT, suggest that in obese
patients the sensitivity of the accumulated EAT against weight
reduction therapy by dietary calorie restriction with daily
exercise is different from those in SAT and VAT.
| Table III.Adipose tissues and weights of obese
patients before and after weight reduction therapy and their
reductions after therapy. |
Table III.
Adipose tissues and weights of obese
patients before and after weight reduction therapy and their
reductions after therapy.
| Variables | Before (n=10) | After (n=10) | P-value |
|---|
| EAT (ml) | 248.65±36.57 | 237.47±57.17 |
0.249 |
| VAT
(mm2) | 190.93±74.78 | 153.91±72.70 |
0.001 |
| SAT
(mm2) | 431.63±206.76 | 375.37±206.16 |
0.003 |
| Body weight
(kg) | 109.54±28.87 | 100.24±26.73 | <0.001 |
| BMI
(kg/m2) | 38.75±9.36 | 35.45±8.65 | <0.001 |
| Reduction in weight
(%) | 8.43±3.19 |
|
| Reduction in BMI
(%) | 8.43±3.19 |
|
| Reduction in EAT
(%) | 5.49±12.86 |
|
| Reduction in VAT
(%) | 20.61±14.77 |
|
| Reduction in SAT
(%) | 15.58±11.48 |
|
| Table IV.Comparisons of reductions in adipose
tissues with weights after therapy. |
Table IV.
Comparisons of reductions in adipose
tissues with weights after therapy.
| Variables | r2 | 95% CI | P-value |
|---|
| Reduction in
EAT | 0.103 | −0.112~0.271 |
0.365 |
| Reduction in
VAT | 0.806 |
0.116~0.272 | <0.001 |
| Reduction in
SAT | 0.487 |
0.032~0.356 |
0.025 |
| Table V.Correlations between pairs of
reductions among EAT, SAT and VAT. |
Table V.
Correlations between pairs of
reductions among EAT, SAT and VAT.
| Variables | r2 | 95% CI | P-value |
|---|
| EAT vs. VAT | 0.158 | −0.306~0.997 | 0.256 |
| EAT vs. SAT | 0.259 | −0.216~1.356 | 0.133 |
| VAT vs. SAT | 0.614 |
0.356~1.659 | 0.007 |
Discussion
In the present study, we showed that the expression
of thermogenesis genes is induced in human EAT, in comparison to
those in SAT, in 15 autopsy samples, and that the specific changes
in expression pattern was also observed in murine EAT. Furthermore,
the enhanced expression in EAT relative to that in SAT was also
clearly present in the human MCs prepared from an autopsy EAT
sample after differentiation stimulation to brown adipocytes. Thus,
human tissue and cell analyses revealed an increased expression of
thermogenesis genes as a unique property of EAT. A subsequent
CT-imaging study demonstrated that the volume changes in the EAT
accumulation by weight reduction therapy was not related to the
weight reduction itself, whereas those of SAT and VAT were clearly
associated with the weight reduction in obese patients. These
results obtained in tissues and cells, and by imaging, indicate
that EAT is developmentally rich in brown/beige adipocytes in
comparison to SAT, and suggest that these cellular characteristics
may be involved in the unique sensitivity of EAT against weight
reduction therapy, significantly different from other adipose
tissues.
We have recently identified a key thermogenesis
inhibitor, sLR11, which functions in maintaining the adequate
balance between lipid storage and oxidation in response to changing
environmental conditions (5). The
deletion of LR11 in mice causes the ectopic appearance of
beige/brown adipocytes in subcutaneous white adipose tissues
associated with significantly enhanced expression levels of UCP-1
and β3-AR. These changes were accompanied by a phenotype of
increased cellular, and also systemic, energy expenditure in
response to adrenergic stimulations in the ectopic beige/brown
adipocytes (5). EAT has been
reported to consist of a cluster of unique adipocytes among various
fat tissues, the metabolic characteristics of which are increased
lipolysis properties and β-adrenergic activities (7,8).
Accumulating evidence using gene expression analyses of human
tissues and animal models have shown enhanced expression of UCP-1
and β3-AR in EAT, suggesting an increased activity of thermogenesis
together with lipolysis in response to adrenergic stimulation
(9,10). In this study, we have shown that
the enhanced expression of UCP-1 and β3-AR in human-autopsy and
mouse EAT were manifest in MCs derived from a human autopsy EAT
sample after stimulation of differentiation to brown adipocytes;
notably, the enhancement after stimulation was clearly more evident
in MCs derived from EAT than from SAT. These results from cell
culture experiments may indicate a thermogenetic character in human
EAT different from that of other fat tissues, at least from SAT.
The EAT characteristics likely are based on the differences in the
properties and/or numbers of precursor cells in the tissue, rather
than on the cells' environmental conditions. Thus, the necessity
for expanding these studies into analyses using other clones from
human epicardial MCs is clearly indicated.
Another (patho-)physiological property which has
been suggested by prior studies is the possibly different
sensitivity of accumulated EAT to the weight reduction therapy in
obese patients. However, the previous imaging studies have shown
rather heterogeneous results concerning the associations of
reductions in EAT with those in body weights, SAT, or VAT (20–23).
One possible reason for these diverging results has been suggested
to be the different imaging methodologies used for the measurement
of EAT accumulations (20);
previous studies have often quantitated EAT thickness before and
after weight reduction therapy using echocardiography, and the
volume using MDCT or magnetic resonance imaging (MRI) only at the
beginning, and thus the associations of weight or other adipose
tissue reduction with the EAT reduction have been proposed to be
better determined using MDCT (20). Consequently, here we analyzed the
volumes of EAT before and after weight reduction therapy using MDCT
in 10 obese patients. The results showed that reductions in the
accumulation of EAT were not associated with those in weight or in
SAT, whereas there were clear relationships between pairs of
weight, SAT, and VAT, as previously reported (22,24,25).
Thus, taken together, our results support the view that the
response of EAT accumulation differs from that of those in SAT
accumulation, possibly uncovering another unique EAT property in
addition to the observed enhanced thermogenesis gene
expression.
Limitations of the present study are that the 15
autopsy samples are principally of heterogeneous origin (Table I), although samples from cases
treated with intensive adrenergic therapy were excluded (see
Materials and Methods). Particularly, the MCs from EAT and SAT were
successfully prepared only from an autopsy sample. In the imaging
study, subjects were collected by a single institute, and thus the
subject number for extensive analysis using multi-variable analyses
was rather small. The methods for comparisons of factors might have
to be re-evaluated, in addition to the evaluation using the
reduction (%) in a future study, as the comparisons were performed
between the volume of EAT (ml) and the areas (mm2) of
SAT and VAT. Clearly, further studies using subjects with different
characteristics (e.g., sex, age, BMI, and possibly, therapy
program) would be helpful for the evaluation of the pathological
significance of EAT in weight reduction therapy.
In conclusion, the present human tissue, cell, and
imaging studies about EAT properties showed that the
susceptibilities of EAT for expression of browning-genes and diet-
and exercise-induced volume reduction were different from those of
SAT. Considering the insights gained from this study, EAT may be
proposed to constitute a unique adipose tissue reflecting the
pathological status of the metabolic homeostasis of cardiac and/or
cardiovascular cells, in addition to the systemic metabolism as
observed in SAT and VAT.
Acknowledgements
The present study was supported, in part, by
Grants-in-aid for Scientific Research from the Japanese Ministry of
Education, Culture, Sports, Science and Technology to Hideaki Bujo
(grant no. 24390231 and 15K15198) and Meizi Jiang (grant no.
24790907).
Competing Interests
The authors declare that they have no competing
interests.
References
|
1
|
Bostrom P, Wu J, Jedrychowski MP, Korde A,
Ye L, Lo JC, Rasbach KA, Boström EA, Choi JH, Long JZ, et al: A
PGC1-α-dependent myokine that drives brown-fat-like development of
white fat and thermogenesis. Nature. 481:463–468. 2012. View Article : Google Scholar : PubMed/NCBI
|
|
2
|
Cypess AM, Lehman S, Williams G, Tal I,
Rodman D, Goldfine AB, Kuo FC, Palmer EL, Tseng YH, Doria A, et al:
Identification and importance of brown adipose tissue in adult
humans. N Engl J Med. 360:1509–1517. 2009. View Article : Google Scholar : PubMed/NCBI
|
|
3
|
Zingaretti MC, Crosta F, Vitali A,
Guerrieri M, Frontini A, Cannon B, Nedergaard J and Cinti S: The
presence of UCP1 demonstrates that metabolically active adipose
tissue in the neck of adult humans truly represents brown adipose
tissue. FASEB J. 23:3113–3120. 2009. View Article : Google Scholar : PubMed/NCBI
|
|
4
|
Ouellet V, Routhier-Labadie A, Bellemare
W, Lakhal-Chaieb L, Turcotte E, Carpentier AC and Richard D:
Outdoor temperature, age, sex, body mass index and diabetic status
determine the prevalence, mass and glucose-uptake activity of
18F-FDG-detected BAT in humans. J Clin Endocrinol Metab.
96:192–199. 2011. View Article : Google Scholar : PubMed/NCBI
|
|
5
|
Whittle AJ, Jiang M, Peirce V, Relat J,
Virtue S, Ebinuma H, Fukamachi I, Yamaguchi T, Takahashi M, Murano
T, et al: Soluble LR11/SorLA represses thermogenesis in adipose
tissue and correlates with BMI in humans. Nat Commun. 6:89512015.
View Article : Google Scholar : PubMed/NCBI
|
|
6
|
Iacobellis G, Corradi D and Sharma AM:
Epicardial adipose tissue: Anatomic, biomolecular and clinical
relationships with the heart. Nat Clin Pract Cardiovasc Med.
2:536–543. 2005. View Article : Google Scholar : PubMed/NCBI
|
|
7
|
Marchington JM, Mattacks CA and Pond CM:
Adipose tissue in the mammalian heart and pericardium: Structure,
foetal development and biochemical properties. Comp Biochem Physiol
B. 94:225–232. 1989. View Article : Google Scholar : PubMed/NCBI
|
|
8
|
Mattacks CA and Pond CM: Site-specific and
sex differences in the rates of fatty acid/triacylglycerol
substrate cycling in adipose, tissue and muscle of sedentary and
exercised dwarf hamsters (Phodopus sungorus). Int J Obes.
12:585–597. 1988.PubMed/NCBI
|
|
9
|
Iacobellis G: Local and systemic effects
of the multifaceted epicardial adipose tissue depot. Nat Rev
Endocrinol. 11:363–371. 2015. View Article : Google Scholar : PubMed/NCBI
|
|
10
|
Chechi K and Richard D: Thermogenic
potential and physiological relevance of human epicardial adipose
tissue. Int J Obes Suppl. 5 Suppl 1:S28–S34. 2015. View Article : Google Scholar : PubMed/NCBI
|
|
11
|
Sacks HS, Fain JN, Bahouth SW, Ojha S,
Frontini A, Budge H, Cinti S and Symonds ME: Adult epicardial fat
exhibits beige features. J Clin Endocrinol Metab. 98:E1448–E1455.
2013. View Article : Google Scholar : PubMed/NCBI
|
|
12
|
Terai K, Jiang M, Tokuyama W, Murano T,
Takada N, Fujimura K, Ebinuma H, Kishimoto T, Hiruta N, Schneider
WJ and Bujo H: Levels of soluble LR11/SorLA are highly increased in
the bile of patients with biliary tract and pancreatic cancers.
Clin Chim Acta. 457:130–136. 2016. View Article : Google Scholar : PubMed/NCBI
|
|
13
|
Committee of the Japan Diabetes Society on
the Diagnostic Criteria of Diabetes Mellitus, . Seino Y, Nanjo K,
Tajima N, Kadowaki T, Kashiwagi A, Araki E, Ito C, Inagaki N,
Iwamoto Y, et al: Report of the committee on the classification and
diagnostic criteria of diabetes mellitus. J Diabetes Investig.
1:212–228. 2010. View Article : Google Scholar : PubMed/NCBI
|
|
14
|
Shimamoto K, Ando K, Fujita T, Hasebe N,
Higaki J, Horiuchi M, Imai Y, Imaizumi T, Ishimitsu T, Ito M, et
al: The japanese society of hypertension guidelines for the
management of hypertension (JSH 2014). Hypertens Res. 37:253–390.
2014. View Article : Google Scholar : PubMed/NCBI
|
|
15
|
Teramoto T, Sasaki J, Ishibashi S, Birou
S, Daida H, Dohi S, Egusa G, Hiro T, Hirobe K, Iida M, et al:
Diagnostic criteria for dyslipidemia. J Atheroscler Thromb.
20:655–660. 2013. View Article : Google Scholar : PubMed/NCBI
|
|
16
|
Imai E, Matsuo S, Makino H, Watanabe T,
Akizawa T, Nitta K, Iimuro S, Ohashi Y and Hishida A: CKD-JAC Study
Group: Chronic kidney disease japan cohort (CKD-JAC) study: Design
and methods. Hypertens Res. 31:1101–1107. 2008. View Article : Google Scholar : PubMed/NCBI
|
|
17
|
Examination Committee of Criteria for
‘Obesity Disease’ in Japan; Japan Society for the Study of Obesity:
New criteria for ‘obesity disease’ in Japan. Circ J. 66:987–992.
2002.PubMed/NCBI
|
|
18
|
Sarin S, Wenger C, Marwaha A, Qureshi A,
Go BD, Woomert CA, Clark K, Nassef LA and Shirani J: Clinical
significance of epicardial fat measured using cardiac multislice
computed tomography. Am J Cardiol. 102:767–771. 2008. View Article : Google Scholar : PubMed/NCBI
|
|
19
|
Borkan GA, Gerzof SG, Robbins AH, Hults
DE, Silbert CK and Silbert JE: Assessment of abdominal fat content
by computed tomography. Am J Clin Nutr. 36:172–177. 1982.
View Article : Google Scholar : PubMed/NCBI
|
|
20
|
Sacks HS: Weight loss in obesity reduces
epicardial fat thickness; so what? J Appl Physiol (1985). 106:1–2.
2009. View Article : Google Scholar : PubMed/NCBI
|
|
21
|
Rabkin SW and Campbell H: Comparison of
reducing epicardial fat by exercise, diet or bariatric surgery
weight loss strategies: A systematic review and meta-analysis. Obes
Rev. 16:406–415. 2015. View Article : Google Scholar : PubMed/NCBI
|
|
22
|
Foppa M, Pond KK, Jones DB, Schneider B,
Kissinger KV and Manning WJ: Subcutaneous fat thickness, but not
epicardial fat thickness, parallels weight reduction three months
after bariatric surgery: A cardiac magnetic resonance study. Int J
Cardiol. 168:4532–4533. 2013. View Article : Google Scholar : PubMed/NCBI
|
|
23
|
Willens HJ, Byers P, Chirinos JA, Labrador
E, Hare JM and de Marchena E: Effects of weight loss after
bariatric surgery on epicardial fat measured using
echocardiography. Am J Cardiol. 99:1242–1245. 2007. View Article : Google Scholar : PubMed/NCBI
|
|
24
|
Doucet E, St-Pierre S, Almeras N, Alméras
N, Imbeault P, Mauriège P, Pascot A, Després JP and Tremblay A:
Reduction of visceral adipose tissue during weight loss. Eur J Clin
Nutr. 56:297–304. 2002. View Article : Google Scholar : PubMed/NCBI
|
|
25
|
Stallone DD, Stunkard AJ, Wadden TA,
Foster GD, Boorstein J and Arger P: Weight loss and body fat
distribution: A feasibility study using computed tomography. Int J
Obes. 15:775–780. 1991.PubMed/NCBI
|