Introduction
Nonalcoholic fatty liver disease (NAFLD), one of the
most common hepatic conditions, is closely associated with obesity,
type II diabetes and insulin resistance. NAFLD encompasses multiple
pathological events, including steatosis, non-alcoholic
steatohepatitis (NASH) and cirrhosis, in addition to end-stage
liver disease (1,2). In the past, NAFLD has been more
common in Western countries, although the incidence of NAFLD has
increased in the Asian-Pacific region in recent years (3). Notably, the prevalence of NAFLD
amongst younger populations is increasing. NAFLD poses a great
threat to human health and society and is a important challenge in
the liver disease field.
The development of NAFLD is the result of a
combination of genetic, environmental and metabolic factors. At
present, the most widely accepted theory of NAFLD pathogenesis is
the two-hits theory, in which lipid accumulation in hepatocytes
triggers a series of cytotoxic events that subsequently induce
liver inflammation. Numerous pathological processes are induced,
including insulin resistance, leptin deficiency, oxidative stress,
fat accumulation and liver tissue inflammation (4). Accumulating evidence from previous
studies examining the genetic and metabolic factors of NAFLD
pathogenesis have demonstrated that the abnormal expression or
mutation of key genes leads to the development and progression of
NAFLD. These genes include signal transducer and activator of
transcription 3 (STAT3), Krueppel-like factor 6 (KLF6), peroxisome
proliferator-activated receptors (PPARs) and
methylenetetrahydrofolate reductase (MTHFR), in addition to various
pro-inflammatory cytokines (5).
The interleukin (IL)-6 receptor subunit β-STAT3 signaling pathway
is activated in NAFLD and may result in increased insulin
resistance (6). KLF6 may mediate
glucose tolerance and insulin response in NAFLD. Furthermore, KLF6
mediates PPARα signaling induction (7,8).
Gene polymorphisms (C677T and A1298C) of MTHFR are reported to be
closely associated with susceptibility to NAFLD (9,10).
However, the exact mechanisms remain unclear due to the complex
pathogenesis of this disease. Therefore, it is crucial to
understand the precise molecular mechanisms involved in the
development and progression of NAFLD in order to develop and
evaluate effective diagnostic or management strategies.
In the present study, two mRNA microarray datasets
from the Gene Expression Omnibus (GEO) were downloaded and analyzed
to identify differentially expressed genes (DEGs) among healthy
control (HC), steatosis (SS) and NASH groups. Gene Ontology (GO),
Kyoto Encyclopedia of Genes and Genomes (KEGG) pathway enrichment
and protein-protein interaction (PPI) network analyses were
performed to understand the potential molecular mechanisms of fat
accumulation and inflammation in hepatic cells. A total of five hub
genes were identified, which may be candidate diagnostic or
therapeutic biomarkers for NAFLD.
Materials and methods
Data analysis
The gene expression datasets GSE33814 and GSE89632
were downloaded from the GEO (www.ncbi.nlm.nih.gov/geo) (11) database. Samples in the above
datasets were divided into three groups: SS vs. HC, NASH vs. HC,
and NASH vs. SS. Detailed parameters of the datasets are presented
in Table I.
 | Table I.Details of the non-alcoholic fatty
liver disease datasets retrieved from the GEO database. |
Table I.
Details of the non-alcoholic fatty
liver disease datasets retrieved from the GEO database.
| Author, year | GEO dataset | Platform | No. of samples | No. of cases | Organism | (Refs.) |
|---|
| Starmann, 2012 | GSE33814 | Illumina HumanWG-6
v3.0 expression beadchip | 44 | HC, 13 SS, 19 NASH,
12 | Homo
sapiens | (2) |
| Arendt, 2015 | GSE89632 | Illumina HumanHT-12
WG-DASL V4.0 R2 expression beadchip | 63 | HC, 24 SS, 20 NASH,
19 | Homo
sapiens | (4) |
Microarray data were submitted to the online
database repository GEO2R (www.ncbi.nlm.nih.gov/geo/geo2r) to identify DEGs among
the groups. GEO2R is an interactional and accessible online tool
that allows investigators to compare two or more datasets and
obtain a list of DEGs in GEO series across different experimental
conditions. GEO2R, as well as the GEO query and Limma packages in
R, were used to analyze the original microarray data (12). The distribution of the data was
visualized using a box-and-whisker plot. A log fold change of
>0.3 and an adjusted P-value of <0.05 was considered to
indicate a statistically significant difference. Probe sets without
corresponding gene symbols or genes with more than one probe set
were removed or averaged, respectively. Subsequently, genes that
matched the screening criteria in both datasets were overlapped in
a Venn diagram in order to obtain the candidate DEGs.
Functional enrichment analyses of the
DEGs
The Database for Annotation, Visualization and
Integrated Discovery (DAVID; version 6.8; david.ncifcrf.gov) is an online biological information
database that integrates biological data and analysis tools. DAVID
provides a comprehensive set of functional annotation information
on genes and proteins for users to extract biological information
(13). To analyze the function of
the DEGs, functional annotation and biological analyses were
performed using DAVID. P<0.05 was considered to indicate a
statistically significant result.
Construction of PPI networks and
analysis of modules
The DEGs were imported into the Search Tool for the
Retrieval of Interacting Genes (STRING; version 10.0; string-db.org) online database for PPI network
construction (14). Genes without
connections to other genes were removed. Interactions with a
combined score of >0.9 were considered statistically
significant. PPI networks were drawn using Cytoscape (version
3.5.1), an open source bioinformatics software platform for
visualizing molecular interaction networks (15). The size of nodes represents the
degree of one gene. The degree of one gene means the number of its
interactions with other genes. The higher the degree of one gene,
the more important it is in the PPI network. Different colored
nodes represent different groups. The top three modules in the PPI
networks were identified using the Cytoscape plug-in app
multicontrast delayed enhancement (MCODE) (16). The criteria for selecting modules
were as follows: MCODE score, >5; degree cutoff, 10; node score
cutoff, 0.2; and k-score, 2.
Prediction of the candidate microRNAs
(miRNAs/miRs), drugs and diseases associated with the identified
DEGs
An analysis to identify the KEGG pathways, miRNAs,
drugs and diseases associated with the hub genes in these modules
was performed using the WEB-based Gene SeT AnaLysis Toolkit
(Webgestalt; www.webgestalt.org). Webgestalt is an online tool used
to analyze functional enrichment in gene sets and is an integrated
system for data mining, including KEGG pathways, GO, miRNAs, drugs
and diseases (17). P<0.05 was
considered to indicate a statistically significant result.
Cell culture, construction of cell
model and validation of hub genes in vitro
To validate the results of the bioinformatics
analysis, the expression of hub genes was assessed in vitro.
The human hepatic cell line LO2 was derived from the primary
culture of human normal liver cells via continuous culture in
vitro and is capable of continuous passage. LO2 cell growth and
death is very similar to that of normal liver cells. Compared with
HepG2 cells, LO2 are more sensitive to lipid metabolism. The cell
line is widely used to assess the molecular effects of genes or
drugs on fatty liver cells in vitro (18,19).
LO2 cells were bought from Chongqing Bopei Biotechnology Co., Ltd.
(Chongqing, China; www.mengbio.com) and were preserved in the Chongqing
Key Laboratory of Infectious Diseases and Parasitic Disease
(Chongqing, China). Cells were cultured in Dulbecco's modified
Eagle's medium (Gibco; Thermo Fisher Scientific, Inc., Waltham, MA,
USA) supplemented with 10% fetal bovine serum (Gibco; Thermo Fisher
Scientific, Inc.) and 1% penicillin/streptomycin at 37°C in a 5%
CO2 incubator until cells reached 90% confluence. Cells
were subsequently seeded in a 6-well plate (5×10⁴
cells/ml) and incubated for 24 h prior to treatment with 200 µM
oleic acid (OA; Sigma-Aldrich; Merck KGaA Darmstadt, Germany) in
fatty acid-free 5% bovine serum albumin (BSA; Sigma-Aldrich; Merck
KGaA; pre-warmed to 50°C) for 24 h to model steatotic cells.
Control cells were treated with fatty acid free 5% BSA without OA.
Cells were subsequently harvested for quantification.
RNA extraction and reverse
transcription-quantitative polymerase chain reaction (RT-qPCR)
Total RNA was isolated using TRIzol reagent
(Invitrogen; Thermo Fisher Scientific, Inc.) and further purified
using an RNeasy Mini kit (Qiagen GmbH, Hilden, Germany), according
to the manufacturer's protocol. The concentration and quality of
RNA was verified by spectrophotometry (NanoDrop 2000; Thermo Fisher
Scientific, Inc.). cDNA was synthesized using a PrimeScript™ RT
Reagent kit (Takara Biotechnology Co., Ltd., Dalian, China)
according to the manufacturer's protocol. qPCR was performed using
a LightCycler system (Roche Diagnostics, Basel, Switzerland) in a
volume of 10 µl with the SYBR Premix Ex Taq™ II kit (Takara
Biotechnology Co., Ltd.). The gene-specific primers were purchased
from Sangon Biotech Co., Ltd. (Shanghai, China) and the sequences
were as follows: Type-1 angiotensin II receptor (AGTR1) forward,
5′-TAAGATTGCTTCAGCCAGCGTCAG-3′ and reverse,
5′-GAACAATAGCCAGGTATCGATCAATGC-3′; formin-binding protein 1-like
(FNBP1L) forward, 5′-AGACCATGAATAACATTGACCGCCTAC-3′ and reverse,
5′-ACTGCTATGTCTTCTGTCTCCTCTCC-3′; RNA-binding protein with
serine-rich domain 1 (RNPS1) forward, 5′-GCTGAAGCACATGGATGGAGGAC-3′
and reverse, 5′-GGCGGTGGTGGCAACATTCTC-3′; Ras-related C3 botulinum
toxin substrate 1 (RAC1) forward, 5′-AGACAAGCCGATTGCCGATGTG-3′ and
reverse, 5′-TGCCGCACCTCAGGATACCAC-3′; polyubiquitin-C (UBC)
forward, 5′-TGGTGCTCCGTCTCAGAGGTG-3′ and reverse,
5′-TCTGCTGGTCAGGAGGAATGCC-3′; β-actin forward,
5′-GCAAGCAGGAACGATGAG-3′ and reverse, 5′-CCATGCCAATGTTGTCTCTT-3′.
The thermocycling conditions were as follows: 95°C for 10 min,
followed by 40 cycles of 95°C for 15 sec and 58°C for 30 sec. Gene
expression was analyzed using the comparative 2−ΔΔCq
method and normalized to the internal reference gene β-actin
(20). All experiments were
performed in triplicate and data are presented as mean ± standard
deviation.
Statistical analysis
Statistical analysis was performed using SPSS
software (version 19.0; IBM Corp., Armonk, NY, USA). For
comparisons between two groups, Student's two tailed t-test was
used. Data are presented as the mean ± standard deviation.
P<0.05 was considered to indicate a statistically significant
difference.
Results
Identification of DEGs for diagnosis
or treatment of NAFLD
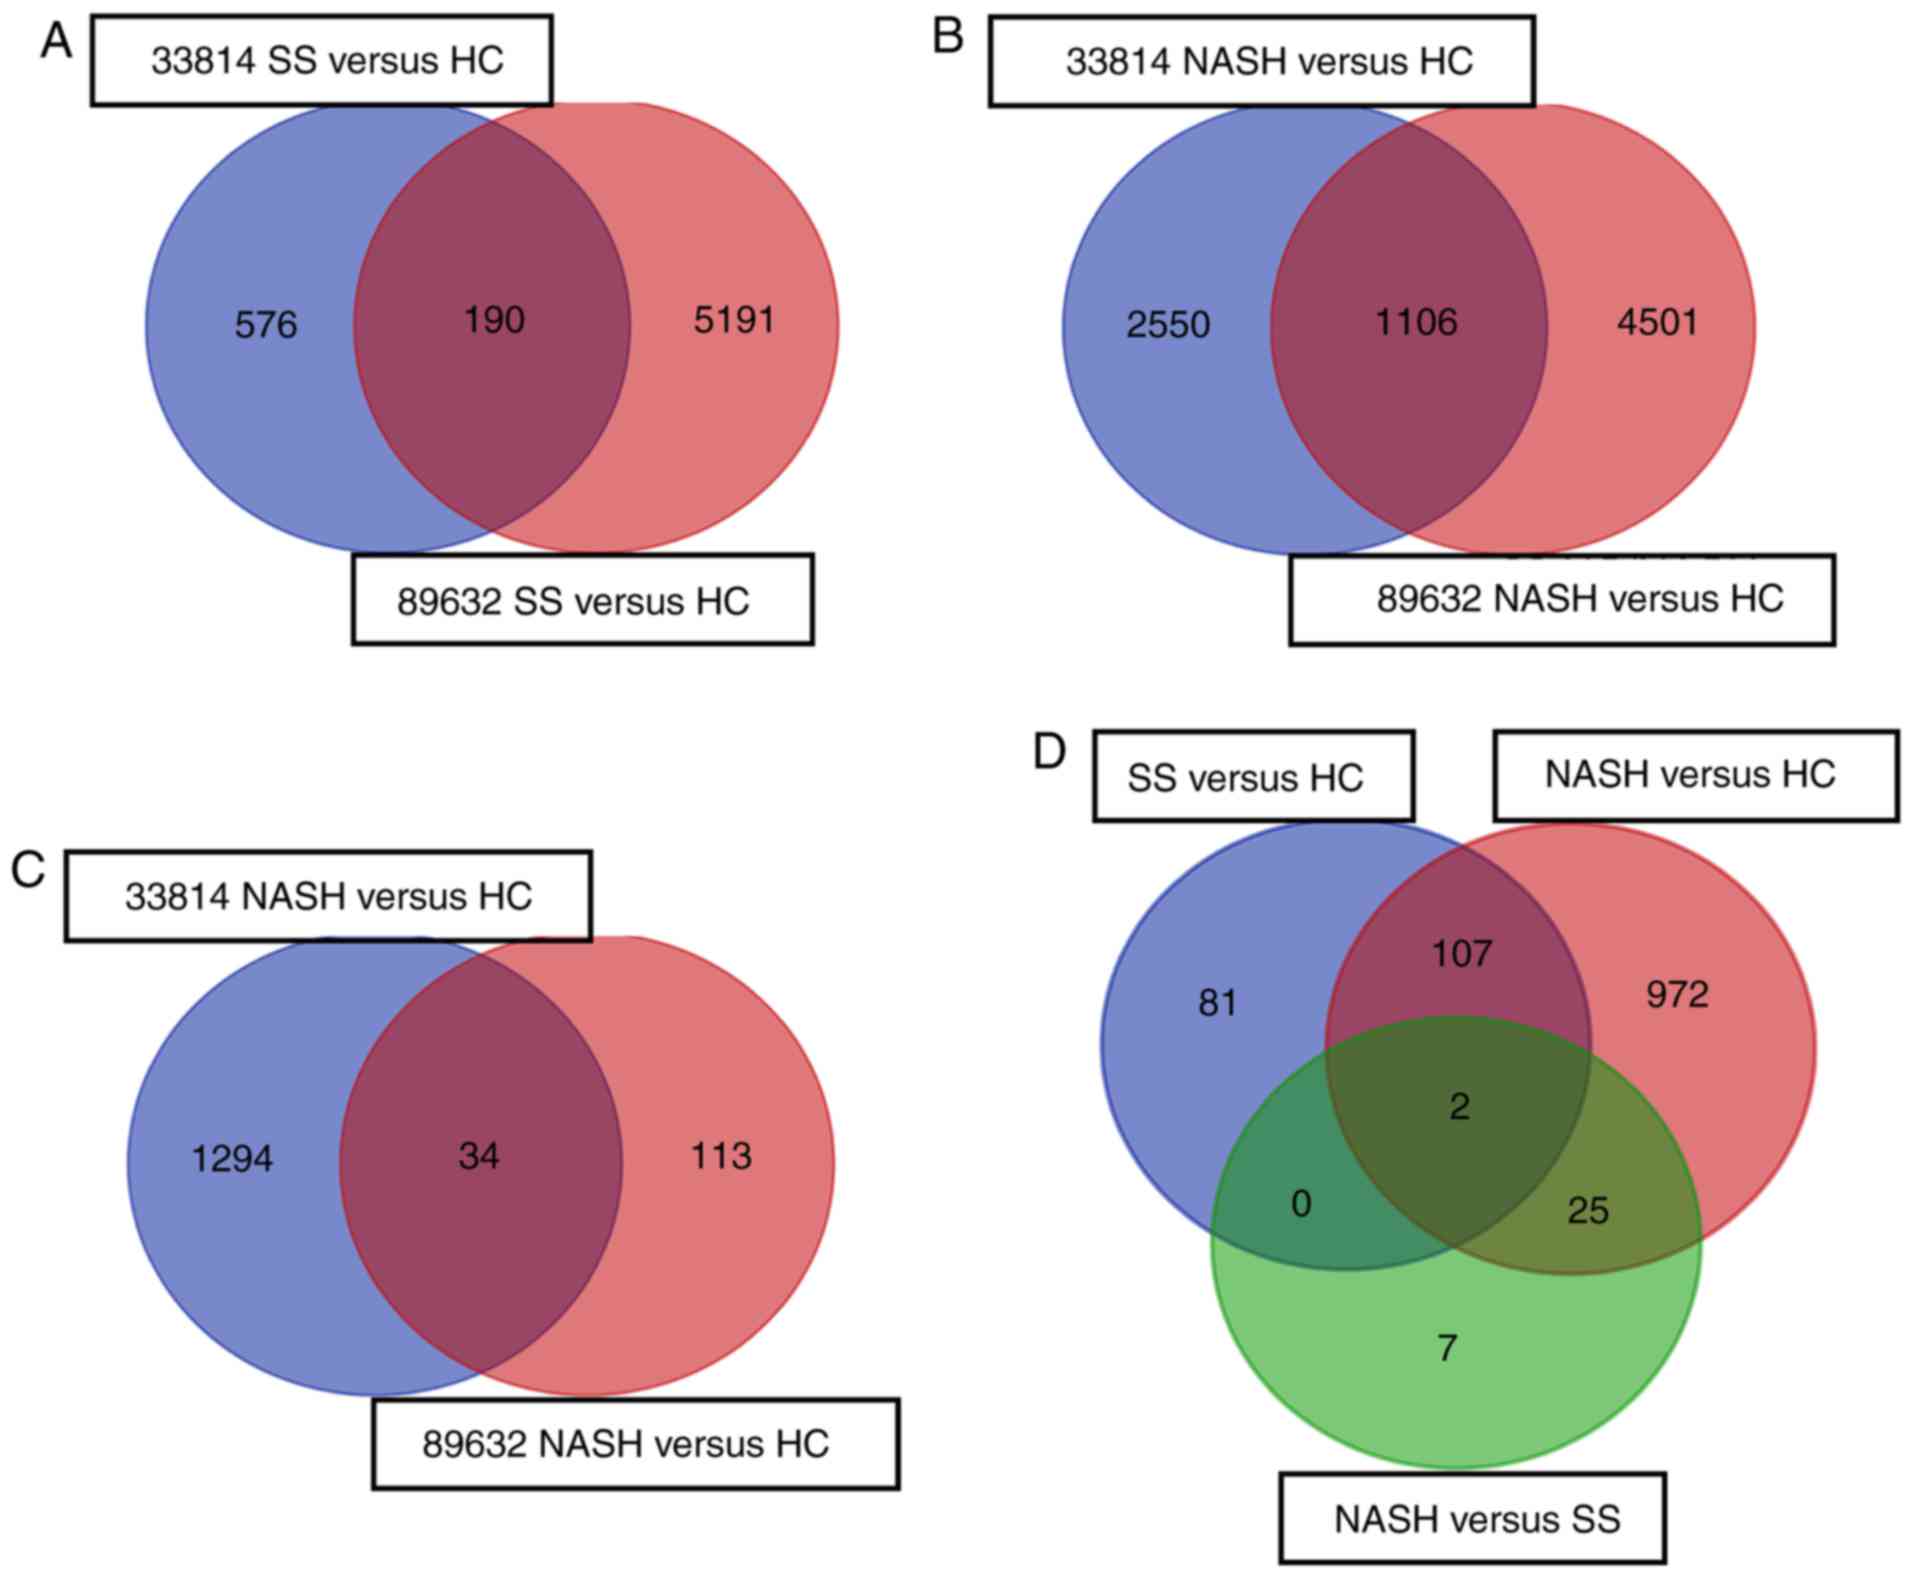
By normalization and analysis of the microarray
datasets, a number of DEGs were identified in GSE33814 and GSE89632
(Table II). The DEGs from these
groups were overlapped in a Venn diagram and 190 DEGs were
subsequently identified in the SS vs. HC group (Fig. 1A); 1,106 genes were identified in
the NASH vs. HC group (Fig. 1B);
and 34 genes were identified in the NASH vs. SS group (Fig. 1C). Notably, by comparing DEGs in
these groups, two DEGs were identified in all three groups:
Immunoglobulin γ Fc region receptor II-a (FCGR2A) and La-related
protein 1B (LARP1B). Thus, these genes may be considered as
specific diagnostic markers for NAFLD (Fig. 1D). A total of 107 DEGs overlapped
in the SS vs. HC and NASH vs. HC groups, which may be involved in
the advanced phase of disease progression. A total of 25 DEGs were
overlapped in the NASH vs. SS and NASH vs. HC groups, which may be
associated with the severity of NAFLD. Additionally, a total of 81
unique DEGs were identified in the SS vs. HC group, which may be
associated with the onset of NAFLD. Furthermore, 972 unique DEGs
were identified only in the NASH vs. HC group, which may be
downstream of the 107 DEGs identified in the SS vs. HC and NASH vs.
HC groups. A total of seven unique DEGs were identified in the NASH
vs. SS group, which may not serve important roles in the
progression of NAFLD. No DEGs overlapped in the SS vs. HC and NASH
vs. SS groups (Fig. 1D).
| Table II.DEGs in microarray datasets GSE33814
and GSE89632. |
Table II.
DEGs in microarray datasets GSE33814
and GSE89632.
| Comparison
group | Microarray
dataset | No. of DEGs | No. of overlapped
genes |
|---|
| SS vs. HC | GSE33814 | 766 | 190 |
|
| GSE89632 | 5,381 |
|
| NASH vs. HC | GSE33814 | 3,656 | 1,106 |
|
| GSE89632 | 5,607 |
|
| NASH vs. SS | GSE33814 | 1,328 | 34 |
|
| GSE89632 | 147 |
|
Functional enrichment analysis and
KEGG pathways of DEGs
To analyze the biological classification of the
DEGs, functional and pathway enrichment analyses were performed
using the functional enrichment analysis web tool DAVID. GO
analysis revealed that genes in the SS vs. HC group were
significantly enriched in cytosol (P=8.93×10⁻³), ion
binding (P=3.85×10⁻²) and RNA binding
(P=6.03×10⁻³) terms. The biological process (BP)
analysis revealed that the DEGs were significantly enriched in the
following processes: ‘Cellular macromolecule biosynthetic process’
(P=1.60×10⁻²), ‘glycerophospholipid biosynthetic
process’ (P=3.60×10⁻²) and ‘programmed cell death’
(P=4.64×10⁻²; Fig.
2A).
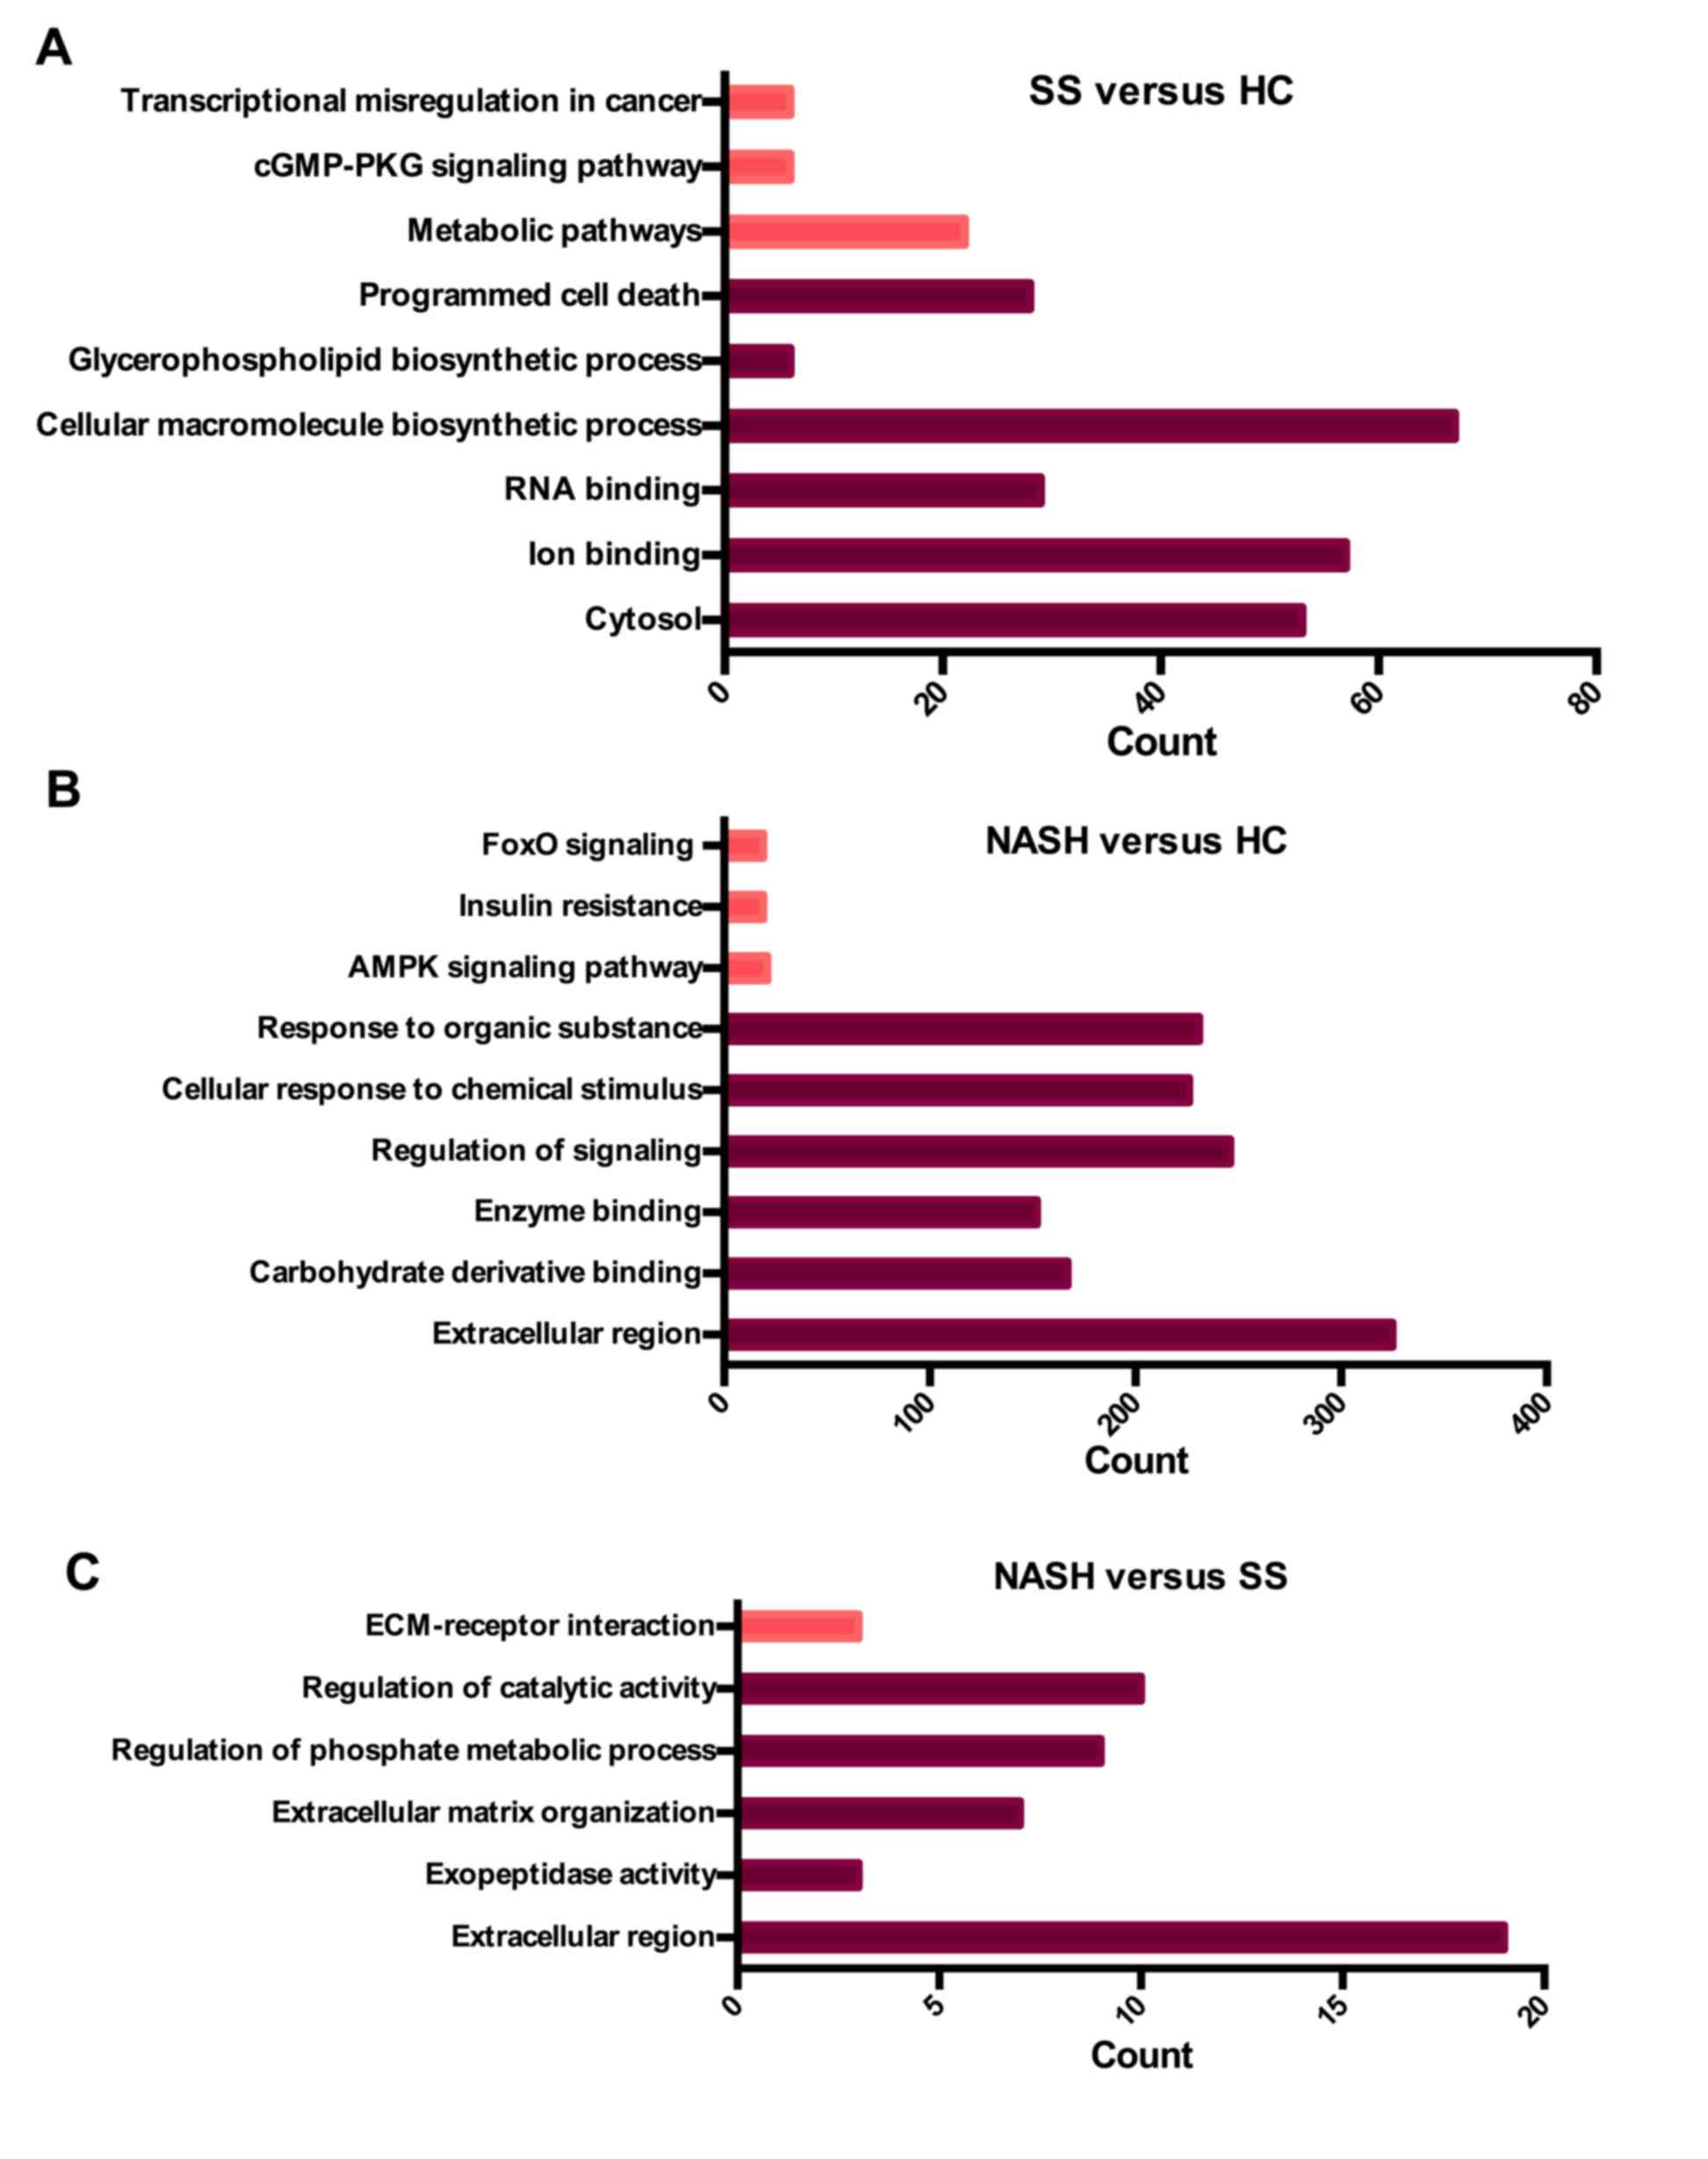 | Figure 2.Summary of the top GO and KEGG
results of DEGs. (A) Results of SS vs. HC group. (B) Results of
NASH vs. HC group. (C) Results of NASH vs. SS group. The count
represents the number of genes that enriched in one GO or KEGG
term. The deep red bars represent GO in terms of DEGs. The light
red bars represent KEGG in terms of DEGs. DEG, differentially
expressed gene; SS, steatosis; HC, healthy control; NASH,
non-alcoholic steatohepatitis; KEGG, Kyoto Encyclopedia of Genes
and Genomes; GO, gene ontology; ECM, extracellular matrix; FoxoO,
Forkhead box protein O1; cGMP-PKG; cyclic guanine
monophosphate-dependent protein kinase, isozyme 1; AMPK,
5′-AMP-activated protein kinase. |
DEGs in the NASH vs. HC group were significantly
enriched in ‘extracellular region’ (P=1.05×10⁻²),
‘carbohydrate derivative binding’ (P=1.65×10⁻³) and
‘enzyme binding’ (P=5.69×10⁻⁶). BP analysis revealed
that the DEGs were significantly enriched in the following
processes: ‘Regulation of signaling’ (P=1.01×10⁻⁷),
‘cellular response to chemical stimulus’ (P=2.20×10⁻⁹)
and ‘response to organic substances’ (P=5.34×10⁻⁸;
Fig. 2B).
DEGs in the NASH vs. SS group were significantly
enriched in ‘extracellular region’ (P=2.23×10⁻⁴) and
‘exopeptidase activity’ (P=2.33×10⁻²). BP analysis
demonstrated that the DEGs were significantly enriched in processes
associated with extracellular matrix organization
(P=3.63×10⁻⁵), ‘regulation of phosphate metabolic
process’ (P=9.55×10⁻³) and ‘regulation of catalytic
activity’ (P=2.96×10⁻²). The above results indicated
that during the early stages of NAFLD, alterations in biosynthetic
processes were predominantly identified in hepatocytes. In the
advanced stages of NAFLD, alterations in lipid metabolism and
responses to stimuli may have crucial involvement in the
progression of the disease (Fig.
2C).
The significantly enriched KEGG pathways were
additionally identified at a significance level of P<0.05 using
DAVID. The results revealed that pathways in the SS vs. HC group
were significantly enriched in metabolic pathways
(P=4.17×10⁻²), cyclic guanosine monophosphate
(cGMP)-protein kinase G (PKG) signaling pathway
(P=4.48×10⁻²) and transcriptional misregulation in
cancer (P=4.67×10⁻²; Fig.
2A). Pathways in the NASH vs. HC group were significantly
enriched in the 5′ adenosine monophosphate-activated protein kinase
(AMPK) signaling pathway (P=2.29×10⁻⁴), insulin
resistance (P=3.79×10⁻⁴) and forkhead box protein O1
(FoxO) signaling pathway (P=4.70×10⁻³; Fig. 2B). Pathways in the NASH vs. SS
group were significantly enriched in extracellular matrix
(ECM)-receptor interaction (P=2.82×10⁻²; Fig. 2C). Consistent with the results of
GO analysis, KEGG analysis revealed that DEGs in the early stage of
NAFLD were predominantly enriched in the metabolism of numerous
substances, whereas DEGs involved in the advanced stages were
predominantly enriched in lipid metabolism and its subsequent
effect on target organs.
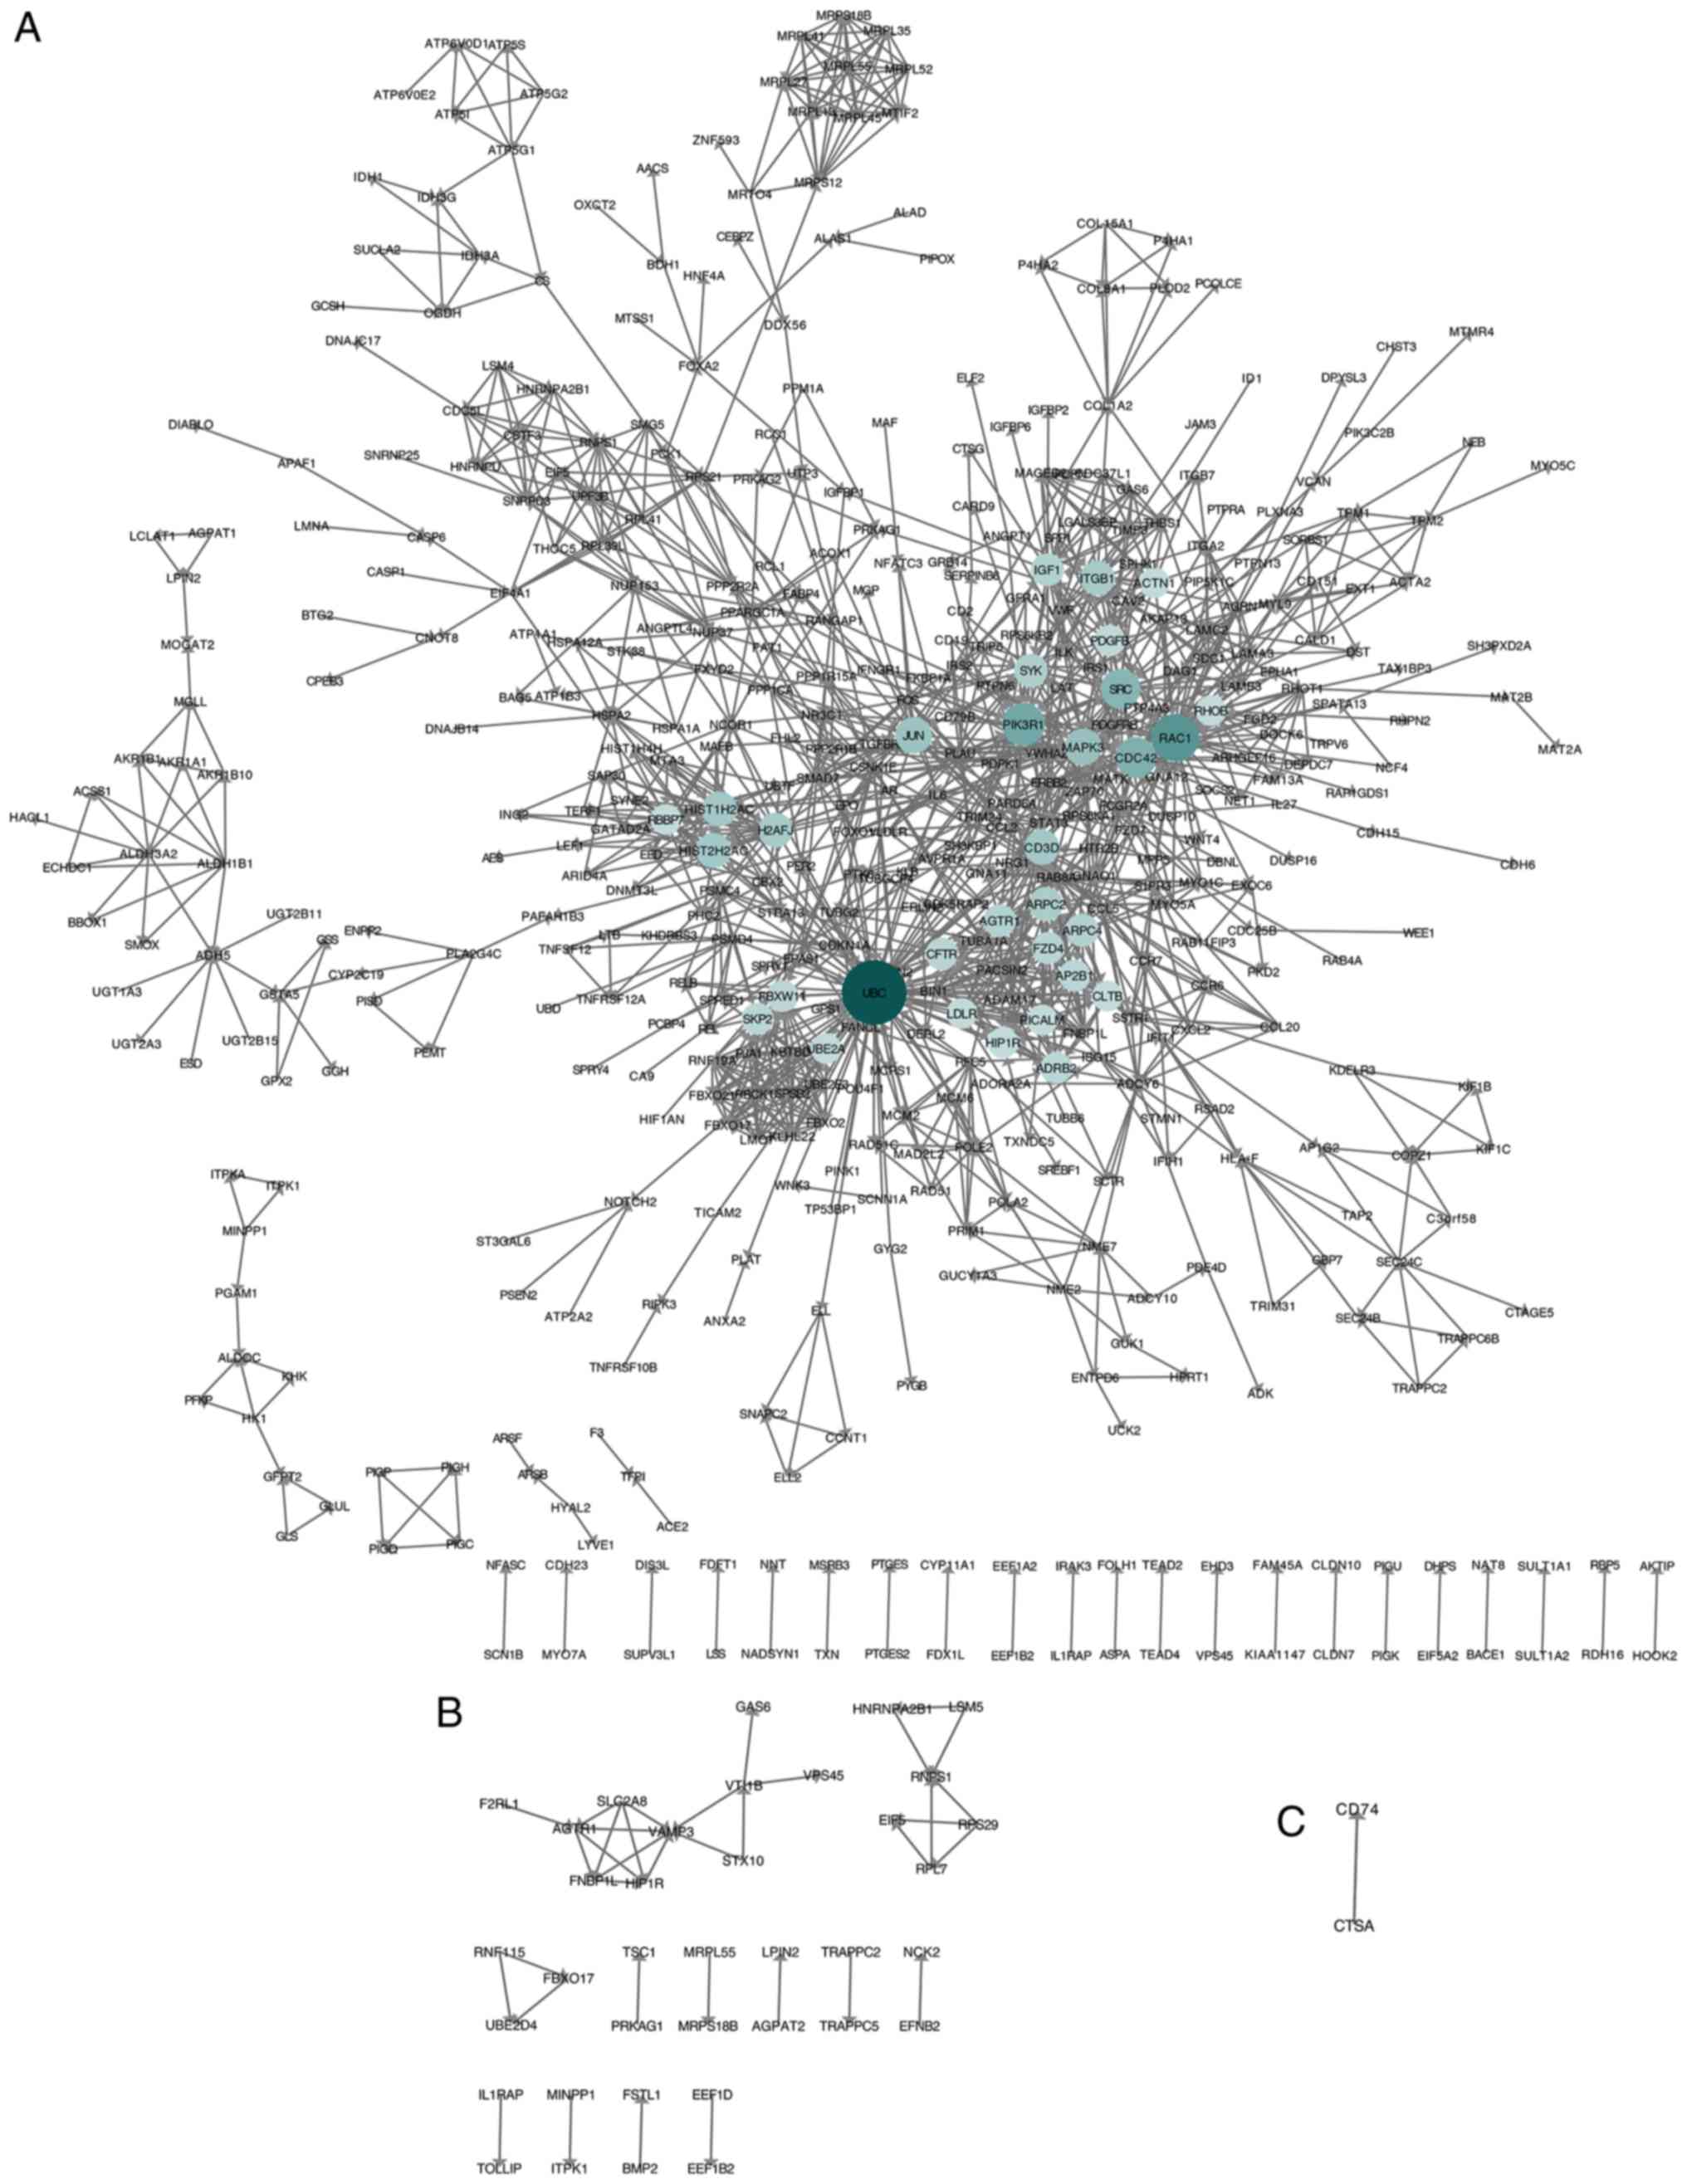
Construction of PPI networks
Following the removal of isolated genes, PPI
networks were constructed using STRING and Cytoscape. The PPI
network contained 493 nodes and 1,412 edges in the NASH vs. HC
group (Fig. 3A); 37 nodes and 36
edges in the SS vs. HC group (Fig.
3B); and two nodes and one edge in the NASH vs. SS group
(Fig. 3C).
Following this, the indexes of betweenness
centrality and degree were used to analyze the topological
properties of the SS vs. HC and the NASH vs. HC groups,
respectively. The top 70% genes were selected by these two measures
for subsequent analyses. A total of 34 unique genes in the SS vs.
HC group and 424 genes in NASH vs. HC groups were obtained. The top
three genes in the SS vs. HC group were RNPS1, vesicle-associated
membrane 3 and AGTR1. The top three genes in the NASH vs. HC group
were UBC, phosphatidylinositol 3-kinase regulatory subunit α and
RAC1. In parallel, there were 16 genes that overlapped in the SS
vs. HC and the NASH vs. HC groups. The top three of these 16 genes
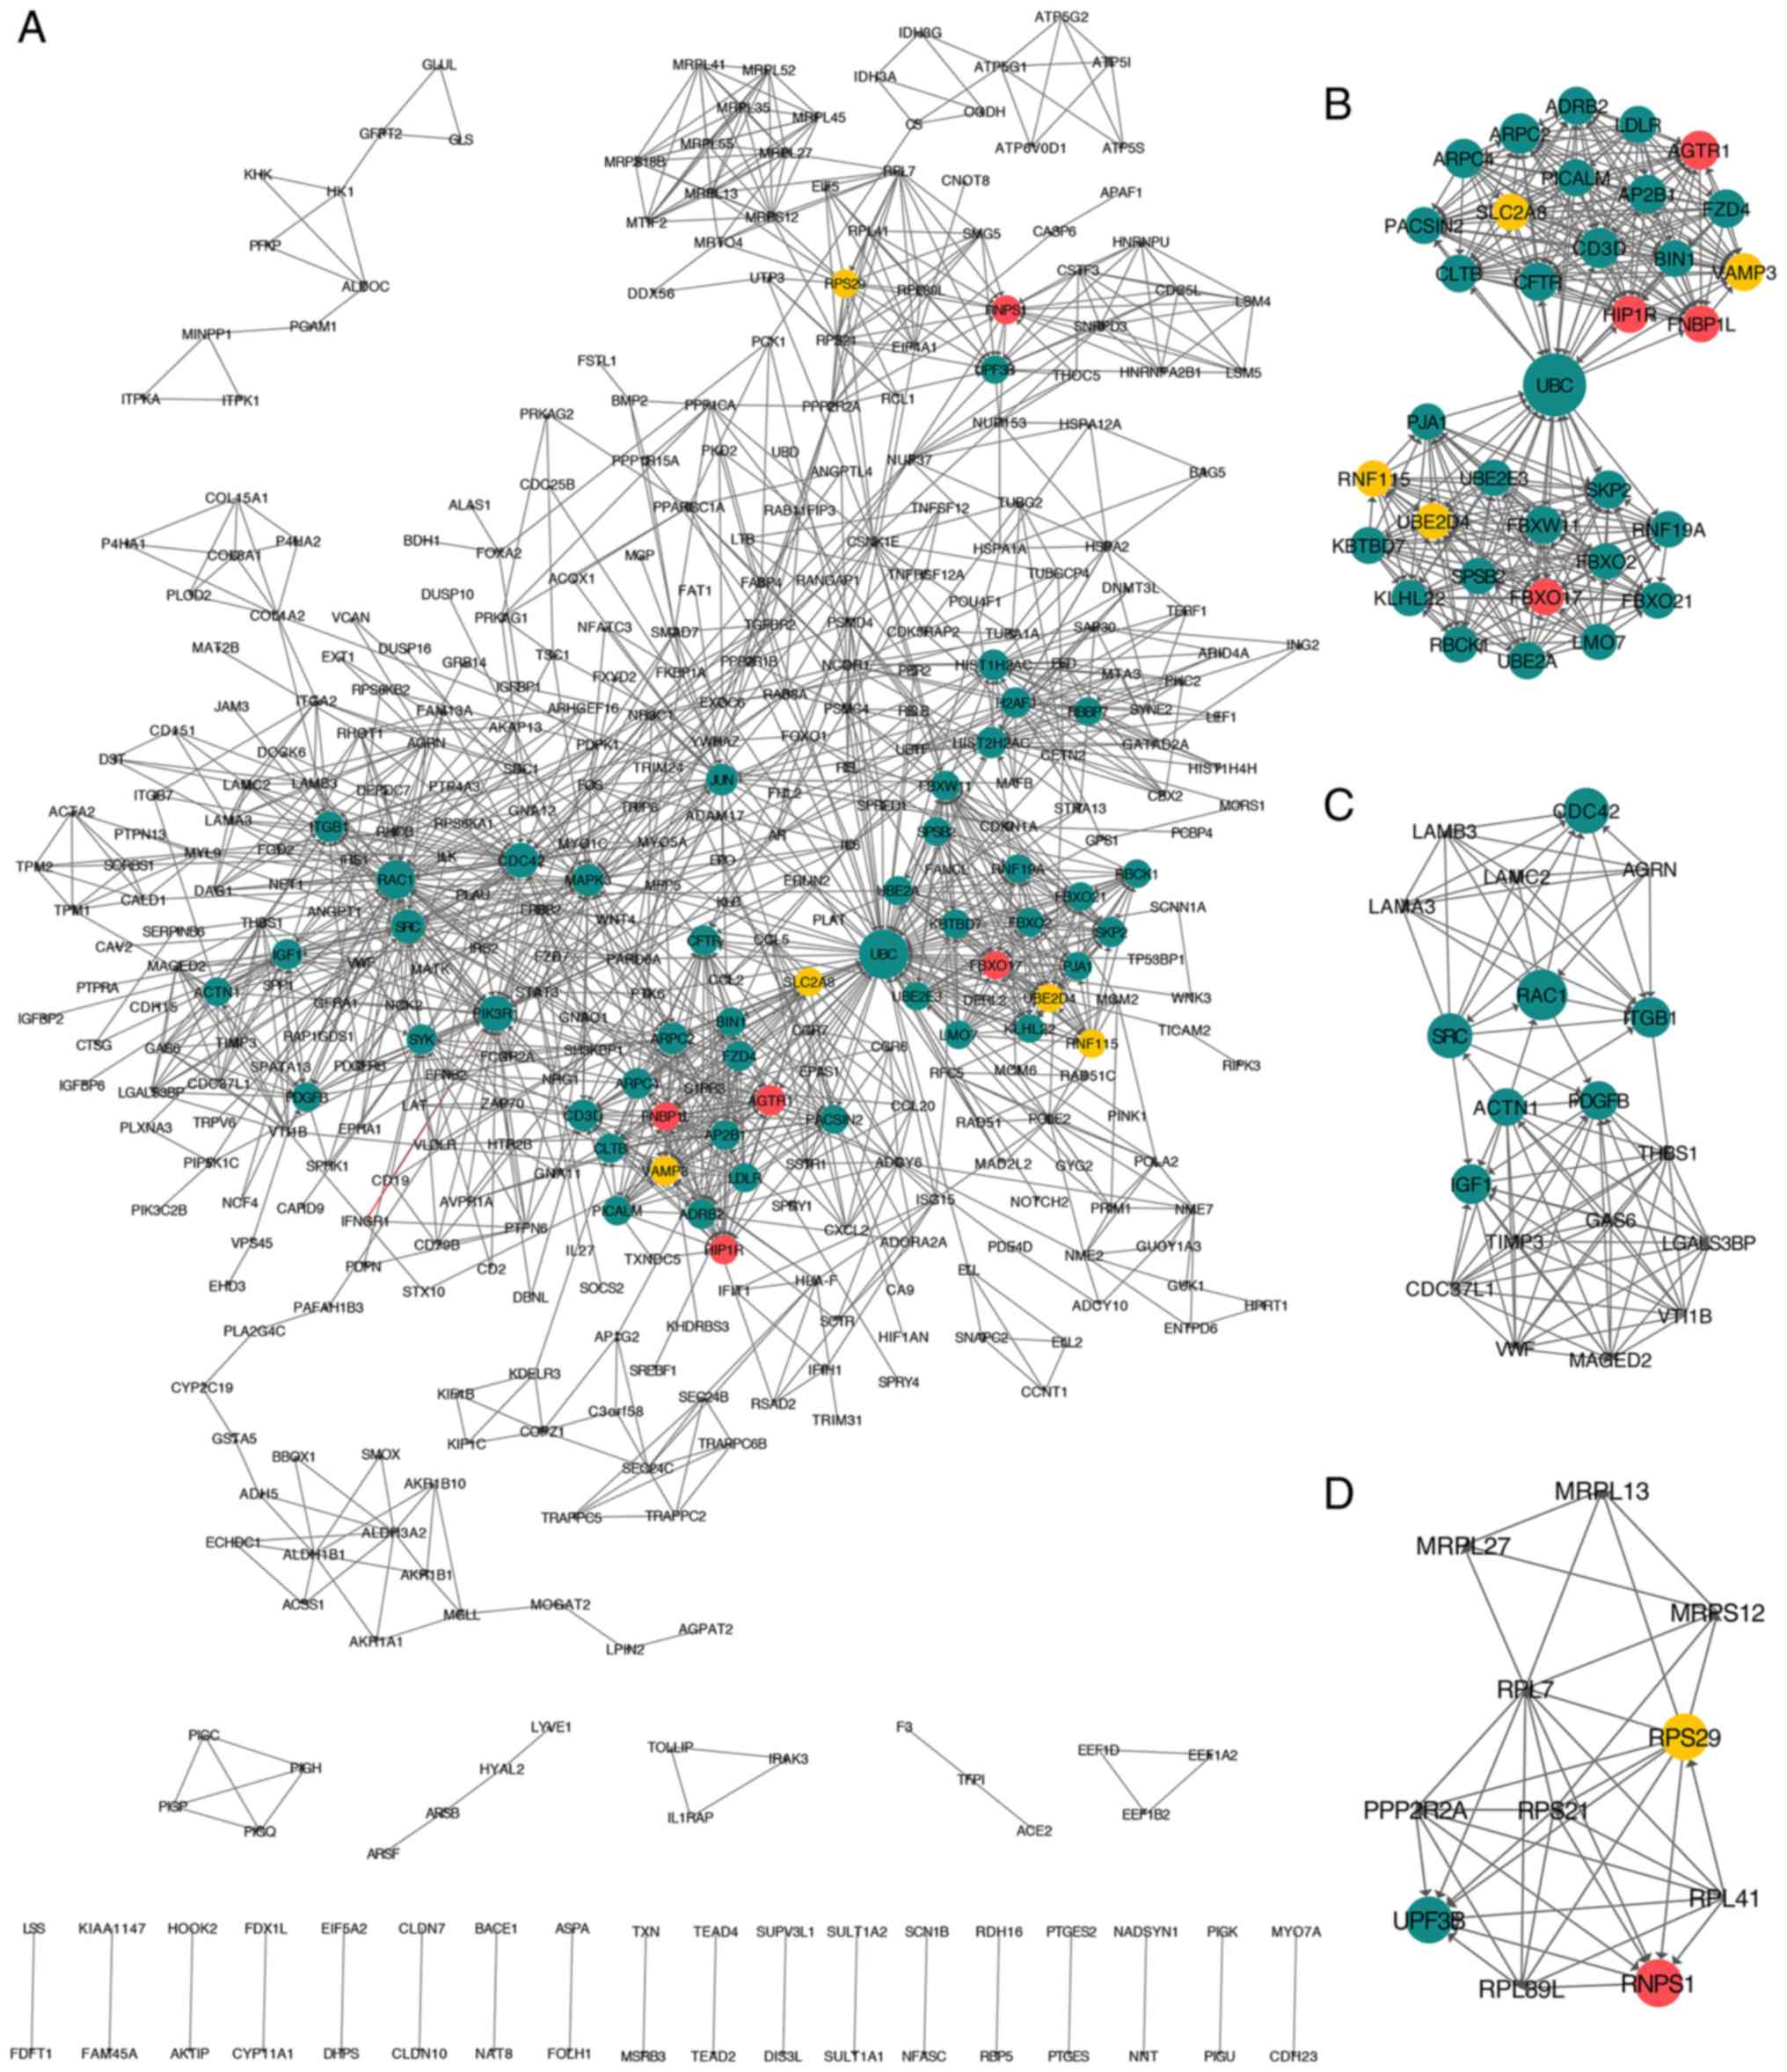
were RNPS1, AGTR1 and FNBP1L. A combined PPI network between the SS
vs. HC and the NASH vs. HC groups was constructed and visualized
(Fig. 4A). The dark green circles
represent unique genes in the NASH vs. HC group. The yellow circles
represent unique genes in the SS vs. HC group, and the red circles
represent genes overlapping in the SS vs. HC and NASH vs. HC
groups.
Furthermore, the top three modules of the combined
PPI network were obtained using MCODE, a plug-in app for Cytoscape
(Fig. 4B-D). KEGG pathway
enrichment analysis was performed for the genes involved in the
three modules using Webgestalt. The results revealed that 34 hub
genes were involved in module one, and that they were significantly
enriched in ‘ubiquitin-mediated proteolysis’
(P=1.86×10⁻⁶), ‘endocytosis’ (P=5.69×10⁻⁶)
and ‘Fc gamma receptor-mediated phagocytosis’
(P=2.37×10⁻³). The gene with the highest degree in this
module was UBC. A total of 19 hub genes were involved in module
two, and they were significantly enriched in ‘focal adhesion’
(P=3.33×10⁻¹⁶), ‘ECM-receptor interaction’
(P=2.07×10⁻¹⁰) and ‘phosphoinositide 3-kinase-protein
kinase B signaling pathway’ (P=9.49×10⁻⁹). The gene with
the highest degree in module two was RAC1. Furthermore, 11 hub
genes were involved in module three, and they were significantly
enriched in ‘ribosome’ (P=2.08×10⁻¹⁰), ‘mRNA
surveillance pathway’ (P=2.22×10⁻⁴) and ‘RNA transport’
(P=2.24×10⁻²). The gene with the highest degree in
module three was RNPS1.
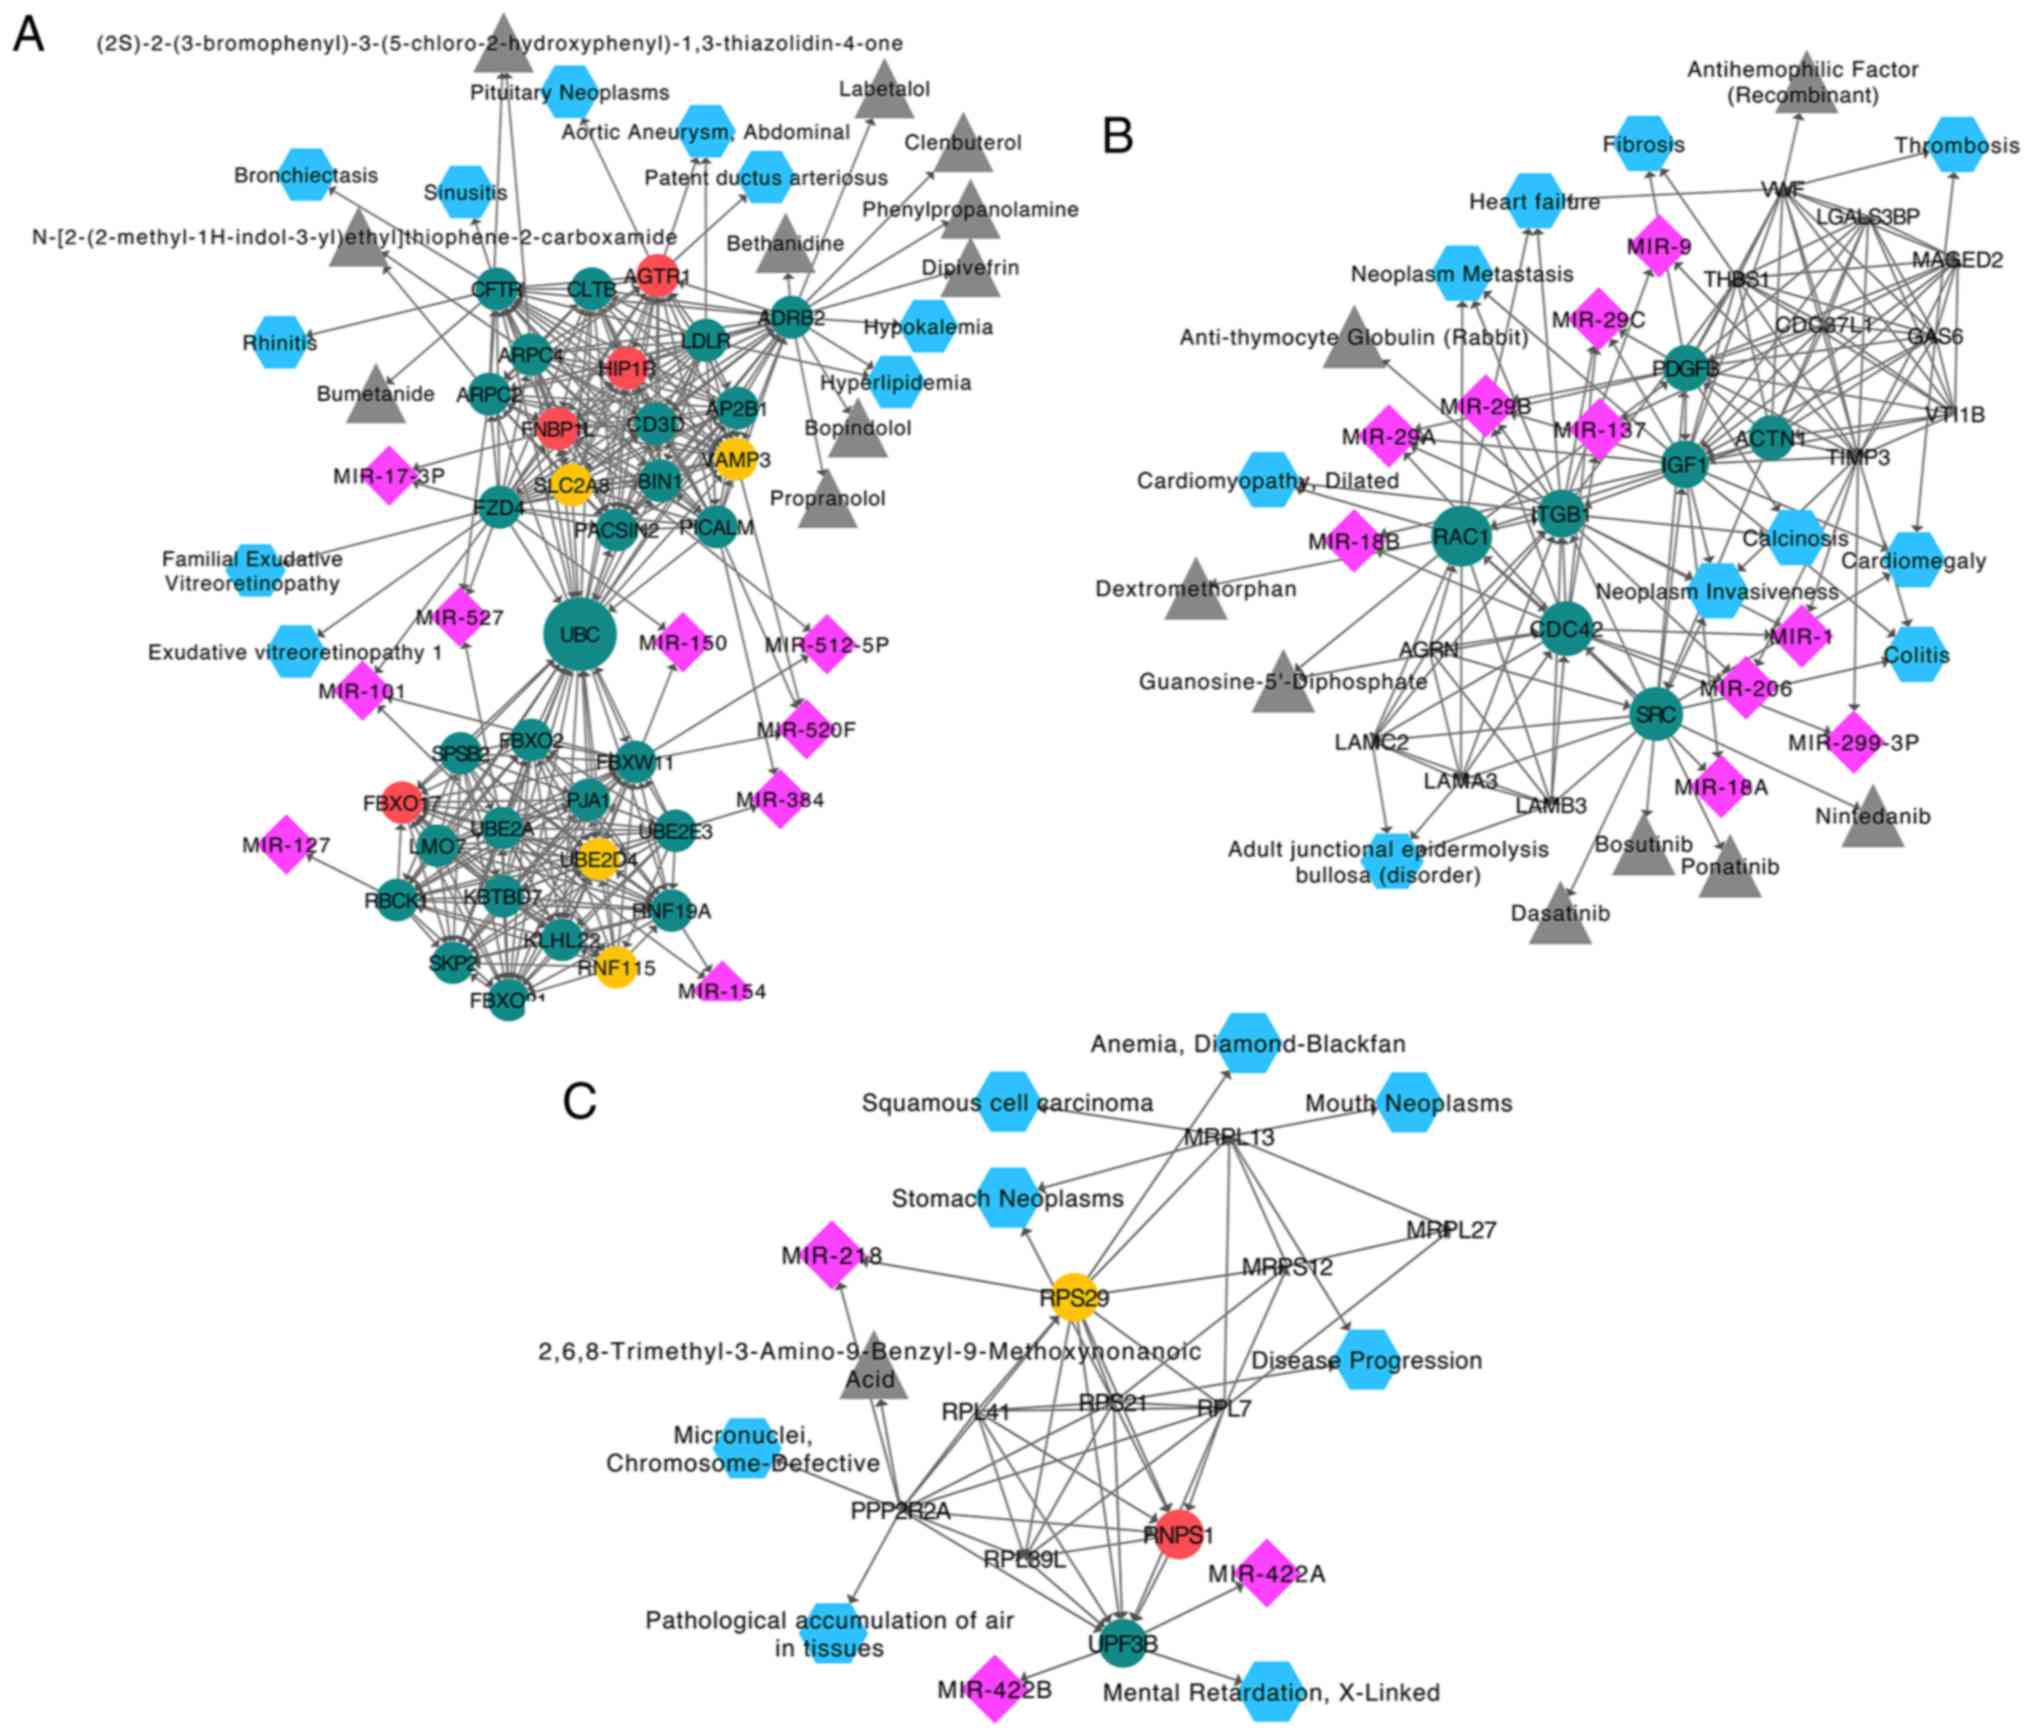
Furthermore, correlation analysis between the hub
genes and diseases was performed with Webgestalt. The results
revealed that the DEGs in module one were associated with
hyperlipidemia (P=3.68×10⁻⁴) and bronchiectasis
(P=8.53×10⁻³). The candidate drugs for the DEGs in
module one were predominantly involved in the structural
stabilization of the cytoskeleton. Additionally, the candidate
miRNA targets for the DEGs were obtained using Webgestalt. The
identified associated miRNAs were miR-101, miR-527 and miR-520F
(Fig. 5A). In module two, the DEGs
were associated with colitis (P=5.31×10⁻⁶), neoplasm
invasiveness (P=3.4×10⁻⁵) and fibrosis
(P=1.65×10⁻³). The drugs in module two were
predominantly associated with oxygen binding and lipopeptide
binding. The identified related miRNAs were miR-29A, miR-29B,
miR-29C, miR-1 and miR-206 (Fig.
5B). In module three, the DEGs were associated with disease
progression (P=1.78×10⁻³), anemia
(P=8.53×10⁻³) and stomach neoplasms
(P=8.65×10⁻³). The drugs in module three were
predominantly associated with protein serine/threonine phosphatase
activity. The identified related miRNAs were miR-218, miR-422B and
miR-422A (Fig. 5C).
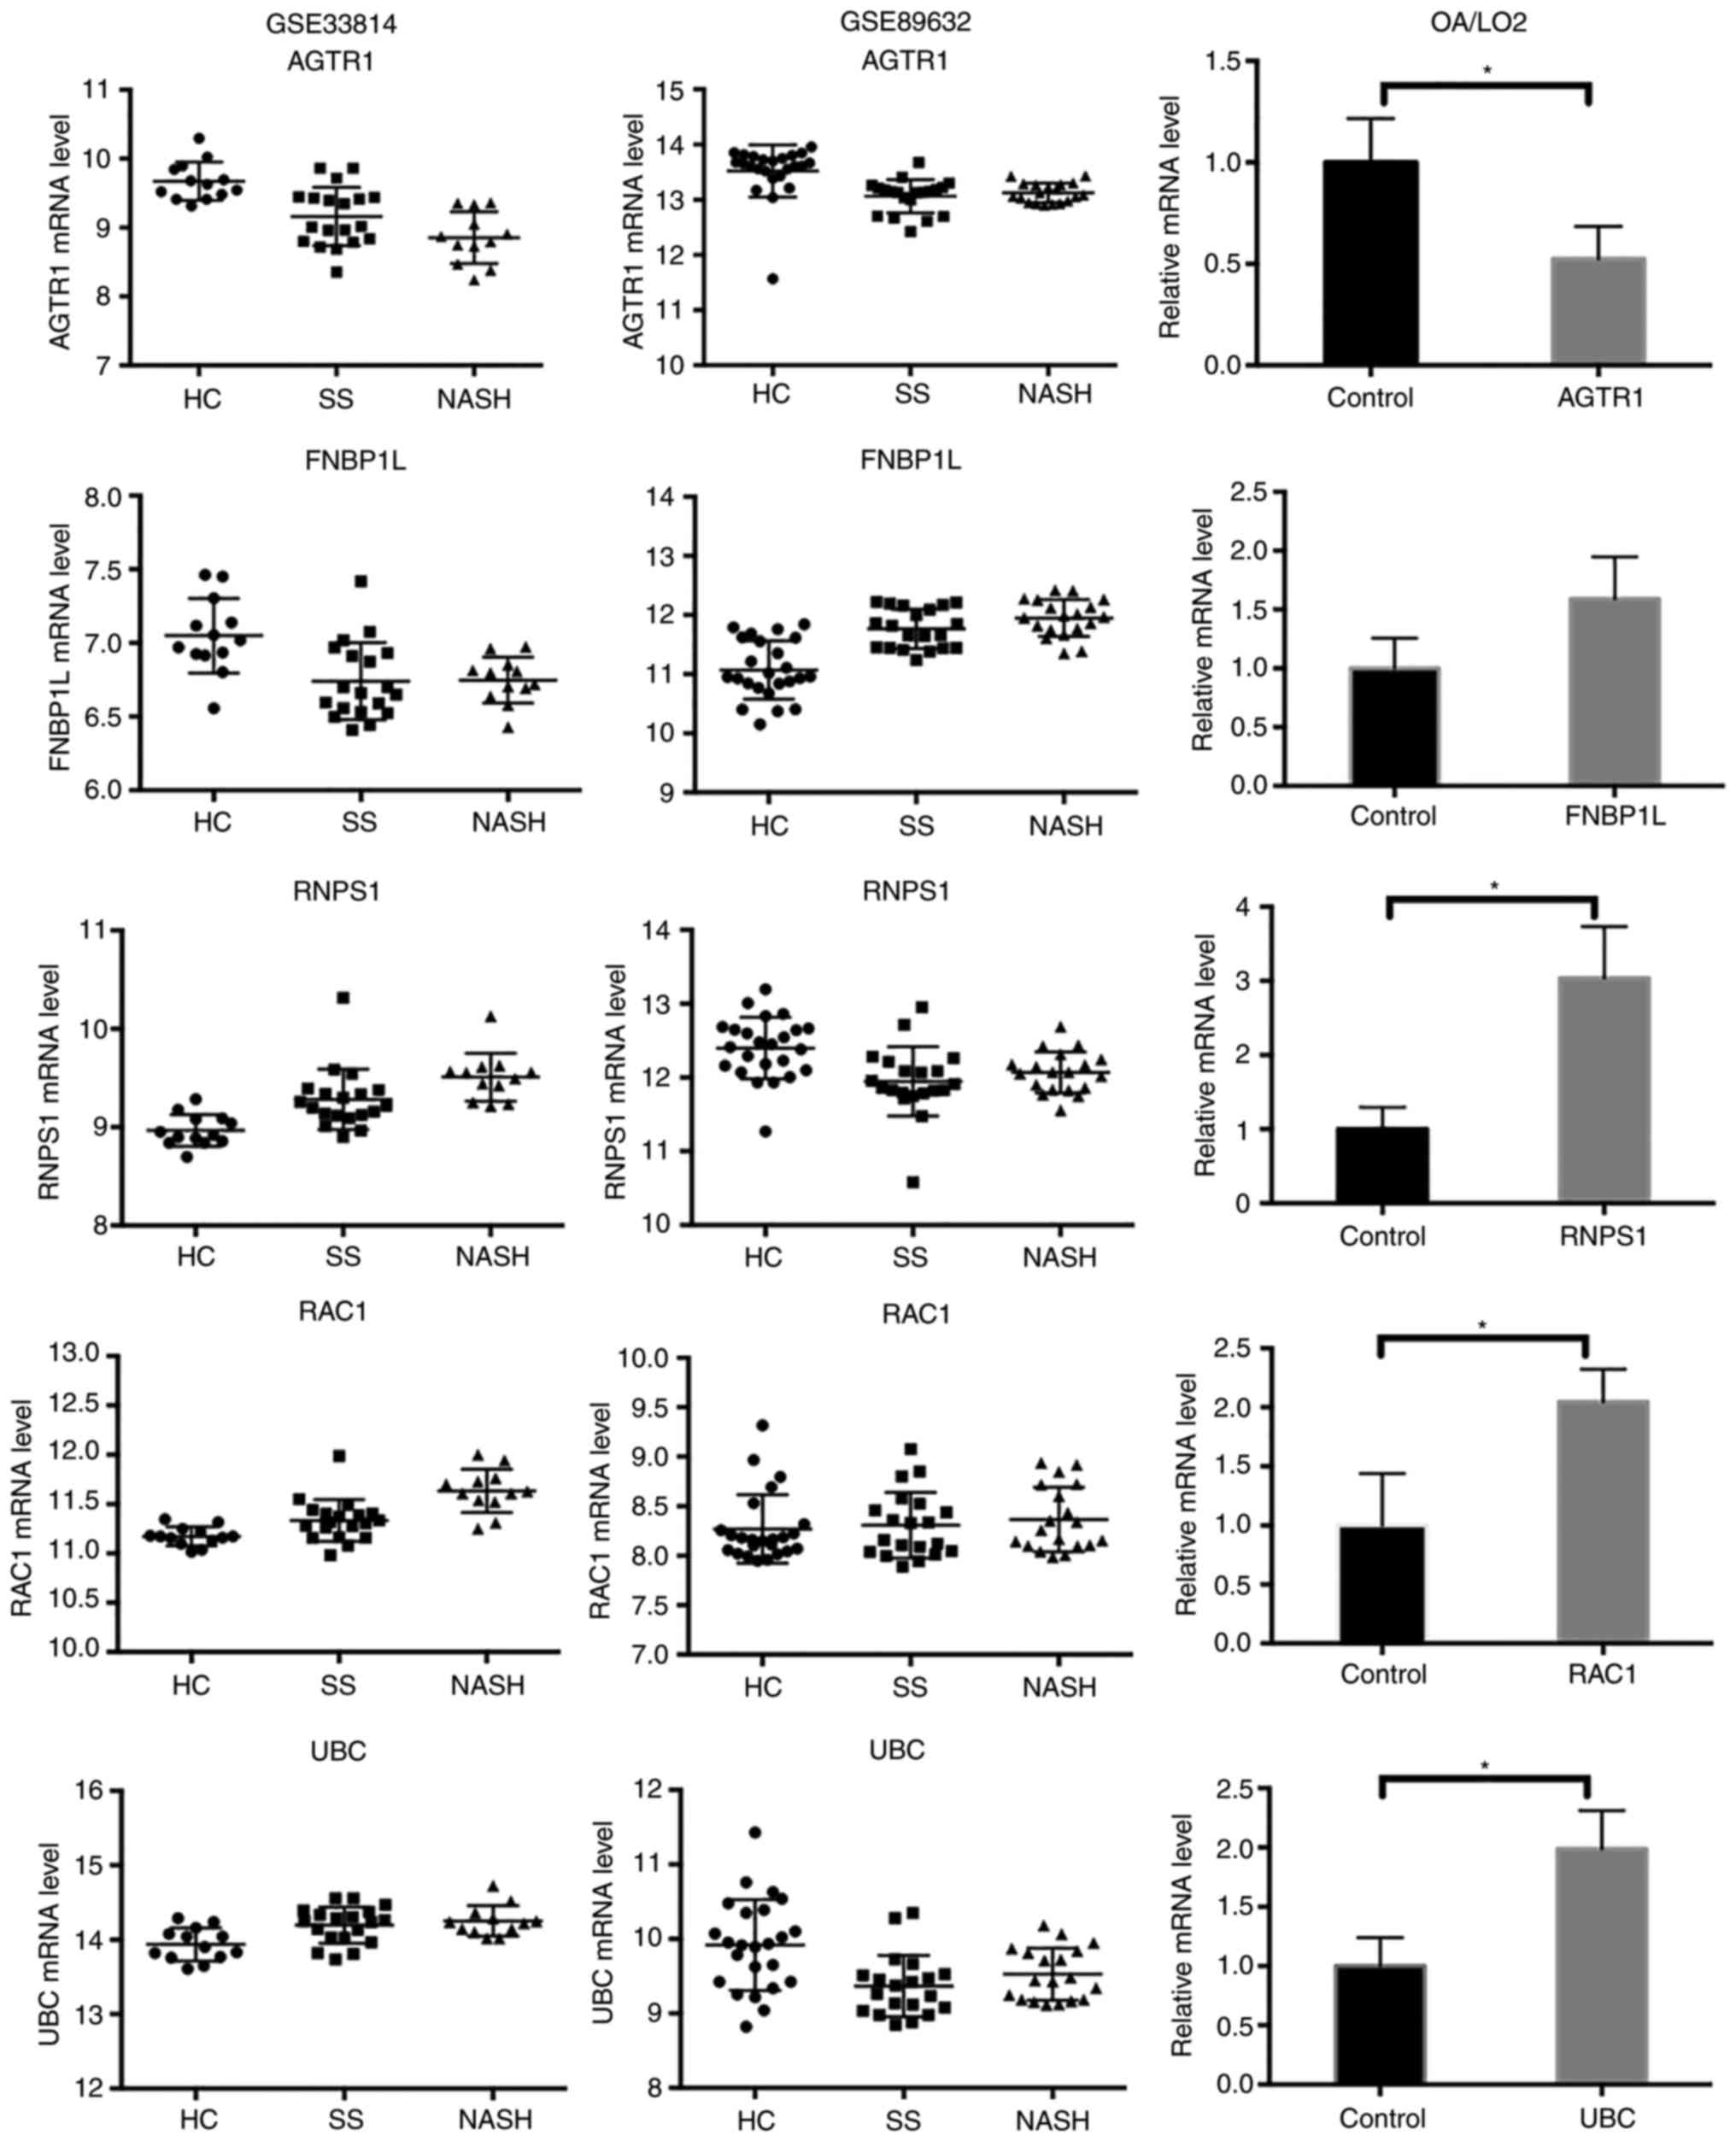
Validation of hub genes by
RT-qPCR
To confirm the reliability of the identified hub
genes, LO2 cells were treated with OA to induce lipid accumulation.
RT-qPCR analysis was conducted to verify the expression levels of
the identified genes. The results revealed that the majority of hub
genes were differentially expressed in OA-treated cells (Fig. 6). RAC1, RNPS1 and UBC were
significantly upregulated in OA-induced steatotic cells, compared
with the control cells (P<0.05). AGTR1 was significantly
downregulated in OA-induced steatotic cells, compared with the
control cells (P<0.05). FNBP1L appeared to be upregulated in
OA-induced steatotic cells, although the statistical difference was
not significant (P=0.0807). Overall, the expression profiles of the
hub genes were reasonably consistent between the bioinformatics
analysis and RT-qPCR experiment.
Discussion
To reduce error and bias, two mRNA microarray
datasets were obtained from the GEO database. A total of 190 DEGs
were identified in the SS vs. HC group, 1,106 DEGs in the NASH vs.
HC group and 34 DEGs in the NASH vs. SS group. Subsequently, a Venn
diagram was utilized to identify the DEGs that may have a role
specifically in NAFLD. FCGR2A and LARP1B were identified in all
three groups (SS vs. HC, NASH vs. HC and NASH vs. SS). Thus, these
genes may be considered to be specific diagnostic markers for
NAFLD. It has been reported that certain genotypes of FCGR2A are
associated with a more frequent occurrence of acute coronary
syndromes, due to alterations in its interaction with C-reactive
protein (21). Additionally,
studies have demonstrated that FCGR2A and tyrosine-protein kinase
Jak2 are associated with ulcerative colitis in Japanese and Korean
populations (22,23). Furthermore, emerging data has
indicated the co-existence of NAFLD and inflammatory bowel disease
(24). Thus, the aforementioned
studies indicated that FCGR2A may be involved in organ damage in
NAFLD. LARP1B is a paralogue of LARP1, which has not been widely
studied in humans to the best of our knowledge.
GO and KEGG analyses were performed to examine the
functional and biological interactions among the DEGs. GO and KEGG
analysis revealed that the DEGs in the SS vs. HC group were
significantly enriched in ‘cellular macromolecule biosynthetic
process’, ‘regulation of RNA metabolic process’, ‘metabolic
pathways’ and ‘cGMP-PKG signaling pathway’. It has been
demonstrated that in the early stages of NAFLD, the principal
pathophysiological alterations in the liver include insulin
resistance and simple steatosis (25). Insulin resistance is closely
associated with mitochondrial dysfunction, lipid peroxidation and
energy imbalance, which eventually results in dysfunction and
structural damage to cells and organs. Hepatic lipid metabolism
disequilibrium initiated by insulin resistance, particularly in
triglycerides, may result in lipid accumulation and steatosis,
which triggers a series of cytotoxic events in the course of NAFLD
(25).
The results of the GO and KEGG analyses for the SS
vs. HC group revealed that alterations predominantly occurred in
‘biosynthetic process’, ‘insulin signaling pathway’ and
‘metabolism’, which may contribute to hepatocyte steatosis. In the
NASH vs. HC group, the DEGs were significantly enriched in
‘cellular response to chemical stimulus’, ‘response to organic
substance’, ‘AMPK signaling pathway’, ‘insulin resistance’ and
‘FoxO signaling pathway’. In the NASH vs. SS group, the DEGs were
significantly enriched in ‘ECM organization’, ‘regulation of
phosphate metabolic process’ and ‘ECM-receptor interaction’.
Experimental observations have demonstrated that in intermediate
and advanced stages of NAFLD, the principal pathophysiological
alterations in the liver include oxidative stress and cytokine
release (26). The anti-oxidative
and anti-lipid peroxidation capacities of hepatocytes with
steatosis are eradicated, which may result in inflammatory cell
infiltration, inflammatory necrosis, hepatic fibrosis and even
hepatocellular carcinoma (HCC) (26).
The AMPK signaling pathway participates in metabolic
processes associated with glycolipids and has recently been
regarded as a key research target for metabolic diseases. In
oxidative stress, the AMPK signaling pathway may regulate autophagy
by inducing protein phosphorylation, thus affecting energy and
nutrient metabolism (27). One of
the key transcription factors required for AMPK to be able to
affect metabolism is FoxO1. A previous study reported that FoxO1
may regulate oxidative stress and insulin resistance by inducing
the expression of gluconeogenic genes (28). The GO and KEGG terms identified in
the present study may aid in the understanding of the underlying
mechanisms of NAFLD.
Following the use of multiple screening measures,
the top three genes, AGTR1, RNPS1 and FNBP1L, were obtained from
the combined PPI network. AGTR1 has been hypothesized to mediate
the major cardiovascular effects of angiotensin II (29). In diabetic nephropathy, angiotensin
II may increase expression of AGTR1, leading to pronephrotic
alterations (30). Activated AGTR1
may subsequently reduce the level of plasma adiponectin, and
increase the activity of caspase 3/7 and cannabinoid receptor type
1 signaling in the kidney, leading to podocyte injury and diabetic
glomerulopathy (30,31). Furthermore, polymorphisms in AGTR1
may influence the risk of liver fibrosis in NAFLD (32). Taken together, these data indicate
that AGTR1 may have an important role in the progression of
NAFLD.
RNPS1, a general activator of pre-mRNA splicing, is
involved in mRNA nuclear export and mRNA surveillance (33). A previous study suggested that
RNPS1 is associated with RNA processing and apoptosis, and is
involved in programmed cell death (34). FNBP1L is able to bind to cell
division control protein 42 (CDC42) and is thought to be essential
for the autophagy of intracellular pathogens (35). The increased expression of FNBP1 L
in breast cancer cells results in enhanced tumor metastasis and may
be upregulated due to a loss of tumor suppressor p53 expression
(36). However, no correlations
have been reported among FNBP1L, RNPS1 and NAFLD.
Additionally, the top three modules were
additionally extracted from the combined PPI network. Nodes with a
higher degree were displayed in bigger circles. It was revealed
that in module one, UBC was the core factor, with a degree of 81.
UBC is predominantly involved in protein degradation, the cell
cycle and cell signaling pathway regulation (37,38).
A previous study reported that UBC exerts pathogenic effects in
cardiac disease through regulation of the ubiquitin-proteasome
system (39). However, no definite
association has been identified between UBC and NAFLD. In module
two, the identified core factor was RAC1, with a degree of 48.
RAC1, a member of the Ras superfamily of small guanosine
triphosphate-binding proteins, appears to regulate a number of
cellular events, including cell growth, cytoskeletal reorganization
and protein kinase activation (40,41).
It has been reported that RAC1 and CDC42 are principal activators
in the saturated fatty acid-stimulated mitogen-activated protein
kinase 8 pathway and cell death-associated pathogenesis of NAFLD
(42). Thus, RAC1 may be the
pathogenic contributor and progressive factor of NAFLD. In module
three, the identified core factor was RNPS1 with a degree of 18,
which has been discussed above.
The mRNA expression levels of hub genes in
OA-treated LO2 cells were additionally determined. The results
revealed that the expression of AGTR1, RAC1, RNPS1 and UBC was
significantly altered in OA-treated LO2 cells (P<0.05), which
was consistent with the results of the bioinformatics analysis. The
statistical difference in FNBP1L expression was not significant
(P=0.0807), although its expression appeared to be upregulated in
OA-treated cells. This may be due to several reasons. Firstly, gene
chip screening for gene expression profiles is characterized by
high throughput and a large scale, whereas PCR is suitable for
studying alterations in the expression of a single gene.
Furthermore, there may be differences between the preservation and
detection of the samples in different research groups.
Additionally, tissue samples are composed of numerous cell types
and are therefore much more complex, whereas a cell line has a
better homogeneity compared with a tissue sample. Finally, for a
cell model, the different methods used to establish the cell model
may affect the gene expression spectrum. Therefore, it is necessary
to conduct in vivo experiments in the future to further
verify the expression of the identified hub genes.
Due to a lack of NAFLD miRNA expression profile
microarray datasets, the present study predicted the candidate
miRNAs, drugs and diseases of NAFLD using Webgestalt. The key
candidate disease in module one was hyperlipidemia, which was
predominantly associated with ADRB2. The predicted candidate drugs
were classified as antihypertensive drugs, which were additionally
associated with ADRB2. ADRB2 has been reported to be involved in
asthma and obesity (43,44). ADRB2-knockout mice have attenuated
phosphorylation of extracellular regulated protein kinase, which
prevents diabetes mellitus-associated contractile dysfunction
(45), indicating that ADRB2 may
be a potential therapeutic target for diabetes mellitus-associated
diseases of the cardiovascular system. The identified candidate
miRNA was miR-101, which is linked to frizzled-4, F-box/WD repeat
containing protein 11 and ubiquitin-conjugating enzyme E2 A.
Previous studies have reported that miR-101 is associated with
various tumor types and may regulate chemotherapeutic sensitivity
in acute lymphoblastic leukemia (46,47).
However, there have been no studies focusing on the association
between miR-101 and NAFLD, to the best of our knowledge.
The identified candidate diseases in module two were
cardiac dysfunction and neoplasm progression, which were
predominantly associated with RAC1. The principal candidate drugs
were anti-cancer drugs associated with proto-oncogene
tyrosine-protein kinase Src (SRC). Studies have suggested that SRC
is involved in the development and progression of certain cancer
types (48,49). The identified candidate miRNA was
miR-29B, which is able to suppress the progression of tumors and
prevent liver fibrosis, indicating that it may be an effective
therapeutic target for NAFLD-associated fibrosis and HCC (50–52).
Additionally, miR-29B was linked with CDC42 in module two, which in
turn was associated with the aforementioned hub genes RAC1 and
FNBP1L. The identified candidate diseases in module three were
certain tumor types, which were predominantly associated with 39S
ribosomal protein L13, mitochondrial, which functions in
mitochondrial translation. The candidate drug was
2,6,8-trimethyl-3-amino-9-benzyl-9-methoxynonanoic acid. The
identified candidate miRNA was miR-218, which is reported to
inhibit tumor invasion (53). The
candidate drug and miRNA in module three are associated with
protein phosphatase 2 regulatory subunit Bα, a subunit of protein
phosphatase 2 that regulates protein kinase B signaling activity
and is thought to regulate liver fibrosis in biliary atresia
(54,55). Taken together, the above results
suggest that the identified drugs and miRNAs are candidate
therapeutic or adjuvant targets in NAFLD.
In the present study, five hub genes and the
associated functions and pathways of these genes were identified in
NAFLD through integrated bioinformatics-based analysis and in
vitro confirmation. However, there were certain limitations to
the present analysis. There were certain discrepancies between the
bioinformatics analysis results and the in vivo experimental
model. Therefore, further verification of the expression of the
identified hub genes, particularly FNBP1L, in vivo is
required. Additionally, screening of the expression profile of
miRNAs in NAFLD samples is necessary to obtain the mRNA-miRNA
interaction networks. A higher number of subjects should also be
recruited in future experiments in order to decrease deviation.
Acknowledgements
The authors acknowledge the assistance from the
staff at the department of infectious disease in The First
Affiliated Hospital of Chongqing medical university for providing
experimental site and technical help.
Funding
No funding was received.
Availability of data and materials
All data generated or analyzed during this study are
included in this published article.
Authors' contributions
LL, HL and XH conceived and designed the
experiments. LL, HL, YW and YHu performed the experiments. LL, YHe
and QL acquired, analyzed and interpreted the data and wrote the
paper.
Ethics approval and consent to
participate
Not applicable.
Consent for publication
Not applicable.
Competing interests
The authors declare that they have no competing
interests.
Glossary
Abbreviations
Abbreviations:
|
BP
|
biological process
|
|
DEGs
|
differentially expressed genes
|
|
GEO
|
Gene Expression Omnibus
|
|
GO
|
Gene Ontology
|
|
KEGG
|
Kyoto Encyclopedia of Genes and
Genomes
|
|
HC
|
healthy control
|
|
MF
|
molecular function
|
|
NAFLD
|
non-alcoholic fatty liver disease
|
|
NASH
|
non-alcoholic steatohepatitis
|
|
PPI
|
protein-protein interaction
|
|
SS
|
steatosis
|
References
|
1
|
Lewis JR and Mohanty SR: Nonalcoholic
fatty liver disease: A review and update. Dig Dis Sci. 55:560–578.
2010. View Article : Google Scholar : PubMed/NCBI
|
|
2
|
Starmann J, Fälth M, Spindelböck W, Lanz
KL, Lackner C, Zatloukal K, Trauner M and Sültmann H: Gene
expression profiling unravels cancer-related hepatic molecular
signatures in steatohepatitis but not in steatosis. PLoS One.
7:e465842012. View Article : Google Scholar : PubMed/NCBI
|
|
3
|
Lonardo A, Byrne CD, Caldwell SH,
Cortez-Pinto H and Targher G: Global epidemiology of nonalcoholic
fatty liver disease: Meta-analytic assessment of prevalence,
incidence, and outcomes. Hepatology. 64:1388–1389. 2016. View Article : Google Scholar : PubMed/NCBI
|
|
4
|
Arendt BM, Comelli EM, Ma DW, Lou W,
Teterina A, Kim T, Fung SK, Wong DK, McGilvray I, Fischer SE and
Allard JP: Altered hepatic gene expression in nonalcoholic fatty
liver disease is associated with lower hepatic n-3 and n-6
polyunsaturated fatty acids. Hepatology. 61:1565–1578. 2015.
View Article : Google Scholar : PubMed/NCBI
|
|
5
|
Sookoian S, Castaño G, Gianotti TF, Gemma
C, Rosselli MS and Pirola CJ: Genetic variants in STAT3 are
associated with nonalcoholic fatty liver disease. Cytokine.
44:201–206. 2008. View Article : Google Scholar : PubMed/NCBI
|
|
6
|
Min HK, Mirshahi F, Verdianelli A, Pacana
T, Patel V, Park CG, Choi A, Lee JH, Park CB, Ren S and Sanyal AJ:
Activation of the GP130-STAT3 axis and its potential implications
in nonalcoholic fatty liver disease. Am J Physiol Gastrointest
Liver Physiol. 308:G794–G803. 2015. View Article : Google Scholar : PubMed/NCBI
|
|
7
|
Miele L, Beale G, Patman G, Nobili V,
Leathart J, Grieco A, Abate M, Friedman SL, Narla G, Bugianesi E,
Day CP and Reeves HL: The Kruppel-like factor 6 genotype is
associated with fibrosis in nonalcoholic fatty liver disease.
Gastroenterology. 135:282–291.e1. 2008. View Article : Google Scholar : PubMed/NCBI
|
|
8
|
Seo YS, Kim JH, Jo NY, Choi KM, Baik SH,
Park JJ, Kim JS, Byun KS, Bak YT, Lee CH, et al: PPAR agonists
treatment is effective in a nonalcoholic fatty liver disease animal
model by modulating fatty-acid metabolic enzymes. J Gastroenterol
Hepatol. 23:102–109. 2008.PubMed/NCBI
|
|
9
|
Sazci A, Ergul E, Aygun C, Akpinar G,
Senturk O and Hulagu S: Methylenetetrahydrofolate reductase gene
polymorphisms in patients with nonalcoholic steatohepatitis (NASH).
Cell Biochem Funct. 26:291–296. 2008. View
Article : Google Scholar : PubMed/NCBI
|
|
10
|
Sun MY, Zhang L, Shi SL and Lin JN:
Associations between Methylenetetrahydrofolate Reductase (MTHFR)
Polymorphisms and Non-Alcoholic Fatty Liver Disease (NAFLD) risk: A
meta-analysis. PLoS One. 11:e01543372016. View Article : Google Scholar : PubMed/NCBI
|
|
11
|
Edgar R, Domrachev M and Lash AE: Gene
expression omnibus: NCBI gene expression and hybridization array
data repository. Nucleic Acids Res. 30:207–210. 2002. View Article : Google Scholar : PubMed/NCBI
|
|
12
|
R Core Team: R: A Language and Environment
for Statistical ComputingR Foundation for Statistical Computing.
Vienna: 2011, http://www.R-project.org/
|
|
13
|
Huang DW, Sherman BT, Tan Q, Collins JR,
Alvord WG, Roayaei J, Stephens R, Baseler MW, Lane HC and Lempicki
RA: The DAVID gene functional classification tool: A novel
biological module-centric algorithm to functionally analyze large
gene lists. Genome Biol. 8:R1832007. View Article : Google Scholar : PubMed/NCBI
|
|
14
|
Franceschini A, Szklarczyk D, Frankild S,
Kuhn M, Simonovic M, Roth A, Lin J, Minguez P, Bork P, von Mering C
and Jensen LJ: STRING v9.1: Protein-protein interaction networks,
with increased coverage and integration. Nucleic Acids Res.
41:(Database Issue). D808–D815. 2013. View Article : Google Scholar : PubMed/NCBI
|
|
15
|
Smoot ME, Ono K, Ruscheinski J, Wang PL
and Ideker T: Cytoscape 2.8: New features for data integration and
network visualization. Bioinformatics. 27:431–432. 2011. View Article : Google Scholar : PubMed/NCBI
|
|
16
|
Bandettini WP, Kellman P, Mancini C,
Booker OJ, Vasu S, Leung SW, Wilson JR, Shanbhag SM, Chen MY and
Arai AE: MultiContrast Delayed Enhancement (MCODE) improves
detection of subendocardial myocardial infarction by late
gadolinium enhancement cardiovascular magnetic resonance: A
clinical validation study. J Cardiovasc Magn Reson. 14:832012.
View Article : Google Scholar : PubMed/NCBI
|
|
17
|
Zhang B, Kirov S and Snoddy J: WebGestalt:
An integrated system for exploring gene sets in various biological
contexts. Nucleic Acids Res. 33:(Web Server Issue). W741–W748.
2005. View Article : Google Scholar : PubMed/NCBI
|
|
18
|
Wang B, Li L, Fu J, Yu P, Gong D, Zeng C
and Zeng Z: Effects of long-chain and medium-chain fatty acids on
apoptosis and oxidative stress in human liver cells with steatosis.
J Food Sci. 81:H794–H800. 2016. View Article : Google Scholar : PubMed/NCBI
|
|
19
|
An S, Zhao LP, Shen LJ, Wang S, Zhang K,
Qi Y, Zheng J, Zhang XJ, Zhu XY, Bao R, et al: USP18 protects
against hepatic steatosis and insulin resistance via its
deubiquitinating activity. Hepatology. 66:1866–1884. 2017.
View Article : Google Scholar : PubMed/NCBI
|
|
20
|
Livak KJ and Schmittgen TD: Analysis of
relative gene expression data using real-time quantitative PCR and
the 2(-Delta Delta C(T)) method. Methods. 25:402–408. 2001.
View Article : Google Scholar : PubMed/NCBI
|
|
21
|
Raaz D, Herrmann M, Ekici AB, Klinghammer
L, Lausen B, Voll RE, Leusen JH, van de Winkel JG, Daniel WG, Reis
A and Garlichs CD: FcgammaRIIa genotype is associated with acute
coronary syndromes as first manifestation of coronary artery
disease. Atherosclerosis. 205:512–516. 2009. View Article : Google Scholar : PubMed/NCBI
|
|
22
|
Yang SK, Jung Y, Kim H, Hong M, Ye BD and
Song K: Association of FCGR2A, JAK2 or HNF4A variants with
ulcerative colitis in Koreans. Dig Liver Dis. 43:856–861. 2011.
View Article : Google Scholar : PubMed/NCBI
|
|
23
|
Asano K, Matsushita T, Umeno J, Hosono N,
Takahashi A, Kawaguchi T, Matsumoto T, Matsui T, Kakuta Y, Kinouchi
Y, et al: A genome-wide association study identifies three new
susceptibility loci for ulcerative colitis in the Japanese
population. Nat Genet. 41:1325–1329. 2009. View Article : Google Scholar : PubMed/NCBI
|
|
24
|
Chandrashekaran V, Seth RK, Dattaroy D,
Alhasson F, Ziolenka J, Carson J, Berger FG, Kalyanaraman B, Diehl
AM and Chatterjee S: HMGB1-RAGE pathway drives peroxynitrite
signaling-induced IBD-like inflammation in murine nonalcoholic
fatty liver disease. Redox Biol. 13:8–19. 2017. View Article : Google Scholar : PubMed/NCBI
|
|
25
|
Shulman GI: Cellular mechanisms of insulin
resistance. J Clin Invest. 106:171–176. 2000. View Article : Google Scholar : PubMed/NCBI
|
|
26
|
Kumar R, Prakash S, Chhabra S, Singla V,
Madan K, Gupta SD, Panda SK, Khanal S and Acharya SK: Association
of pro-inflammatory cytokines, adipokines & oxidative stress
with insulin resistance & non-alcoholic fatty liver disease.
Indian J Med Res. 136:229–236. 2012.PubMed/NCBI
|
|
27
|
Kim J, Kundu M, Viollet B and Guan KL:
AMPK and mTOR regulate autophagy through direct phosphorylation of
Ulk1. Nat Cell Biol. 13:132–141. 2011. View Article : Google Scholar : PubMed/NCBI
|
|
28
|
Valenti L, Rametta R, Dongiovanni P,
Maggioni M, Fracanzani AL, Zappa M, Lattuada E, Roviaro G and
Fargion S: Increased expression and activity of the transcription
factor FOXO1 in nonalcoholic steatohepatitis. Diabetes.
57:1355–1362. 2008. View Article : Google Scholar : PubMed/NCBI
|
|
29
|
Plat AW, Stoffers HE, de Leeuw PW, van
Schayck CP, Soomers FL, Kester AD, Aretz K and Kroon AA: The
association between arterial stiffness and the angiotensin II type
1 receptor (A1166C) polymorphism is influenced by the use of
cardiovascular medication. J Hypertens. 27:69–75. 2009. View Article : Google Scholar : PubMed/NCBI
|
|
30
|
Jourdan T, Szanda G, Rosenberg AZ, Tam J,
Earley BJ, Godlewski G, Cinar R, Liu Z, Liu J, Ju C, et al:
Overactive cannabinoid 1 receptor in podocytes drives type 2
diabetic nephropathy. Proc Natl Acad Sci USA. 111:E5420–E5428.
2014. View Article : Google Scholar : PubMed/NCBI
|
|
31
|
Kagawa T, Takao T, Horino T, Matsumoto R,
Inoue K, Morita T and Hashimoto K: Angiotensin II receptor blocker
inhibits tumour necrosis factor-alpha-induced cell damage in human
renal proximal tubular epithelial cells. Nephrology (Carlton).
13:309–315. 2008. View Article : Google Scholar : PubMed/NCBI
|
|
32
|
Yoneda M, Hotta K, Nozaki Y, Endo H,
Uchiyama T, Mawatari H, Iida H, Kato S, Fujita K, Takahashi H, et
al: Association between angiotensin II type 1 receptor
polymorphisms and the occurrence of nonalcoholic fatty liver
disease. Liver Int. 29:1078–1085. 2009. View Article : Google Scholar : PubMed/NCBI
|
|
33
|
Mayeda A, Badolato J, Kobayashi R, Zhang
MQ, Gardiner EM and Krainer AR: Purification and characterization
of human RNPS1: A general activator of pre-mRNA splicing. EMBO J.
18:4560–4570. 1999. View Article : Google Scholar : PubMed/NCBI
|
|
34
|
Schwerk C, Prasad J, Degenhardt K,
Erdjument-Bromage H, White E, Tempst P, Kidd VJ, Manley JL, Lahti
JM and Reinberg D: ASAP, a novel protein complex involved in RNA
processing and apoptosis. Mol Cell Biol. 23:2981–2990. 2003.
View Article : Google Scholar : PubMed/NCBI
|
|
35
|
Huett A, Ng A, Cao Z, Kuballa P, Komatsu
M, Daly MJ, Podolsky DK and Xavier RJ: A novel hybrid yeast-human
network analysis reveals an essential role for FNBP1L in
antibacterial autophagy. J Immunol. 182:4917–4930. 2009. View Article : Google Scholar : PubMed/NCBI
|
|
36
|
Chander H, Brien CD, Truesdell P, Watt K,
Meens J, Schick C, Germain D and Craig AW: Toca-1 is suppressed by
p53 to limit breast cancer cell invasion and tumor metastasis.
Breast Cancer Res. 16:34132014. View Article : Google Scholar : PubMed/NCBI
|
|
37
|
Murray JI, Whitfield ML, Trinklein ND,
Myers RM, Brown PO and Botstein D: Diverse and specific gene
expression responses to stresses in cultured human cells. Mol Biol
Cell. 15:2361–2374. 2004. View Article : Google Scholar : PubMed/NCBI
|
|
38
|
Ryu KT, Maehr R, Gilchrist CA, Long MA,
Bouley DM, Mueller B, Ploegh HL and Kopito RR: The mouse
polyubiquitin gene UbC is essential for fetal liver development,
cell-cycle progression and stress tolerance. EMBO J. 26:2693–2706.
2007. View Article : Google Scholar : PubMed/NCBI
|
|
39
|
Xu J, Li Z, Ren X, Dong M, Li J, Shi X,
Zhang Y, Xie W, Sun Z, Liu X and Dai Q: Investigation of pathogenic
genes in chinese sporadic hypertrophic cardiomyopathy patients by
whole exome sequencing. Sci Rep. 5:166092015. View Article : Google Scholar : PubMed/NCBI
|
|
40
|
Frasa MA, Maximiano FC, Smolarczyk K,
Francis RE, Betson ME, Lozano E, Goldenring J, Seabra MC, Rak A,
Ahmadian MR and Braga VM: Armus is a Rac1 effector that inactivates
Rab7 and regulates E-cadherin degradation. Curr Biol. 20:198–208.
2010. View Article : Google Scholar : PubMed/NCBI
|
|
41
|
Oka T, Ihara S and Fukui Y: Cooperation of
DEF6 with activated Rac in regulating cell morphology. J Biol Chem.
282:2011–2018. 2007. View Article : Google Scholar : PubMed/NCBI
|
|
42
|
Sharma M, Urano F and Jaeschke A: Cdc42
and Rac1 are major contributors to the saturated fatty
acid-stimulated JNK pathway in hepatocytes. J Hepatol. 56:192–198.
2012. View Article : Google Scholar : PubMed/NCBI
|
|
43
|
Carroll CL, Stoltz P, Schramm CM and
Zucker AR: Beta2-adrenergic receptor polymorphisms affect response
to treatment in children with severe asthma exacerbations. Chest.
135:1186–1192. 2009. View Article : Google Scholar : PubMed/NCBI
|
|
44
|
Kao WT, Yen YC and Lung FW: The effects of
beta2 adrenergic receptor gene polymorphism in lipid profiles.
Lipids Health Dis. 7:202008. View Article : Google Scholar : PubMed/NCBI
|
|
45
|
Wang Q, Liu Y, Fu Q, Xu B, Zhang Y, Kim S,
Tan R, Barbagallo F, West T, Anderson E, et al: Inhibiting
insulin-mediated β2-adrenergic receptor activation prevents
diabetes-associated cardiac dysfunction. Circulation. 135:73–88.
2017. View Article : Google Scholar : PubMed/NCBI
|
|
46
|
Huang S, Yang Z, Ma Y, Yang Y and Wang S:
miR-101 enhances cisplatin-induced DNA damage through decreasing
nicotinamide adenine dinucleotide phosphate levels by directly
repressing Tp53-induced glycolysis and apoptosis regulator
expression in prostate cancer cells. DNA Cell Biol. 36:303–310.
2017. View Article : Google Scholar : PubMed/NCBI
|
|
47
|
Qian L, Zhang W, Lei B, He A, Ye L, Li X
and Dong X: MicroRNA-101 regulates T-cell acute lymphoblastic
leukemia progression and chemotherapeutic sensitivity by targeting
Notch1. Oncol Rep. 36:2511–2516. 2016. View Article : Google Scholar : PubMed/NCBI
|
|
48
|
Jin C, Zhang X, Sun M, Zhang Y, Zhang G
and Wang B: Clinical implications of the coexpression of SRC1 and
NANOG in HER-2-overexpressing breast cancers. Onco Targets Ther.
9:5483–5488. 2016. View Article : Google Scholar : PubMed/NCBI
|
|
49
|
Laschi M, Bernardini G, Geminiani M,
Manetti F, Mori M, Spreafico A, Campanacci D, Capanna R, Schenone
S, Botta M and Santucci A: Differentially activated Src kinase in
chemo-naïve human primary osteosarcoma cells and effects of a Src
kinase inhibitor. Biofactors. 43:801–811. 2017. View Article : Google Scholar : PubMed/NCBI
|
|
50
|
Zhu K, Liu L, Zhang J, Wang Y, Liang H,
Fan G, Jiang Z, Zhang CY, Chen X and Zhou G: MiR-29b suppresses the
proliferation and migration of osteosarcoma cells by targeting
CDK6. Protein Cell. 7:434–444. 2016. View Article : Google Scholar : PubMed/NCBI
|
|
51
|
Fang JH, Zhou HC, Zeng C, Yang J, Liu Y,
Huang X, Zhang JP, Guan XY and Zhuang SM: MicroRNA-29b suppresses
tumor angiogenesis, invasion, and metastasis by regulating matrix
metalloproteinase 2 expression. Hepatology. 54:1729–1740. 2011.
View Article : Google Scholar : PubMed/NCBI
|
|
52
|
Wang J, Chu E, Chen H, Man K, Go M, Huang
X, Lan H, Sung J and Yu J: microRNA-29b prevents liver fibrosis by
attenuating hepatic stellate cell activation and inducing apoptosis
through targeting PI3K/AKT pathway. Oncotarget. 6:7325–7338.
2015.PubMed/NCBI
|
|
53
|
Zhang X, Dong J, He Y, Zhao M, Liu Z, Wang
N, Jiang M, Zhang Z, Liu G, Liu H, et al: miR-218 inhibited tumor
angiogenesis by targeting ROBO1 in gastric cancer. Gene. 615:42–49.
2017. View Article : Google Scholar : PubMed/NCBI
|
|
54
|
Dong R, Zheng Y, Chen G, Zhao R, Zhou Z
and Zheng S: miR-222 overexpression may contribute to liver
fibrosis in biliary atresia by targeting PPP2R2A. J Pediatr
Gastroenterol Nutr. 60:84–90. 2015. View Article : Google Scholar : PubMed/NCBI
|
|
55
|
Kuo YC, Huang KY, Yang CH, Yang YS, Lee WY
and Chiang CW: Regulation of phosphorylation of Thr-308 of Akt,
cell proliferation, and survival by the B55alpha regulatory subunit
targeting of the protein phosphatase 2A holoenzyme to Akt. J Biol
Chem. 283:1882–1892. 2008. View Article : Google Scholar : PubMed/NCBI
|