Introduction
In tissue engineering and regenerative medicine,
there is a need for large quantities of specific cell types
(1,2). For example, in corneal disease the
use of transplants is essential, although access to corneal tissues
is difficult given the shortage of tissue donors. Therefore, an
alternative for generating specific corneal cells is needed
(3). Furthermore, specific cell
types are required in research for characterization, including
studies on responses to treatment or genetic regulatory networks
(4–7). For these needs, stem cell
technologies hold the promise of providing a sufficient number of
cells of specialized linages (2).
Such promise is based certain factors, including the fact that cell
differentiation may be reversed, that somatic cells may be induced
to be pluripotent, or that cells may be forced to alter their
identity or to transdifferentiate (8).
In this context, cell identity or cell state is
thought to be a highly regulated process that depends on their
epigenetic and transcriptional programming (9). The cell state is defined as the
transcriptional output of a gene regulatory network (10). Thus, the cell state is principally
controlled by the expression of transcription factors (TFs) forming
specific network modules to ensure stable gene expression (7). However, genome analyses have
identified approximately 2,000 TFs, and it is known that
approximately one-half are expressed in a given cell (11). Thus, there is a requirement to
elucidate which and how many TFs define specific cell states. The
majority of the current literature in stem cells suggests that only
a few TFs are required to maintain cell identity (7,12–14).
For example, only four TFs (MYC proto-oncogene bHLH transcription
factor, Kruppel like factor 4, SRY-box 2 and POU class 5 homeobox
1) are required to maintain the pluripotency state (8,15).
These factors were identified from serial rounds of gene inclusion
and withdrawal from a pool of 24 potential genes selected from
studies performed on isolated genes. From this seminal work, other
research groups identified several TFs for direct conversion
(16–18). For example, glutamic-oxaloacetic
acid transaminase 1 was used to convert fibroblasts into functional
neurons (16) while GATA-binding
protein 4 (GATA4), monocyte enhancer factor 2C
(MEF2C) and T-box 5 (TBX5) were used to convert
fibroblasts into cardiomyocytes (17). Moreover, alternative combinations
of TFs may lead to very similar cell types (18), suggesting that redundancy exists in
which the genetic regulatory networks characteristic of the cell
identity may be established by similar or equivalent combinations
of TFs.
Thus, if a cell state can be defined by a
combination of TFs, in theory, any source cell type may be
converted into any target cell type by establishing the expression
of those TFs. Thus, if the differences in expression between the
source and target cells are very small, one may consider subtle
methods based on stimulating or blocking connected pathways. If the
differences are large, as is commonly the case in converting
fibroblasts to a lineage-distant cell type, one may opt to force
expression by transdifferentiation or direct conversion (19–21)
or via the generation of induced pluripotent stem cells (iPSCs)
following the induction of the target cell type (13).
For other specific cell types, it is necessary to
identify how candidate TFs may be obtained to begin with or how
alternative TFs may be obtained. In the present study, the focus
will be on providing simplified views of the computational
approaches that have been proposed to identify a set or sets of
putative TFs likely to control the cell state of the desired cell
type. This proposed view may be highly illustrative for
non-bioinformatics specialists for a number of reasons. Firstly,
previously proposed computational methods are complex. Secondly,
the literature accompanying the computational methods is highly
technical. Thirdly, the descriptions of certain methods may appear
vague for non-specialists. Fourthly, certain data (specifically,
the networks) or computer scripts and tools described in the
algorithms are currently unavailable, complicating
re-implementations. Finally, the majority of approaches were
proposed using ad-hoc parameters and specific datasets. In
addition, for bioinformatics specialists, a succinct starting point
for novel implementations was provided by the present review. To
overcome the aforementioned difficulties, a simplified and unified
view of current methods was provided, which may be summarized thus:
i) The establishment of the population of cell types; ii) the
estimation of candidate TFs from cell populations; and iii) the
filtering of TF pre-candidates (the most challenging element).
Derived from these summarized concepts, clues as to how the methods
work are provided, in addition to knowledge as to how to overcome
or approach difficulties. Possible ways in which these
computational methods may be re-implemented and adapted to provide
a preliminary list of TFs are additionally provided.
Identifying key cell-state transcription
factors
The idea that cell states are associated with the
binary decision of cell fates has long been proposed (22). However, computational approaches to
identify key TFs governing cell states are more recent. In
practice, an aim may be to directly convert a specific source cell
type into a target cell type; therefore, the most important
component is the estimation of the target cell state, since the
state of the source cell type may be forced to change. The source
cell type is important to be able to estimate those TFs that may be
redundant and perhaps do not required manipulation; this may be
easily performed by comparing expression levels. Therefore, the
majority of methods primarily focus on the estimation of TFs
controlling the target cell state. The following sections consider
the approaches of recent studies (23–26),
which are accordingly referred to as Cahan et al (23), D'Alessio et al (24), Rackham et al (25) and Okawa et al (26).
Identification of TFs via differential
expression
Under the assumption that the cell identity is
controlled by the gene expression level of a specific set of TFs,
it follows that the identity of cell types be controlled by either
different levels of the same set of TFs or a different set of TFs
(7). In any case, the same
operation is needed: The identification of the characteristic and
distinct gene expression levels. This is best known as differential
expression. Since this operation involves the comparison between at
least two populations assumed to be distinct, the target cell type
population and the ‘background’ population require careful
selection. In theory, if these populations are well defined and the
available data are highly representative and precise, it ought to
be possible to create a small list of TFs. However, even today, the
available data are scarce, highly noisy and contaminated with
different populations of cells; the data from in vitro
assays may not reflect genuine in vivo properties; and the
computational and statistical tools may be imperfect. Therefore,
the output of the differential expression between the defined cell
populations usually generates large lists of pre-candidate TFs.
Filtering problem
Assuming that the number of TFs controlling the cell
identity is small, this large list of pre-candidate TFs ought to be
highly contaminated with false-positive calls representing
cell-state-irrelevant TFs that require filtering out. Although
certain irrelevant TFs may be easily identified by expert
researchers and available biological knowledge in the literature,
this process is time-consuming and may be prone to
misinterpretations, errors and omissions. In addition, certain TFs
may not be well studied or studied at all. Furthermore, manual
filtering of the list causes difficulties in the scoring or ranking
of TFs according to the scientific literature. Therefore, the
systematic filtering and ranking of pre-candidate TFs is a
challenging issue. This filtering process is obscured in original
research articles due to the complexity of their implementations.
The majority of the considered methods perform this filtering
procedure analyzing the TFs within the context of biological
networks. Although this may be considered to be a drawback by
non-bioinformatics specialists, this step need not be very
complicated to help to reduce large lists. In particular, within
the examples provided, even when no filtering is used, sensible
results may be obtained if target and non-target cell populations
are well defined.
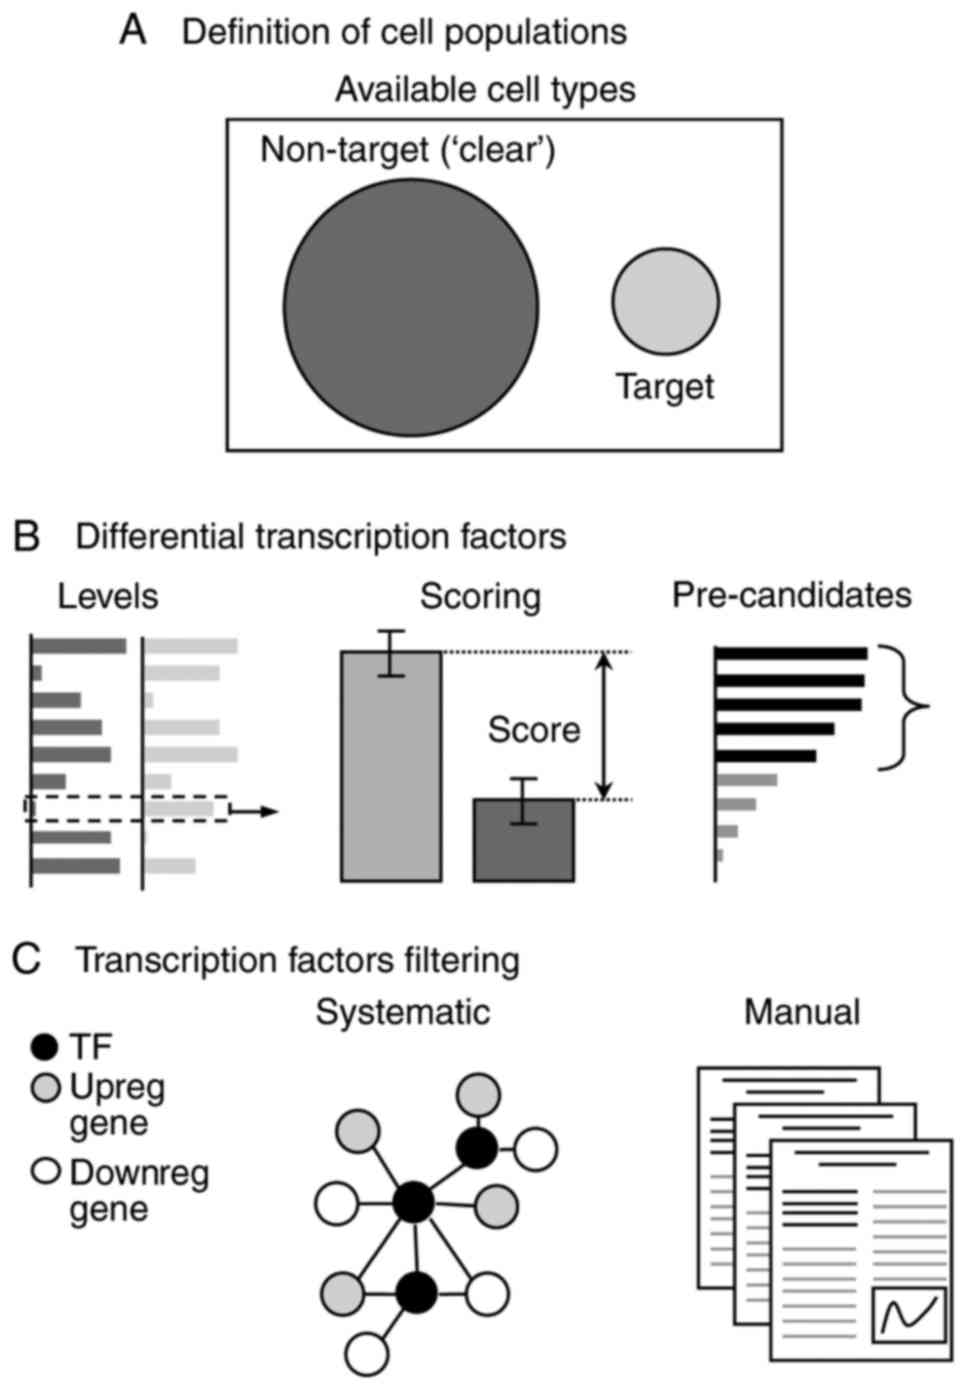
In summary, the proposed view of the process to
identify TFs likely controlling a cell state is demonstrated in
Fig. 1 and is discussed in the
following sections. In practice, it may be advisable to start with
a specific source cell type for induction to a target cell type,
whereas the majority of methods focus on the target cell type to
identify TFs associated with the cell state (23–25).
Thus, once the cell types have been identified, as depicted in
Fig. 1, the TF expression profile
of the source cell type is compared with the target to identify
those TFs required to induce from that particular source.
Defining the populations of cell
types
The first step consists of defining at least two
populations of cell types (Fig.
1A), which are referred to as target and non-target cell types.
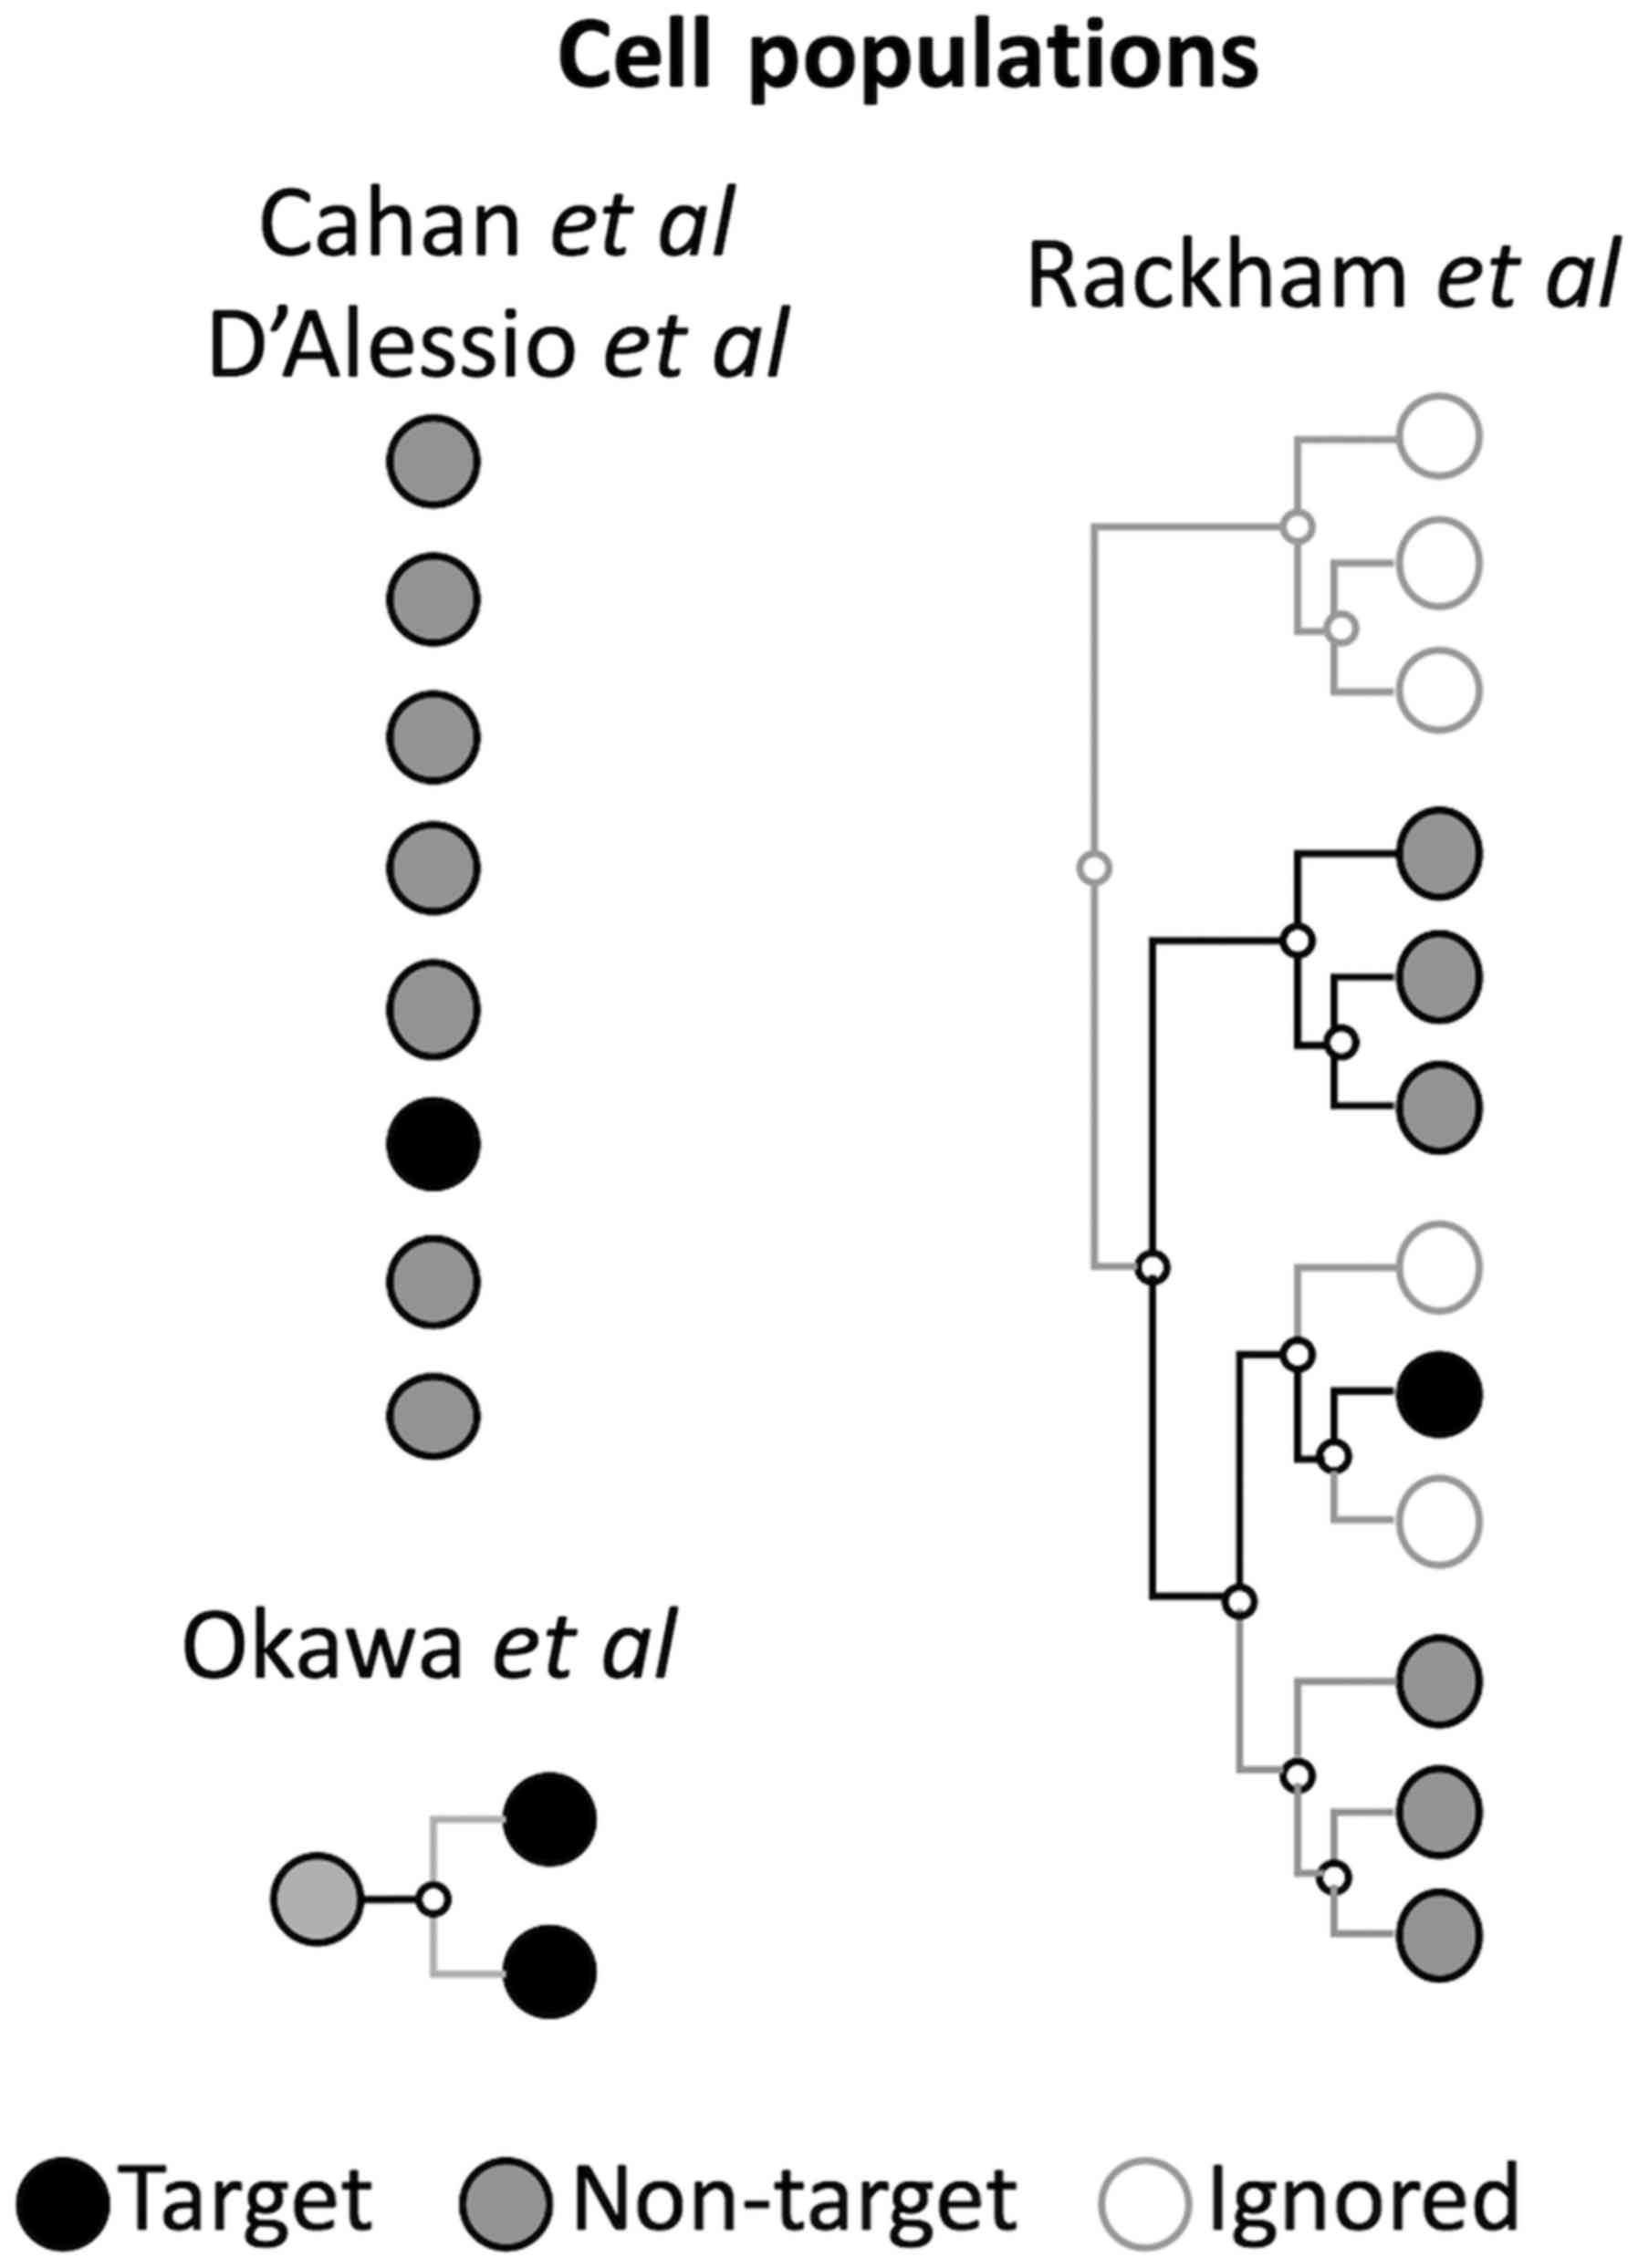
A comparison of conceptual definitions by the authors is
demonstrated in Fig. 2 and
discussed in the following paragraphs.
Datasets used
Gene expression data are required to be uniformly
annotated for target and non-target cell types. Therefore, the
majority of methods utilize information from the vast collections
of microarray gene expression data available from the Gene
Expression Omnibus (GEO) (27,28)
and ArrayExpress (29,30), or from more recent next-generation
sequence repositories in ENCODE (31) or FANTOM (6). The repositories used are detailed in
Table I. The majority of the
studies discussed in the present review used GEO microarray data,
except Rackham et al (25),
who used FANTOM5. They studied human data, although Cahan et
al (23) additionally included
murine data. The majority of the studies included numerous cell
types; however, Okawa et al (26) used progenitor and daughter cell
types from specific third-party authors.
 | Table I.Definition of populations of cell
types by all methods. |
Table I.
Definition of populations of cell
types by all methods.
| Author, year | Data | Target | Non-targets | (Refs.) |
|---|
| Cahan et al,
2014 | GEO, queried
datasets, 16–20 cell types | Several samples of
the same cell or tissue type | Remaining cell
types | (23) |
| D'Alessio et
al, 2015 | GEO, 504 datasets,
233 cell types | Several samples of
the same cell or tissue type | Remaining cell
types (balanced) | (24) |
| Rackham et
al, 2016 | FANTOM5, >700
datasets (CAGE-Seq) | Samples of the same
cell type | Remaining cell
types but avoiding close and distant related ones | (25) |
| Okawa et al,
2016 | GEO, Specific
data | A daughter cell
type | The progenitor and
sister cell types | (26) |
Target cell type
For the target population, which is generally the
easiest to delimitate, a number of considerations are noteworthy.
First, the target cell type is required to be well represented.
From the authors reviewed herein, various experiments were
performed in vitro, while others have been obtained from
tissue samples. The experiments performed in vitro have the
advantage of a well-defined cell type, whilst the tissue samples
may represent a mixture of distinct cell types generating an
average cell state that may not properly represent the desired
target. Second, the gene expression data may reflect the cell state
of an individual donor instead of a population-generalizable cell
state. Thus, it is desirable to include as many individuals as
possible. Third, repetition is desirable as gene expression data
are noisy, which is worsened by the technology used to acquire the
data (particularly microarrays). In summary, the targets used for
each method are mentioned in Table
I. Rackham et al (25)
used a hierarchical ontology definition of cell types from FANTOM5
to define a particular target cell type; they ignored closely
associated cell types (Fig. 2). In
this way, they favored the purity of the cell state. However, they
lost generality as closed cell types may help to eliminate
non-specific TFs, leading to larger lists of pre-candidate TFs if
their implementation is not followed thoroughly. On the contrary,
Okawa et al (26) used a
specific cell type contrasted with the closest associated cell
types (daughter cell types; Fig.
2). This has a number of advantages since the comparison of
close, although distinct, cell types may lead to the clear
identification of controlling TFs. However, this method is unable
to be generalized as the type of experimental setting (well-defined
progenitor and daughter cell types) required to run this approach
is not as common in the data repositories and must be performed in
advance to generate the data. D'Alessio et al (24) and Cahan et al (23) first defined a number of classes of
tissues or cell types and compared each class against the remaining
classes (Fig. 2). In each class,
they used numerous samples, avoiding individual and noise
effects.
Non-target cell types
Following removal of the target data, the non-target
data are commonly obtained from the remaining tissue or cell types
of the defined datasets (Table I).
Nevertheless, Rackham et al (25) removed distantly related samples,
probably due to a highly-curated cell lineage ontology. This has
the advantage of removing false differentially expressed TFs that
may control specialized functions in distant and target cell types,
presumably via an upregulated TF. Nevertheless, this concept is
only useful if the TF differential scoring depends on downregulated
TFs, as in Rackham et al (25). Therefore, the removal of distant
cell types may be redundant if only upregulated TFs are considered
and there are no large combinational effects in TFs. In addition,
the threshold required to determine distance is hard to define,
complicating further tests in diverse scenarios. In Okawa et
al (26), the target was one
of the daughter cell types, and therefore the non-target was formed
by the progenitor and the sister cell type. An issue with using
large collections of samples in the non-target is that it may be
highly disproportional to the number of samples. To avoid this
overrepresentation, in D'Alessio et al (24), the non-target dataset was balanced
by selecting a representative sample from the collection of samples
of each cell type.
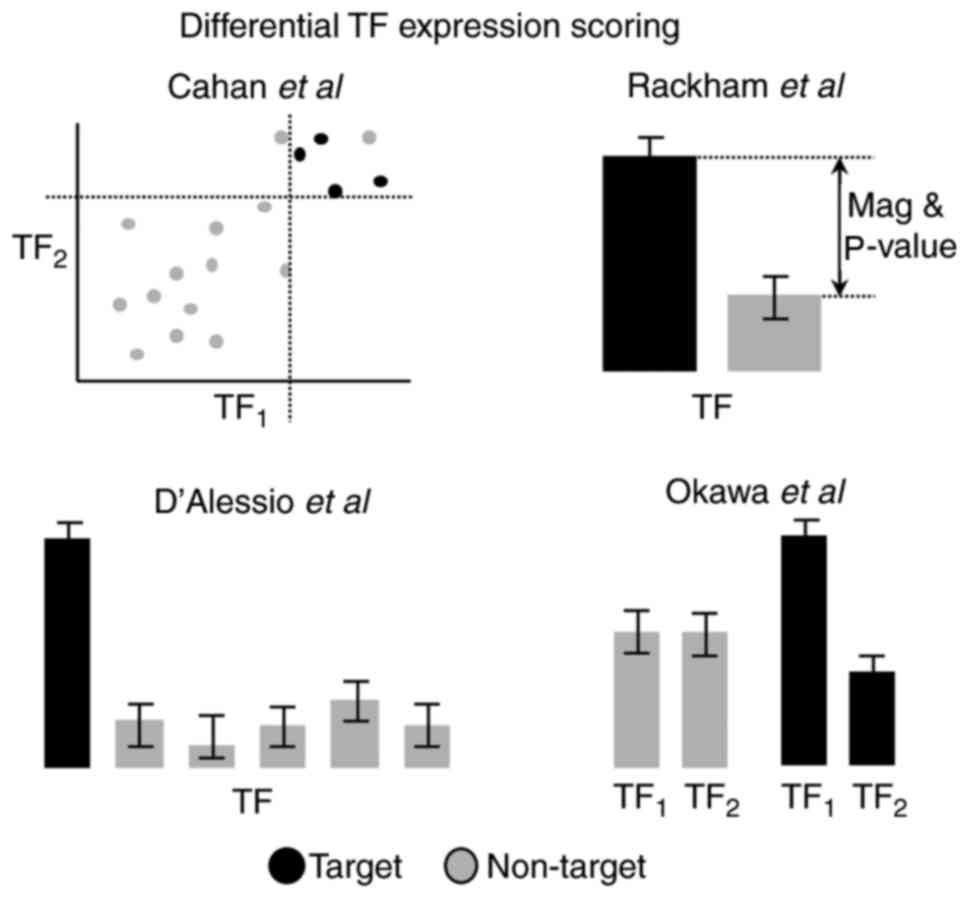
Identification of pre-candidate TFs
The four computational methods proposed used
different approaches, which are conceptually summarized in Fig. 3. Theoretically, however, the
identification of putative TFs may be obtained by identifying TFs
whose expression is statistically different. Therefore, parametric,
non-parametric or permutation tests may provide similar results
(32–34). Statistical tests provide a P-value
that is useful, although it does not represent the magnitude of the
difference between two average expression levels and is sensitive
to the variance and number of samples (35). Alternatively, these issues may be
solved by using combinations of the P-value and fold-change, for
example in Rackham et al (25), where the score per TF is based on
the absolute magnitude of the fold-change multiplied by the
(negative) logarithm of the P-value. Nevertheless, certain of the
methods reviewed demonstrate a preference for other strategies
(Table II). For example,
D'Alessio et al (24) used
Jensen-Shannon Divergence (JSD), which is a measure of the
discrepancy between distributions. JSD was used to score
differences between the observed TF expression profiles and
idealized ones. These idealized profiles are formed by combining
high expression in the corresponding target cell type and no
expression in the remaining cell types.
| Table II.Identification of differential
expressed TF. |
Table II.
Identification of differential
expressed TF.
| Author, year | Method | Comparison | (Refs.) |
|---|
| Cahan et al,
2014 | Tissue-Specific
Context Likelihood of Relatedness | Pairs of
co-expressed TF | (23) |
| D'Alessio et
al, 2015 | Jensen-Shannon
Divergence | Per TF | (24) |
| Rackham et
al, 2016 | Combines P-values
and fold-change | Per TF | (25) |
| Okawa et al,
2016 | Normalized Ratio
Difference | Pairs of
swap-expressed TF | (26) |
Instead of comparing one TF across cell types, Okawa
et al (26) and Cahan et
al (23) compared pairs of TFs
(Table II and Fig. 3). The comparison of pairs is based
on the concept that balanced expression between two TFs is
associated with cell identity (36–38).
Okawa et al (26) proposed
the normalized ratio difference (NRD) to score all pairs of TFs
that are similarly expressed in a progenitor cell type, and highly
different in and between daughter cell types. Cahan et al
(23) additionally compared pairs
of TFs, using the metric of the context likelihood of relatedness
(CLR). The CLR is a measure that favors TFs that are highly
correlated (by mutual information) and whose correlations are
within the top ranked to increase the probability of genuine
associations (39). Notably, while
Okawa et al (26) favored
pairs of TFs whose expression was different in daughter cells,
Cahan et al (23) favored
TFs that were co-expressed and whose expression levels were
cell-type specific (as explained in more detail in the following
section). These opposing views are associated with the input data:
Okawa et al (26) used cell
types that were extremely close in the lineage, whereas Cahan et
al (23) use tissue types that
are more distant (Fig. 2). By
definition, these methods will generate much larger lists of
pre-candidates compared with those comparing one TF at the time.
For example, assuming that there are ~2,000 TFs, there would be
1,999.000 pairwise comparisons vs. 2,000 when only one TF is
assessed at the time. Thus, these methods require extensive
filtering.
Filtering the pre-candidate TF list
The objective of this step is to further filter the
pre-candidate list to end up with a short list of candidate TFs
whose overexpression will likely control the desired cell state.
This step is frequently the most complex and time-consuming; it
depends on the length of the pre-candidate TF list and the rules
defined in the filters. In assays of one TF, including in D'Alessio
et al (24) and Rackham
et al (25), if 5% of the
1,000 expressed TFs are differential, a list of ~50 TFs is
expected. This estimate is not far from reality, supposing that few
TFs control the cell state by means of regulating further TFs,
which thus regulate the downstream effector genes. Furthermore, for
methods that compare pairs of TF, including in Okawa et al
(26) and Cahan et al
(23), and even optimistically
estimating that only 0.1% of pairs are of interest, ~1,000 pairs of
TFs would have to be analyzed from the ~1,000.000 TF pairs
generated. Unless a shorter pre-candidate list is obtained,
analyzing the TF list manually by reading scientific literature or
browsing databases by hand may be arduous, prone to errors and
time-consuming. Therefore, the filtering procedures proposed are
focused on setting sensible rules that are approachable with
current databases.
Thus far, the focus has been on differential TFs;
however, other non-TF genes require consideration. They are
involved in signal propagation or provide cell type-specific
functions and should also be considered. Therefore, to completely
explain the observations, the rules must be based on maximizing the
control over all observed differentially expressed genes (DEGs),
irrespective of the gene function (TF or not). Thus, the rules may
be easily stated as ‘show all TFs directly or indirectly
controlling all DEGs.’ If all regulatory associations between TFs
and other types of genes are known, this statement may be more
easily implemented compared with the current methods. Nevertheless,
the current databases are far from being complete, are
context-specific (by culture or tissue) and are likely to include
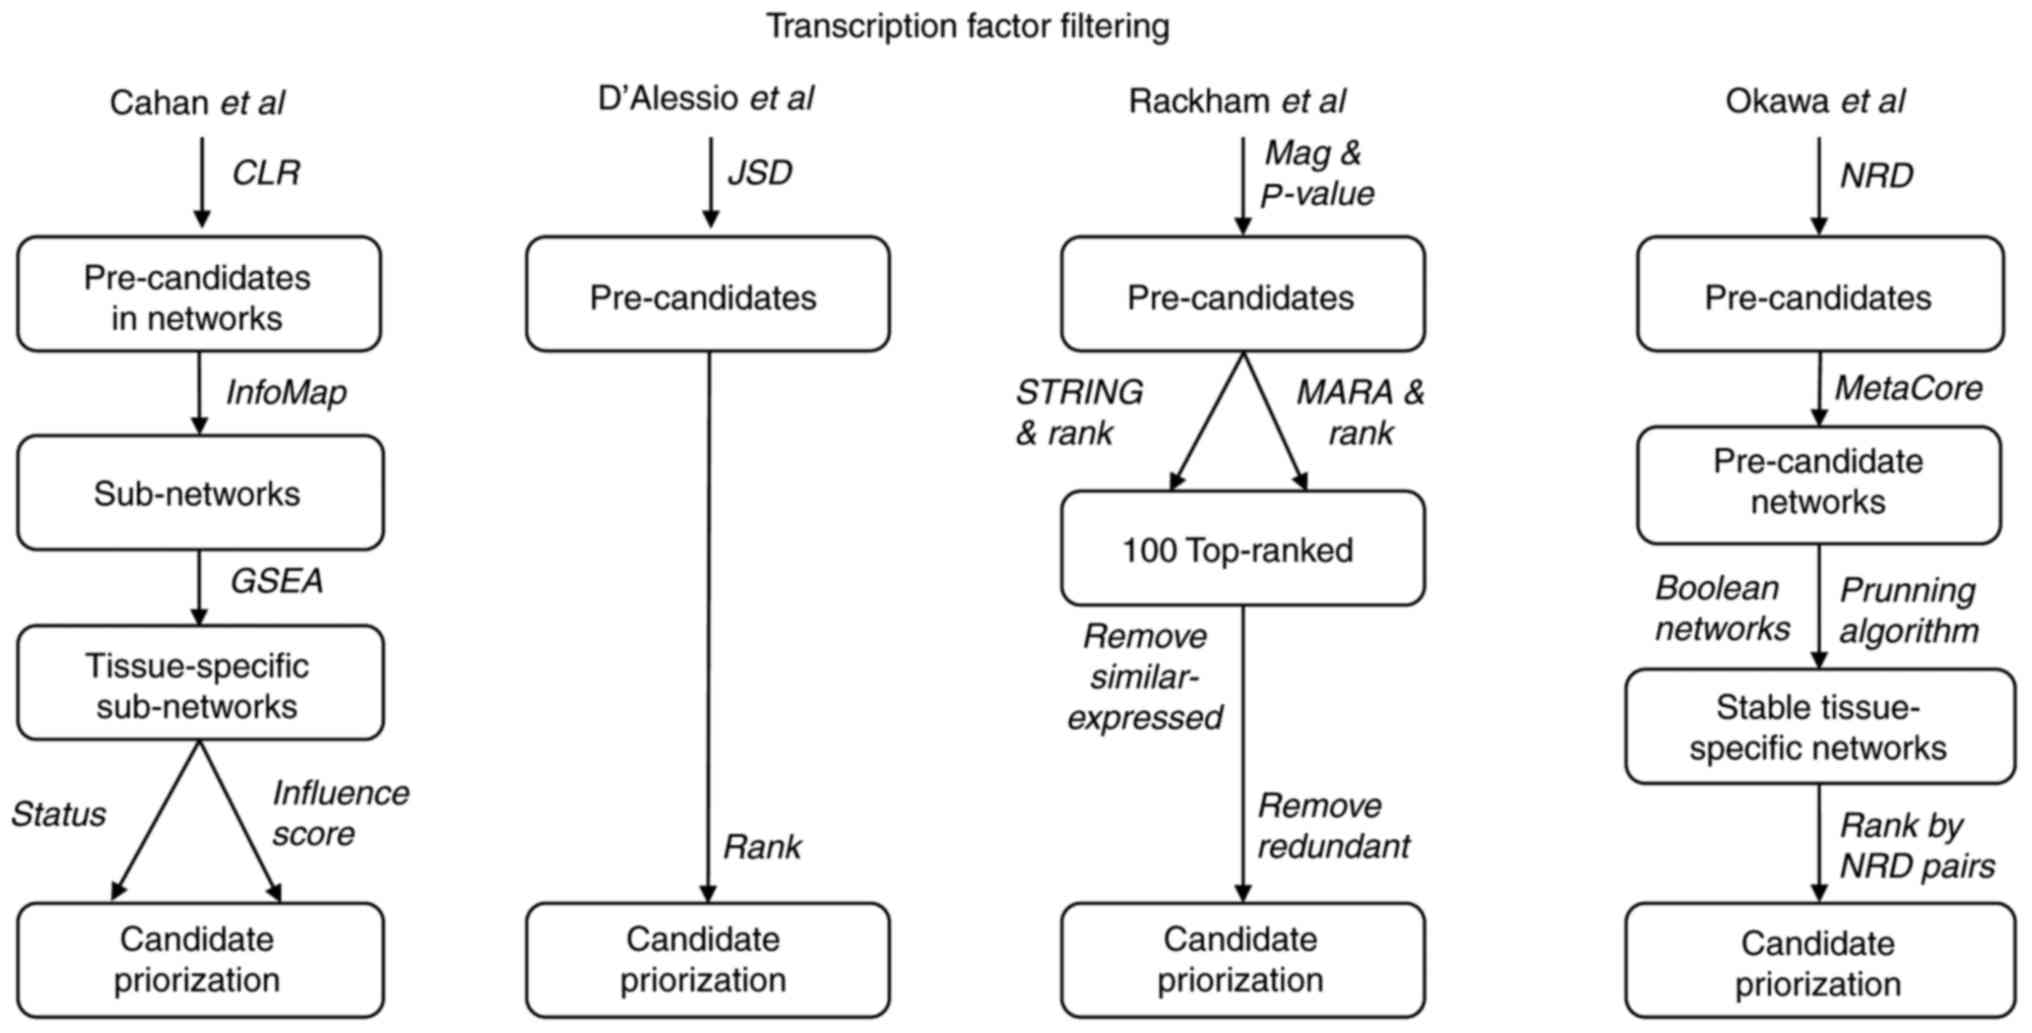
errors. Therefore, in the following paragraphs, how these rules
were implemented in each method is explained and an overview is
illustrated in Fig. 4. The
majority of the methods make use of networks, databases and other
tools to integrate information and connect the TFs with themselves
and with other DEGs.
In Cahan et al (23), a genetic regulatory network was
built upon the significantly correlated pairs of genes using the
CLR. As these networks are frequently large, the InfoMap tool was
used to split this large network into smaller, highly connected
sub-networks (40). Furthermore,
each sub-network was evaluated using gene set enrichment analysis
(GSEA) (41). GSEA generates a
score depending on the position of the genes in the sub-network
relative to all genes. If the genes are randomly distributed, the
GSEA score is low, whilst if the expression levels are more
concentrated in closer positions, the GSEA score increases. If the
GSEA score of a sub-network obtained from tissue A is higher
compared with other tissues, this sub-network is defined as
specific for tissue A. Subsequent to executing this procedure in
all sub-networks present in all tissues, Cahan et al
(23) ended up with ~76
tissue-specific sub-networks. Thus, on average, approximately five
sub-networks were expected in each of the 15–20 tissues or cell
types. From this, the study aimed to identify which sub-networks
and which genes within the sub-networks were more likely to be
manipulated, starting from a source cell type. To evaluate the
former, the expression of each gene within the target cell type
sub-network was compared against that of the source cell type; if
the expression levels were similar, no larger alterations were
required, whilst if the expression levels were very different, the
sub-network had to be re-established and was therefore a target for
manipulation. To assess the genes within the sub-networks, a
network influence score (NIS) was estimated. This NIS depends on
the difference in TF expression between the source and the target,
the differences in the expression of the predicted genes regulated
by that TF, and the number of regulated genes. In brief, a large
network was split into sub-networks, filtered for tissue
specificity, further filtered to detect those expressed at
different levels and, finally, TFs were ranked within the resultant
sub-networks. Cahan et al (23) demonstrated acceptable predictions
in a number of conversion systems and suggested that direct
conversions are less similar to the in vivo tissues compared
with those conversions obtained from iPSCs.
Elsewhere, D'Alessio et al (24) used the JSD metric against an
idealized profile to evaluate each TF between the target and
non-target cell types in around 233 cell types. This procedure
yielded 503 TFs across these cell types. A total of ~60% of the TFs
were considered to be pre-candidates in fewer than four cell types,
demonstrating that most were cell-type specific. From the
experiments, the study of D'Alessio et al (24). focused on the top 10 TFs for
induction. This approach was validated by comparing their
predictions to well-known conversion systems, including iPSCs,
neural precursor cells, cardiomyocytes, hepatocytes, motor neurons,
pancreatic islets cells and melanocytes. Furthermore, D'Alessio
et al (24) predicted and
experimentally validated their approach in the conversion of
fibroblasts to retinal pigment epithelial-like cells.
In Rackham et al (25), the pre-candidate list of TFs was
generated using a combination of a tissue-specific P-value and the
magnitude of the difference. For the filtering, two additional
network influence scores were used for each TF, which were
estimated from MARA (42) and
STRING (43) networks. These
network scores depend on how many genes are connected to each TF,
how far the connection is (number of nodes), and the score of the
regulated gene (P-value and magnitude). Subsequently, the ranks of
these three scores were added and ranked to provide a final rank.
The first filter consisted of using only the TF within the top 100
final ranks. The second filter removed the TFs that were expressed
in the source and target cell types. The third filter removed those
redundant TFs that shared the majority of their targets with other
TFs regulating more genes. A fourth filter was applied to include
the top eight TFs. The approach was validated in at least five
systems, involving conversions from fibroblasts to iPSCs,
myoblasts, hepatocytes and cardiac cells, and from B cells to
macrophages. Finally, two novel conversions were predicted and
tested experimentally, converting fibroblasts to keratinocytes and
keratinocytes to microvascular endothelial cells.
Okawa et al (26) used the NRD metric to evaluate and
select pairs of TFs. Subsequently, the MetaCore network database
(44) was used to first filter TFs
with over seven connections. This was based on the observation that
important TFs are highly connected in MetaCore. The next filter
removed unnecessary nodes of the network, based on the assumption
that a cell type may be stabilized by a gene regulatory network
that was additionally stable in the two daughter cell types. For
this, the study re-implemented a sub-network-finding optimization
algorithm combined with Boolean networks (45). A Boolean network is a methodology
that is able to identify attractor states (46). These attractors were interpreted in
biological cells as stable states that may be compared with the
states of daughter cell types filtering those matching
sub-networks. Subsequent to running the algorithm numerous times,
the following filter looked for all sub-network solutions that
contained at least one upregulated TF. Subsequently, the
sub-networks were ranked based on the number of NRD pairs present,
NRD pairs directly connected and lesser regulatory connections.
This approach was validated in five stem cell systems, including
mouse embryonic stem cells, mouse and human hematopoietic stem
cells, mouse neural stem cells and mouse mesenchymal stem cells.
Furthermore, the induction of neuronal and astrocyte
differentiation was predicted and experimentally confirmed in a
mouse neuronal stem cell system.
Finding key TFs in practice
In this section, the focus is on how to estimate the
key TFs for the target cell type of interest in an easy and
practical way, while commenting on each approach. Ideally, the
prediction would be made to manipulate a source cell type to
achieve a target cell type. However, the majority of methods are
restricted to specific sources, targets, or both. A summary is
provided in Table III, and
details are provided in the following paragraphs. An estimation of
gene expression values was assumed and their annotation for the
target cell type was available either from microarrays or from
RNA-Seq. An overview of the available tools is provided followed by
a practical example.
| Table III.Resources available for finding key
TF. |
Table III.
Resources available for finding key
TF.
| Author, year | Resources and
limitations | (Refs.) |
|---|
| Cahan et al,
2014 | CellNet: Web
interface and R package. Any source cell type as input but only
from certain Affymetrix arrays, and Illumina arrays (in R). Only
specific target cell types are available | (23) |
| D'Alessio et
al, 2015 | File for 233 cell
type predictions. Manual estimations are possible for a target.
Source is not used. | (24) |
| Rackham et
al, 2016 | Mogrify: Web
interface. Specific for several already cataloged source and target
cell types. | (25) |
| Okawa et al,
2016 | None
available. | (26) |
Overview of available tools
Cahan et al (23) provided a web interface (cellnet.hms.harvard.edu) and an R package
(pcahan1.github.io/cellnetr) termed CellNet, which may be used to
feed gene expression data of the source cell type or the already
manipulated cell types. The output was composed of three main
sections. The first output was a classification of input samples
into cell types used in CellNet. The second output demonstrated how
well each cell type-specific genetic regulatory network was
established across the input samples. This helped to identify the
networks that were required to be manipulated to achieve a cell
type. The third output demonstrated the TFs having larger
differences within networks, indicating which TFs required
manipulation. For the web version, only Affymetrix (Thermo Fisher
Scientific, Inc., Waltham, MA, USA) microarrays were able to be
used. For the R package version, Illumina (Illumina, Inc., San
Diego, CA, USA) microarray data were additionally able to be
used.
For D'Alessio et al (24), if the target cell type was already
in the list of the 233 cell types processed [available in the
supplementary information of the study (Table SI)], the top-ranked
TFs demonstrated were able to be used (~10). If the cell type was
not demonstrated, and to avoid reconstructing the entire study, the
JSD or JSD-like value for the target cell type was estimated.
Spreadsheet software using the predictions available for the 233
cell types was used. First, the TF expression of the target cell
type was required to provide a rank of expression. Second, for each
TF, the number of times this TF was counted in the top 10 other
cell types was obtained. Third, for each TF, the minimum rank of
the TF in all other cell types was obtained. Fourth, scatter plots
of the target rank of TFs against those in the second and third
steps was displayed. Fifth, TFs that were top ranked in the target
and had low counts in the first scatter plot and/or were top ranked
in the target and had higher ranks in the second scatter plot were
estimated. These steps attempted to provide an easy approximation
of the process followed by D'Alessio et al (24) instead of an accurate calculation,
although these steps may be used as an easy starting point.
From Rackham et al (25), a web interface is available
(www.mogrify.net) in which the source and target
cell types were specified from those already considered. The top
eight ranked TFs were elucidated in a few seconds. Unfortunately,
to estimate the possible TFs for a non-listed cell type, it is
necessary to reconstruct the study of Rackham et al
(25) since no datasets are
provided.
Notably, in Okawa et al (26), neither implementation nor
supplementary information was available. Thus, it is necessary to
reconstruct the study to make predictions using this method. The
MetaCore regulatory network used is not currently available, thus a
different network database or another method for estimation may be
used. Therefore, putative results may be different.
Validation of target cell state TFs via
different approaches in a well-known system
To demonstrate that this simplified view was able to
generate sensible TFs, the first two concepts were applied in a
well-known system, transdifferentiation towards cardiomyocytes
(CM).
Target and non-target datasets
The target CM data were obtained from the GEO/NCBI,
with accession no. GSE45878, for the 62 samples annotated as
‘Heart.’ The dataset consists of 837 samples from diverse tissues.
The non-target dataset was obtained from the remaining 775 samples
and the number of probes was 22,704.
Data pre-processing
The two datasets were quantile normalized and scaled
to a uniform distribution between 0 and 1, representing no
expression and maximum expression. To recognize TFs,
‘transcription’ and ‘factor’ in the annotated description were
used. Additionally, AnimalTFDB was used for the TF annotation
(47). Thus, 1,392 TFs were
considered. The target and the non-target datasets, in addition to
tissue annotation, are available at
bioinformatica.mty.itesm.mx/CEC-TF-Example.
Score implementations
A total of five scores were used, two taken from
basic concepts of differential expression, and three inspired by
those scores used by the methods reviewed here. ‘Delta’ is
the difference in mean expression values between the target and
non-target cell types. ‘t-test’ is the P-value of the unequal
variance t-test applied to target and non-target cell types.
‘Rackham’ is -Log10(p-t-test)x|Delta|, as in Rackham et
al (25). ‘D'Alessio’
is the sum of 100 JSD scores between the observed and the ideal
profile. The observed profile was estimated using the average
target expression together with k=3 random samples from non-targets
(increasing values of k did not increase similarity to other
scores). This process was similar, although not identical, to that
implemented in D'Alessio et al (24) (details of the algorithm in the
supplementary information were not clear). ‘Okawa’ was an
adaptation of the Okawa et al (26) metric to cell types different from
progenitor-daughter. It was estimated
(TFTi-TFTk)-(TFNi-TFNk),
where T and N sub-indexes refer to the mean expression values of
the target and non-target cell types, respectively, i is a
particular TF, and k represents all TFs. This metric generated very
similar results to the NRD (which involves ratios that are more
unstable, although the script provided includes the NRD
estimation). To generate a single score per TF, the number of times
a TF was included in differences between the top 1% of pairs was
counted. The score of Cahan et al (23) was not implemented since the tissue
specificity is reached following large operations in networks (the
scripts and data are available at
bioinformatica.mty.itesm.mx/CEC-TF-Example).
Summary of the results
Table IV
illustrates the results of the top 20 genes generated by the five
scoring methods. The table summarizes the most frequently mentioned
TFs and previously reported experimental findings. All of the top
seven TFs listed have already been used experimentally for the
conversion of different cell types to cardiomyocytes, including
T-box 20 (48,49), GATA4, TBX5 (50–52),
NK2 homeobox 5, and heart and neural crest derivatives expressed 2
(50,52). However, a widely used TF in this
conversion, MEF2C (17,50,51,53),
was not present in the list. Following revision, this gene was not
marked as a TF in the present databases. Even if MEF2C was
added as a TF, it was not included in the top 20 of any scoring
method. This TF appears to be important as its overexpression
removal did not generate cells expressing important cardiac markers
(17). A recent meta-analysis
specific for CM differentiation did not identify MEF2C,
although it did identify a family gene, MEF2A (54). Although this result may give some
clues regarding MEF2C, it is difficult to conclude the
extent of its importance from this data alone. On the other hand,
this example demonstrates that the majority of TFs may be obtained
via straightforward application of simple concepts, as depicted in
detail for the top 20 TFs identified in Table IV (55–61),
but also highlights that is possible that not all factors required
are obtained with the current methods.
| Table IV.Top 20 genes per method for
cardiomyocyte differentiation. |
Table IV.
Top 20 genes per method for
cardiomyocyte differentiation.
|
| Method |
|
|---|
|
|
|
|
|---|
| Author, year | Delta | t-test | Rackham | D'Alessio | Okawa | Mentions, n | TF comments
(Refs.) |
|---|
| Kamaraj et
al, 2016 | TBX20 | TBX20 | TBX20 | ZNF705A | GATA4 | HAND1, 5 | Computational
prediction (55) |
| Ieda et al,
2010; Ieda et al, 2009; | GATA4 | GATA4 | GATA4 | ZNF283 | TBX20 | HAND2, 5 | First described in
(17,53), confirmed in mouse models and
increased |
| Addis et al,
2013; Chen et al, 2015 |
|
|
|
|
|
| efficiency of CM
expression markers (50,52) |
| Ieda et al,
2010; Ieda et al, 2009; | HAND1 | HAND1 | TBX5 | ZSCAN4 | HAND1 | GATA4, 4 | Key TF first
described in (17,53), confirmed experimentally (50–52) |
| Addis et al,
2013; Chen et al, 2015; |
|
|
|
|
|
| and computationally
(56) |
| Ebrahimi et
al, 2016 |
| Ieda et al,
2010; Ieda et al, 2009; | TBX5 | TBX5 | GATA6 | LIN28B | TBX5 | TBX5, 4 | Key TF first
described in (17,53), confirmed experimentally (50–52) |
| Addis et al,
2013; Chen et al, 2015; |
|
|
|
|
|
| and computationally
(56) |
| Ebrahimi et
al, 2016 |
| Addis et al,
2013; Chen et al, 2015 | HAND2 | HAND2 | HAND1 | HAND2 | HAND2 | NKX2.5, 4 | Increased
efficiency of CM expression markers (50,52) |
| Xiang et al,
2016; Chakraborry et al, 2012 | ESRRG | ESRRG | CSDC2 | HAND1 | ESRRG | TBX20, 4 | Implicated in CM
proliferation and cardiac function in mice (48,49) |
| Fu et al,
2013 | NKX2.5 | NKX2.5 | NKX2.5 | TFDP3 | CSDC2 | ESRRG, 4 | Improved CM
phenotype (51) |
| Kamaraj et
al, 2016 | CSDC2 | CSDC2 | HAND2 | POU1F1 | NKX2.5 | HEY2, 4 | aComputational prediction
(55) |
| Rastegar-Pouyani
et al, 2017 | PROX1 | PROX1 | ESRRG | E2F8 | PROX1 | TCF21, 4 | aComputational prediction in
humans (54) |
| Kamaraj et
al, 2016 | TCF21 | TCF21 | PROX1 | HNF4G | TCF21 | GATA6, 4 | aComputational prediction
(55) |
|
| HEY2 | HEY2 | HEY2 | ZNF20 | HEY2 | CSDC2, 4 | bHighly expressed in the
heart |
| Risebro et
al, 2009 | GATA6 | GATA6 | NPAS2 | NR1H4 | GATA6 | PROX1, 4 | Muscle structure
maintenance (57) |
| Kamaraj et
al, 2016 | NR0B2 | NR0B2 | TEAD2 | RFX6 | NR0B2 | EBF2, 4 | aComputational prediction
(55) |
| Liu et al,
2017 | EBF2 | EBF2 | PPARA | CDX4 | EBF2 | MEIS2, 4 | May be important in
CM (58) |
| Rastegar-Pouyani
et al, 2017 | IRX3 | IRX3 | MEIS2 | ESX1 | ID4 | TEAD2, 4 | aSimilar computational prediction
(54) |
|
| ETV1 | ETV1 | EBF2 | ZFP42 | IRX3 | EBF3, 3 | a |
| Shekhar et
al, 2016 | MEIS2 | MEIS2 | TCF21 | X.2878 | ETV1 | ETV1, 3 | Involved in rapid
impulse conduction (59) |
|
| TEAD2 | TEAD2 | TEAD1 | SRY | MEIS2 | IRF6, 3 | a |
| Koizumi et
al, 2016 | IRF6 | IRF6 | IRX4 | FOXR2 | TEAD2 | IRX3, 3 | Involved in cardiac
rhythm (60) |
| Nam et al,
2014 | EBF3 | EBF3 | EBF3 | RFX8 | IRF6 | NR0B2, 3 | Involved in cardiac
hypertrophy (61) |
Estimation of target cell state TFs via
different approaches in a novel system
To provide a practical and simple way to reproduce
an example and a comparison of different approaches as a starting
point, corneal endothelial cells (CEC) were used as a target cell
type. The tools and data available (Mogrify, CellNet and the
D'Alessio et al supplementary information) did not include
CEC and therefore were not used. As the datasets represented in
these tools are limited, this example represents a likely scenario
for specific cell types. Re-implemented scores inspired by the
revised methods and the pre-candidate lists are compared. This
demonstrates that the first two steps are highly useful and
relatively easy to implement. Subsequently, data are processed in R
(cran.r-project.org). The scripts and the
data required to reproduce the results are available in
bioinformatica.mty.itesm.mx/CEC-TF-Example.
Target and non-target datasets
The target CEC data were obtained from GEO/NCBI with
accession no. GSE58315 (62). The
dataset consisted of 11 corneal endothelial cell samples from
adults, adolescents and preschoolers. The non-target dataset was
obtained from a preliminary study on gene co-expression networks
(63). This dataset consisted of
445 samples representing >136 tissues from the two most popular
Affymetrix platforms (HG-U133) extracted from the GEO/NCBI. The
number of probes was >50,000; however, due to the different
versions of Affymetrix microarrays, certain samples provided data
for only 22,000 probes.
Data pre-processing
The two datasets were quantile normalized and scaled
to a uniform distribution between 0 and 1, representing no
expression and maximum expression. For the non-target dataset, the
JetSet package was used to identify a representative probe for each
gene (64). To recognize TFs, the
Affymetrix annotation of the platform GPL570 was used to look for
‘transcription’ and ‘factor’ in the annotated description.
Additionally, the TFs annotated in AnimalTFDB were used (47). Thus, 1,478 TFs were considered. The
target and the non-target datasets along with tissue annotation are
available in bioinformatica.mty.itesm.mx/CEC-TF-Example. For the
target dataset and duplicated probes per gene, the probe whose
standard deviation was highest was selected. Only the 16,098 genes
matching in the two datasets (by gene symbol) were used, of which
1,408 were annotated as TFs.
Score implementations
A total of five scores were used, as demonstrated in
the aforementioned cardiomyocyte analysis.
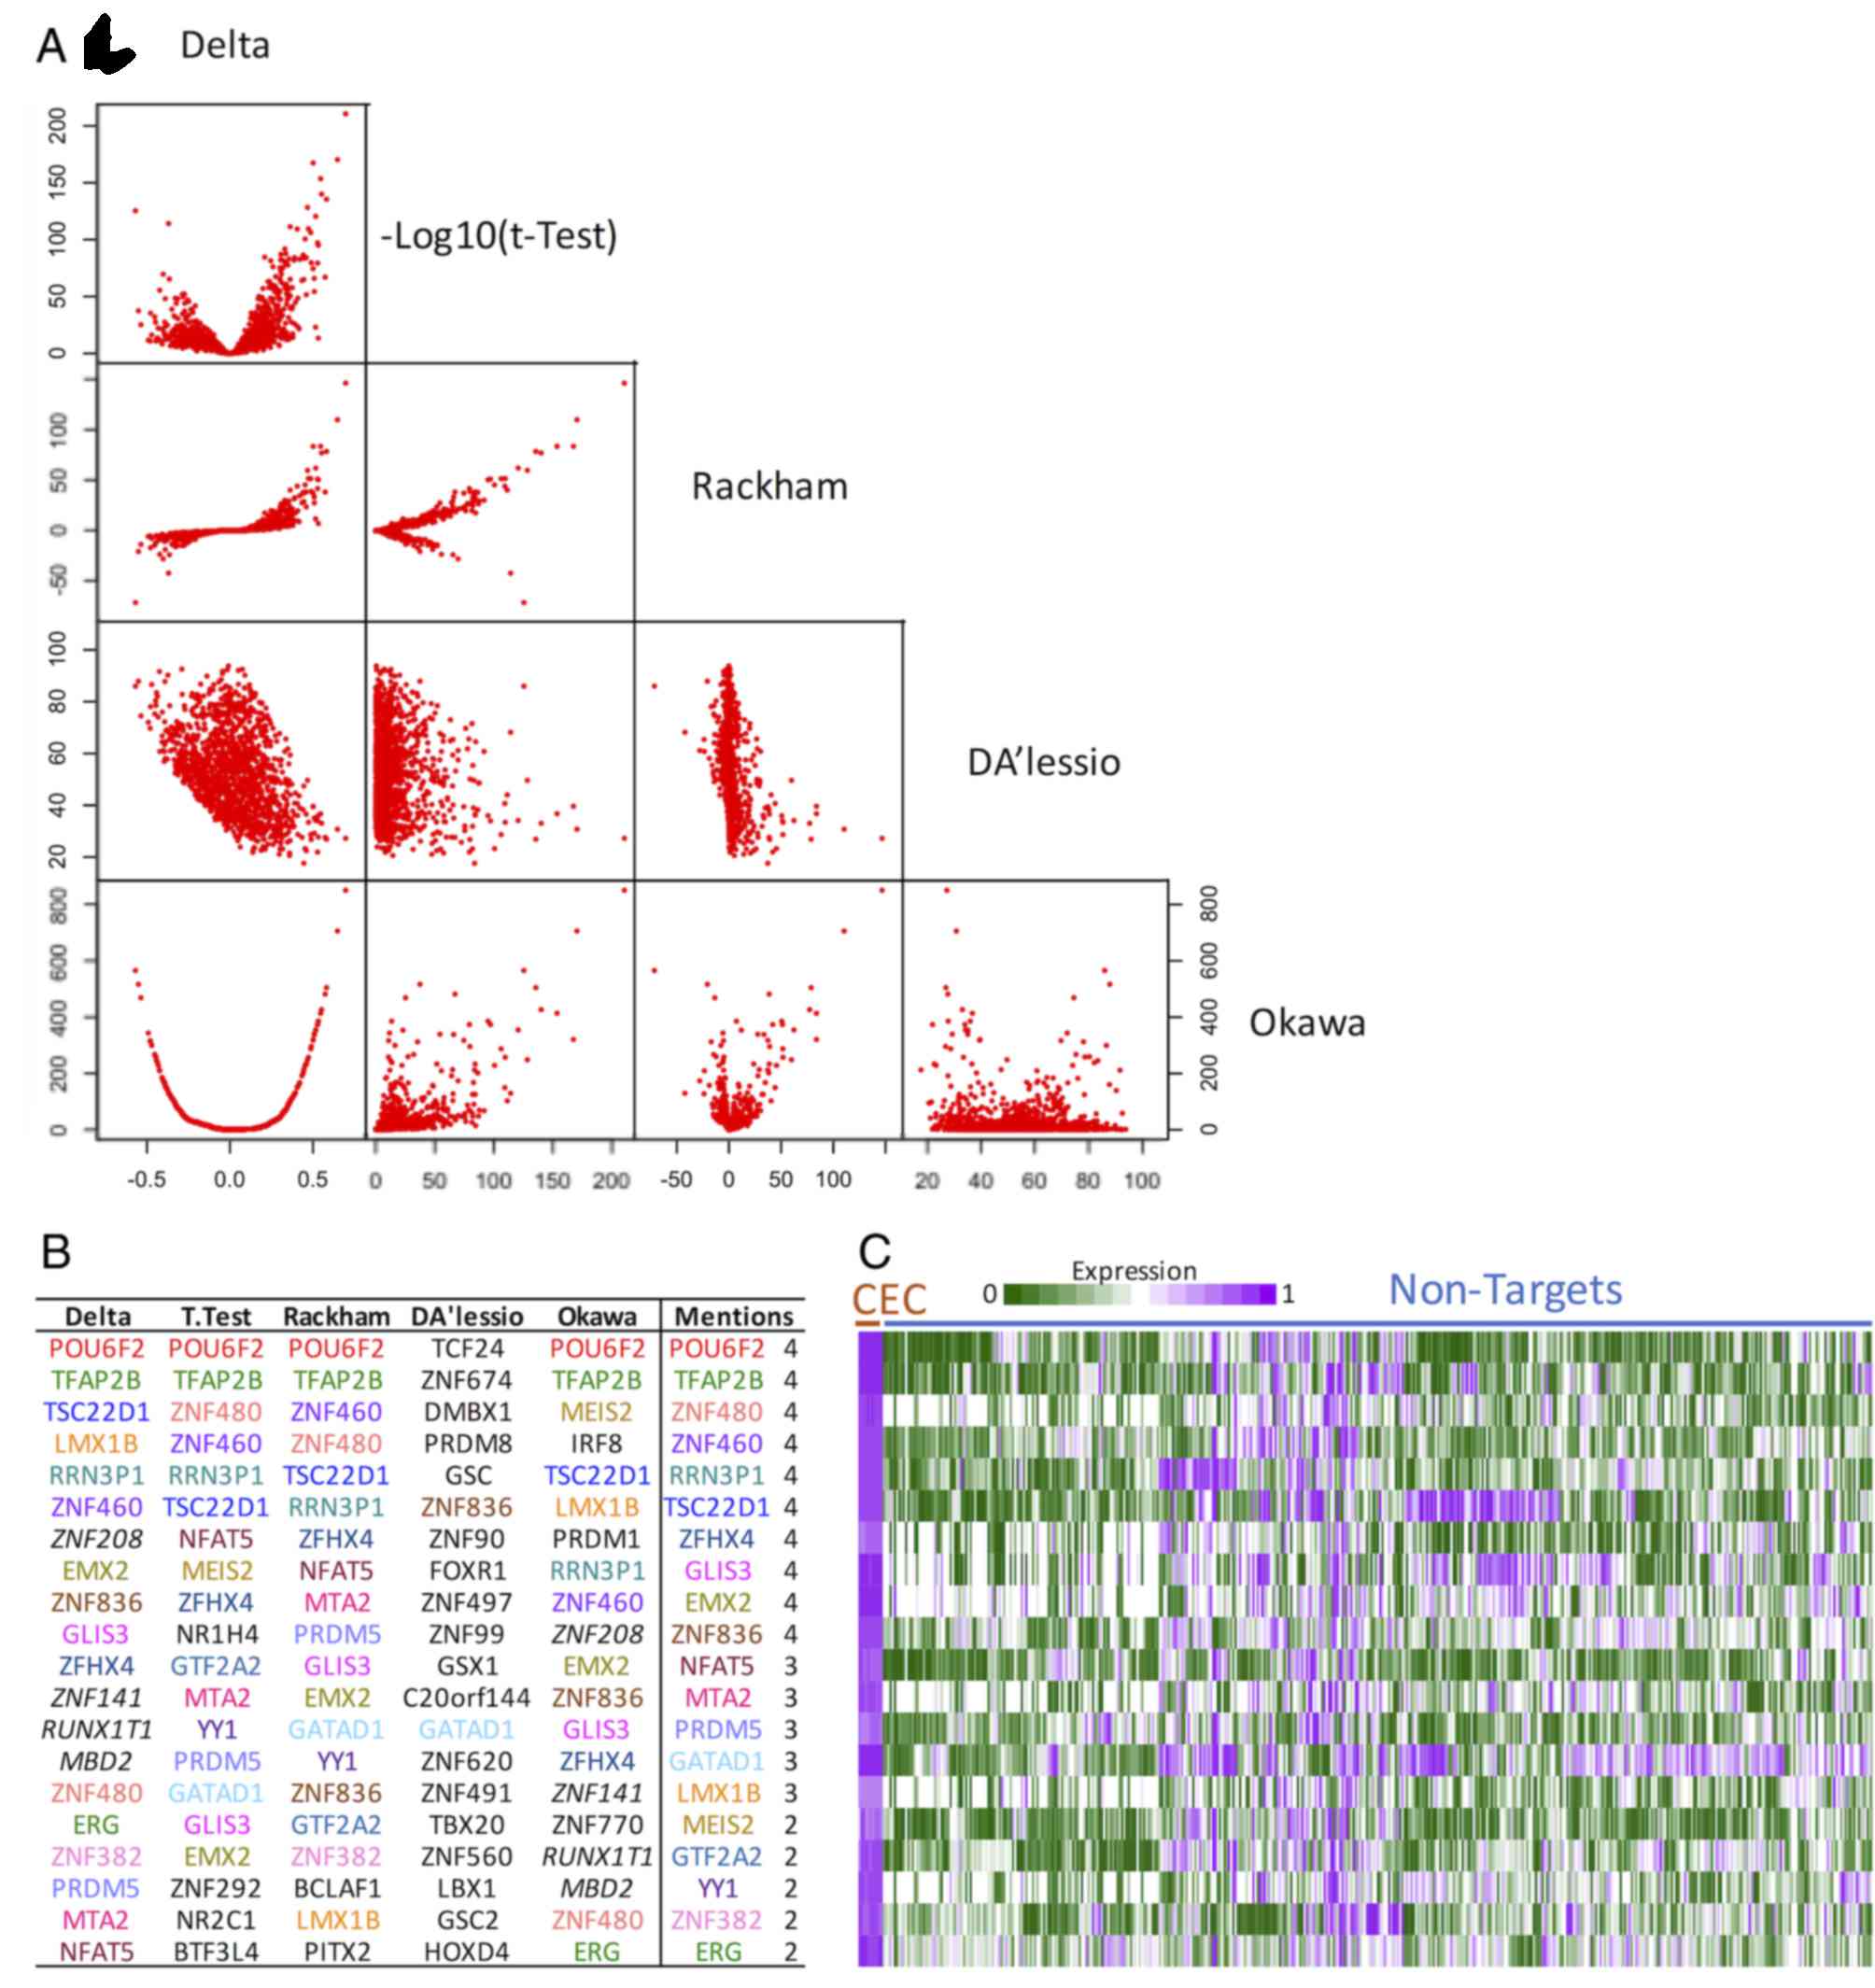
Comparison of resultant scores
Whether the re-implemented scores were similar to
each other was investigated. Fig.
5A illustrates the results for the 1,408 annotated TFs. It is
clear that Delta, a measure of differences in the averages
between target and non-target expression, correlated with all other
scores. Rackham, as expected, was associated with t-test
(Delta and t-test are part of the calculation).
D'Alessio was negatively correlated with Delta,
although highly variable (lower D'Alessio scores tended to
be similar to high Delta scores). The Okawa score
seemed to be a proxy of Delta irrespective of the sign.
Overall, these results suggested that the scores are associated
with differential expression, supporting the summarized view.
Comparison of the generated TF list of
pre-candidates
To demonstrate an overview of the top selected genes
per score, the TF identity of the top 20 TFs was investigated
(Fig. 5B). It is clear that, apart
from D'Alessio, the majority of the genes were frequently in
the top TFs, irrespective of the score. In Delta and t-test,
there was no selection for overexpressed genes and therefore some
underexpressed TFs appeared, including meis homeobox 2
(MEIS2) and zinc finger protein 208. Similarly, in
Okawa, the metric implemented did not favor overexpression
in the target and certain genes appeared to be underexpressed,
including interferon regulatory factor 8 and MEIS2 (the
script available was commented so as to be able to alter this
easily). The lack of similarity of the D'Alessio TFs (2 out
of 20) reflected the inappropriate implementation or deficiencies
in providing details for reproduction.
Specificity of TF expression
Fig. 5C
demonstrates the expression of the 20 most frequent TFs, as listed
in the column Mentions in Fig.
5B. It is clear that the expression of all TFs was high in CEC.
Subsets of these genes, however, exhibited high expression in other
cell types. This result suggested a highly specific profile for
CEC. Lim homeobox transcription factor 1β, for instance, is
essential for the correct development of the cornea and other eye
structures in mice (65), POU
class 6 homeobox 2 is required for retinal regeneration in
zebrafish (66), transcription
factor AP-2β has been demonstrated to control differentiated CEC
markers (67), TSC22 domain family
member 1 is downregulated in dry eye syndrome (68), and GLIS family zinc finger 3 has
been associated with glaucoma (69). This small literature analysis
suggests that the observed list of TFs is important in CEC. To
select more specific TFs, however, it is necessary to perform a
network analysis (summarized in Fig.
4), literature revision, comparison of this profile with the
source cell type, and analysis of the gene expression levels of
these TFs and other differentially expressed genes (non-TF
genes).
Conclusions
In conclusion, there is a requirement for specific
cell types in regenerative medicine and biological research. An
interesting proposal is the direct conversion of easy-to-obtain
cells, which requires a specific cocktail of TFs to induce
alterations in the cell state. Despite the complexity of the
computational methods proposed for this task, it was demonstrated
that the strategies to identify the TFs involved in the molecular
state maintenance of a cell type are relatively simple: i) Define
cell populations representing diverse cell types; ii) identify
differences in TF expression; and iii) apply rules to remove
unlikely TFs. The present review reported that the principal
complexity in the computational methods is the third of these
points. It was demonstrated in a well-known cardiomyocyte example
and a novel corneal endothelial cell example that applying the
first two easy-to-implement ideas is likely to provide useful
results, which may provide important insights and a starting point
for laboratory assays. The present review may additionally inspire
novel computational methods to identify TFs associated with cell
identity and direct cell conversions.
Acknowledgements
Not applicable.
Funding
The present study was funded by CONACyT Ciencia
Básica (grant no. 255747) and the Grupos de Investigación con
Enfoque Estratégico en Bioinformática para el Diagnóstico Clínico
from Tecnológico de Monterrey including a scholarship for GIGR and
sponsorship of JFIC.
Availability of data and materials
The datasets generated and/or analyzed during the
current study are available from: http://bioinformatica.mty.itesm.mx/CEC-TF-Example.
Authors' contributions
GIGR, CMVC, JFIC and VT made analyses of particular
methods and participated in the overall conceptualization. GIGR
selected and preprocessed the gene expression omnibus data. GIGR,
CMVC and JFIC drafted the initial manuscript. VT conceptualized and
supervised the study, wrote the R scripts and performed the
computational analyses. GIGR and VT participated in writing the
final manuscript. All authors read and approved the final
manuscript.
Ethics approval and consent to
participate
Not applicable.
Consent for publication
Not applicable.
Competing interests
The authors declare that they have no competing
interests.
References
|
1
|
Meguid Abdel E, Ke Y, Ji J and El-Hashash
AHK: Stem cells applications in bone and tooth repair and
regeneration: New insights, tools and hopes. J Cell Physiol.
233:1825–1835. 2018. View Article : Google Scholar : PubMed/NCBI
|
|
2
|
Tabar V and Studer L: Pluripotent stem
cells in regenerative medicine: Challenges and recent progress. Nat
Rev Genet. 15:82–92. 2014. View Article : Google Scholar : PubMed/NCBI
|
|
3
|
Valdez-Garcia JE, Zavala J and Trevino V:
Current state and future perspectives in corneal endothelium
differentiationFrontiers in Stem Cell and Regenerative Medicine
Research. Atta-ur-Rahman and Anjum S: Bentham: 2017, View Article : Google Scholar
|
|
4
|
Mora C, Serzanti M, Consiglio A, Memo M
and Dell'Era P: Clinical potentials of human pluripotent stem
cells. Cell Biol Toxicol. 33:351–360. 2017. View Article : Google Scholar : PubMed/NCBI
|
|
5
|
López-González R and Velasco I:
Therapeutic potential of motor neurons differentiated from
embryonic stem cells and induced pluripotent stem cells. Arch Med
Res. 43:1–10. 2012. View Article : Google Scholar : PubMed/NCBI
|
|
6
|
Lizio M, Harshbarger J, Shimoji H, Severin
J, Kasukawa T, Sahin S, Abugessaisa I, Fukuda S, Hori F,
Ishikawa-Kato S, et al: Gateways to the FANTOM5 promoter level
mammalian expression atlas. Genome Biol. 16:222015. View Article : Google Scholar : PubMed/NCBI
|
|
7
|
Li M and Belmonte JC: Ground rules of the
pluripotency gene regulatory network. Nat Rev Genet. 18:180–191.
2017. View Article : Google Scholar : PubMed/NCBI
|
|
8
|
Takahashi K and Yamanaka S: Induction of
pluripotent stem cells from mouse embryonic and adult fibroblast
cultures by defined factors. Cell. 126:663–676. 2006. View Article : Google Scholar : PubMed/NCBI
|
|
9
|
Li M, Liu G and Belmonte Izpisua JC:
Navigating the epigenetic landscape of pluripotent stem cells. Nat
Rev Mol Cell Biol. 13:524–535. 2012. View Article : Google Scholar : PubMed/NCBI
|
|
10
|
Moris N, Pina C and Arias AM: Transition
states and cell fate decisions in epigenetic landscapes. Nat Rev
Genet. 17:693–703. 2016. View Article : Google Scholar : PubMed/NCBI
|
|
11
|
Vaquerizas JM, Kummerfeld SK, Teichmann SA
and Luscombe NM: A census of human transcription factors: Function,
expression and evolution. Nat Rev Genet. 10:252–263. 2009.
View Article : Google Scholar : PubMed/NCBI
|
|
12
|
Frum T and Ralston A: Cell signaling and
transcription factors regulating cell fate during formation of the
mouse blastocyst. Trends Genet. 31:402–410. 2015. View Article : Google Scholar : PubMed/NCBI
|
|
13
|
Morris SA: Direct lineage reprogramming
via pioneer factors; a detour through developmental gene regulatory
networks. Development. 143:2696–2705. 2016. View Article : Google Scholar : PubMed/NCBI
|
|
14
|
Iwafuchi-Doi M and Zaret KS: Cell fate
control by pioneer transcription factors. Development.
143:1833–1837. 2016. View Article : Google Scholar : PubMed/NCBI
|
|
15
|
Takahashi K, Tanabe K, Ohnuki M, Narita M,
Ichisaka T, Tomoda K and Yamanaka S: Induction of pluripotent stem
cells from adult human fibroblasts by defined factors. Cell.
131:861–872. 2007. View Article : Google Scholar : PubMed/NCBI
|
|
16
|
Vierbuchen T, Ostermeier A, Pang ZP,
Kokubu Y, Südhof TC and Wernig M: Direct conversion of fibroblasts
to functional neurons by defined factors. Nature. 463:1035–1041.
2010. View Article : Google Scholar : PubMed/NCBI
|
|
17
|
Ieda M, Fu JD, Delgado-Olguin P, Vedantham
V, Hayashi Y, Bruneau BG and Srivastava D: Direct reprogramming of
fibroblasts into functional cardiomyocytes by defined factors.
Cell. 142:375–386. 2010. View Article : Google Scholar : PubMed/NCBI
|
|
18
|
Protze S, Khattak S, Poulet C, Lindemann
D, Tanaka EM and Ravens U: A new approach to transcription factor
screening for reprogramming of fibroblasts to cardiomyocyte-like
cells. J Mol Cell Cardiol. 53:323–332. 2012. View Article : Google Scholar : PubMed/NCBI
|
|
19
|
Bonilla-Porras AR, Velez-Pardo C and
Jimenez-Del-Rio M: Fast transdifferentiation of human Wharton's
jelly mesenchymal stem cells into neurospheres and nerve-like
cells. J Neurosci Methods. 282:52–60. 2017. View Article : Google Scholar : PubMed/NCBI
|
|
20
|
Abad M, Hashimoto H, Zhou H, Morales MG,
Chen B, Bassel-Duby R and Olson EN: Notch inhibition enhances
cardiac reprogramming by increasing MEF2C transcriptional activity.
Stem Cell Rep. 8:548–560. 2017. View Article : Google Scholar
|
|
21
|
Islas JF, Liu Y, Weng KC, Robertson MJ,
Zhang S, Prejusa A, Harger J, Tikhomirova D, Chopra M, Iyer D, et
al: Transcription factors ETS2 and MESP1 transdifferentiate human
dermal fibroblasts into cardiac progenitors. Proc Natl Acad Sci
USA. 109:13016–13021. 2012. View Article : Google Scholar : PubMed/NCBI
|
|
22
|
Waddington CH: The strategy of the genes.
Routledge: 1957
|
|
23
|
Cahan P, Li H, Morris SA, Da Rocha
Lummertz E, Daley GQ and Collins JJ: CellNet: Network biology
applied to stem cell engineering. Cell. 158:903–915. 2014.
View Article : Google Scholar : PubMed/NCBI
|
|
24
|
D'Alessio AC, Fan ZP, Wert KJ, Baranov P,
Cohen MA, Saini JS, Cohick E, Charniga C, Dadon D, Hannett NM, et
al: A systematic approach to identify candidate transcription
factors that control cell identity. Stem Cell Reports. 5:763–775.
2015. View Article : Google Scholar : PubMed/NCBI
|
|
25
|
Rackham OJL, Firas J, Fang H, Oates ME,
Holmes ML and Knaupp AS: FANTOM Consortium, Suzuki H, Nefzger CM,
Daub CO, et al: A predictive computational framework for
direct reprogramming between human cell types. Nat Genet.
48:331–335. 2016. View Article : Google Scholar : PubMed/NCBI
|
|
26
|
Okawa S, Nicklas S, Zickenrott S,
Schwamborn JC and Del Sol A: A generalized gene-regulatory network
model of stem cell differentiation for predicting lineage
specifiers. Stem Cell Rep. 7:307–315. 2016. View Article : Google Scholar
|
|
27
|
Barrett T, Suzek TO, Troup DB, Wilhite SE,
Ngau WC, Ledoux P, Rudnev D, Lash AE, Fujibuchi W and Edgar R: NCBI
GEO: Mining millions of expression profiles-database and tools.
Nucleic Acids Res. 33:(Database Issue). D562–D566. 2005. View Article : Google Scholar : PubMed/NCBI
|
|
28
|
Barrett T, Wilhite SE, Ledoux P,
Evangelista C, Kim IF, Tomashevsky M, Marshall KA, Phillippy KH,
Sherman PM, Holko M, et al: NCBI GEO: Archive for functional
genomics data sets-update. Nucleic Acids Res. 41:(Database Issue).
D991–D995. 2013. View Article : Google Scholar : PubMed/NCBI
|
|
29
|
Parkinson H, Kapushesky M, Shojatalab M,
Abeygunawardena N, Coulson R, Farne A, Holloway E, Kolesnykov N,
Lilja P, Lukk M, et al: ArrayExpress-a public database of
microarray experiments and gene expression profiles. Nucleic Acids
Res. 35:(Database Issue). D747–D750. 2007. View Article : Google Scholar : PubMed/NCBI
|
|
30
|
Kolesnikov N, Hastings E, Keays M,
Melnichuk O, Tang YA, Williams E, Dylag M, Kurbatova N, Brandizi M,
Burdett T, et al: ArrayExpress update-simplifying data submissions.
Nucleic Acids Res. 43:(Database Issue). D1113–D1116. 2015.
View Article : Google Scholar : PubMed/NCBI
|
|
31
|
Rosenbloom KR, Sloan CA, Malladi VS,
Dreszer TR, Learned K, Kirkup VM, Wong MC, Maddren M, Fang R,
Heitner SG, et al: ENCODE Data in the UCSC genome browser: Year 5
update. Nucleic Acids Res. 41:(Database Issue). D56–D63. 2013.
View Article : Google Scholar : PubMed/NCBI
|
|
32
|
Kim SY, Lee JW and Sohn IS: Comparison of
various statistical methods for identifying differential gene
expression in replicated microarray data. Stat Methods Med Res.
15:3–20. 2006. View Article : Google Scholar : PubMed/NCBI
|
|
33
|
Huang HC, Niu Y and Qin LX: Differential
expression analysis for RNA-Seq: An overview of statistical methods
and computational software. Cancer Inform. 14 Suppl 1:S57–S67.
2015.
|
|
34
|
Seyednasrollah F, Laiho A and Elo LL:
Comparison of software packages for detecting differential
expression in RNA-seq studies. Brief Bioinform. 16:59–70. 2013.
View Article : Google Scholar : PubMed/NCBI
|
|
35
|
Sullivan GM and Feinn R: Using effect
size-or why the P value is not enough. J Grad Med Educ. 4:279–282.
2012. View Article : Google Scholar : PubMed/NCBI
|
|
36
|
Huang S, Guo YP, May G and Enver T:
Bifurcation dynamics in lineage-commitment in bipotent progenitor
cells. Dev Biol. 305:695–713. 2007. View Article : Google Scholar : PubMed/NCBI
|
|
37
|
Jacob F and Monod J: Genetic regulatory
mechanisms in the synthesis of proteins. J Mol Biol. 3:318–356.
1961. View Article : Google Scholar : PubMed/NCBI
|
|
38
|
Roeder I and Glauche I: Towards an
understanding of lineage specification in hematopoietic stem cells:
A mathematical model for the interaction of transcription factors
GATA-1 and PU.1. J Theor Biol. 241:852–865. 2006. View Article : Google Scholar : PubMed/NCBI
|
|
39
|
Faith JJ, Hayete B, Thaden JT, Mogno I,
Wierzbowski J, Cottarel G, Kasif S, Collins JJ and Gardner TS:
Large-scale mapping and validation of escherichia coli
transcriptional regulation from a compendium of expression
profiles. PLoS Biol. 5:e82007. View Article : Google Scholar : PubMed/NCBI
|
|
40
|
Rosvall M and Bergstrom CT: Maps of random
walks on complex networks reveal community structure. Proc Natl
Acad Sci USA. 105:1118–1123. 2008. View Article : Google Scholar : PubMed/NCBI
|
|
41
|
Subramanian A, Tamayo P, Mootha VK,
Mukherjee S, Ebert BL, Gillette MA, Paulovich A, Pomeroy SL, Golub
TR, Lander ES and Mesirov JP: Gene set enrichment analysis: A
knowledge-based approach for interpreting genome-wide expression
profiles. Proc Natl Acad Sci USA. 102:15545–15550. 2005. View Article : Google Scholar : PubMed/NCBI
|
|
42
|
FANTOM Consortium H, . Suzuki H, Forrest
AR, van Nimwegen E, Daub CO, Balwierz PJ, Irvine KM, Lassmann T,
Ravasi T, Hasegawa Y, et al: The transcriptional network that
controls growth arrest and differentiation in a human myeloid
leukemia cell line. Nat Genet. 41:553–562. 2009. View Article : Google Scholar : PubMed/NCBI
|
|
43
|
Szklarczyk D, Franceschini A, Wyder S,
Forslund K, Heller D, Huerta-Cepas J, Simonovic M, Roth A, Santos
A, Tsafou KP, et al: STRING v10: Protein-protein interaction
networks, integrated over the tree of life. Nucleic Acids Res.
43:(Database Issue). D447–D452. 2015. View Article : Google Scholar : PubMed/NCBI
|
|
44
|
Nikolsky Y, Ekins S, Nikolskaya T and
Bugrim A: A novel method for generation of signature networks as
biomarkers from complex high throughput data. Toxicol Lett.
158:20–29. 2005. View Article : Google Scholar : PubMed/NCBI
|
|
45
|
Crespo I and Del Sol A: A general strategy
for cellular reprogramming: The importance of transcription factor
cross-repression. Stem Cells. 31:2127–2135. 2013. View Article : Google Scholar : PubMed/NCBI
|
|
46
|
Kauffman SA: Homeostasis and
differentiation in random genetic control networks. Nature.
224:177–178. 1969. View Article : Google Scholar : PubMed/NCBI
|
|
47
|
Zhang HM, Liu T, Liu CJ, Song S, Zhang X,
Liu W, Jia H, Xue Y and Guo AY: AnimalTFDB 2.0: A resource for
expression, prediction and functional study of animal transcription
factors. Nucleic Acids Res. 43:(Database Issue). D76–D81. 2015.
View Article : Google Scholar : PubMed/NCBI
|
|
48
|
Xiang FL, Guo M and Yutzey KE:
Overexpression of Tbx20 in adult cardiomyocytes promotes
proliferation and improves cardiac function after myocardial
infarction. Circulation. 133:1081–1092. 2016. View Article : Google Scholar : PubMed/NCBI
|
|
49
|
Chakraborty S and Yutzey KE: Tbx20
regulation of cardiac cell proliferation and lineage specialization
during embryonic and fetal development in vivo. Dev Biol.
363:234–246. 2012. View Article : Google Scholar : PubMed/NCBI
|
|
50
|
Addis RC, Ifkovits JL, Pinto F, Kellam LD,
Esteso P, Rentschler S, Christoforou N, Epstein JA and Gearhart JD:
Optimization of direct fibroblast reprogramming to cardiomyocytes
using calcium activity as a functional measure of success. J Mol
Cell Cardiol. 60:97–106. 2013. View Article : Google Scholar : PubMed/NCBI
|
|
51
|
Fu JD, Stone NR, Liu L, Spencer CI, Qian
L, Hayashi Y, Delgado-Olguin P, Ding S, Bruneau BG and Srivastava
D: Direct reprogramming of human fibroblasts toward a
cardiomyocyte-like state. Stem Cell Reports. 1:235–247. 2013.
View Article : Google Scholar : PubMed/NCBI
|
|
52
|
Chen O and Qian L: Direct cardiac
reprogramming: Advances in cardiac regeneration. Biomed Res Int.
2015:5804062015.PubMed/NCBI
|
|
53
|
Ieda M, Tsuchihashi T, Ivey KN, Ross RS,
Hong TT, Shaw RM and Srivastava D: Cardiac fibroblasts regulate
myocardial proliferation through beta1 integrin signaling. Dev
Cell. 16:233–244. 2009. View Article : Google Scholar : PubMed/NCBI
|
|
54
|
Rastegar-Pouyani S, Khazaei N, Wee P,
Yaqubi M and Mohammadnia A: Meta-analysis of transcriptome
regulation during induction to cardiac myocyte fate from mouse and
human fibroblasts. J Cell Physiol. 232:2053–2062. 2017. View Article : Google Scholar : PubMed/NCBI
|
|
55
|
Kamaraj US, Gough J, Polo JM, Petretto E
and Rackham OJ: Computational methods for direct cell conversion.
Cell Cycle. 15:3343–3354. 2016. View Article : Google Scholar : PubMed/NCBI
|
|
56
|
Ebrahimi B: Biological computational
approaches: New hopes to improve (re)programming robustness,
regenerative medicine and cancer therapeutics. Differentiation.
92:35–40. 2016. View Article : Google Scholar : PubMed/NCBI
|
|
57
|
Risebro CA, Searles RG, Melville AA, Ehler
E, Jina N, Shah S, Pallas J, Hubank M, Dillard M, Harvey NL, et al:
Prox1 maintains muscle structure and growth in the developing
heart. Development. 136:495–505. 2009. View Article : Google Scholar : PubMed/NCBI
|
|
58
|
Liu Q, Jiang C, Xu J, Zhao MT, Van Bortle
K, Cheng X, Wang G, Chang HY, Wu JC and Snyder MP: Genome-wide
temporal profiling of transcriptome and open chromatin of early
cardiomyocyte differentiation derived from hiPSCs and hESCs. Circ
Res. 121:376–391. 2017. View Article : Google Scholar : PubMed/NCBI
|
|
59
|
Shekhar A, Lin X, Liu FY, Zhang J, Mo H,
Bastarache L, Denny JC, Cox NJ, Delmar M, Roden DM, et al:
Transcription factor ETV1 is essential for rapid conduction in the
heart. J Clin Invest. 126:4444–4459. 2016. View Article : Google Scholar : PubMed/NCBI
|
|
60
|
Koizumi A, Sasano T, Kimura W, Miyamoto Y,
Aiba T, Ishikawa T, Nogami A, Fukamizu S, Sakurada H, Takahashi Y,
et al: Genetic defects in a His-Purkinje system transcription
factor, IRX3, cause lethal cardiac arrhythmias. Eur Heart J.
37:1469–1475. 2016. View Article : Google Scholar : PubMed/NCBI
|
|
61
|
Nam YS, Kim Y, Joung H, Kwon DH, Choe N,
Min HK, Kim YS, Kim HS, Kim DK, Cho YK, et al: Small heterodimer
partner blocks cardiac hypertrophy by interfering with GATA6
signaling. Circ Res. 115:493–503. 2014. View Article : Google Scholar : PubMed/NCBI
|
|
62
|
Frausto RF, Wang C and Aldave AJ:
Transcriptome analysis of the human corneal endothelium. Invest
Ophthalmol Vis Sci. 55:7821–7830. 2014. View Article : Google Scholar : PubMed/NCBI
|
|
63
|
Trevino V: Chi-Co-Express: A database of
human co-expression networks from global cell states. Manuscr Prep.
2017.
|
|
64
|
Li Q, Birkbak NJ, Gyorffy B, Szallasi Z
and Eklund AC: Jetset: Selecting the optimal microarray probe set
to represent a gene. BMC Bioinformatics. 12:4742011. View Article : Google Scholar : PubMed/NCBI
|
|
65
|
Pressman CL, Chen H and Johnson RL: LMX1B,
a LIM homeodomain class transcription factor, is necessary for
normal development of multiple tissues in the anterior segment of
the murine eye. Genesis. 26:15–25. 2000. View Article : Google Scholar : PubMed/NCBI
|
|
66
|
Powell C, Cornblath E and Goldman D:
Zinc-binding domain-dependent, deaminase-independent actions of
apolipoprotein B mRNA-editing enzyme, catalytic polypeptide 2
(Apobec2), mediate its effect on zebrafish retina regeneration. J
Biol Chem. 289:28924–28941. 2014. View Article : Google Scholar : PubMed/NCBI
|
|
67
|
Chen L, Martino V, Dombkowski A, Williams
T, West-Mays J and Gage PJ: AP-2β is a downstream effector of PITX2
required to specify endothelium and establish angiogenic privilege
during corneal development. Invest Opthalmol Vis Sci. 57:1072–1081.
2016. View Article : Google Scholar
|
|
68
|
Bradley JL, Edwards CS and Fullard RJ:
Adaptation of impression cytology to enable conjunctival surface
cell transcriptome analysis. Curr Eye Res. 39:31–41. 2014.
View Article : Google Scholar : PubMed/NCBI
|
|
69
|
Khor CC, Do T, Jia H, Nakano M, George R,
Abu-Amero K, Duvesh R, Chen LJ, Li Z, Nongpiur ME, et al:
Genome-wide association study identifies five new susceptibility
loci for primary angle closure glaucoma. Nat Genet. 48:556–562.
2016. View Article : Google Scholar : PubMed/NCBI
|