Introduction
Breast cancer is, although diagnosis and treatment
improved a lot in the past years still the most frequent malignancy
and causes the most cancer-related death in women worldwide.
Thereby it is not the primary tumor itself, which is deathly, but
the outgrowth of remote metastases, devastating vital organs. The
mechanisms leading to metastasis formation had been investigated
and described in detail (1):
Single tumor cells detach from the primary tumor mass, enter blood
vessels and travel throughout the body via blood stream. When they
leave circulation, they can settle in remote spaces of the body and
are considered to be the seed for metastatic outgrowth (2). As long as these detached cells are in
the blood they are called circulating tumor cells (CTCs) (3–5), but
if these CTCs manage to invade bone marrow, they turn to be ‘DTCs’,
disseminated tumor cells, which can even form tumor reservoirs
within the bone marrow (6–10). It had been shown, that the
occurrence of CTCs/DTCs strongly influences patients' prognosis
towards a worse outcome (5,10–12).
The most important step in the formation of
CTCs/DTCs is a process called epithelial to mesenchymal transition
(EMT). During EMT the epithelial tumor cells change their
phenotypical characteristics like cell adhesion and motility,
acquire invasiveness and loose epithelial markers (13–15).
At the end of the EMT process, it gets hard to recognize these
cells as tumor cells, because they adopt a mesenchymal-like
appearance (16,17). But the EMT process is reversible,
and as the cells leave the circulation to establish metastatic
outgrowth in a different organ, mesenchymal to epithelial
transition (MET) takes place (18–20).
Here we report a reverse transcription-quantitative
polymerase chain reaction (RT-qPCR) based approach for the
detection of CTCs from patient blood samples, using EMT-associated
genes as PCR targets. The genes, which are described in the
following get upregulated, when EMT process is started, but are not
upregulated in normal mesenchymal cells like blood cells, so they
can be detected by RT-qPCR even in a background of white blood
cells (for this reason Vimentin, which is a frequently described
EMT-marker was not included in our analysis, as it is also
upregulated in normal blood cells). We decided to concentrate on
the following genes: Cytokeratin 19, which is also used in the
immunohistochemical detection of cancer cells (APAAP-staining)
(21,22) and is a marker for shorter disease
free survival and reduced overall survival in breast cancer
patients (23–26). Furthermore it is especially
expressed in metastatic breast cancer cells (27,28)
and was already used as a biomarker for CTCs in the blood of breast
cancer patients (29). Furthermore
CK19 was shown to be expressed in CTCs from early and metastatic
breast cancer patients, together with the EMT-markers Twist and
Vimentin (30), so it could be
concluded, that this epithelial marker is not downregulated by EMT.
Snail is a zinc-finger domain transcription factor, which is known
to trigger EMT by repression of E-cadherin expression (31–33).
It is upregulated in recurrent tumors (34), provokes loss of epithelial markers
(33) and is regarded as a marker
of metastatic potential (31).
Slug also represses E-cadherin expression (35), but snail and slug have a
non-equivalent role in EMT and need different cofactors for DNA
binding (36). Additionally, Snail
and Slug seem to have high expression levels in early and
metastatic breast cancer patients (30). FoxC2 is also a transcription factor
and is involved in tumor relapse and metastasis formation (37,38).
Slug and FoxC2 are in turn upregulated by snail and twist and are
another driving force for EMT (39). FoxC2 is induced during the EMT
process, promotes mesenchymal differentiation (40) and is also involved in angiogenesis
(41). Together with Twist, FoxC2
is associated with grading and a shorter time to recurrence
(38). Twist in turn regulates
cell migration, a knockdown results in reduced cell migration and
invasion (42), and EMT is induced
more moderately (43). Twist also
seems to play a role in metastasis formation (44) and is regulated by the Wnt/β-catenin
pathway (45). Snail and Twist are
regarded as inducers for EMT process, (39) are misregulated in breast cancer and
correlate with poor clinical outcomes (46,47).
Furthermore Twist upregulates the expression of the proto-oncogene
Akt2 (48). Akt2 in turn
upregulates integrin-expression (49), leading to an enhanced EMT-like
morphological conversion (50),
increased migration and invasion and resistance to Paclitaxel
(48). ALDH1, last but not least,
was described as marker for EMT, which has elevated expression
levels in breast cancer patients (46,51),
is a marker of stem cells and contributes to a poorer prognosis
(52). It is associated with a
larger tumor size, higher grading and the occurrence of lymph node
metastasis, and hence is related to a more aggressive phenotype and
a poorer prognosis (53–55). ALDH1, Twist and Akt2 were
especially found to be upregulated in a group of CTC-positive
breast cancer patients (56).
These genes were first analysed in an artificially
created model system: Blood samples from healthy donors were
withdrawn and breast cancer cell line cells (MCF-7 and MDA-MB231)
were added in certain amounts (0–1,000 cells/ml blood sample). The
samples were processed just like the patient samples and RT-qPCR
was carried out with all selected marker genes. The genes which
performed best in this model system were then used in the patients
RT-qPCR, so that precious patient material could be saved. The
genes for Cytokeratin 19 (CK19), Snail, FoxC2 and Twist were then
used to analyse 35 patient samples, which were selected randomly.
After analysis of the RT-qPCR experiments patient samples could be
divided into two subgroups: in the first group all genes were
downregulated, in the second group at least one gene had an
RQ-value greater than 1, meaning that the gene is upregulated. In
the comparison of the samples from the two groups it could be seen,
that the subgroup of only downregulated genes consisted of less
aggressive tumors while in the group, in which at least one of the
marker genes was upregulated, tumours had a more aggressive tumor
biology, what means, that RT-qPCR analysis of those 4 genes could
already give a hint towards tumor aggressiveness.
Materials and methods
Model system samples
As a model system blood samples from healthy donors
(all female, average age of 35 years) were withdrawn and processed
as described for the patient blood samples, but before addition of
TRIzol LS reagent (Invitrogen; ThermoFisher Scientific, Darmstadt,
Germany) a certain number (10/100/1,000 per ml blood sample) of
breast cancer cell line cells were added (both cell lines used were
added to the blood sample in equal parts). Breast cancer cell lines
which were used in the experiments were MCF-7 (ATCC: HTB-22) and
MDA-MB-231 (ATCC: HTB-26). The cells were subcultured as described
in the ATCC product sheet and counted with a Neubauer improved
counting chamber to determine exact amounts which had to be added
to the blood samples.
Patients
Written consent was received from 35 patients
included in the study and conformed to the declaration of Helsinki.
Furthermore, ethical approval was received from the ethics
committee of LMU Munich (Munich, Germany) (LMU 148–12). 20 ml blood
were withdrawn from each patient and processed as described.
RT-qPCR was performed on the patient samples and afterwards patient
samples could be divided in two subgroups depending on gene
expression values. Patient characteristics (as completely as
possible) are shown in Table
I.
 | Table I.Patient subgroups and tumor
characteristics. |
Table I.
Patient subgroups and tumor
characteristics.
| No. of sample | Age | Tumor size | Nodal state | Metasasis
state | Grading | ER state (%) | PR state (%) | Her2 state | Menopausal
state |
|---|
| 1 | 62 | pT1b (8 mm) | pN0 (0/1) | pMx | G1 | 80 | 60 | neg | post |
| 2 | 50 | pT1b (8 mm) | pN0 (0/5) | pMx | G1 | 80 | 95 | neg | pre |
| 3 | 73 | pT1c (13 mm) | pN0 (0/2) | pM0 | G1 | 99 | 99 | neg | post |
| 4 | 54 | pT1c (13 mm) | pN0 (0/3) | pMx | G1 | 100 | 100 | neg | climact |
| 5 | 72 | pT2 (35 mm) | pN1a (3/12) | pM0 | G1 | 90 | 90 | neg | post |
| 6 | 72 | cT1b (8,6) | pNx | pMx | G1 | 90 | 80 | neg | post |
| 7 | 82 | pT1b (7 mm) | pN0 (0/6) | pMx | G3 | 75 |
0 | pos | post |
| 8 | 67 | pT1b (8 mm) | pN0 (0/1) | pMx | G3 | 95 | 90 | neg | post |
| 9 | 48 | pT1b (9 mm) | pN0 (0/1) | pMx | G3 |
0 |
0 | neg | n.a. |
| 10 | 65 | pT1c | pN0 (0/3) | pMx | G3 | 85 | 85 | pos | n.a. |
| 11 | 73 | pT1c (14 mm) | pN0 (0/1) | pM0 | G3 | 80 | 80 | neg | post |
| 12 | 35 | pT1c (14 mm) | pN0 (0/4) | pMx | G3 | 10 | 10 | neg | pre |
| 13 | 65 | pT2 (34 mm) | pN1 (1/2) | pM0 | G3 | 99 | 15 | neg | post |
| 14 | 62 | pT1c (12 mm) | pN0 (0/3) | pMx | G2 | 100 | 100 | neg | n.a. |
| 15 | 48 | pT1c (14 mm) | pN0 (0/2) | pM0 | G2 | 95 | 95 | neg | pre |
| 16 | 60 | pT2 (22 mm) | pN0 (0/1) | pMx | G2 | 90 | 15 | n.a | post |
| 17 | 74 | pT3 | pN0 (0/8) | pM0 | G2 | 90 | 90 | neg | post |
| 18 | 49 | pT2 (28 mm) | pN1a (2/2) | pMx | G2 | 80 | 80 | neg | pre |
| 19 | 65 | pT1c | pN1a (2/19) | pMx | G3 | 100 | 33 | pos | n.a. |
| 20 | 52 | pT1c (19 mm) | pN0 (0/1) | pM0 | G3 |
0 |
0 | neg | post |
| 21 | 73 | pT2 (40 mm) | pN0 (0/4) | pMx | G2 | 75 | 85 | neg | n.a. |
| 22 | 84 | pT1b (8 mm) | pN1a (1/24) | pM0 | G2 | 90 | 90 | neg | n.a. |
| 23 | 64 | pT1c (12 mm) | pN1 (1/3) | pMx | G2 | 100 | 70 | neg | post |
| 24 | 50 | pT1c (14 mm) | pN1a (1/4) | pMx | G2 | 99 | 99 | neg | n.a. |
| 25 | 51 | pT1c (19 mm) | pN1a (1/1) | pMx | G2 | 90 | 90 | neg | pre |
| 26 | 65 | pT2 | pN1a (1/3) | pMx | G2 | 100 | 100 | neg | n.a. |
| 27 | 75 | pT3 (65 mm) | pN1a (3/3) | pM0 | G2 | 81 | 81 | neg | post |
| 28 | 60 | pT3 | pN1a (1/11) | pMx | G2-3 | 100 | 100 | neg | post |
| 29 | 57 | pT4b | pN2a (4/9) | pM1 | G3 |
0 |
0 | neg | n.a. |
| 30 | 54 | pT1c | pN0 (0/11) | pM1 | G3 | n.a. | n.a. | neg | post |
| 31 | 55 | pT1c | pN0 (0/11) | pM1 | G3 | n.a. | n.a. | neg | post |
| 32 | 84 | pT1b (8 mm) | pN1 (1/18) | pM1 | G3 | 70 | 80 | neg | post |
| 33 | 76 | pT3 (63 mm) | pN1a (2/7) | pM1 | n.a. | 90 | 40 | neg | post |
| 34 | 56 | pT2 (22 mm) | pN3c | pM1 | G3 | 90 | 20 | neg | post |
| 35 | 75 | pyT3 | pN1a (3/12) | pM1 | G2 | 99 |
0 | neg | post |
Blood samples
A total of 20 ml blood were withdrawn from each
patient and from some healthy volunteers and diluted with PBS to 30
ml. To enrich the leucocyte/CTC-fraction a density gradient
centrifugation was carried out. Therefore the blood samples were
layered onto 20 ml of Histopaque 1,077 (Invitrogen; ThermoFisher
Scientific) and centrifuged at 400 × g for 25 min at room
temperature. Afterwards the buffy coat was aspirated carefully,
transferred into a fresh tube and washed with PBS by centrifuging
at 250 × g for 10 min at 4°C. Supernatant was discarded and the
cell pellet containing leucocytes and CTCs was stored at 80°C until
further processing.
RNA isolation
For RNA isolation the cell pellets were dewed and
resuspended in 1 ml Trizol LS reagent. 0,2 ml Chloroform (Merck
KGaA, Darmstadt, Germany) were added, samples were vortexed
vigorously and subsequently centrifuged at 12,000 × g and 4°C for
15 min. After centrifugation the clear upper phase was carefully
aspired and transferred into a fresh Eppendorf tube. A total of 0,5
ml isopropanol (Merck KGaA) were added and samples were placed at
−20°C overnight. The next day the samples were centrifuged at
12,000 × g, 4°C for 10 min. to precipitate RNA. Supernatant was
removed and RNA-pellet was washed with 75% ethanol (Merck KGaA) and
centrifugation at 12,000 × g and 4°C for 10 min. Supernatant was
removed again and RNA-pellet was air dried before it was
resuspended in RNase-free water. RNA concentration and ratio were
measured photometrically (Implen, Munich, Germany) and only RNAs
with a ratio between 1,7 and 1,9 were used in further experiments.
Additionally RNA integrity was controlled by denaturing gel
electrophoresis.
Reverse transcription
For reverse transcription 4 µg of the isolated RNA
in a max. Volume of 6 µl were used. Reverse transcription was
carried out with the SuperScript III First Strand Synthesis
SuperMix (Invitrogen; ThermoFisher Scientific), according to
manufacturer's instructions. In brief: annealing buffer and oligo
(dT)-Primers were added to the RNA and volume was adjusted to 8 µl
with water. After an incubation at 65°C for 5 min and a short
cooling on ice 10 µl of 2X first strand reaction mix and 2 µl of
the enzyme mix (SuperScriptIII/RNaseOUT) were added and the samples
were incubated at 50°C for 50 min. Afterwards enzymes were
denatured by a 5-min incubation at 85°C, then samples could be
stored at −20°C until use.
qPCR
For qPCR 2 µl of the previously generated cDNA of
each sample were pipetted into a 96-well qPCR plate and 18 µl of a
mastermix, consisting of 7 µl water, 1 µl TaqMan®
PCR-primer (Hydrolysis probes used are listed in Table II; they were not validated, as
Applied Biosystems claims a PCR-efficiency of 100±10% for their
hydrolysis probes) and 10 µl 2X RT-PCR reaction mix (Applied
Biosystems; Thermo Fisher Scientific, Inc., Waltham, MA, USA) per
sample, were added. Every sample was at least analysed as
duplicates, 18S was used as a reference gene. Negative (water)
controls were included. The qPCR reaction was carried out in an
Applied Biosystems 7500 fast machine and the following program was
run: 95°C for 20 sec. As an initial denaturation followed by 40
cycles 95°C for 3 sec and 60°C for 30 sec. Increase in fluorescence
was measured after every elongation step and thereof gene
expression (RQ=relative quantification) was calculated by the SDS V
1.3.1 software using 2−∆∆Cq method (57). RQ-values are displayed in Table IIIA and B.
| Table II.Reverse transcription-quantitative
polymerase chain reaction probes. |
Table II.
Reverse transcription-quantitative
polymerase chain reaction probes.
| Probe/Gene | Order no. of
probe | Fragment size | Manufacturer |
|---|
| 18S | Hs99999901_s1 | 187 bp | Thermo Fisher
Scientific, Inc. (Waltham, MA, USA) |
| GAPDH | Hs03003631_g1 | 69
bp | Thermo Fisher
Scientific, Inc. |
| CK19 | Hs00761767_s1 | 116 bp | Thermo Fisher
Scientific, Inc. |
| Snail | Hs00195591_m1 | 66
bp | Thermo Fisher
Scientific, Inc. |
| Slug | Hs00161904_m1 | 79
bp | Thermo Fisher
Scientific, Inc. |
| FoxC2 | Hs00270951_s1 | 102 bp | Thermo Fisher
Scientific, Inc. |
| Akt2 | Hs01086099_m1 | 70
bp | Thermo Fisher
Scientific, Inc. |
| Twist | Hs01675818_s1 | 85
bp | Thermo Fisher
Scientific, Inc. |
| ALDH1 | Hs00946916_m1 | 61
bp | Thermo Fisher
Scientific, Inc. |
| Table III.Gene expression values in patient
samples. |
Table III.
Gene expression values in patient
samples.
| A, Subgroup of less
aggressive tumors with all marker genes downregulated |
|---|
|
|---|
| No. of sample
(corresponding to Table I) | RQ CK19 | RQ Snail | RQ FoxC2 | RQ Twist |
|---|
| 1 | 0.396 | 0.361 | 0.984 | 0.439 |
| 2 | 0.107 | 0.393 | 0.513 | 0.269 |
| 3 | 0.334 | 0.152 | 0.829 | 0.566 |
| 4 | 0.063 | 0.073 | 0.19 | 0.171 |
| 5 | 0.132 | 0.269 | 0.201 | 0.163 |
| 6 | 0.011 | 0.183 | 0.031 | 0.024 |
| 7 | 0.033 | 0.597 | 0.023 | 0.021 |
| 8 | 0.177 | 0.433 | 0.432 | 0.322 |
| 9 | 0.021 | 0.354 | 0.102 | 0.132 |
| 10 | 0.097 | 0.326 | 0.248 | 0.082 |
| 11 | 0.854 | 0.339 | 0.281 | 0.741 |
| 12 | 0.073 | 0.216 | 0.17 | 0.164 |
| 13 | 0.009 | 0.37 | 0.044 | 0.035 |
| 14 | 0.148 | 0.031 | 0.786 | 0.364 |
| 15 | 0.131 | 0.078 | 0.648 | 0.334 |
| 16 | 0.014 | 0.494 | 0.091 | 0.054 |
| 17 | 0.017 | 0.327 | 0.068 | 0.086 |
| 18 | 0.16 | 0.787 | 0.703 | 0.567 |
|
| B, Subgroup of
aggressive tumors with at least one marker gene upregulated |
|
| No. of sample
(corresponding to Table I) | RQ CK19 | RQ Snail | RQ FoxC2 | RQ Twist |
|
| 19 | 0.038 | 10.747 | 0.15 | 0.181 |
| 20 | 0.572 | 0.237 | 1.479 | 1.09 |
| 21 | 0.401 | 15.387 | 1.948 | 2.15 |
| 22 | 0.068 | 1.635 | 0.418 | 0.647 |
| 23 | 0.027 | 3.143 | 0.191 | 0.15 |
| 24 | 0.01 | 2.103 | 0.062 | 0.056 |
| 25 | 1.037 | 0.502 | 1.657 | 1.231 |
| 26 | 1.251 | 1.007 | 4.117 | 3.72 |
| 27 | 1.315 | 0.453 | 2.486 | 1.685 |
| 28 | 0.441 | 0.246 | 2.236 | 0.579 |
| 29 | 1.555 | 2.301 | 1.096 | 0.945 |
| 30 | 0.016 | 1.565 | 0.068 | 0.089 |
| 31 | 0.491 | 4.566 | 1.435 | 1.65 |
| 32 | 0.094 | 2.442 | 0.227 | 0.277 |
| 33 | 0.735 | 1.965 | 2.922 | 2.224 |
| 34 | 0.038 | 1.279 | 0.269 | 0.207 |
| 35 | 0.806 | 2.072 | 2.818 | 0.958 |
Evaluation
The relative gene expression of every gene in
respect to the expression of 18S was calculated by the
SDS-software. The SDS-files can be displayed in Microsoft™
Excel®, and it was also used to generate graphical data
for the model system samples, showing gene expression in dependence
on the number of breast cancer cell line cells added to the
respective blood sample.
Statistical analysis
All statistical analyses were performed with SPSS
v.23 (IBM Corp., Armonk, NY, USA). Kolmogorow-Smirnof-Test was
applied to test, if distribution of data was similar. The average
RQ-values were compared with the two-tailed t-test and the medians
with the Mann-Withney-U-Test.
Results
Results from model system
analysis
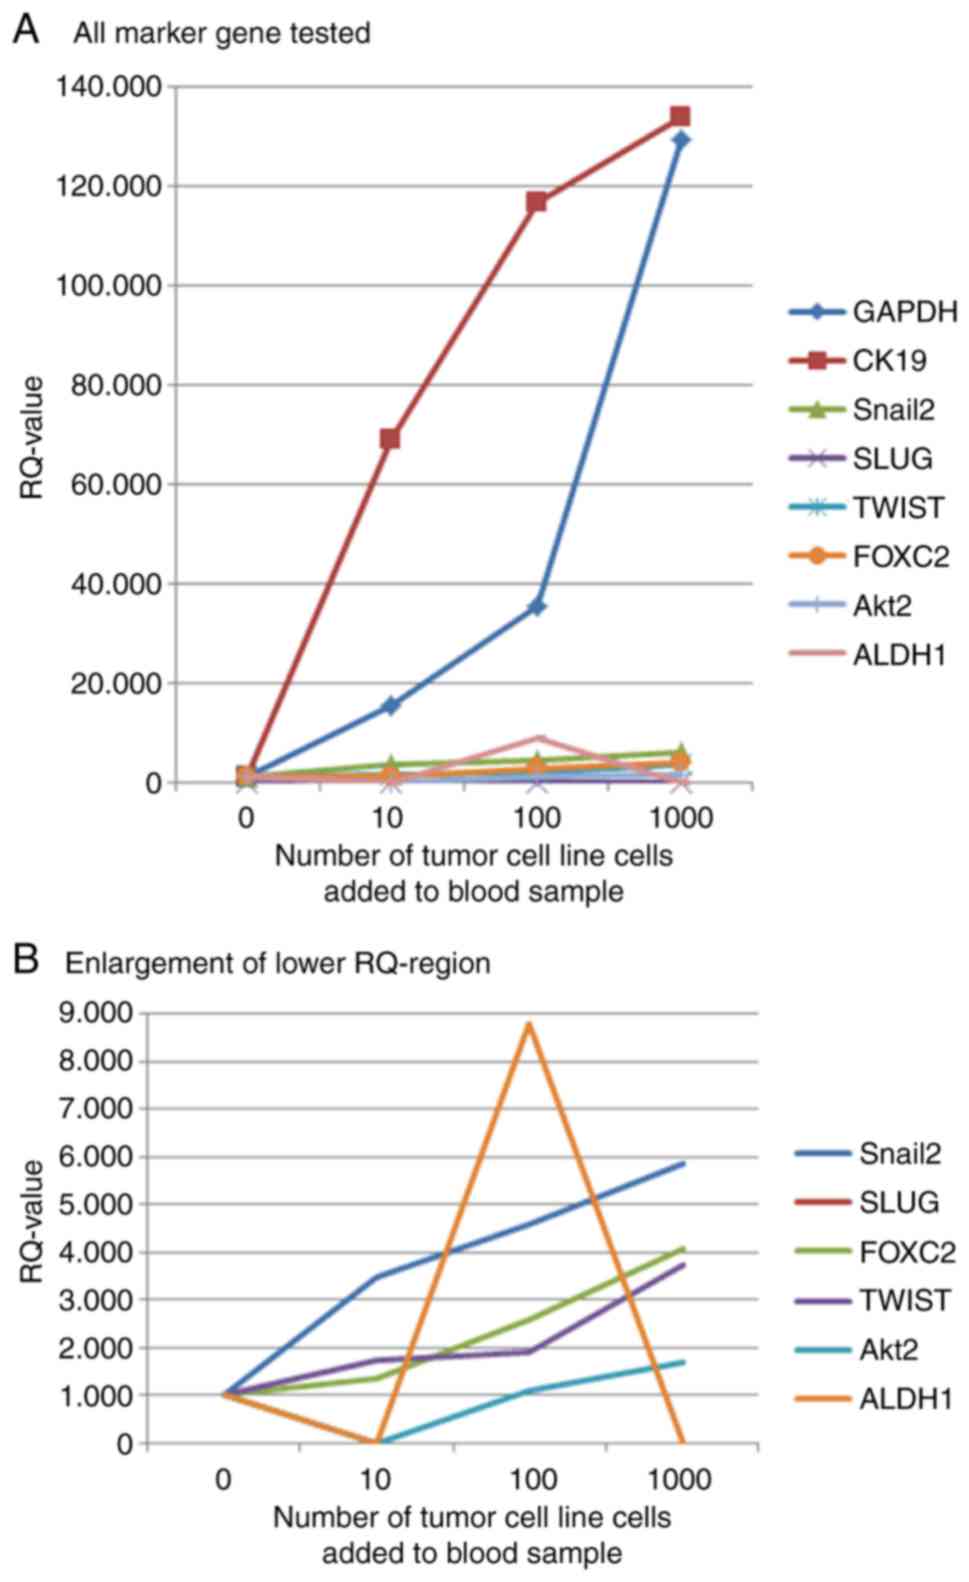
The analysis of a model system-blood samples from
healthy donors with breast cancer cell line cells added in
predefined amounts-was used to decide, which marker genes should be
used in the patient samples without wasting precious patient
material. The strongest increase in gene expression with increasing
number of tumor cells added to the blood samples could be found for
CK19. Snail, FoxC2 and Twist also had increasing gene expression
values and were therefore selected as marker genes for the analysis
of patient samples. The expression of Slug could not be detected in
the qPCR reaction, maybe the Hydrolysis probe was not suitable
enough for the probes used in our experiments. ALDH1 showed a
decrease in gene expression in the sample with most tumor cells
added, so it was also excluded from further analysis. The increase
in gene expression shown by Akt2 was lower than that seen for
Snail, FoxC2 and Twist. Therefore it was decided not to use Akt2 in
further experiments. Curves for marker gene expression in
artificial model system samples are shown in Fig. 1.
Results from analysis of patient
samples
After Real-Time PCR analysis patient samples could
be subdivided into two subgroups: In the first group of 18 samples
all RQ-values of the used marker genes were below 1, what means,
that the genes are downregulated in comparison to the reference
sample (Table IIIA). In the
second group in contrast, which consisted of 17 samples, at least
one of the genes analysed was upregulated, having a RQ-value
greater than 1 (Table IIIB).
Comparing the subgroups a trend seems to become apparent: Tumors in
the first group have a less aggressive biology than the ones in the
second subgroup. In the first group some tumors still have a
G1-grading (samples 1–6), while in the second group all
malignancies have a grading of 2 or more. Furthermore in none of
the samples from the first group metastasis formation could be
detected, while 7 samples (samples 11–17) of the second group show
up with remote metastasis. Also for the nodal status a difference
can be seen between the two subgroups: while in the first group
only three samples have a nodal status of N1 (samples 5, 13 and 18)
in the second group only four samples have an N0 status (samples 2,
3, 12 and 13), whereas sample No. 2 is a rather large tumor, sample
three belongs to the group of aggressive TNBC-tumours and samples
12 and 13 are of the metastatic subcategory. Additionally in the
‘less aggressive’ category, only one, relatively small,
triple-negative tumour can be found (sample 9), while in the second
group two triple negative tumours can be found (samples 2 and 11),
which also have large tumour sizes, and there are two tumours, for
which hormone receptor status was not determined, so it is not sure
if they might also be of the rather aggressive TNBC tumor group
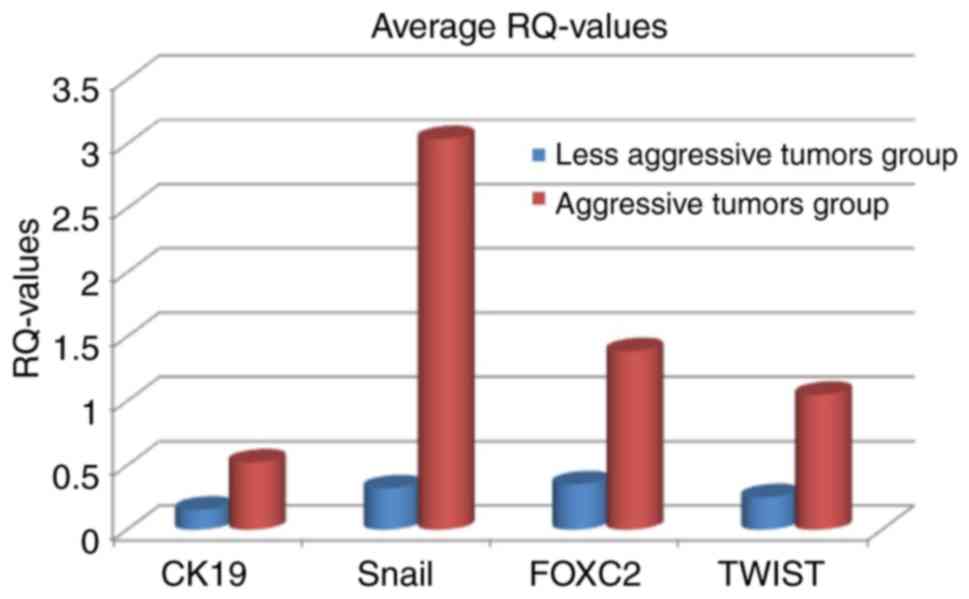
(samples 12 and 13). Averaging RQ-values of all four genes in both
tumor subgroups shows, that RQ-values are higher in the group of
aggressive tumors than in the group of less aggressive tumors
(Fig. 2). The average and median
RQ-values are also statistically significant different between the
two groups (Table IV). Only for
CK19 the P-values is at a borderline significance level
(0.062).
| Table IV.Statistical comparison of gene
expression values between the two patient groups. |
Table IV.
Statistical comparison of gene
expression values between the two patient groups.
| Statistical
test | CK19 | Snail | FoxC2 | Twist |
|---|
| Kolmogorow-Smirnof
(data have similar distribution) | 0.018 | 0.000 | 0.002 | 0.002 |
| Two-tailed t-test
(comparing average values) | 0.008 | 0.007 | 0.002 | 0.002 |
| Mann-Withney U-Test
(comparing medians) | 0.062 | 0.000 | 0.011 | 0.028 |
Discussion
The marker genes, which were used in patient sample
analysis are all known as markers for a poor clinical outcome. CK
19 is a marker for metastatic breast cancer (27,28)
and late relapse (26), so it is
not surprising, that it is upregulated in some of the tumors with
aggressive biology, but it still has to be clarified, why it is
only upregulated in one of the metastatic breast cancers analysed
in our study (sample 11). The other three cases in which it's
expression is upregulated have a positive lymph node status,
although no coherence between CK19 and lymph node metastasis was
shown in the literature. Snail in contrast is upregulated in most
aggressive tumor samples, and therefore seems to be a rather
important marker. That could be explained by the fact, that snail
triggers early events during EMT in it's role as a transcription
factor (31–34). Fox C2 is upregulated in more than
50% of the tumors with aggressive biology (9 out of 17), but no
coherence between it's function in metastasis formation (40,41)
it's correlation with grading (38) and lymph node metastasis could be
seen form the results of the presented study. Twist plays a more
general role within the EMT process, and is upregulated in 7 out of
17 cases in the on hand study. Therefore it could be concluded,
that Twist also plays a basic role in tumor cell transformation,
but seems not to be such important as Snail. A special role in
metastasis formation (44) could
not be confirmed from the experiments presented here.
Taking together these results as a rough conclusion
can be said, that tumors, for which all of the four used marker
genes are downregulated, have a less aggressive tumor biology than
those samples, in which at least one gene is upregulated. But a lot
of work confirming this thesis is still necessary. First of all,
the analysis should be amplified to a larger group of patient blood
samples and the marker gene panel could also be enlarged. It still
has to be clarified, in which tumor situation a certain gene is
upregulated, and the significance of only one in contrast to two or
more upregulated genes has to be elucidated. Differences in gene
expression between TNBC-samples should also be enlightened. It can
be said, that still lots of work has to be done in this field of
research, but the results we present in the on hand study are
already giving a certain hint and direction for further research in
order to improve diagnostics and refine therapeutical approaches. A
further research in this filed could thus help to personalize
treatment, thereby reducing side-effects while increasing treatment
efficiency, so that research would be rather worth while.
References
|
1
|
Alix-Panabieres C and Pantel K:
Circulating tumor cells: Liquid biopsy of cancer. Clin Chem.
59:110–118. 2013. View Article : Google Scholar : PubMed/NCBI
|
|
2
|
Bragado P, Sosa MS, Keely P, Condeelis J
and Aguirre-Ghiso JA: Microenvironments dictating tumor cell
dormancy. Recent Results Cancer Res. 195:25–39. 2012. View Article : Google Scholar : PubMed/NCBI
|
|
3
|
Andergassen U, Hofmann S, Kölbl AC,
Schindlbeck C, Neugebauer J, Hutter S, Engelstädter V, Ilmer M,
Friese K and Jeschke U: Detection of tumor cell-specific mRNA in
the peripheral blood of patients with breast cancer-evaluation of
several markers with real-time reverse transcription-PCR. Int J Mol
Sci. 14:1093–1104. 2013. View Article : Google Scholar : PubMed/NCBI
|
|
4
|
Andreopoulou E, Yang LY, Rangel KM, Reuben
JM, Hsu L, Krishnamurthy S, Valero V, Fritsche HA and Cristofanilli
M: Comparison of assay methods for detection of circulating tumor
cells in metastatic breast cancer: AdnaGen adna test breast cancer
select/detect versus veridex cell search™ system. Int J Cancer.
130:1590–1597. 2012. View Article : Google Scholar : PubMed/NCBI
|
|
5
|
Bednarz-Knoll N, Alix-Panabières C and
Pantel K: Clinical relevance and biology of circulating tumor
cells. Breast Cancer Res. 13:2282011. View
Article : Google Scholar : PubMed/NCBI
|
|
6
|
Diel IJ, Solomayer EF, Costa SD, Gollan C,
Goerner R, Wallwiener D, Kaufmann M and Bastert G: Reduction in new
metastases in breast cancer with adjuvant clodronate treatment. N
Engl J Med. 339:357–363. 1998. View Article : Google Scholar : PubMed/NCBI
|
|
7
|
Dowsett M and Dunbier AK: Emerging
biomarkers and new understanding of traditional markers in
personalized therapy for breast cancer. Clin Cancer Res.
14:8019–8026. 2008. View Article : Google Scholar : PubMed/NCBI
|
|
8
|
Dowsett M, Procter M, McCaskill-Stevens W,
de Azambuja E, Dafni U, Rueschoff J, Jordan B, Dolci S, Abramovitz
M, Stoss O, et al: Disease-free survival according to degree of
HER2 amplification for patients treated with adjuvant chemotherapy
with or without 1 year of trastuzumab: The HERA trial. J Clin
Oncol. 27:2962–2969. 2009. View Article : Google Scholar : PubMed/NCBI
|
|
9
|
Dunnwald LK, Rossing MA and Li CI: Hormone
receptor status, tumor characteristics and prognosis: A prospective
cohort of breast cancer patients. Breast Cancer Res. 9:R62007.
View Article : Google Scholar : PubMed/NCBI
|
|
10
|
Franken B, de Groot MR, Mastboom WJ,
Vermes I, van der Palen J, Tibbe AG and Terstappen LW: Circulating
tumor cells, disease recurrence and survival in newly diagnosed
breast cancer. Breast Cancer Res. 14:R1332012. View Article : Google Scholar : PubMed/NCBI
|
|
11
|
Braun S, Vogl FD, Naume B, Janni W,
Osborne MP, Coombes RC, Schlimok G, Diel IJ, Gerber B, Gebauer G,
et al: A pooled analysis of bone marrow micrometastasis in breast
cancer. N Engl J Med. 353:793–802. 2005. View Article : Google Scholar : PubMed/NCBI
|
|
12
|
Graves H and Czerniecki BJ: Circulating
tumor cells in breast cancer patients: An evolving role in patient
prognosis and disease progression. Patholog Res Int.
2011:6210902011.PubMed/NCBI
|
|
13
|
Guarino M: Epithelial-mesenchymal
transition and tumour invasion. Int J Biochem Cell Biol.
39:2153–2160. 2007. View Article : Google Scholar : PubMed/NCBI
|
|
14
|
Kölbl AC, Jeschke U and Andergassen U: The
significance of epithelial-to-mesenchymal transition for
circulating tumor cells. Int J Mol Sci. 17:E13082016. View Article : Google Scholar : PubMed/NCBI
|
|
15
|
Tiwari N, Gheldof A, Tatari M and
Christofori G: EMT as the ultimate survival mechanism of cancer
cells. Semin Cancer Biol. 22:194–207. 2012. View Article : Google Scholar : PubMed/NCBI
|
|
16
|
Gorges TM, Tinhofer I, Drosch M, Röse L,
Zollner TM, Krahn T and von Ahsen O: Circulating tumour cells
escape from EpCAM-based detection due to epithelial-to-mesenchymal
transition. BMC Cancer. 12:1782012. View Article : Google Scholar : PubMed/NCBI
|
|
17
|
Raimondi C, Gradilone A, Naso G, Vincenzi
B, Petracca A, Nicolazzo C, Palazzo A, Saltarelli R, Spremberg F,
Cortesi E and Gazzaniga P: Epithelial-mesenchymal transition and
stemness features in circulating tumor cells from breast cancer
patients. Breast Cancer Res Treat. 130:449–455. 2011. View Article : Google Scholar : PubMed/NCBI
|
|
18
|
Hugo H, Ackland ML, Blick T, Lawrence MG,
Clements JA, Williams ED and Thompson EW: Epithelial-mesenchymal
and mesenchymal-epithelial transitions in carcinoma progression. J
Cell Physiol. 213:374–383. 2007. View Article : Google Scholar : PubMed/NCBI
|
|
19
|
Nieto MA: Epithelial plasticity: A common
theme in embryonic and cancer cells. Science. 342:12348502013.
View Article : Google Scholar : PubMed/NCBI
|
|
20
|
Yao D, Dai C and Peng S: Mechanism of the
mesenchymal-epithelial transition and its relationship with
metastatic tumor formation. Mol Cancer Res. 9:1608–1620. 2011.
View Article : Google Scholar : PubMed/NCBI
|
|
21
|
Kurec AS, Baltrucki L, Mason DY and Davey
FR: Use of the APAAP method in the classification and diagnosis of
hematologic disorders. Clin Lab Med. 8:223–236. 1988.PubMed/NCBI
|
|
22
|
Noack F, Schmitt M, Bauer J, Helmecke D,
Krüger W, Thorban S, Sandherr M, Kuhn W, Graeff H and Harbeck N: A
new approach to phenotyping disseminated tumor cells:
Methodological advances and clinical implications. Int J Biol
Markers. 15:100–104. 2000. View Article : Google Scholar : PubMed/NCBI
|
|
23
|
Ignatiadis M, Kallergi G, Ntoulia M,
Perraki M, Apostolaki S, Kafousi M, Chlouverakis G, Stathopoulos E,
Lianidou E, Georgoulias V and Mavroudis D: Prognostic value of the
molecular detection of circulating tumor cells using a multimarker
reverse transcription-PCR assay for cytokeratin 19, mammaglobin A
and HER2 in early breast cancer. Clin Cancer Res. 14:2593–2600.
2008. View Article : Google Scholar : PubMed/NCBI
|
|
24
|
Ignatiadis M, Xenidis N, Perraki M,
Apostolaki S, Politaki E, Kafousi M, Stathopoulos EN, Stathopoulou
A, Lianidou E, Chlouverakis G, et al: Different prognostic value of
cytokeratin-19 mRNA positive circulating tumor cells according to
estrogen receptor and HER2 status in early-stage breast cancer. J
Clin Oncol. 25:5194–5202. 2007. View Article : Google Scholar : PubMed/NCBI
|
|
25
|
Saloustros E and Mavroudis D: CTCs in
primary breast cancer (II). Recent Results Cancer Res. 195:187–192.
2012. View Article : Google Scholar : PubMed/NCBI
|
|
26
|
Saloustros E, Perraki M, Apostolaki S,
Kallergi G, Xyrafas A, Kalbakis K, Agelaki S, Kalykaki A,
Georgoulias V and Mavroudis D: Cytokeratin-19 mRNA-positive
circulating tumor cells during follow-up of patients with operable
breast cancer: Prognostic relevance for late relapse. Breast Cancer
Res. 13:R602011. View
Article : Google Scholar : PubMed/NCBI
|
|
27
|
Soltani S, Mokarian F and Panjehpour M:
The expression of CK-19 gene in circulating tumor cells of blood
samples of metastatic breast cancer women. Res Pharm Sci.
10:485–496. 2015.PubMed/NCBI
|
|
28
|
Zhao S, Yang H, Zhang M, Zhang D, Liu Y,
Liu Y, Song Y, Zhang X, Li H, Ma W and Zhang Q: Circulating tumor
cells (CTCs) detected by triple-marker EpCAM, CK19 and hMAM RT-PCR
and their relation to clinical outcome in metastatic breast cancer
patients. Cell Biochem Biophys. 65:263–273. 2013. View Article : Google Scholar : PubMed/NCBI
|
|
29
|
Tunca B, Egeli U, Cecener G, Tezcan G,
Gökgöz S, Tasdelen I, Bayram N, Tolunay S, Umut G, Demirdogen E, et
al: CK19, CK20, EGFR and HER2 status of circulating tumor cells in
patients with breast cancer. Tumori. 98:243–251. 2012. View Article : Google Scholar : PubMed/NCBI
|
|
30
|
Kallergi G, Papadaki MA, Politaki E,
Mavroudis D, Georgoulias V and Agelaki S: Epithelial to mesenchymal
transition markers expressed in circulating tumour cells of early
and metastatic breast cancer patients. Breast Cancer Res.
13:R592011. View
Article : Google Scholar : PubMed/NCBI
|
|
31
|
Blanco MJ, Moreno-Bueno G, Sarrio D,
Locascio A, Cano A, Palacios J and Nieto MA: Correlation of Snail
expression with histological grade and lymph node status in breast
carcinomas. Oncogene. 21:3241–3246. 2002. View Article : Google Scholar : PubMed/NCBI
|
|
32
|
Peinado H, Olmeda D and Cano A: Snail, Zeb
and bHLH factors in tumour progression: an alliance against the
epithelial phenotype? Nat Rev Cancer. 7:415–428. 2007. View Article : Google Scholar : PubMed/NCBI
|
|
33
|
Vega S, Morales AV, Ocaña OH, Valdés F,
Fabregat I and Nieto MA: Snail blocks the cell cycle and confers
resistance to cell death. Genes Dev. 18:1131–1143. 2004. View Article : Google Scholar : PubMed/NCBI
|
|
34
|
Moody SE, Perez D, Pan TC, Sarkisian CJ,
Portocarrero CP, Sterner CJ, Notorfrancesco KL, Cardiff RD and
Chodosh LA: The transcriptional repressor Snail promotes mammary
tumor recurrence. Cancer Cell. 8:197–209. 2005. View Article : Google Scholar : PubMed/NCBI
|
|
35
|
Hajra KM, Chen DY and Fearon ER: The SLUG
zinc-finger protein represses E-cadherin in breast cancer. Cancer
Res. 62:1613–1618. 2002.PubMed/NCBI
|
|
36
|
Villarejo A, Cortes-Cabrera A,
Molina-Ortiz P, Portillo F and Cano A: Differential role of Snail1
and Snail2 zinc fingers in E-cadherin repression and epithelial to
mesenchymal transition. J Biol Chem. 289:930–941. 2014. View Article : Google Scholar : PubMed/NCBI
|
|
37
|
Dai J, Wang JY, Yang LL, Xiao Y, Qu ZL,
Qin SH and Ruan QR: Correlation of Forkhead Box c2 with subtypes
and invasive ability of invasive breast cancer. J Huazhong Univ Sci
Technolog Med Sci. 34:896–901. 2014. View Article : Google Scholar : PubMed/NCBI
|
|
38
|
Lim JC, Koh VC, Tan JS, Tan WJ, Thike AA
and Tan PH: Prognostic significance of epithelial-mesenchymal
transition proteins Twist and Foxc2 in phyllodes tumours of the
breast. Breast Cancer Res Treat. 150:19–29. 2015. View Article : Google Scholar : PubMed/NCBI
|
|
39
|
Taube JH, Herschkowitz JI, Komurov K, Zhou
AY, Gupta S, Yang J, Hartwell K, Onder TT, Gupta PB, Evans KW, et
al: Core epithelial-to-mesenchymal transition interactome
gene-expression signature is associated with claudin-low and
metaplastic breast cancer subtypes. Proc Natl Acad Sci USA.
107:15449–15454. 2010. View Article : Google Scholar : PubMed/NCBI
|
|
40
|
Mani SA, Yang J, Brooks M, Schwaninger G,
Zhou A, Miura N, Kutok JL, Hartwell K, Richardson AL and Weinberg
RA: Mesenchyme forkhead 1 (FOXC2) plays a key role in metastasis
and is associated with aggressive basal-like breast cancers. Proc
Natl Acad Sci USA. 104:10069–10074. 2007. View Article : Google Scholar : PubMed/NCBI
|
|
41
|
Kume T: Foxc2 transcription factor: A
newly described regulator of angiogenesis. Trends Cardiovasc Med.
18:224–228. 2008. View Article : Google Scholar : PubMed/NCBI
|
|
42
|
Finlay J, Roberts CM, Lowe G, Loeza J,
Rossi JJ and Glackin CA: RNA-based TWIST1 inhibition via dendrimer
complex to reduce breast cancer cell metastasis. Biomed Res Int.
2015:3827452015. View Article : Google Scholar : PubMed/NCBI
|
|
43
|
Tang H, Massi D, Hemmings BA, Mandalà M,
Hu Z, Wicki A and Xue G: AKT-ions with a TWIST between EMT and MET.
Oncotarget. 7:62767–62777. 2016. View Article : Google Scholar : PubMed/NCBI
|
|
44
|
Yang J, Mani SA, Donaher JL, Ramaswamy S,
Itzykson RA, Come C, Savagner P, Gitelman I, Richardson A and
Weinberg RA: Twist, a master regulator of morphogenesis, plays an
essential role in tumor metastasis. Cell. 117:927–939. 2004.
View Article : Google Scholar : PubMed/NCBI
|
|
45
|
Watanabe O, Imamura H, Shimizu T,
Kinoshita J, Okabe T, Hirano A, Yoshimatsu K, Konno S, Aiba M and
Ogawa K: Expression of twist and wnt in human breast cancer.
Anticancer Res. 24:3851–3856. 2004.PubMed/NCBI
|
|
46
|
Giordano A, Gao H, Anfossi S, Cohen E,
Mego M, Lee BN, Tin S, De Laurentiis M, Parker CA and Alvarez RH:
Epithelial-mesenchymal transition and stem cell markers in patients
with HER2-positive metastatic breast cancer. Mol Cancer Ther.
11:2526–2534. 2012. View Article : Google Scholar : PubMed/NCBI
|
|
47
|
Micalizzi DS, Farabaugh SM and Ford HL:
Epithelial-mesenchymal transition in cancer: Parallels between
normal development and tumor progression. J Mammary Gland Biol
Neoplasia. 15:117–134. 2010. View Article : Google Scholar : PubMed/NCBI
|
|
48
|
Cheng GZ, Chan J, Wang Q, Zhang W, Sun CD
and Wang LH: Twist transcriptionally up-regulates AKT2 in breast
cancer cells leading to increased migration, invasion and
resistance to paclitaxel. Cancer Res. 67:1979–1987. 2007.
View Article : Google Scholar : PubMed/NCBI
|
|
49
|
Arboleda MJ, Lyons JF, Kabbinavar FF, Bray
MR, Snow BE, Ayala R, Danino M, Karlan BY and Slamon DJ:
Overexpression of AKT2/protein kinase Bbeta leads to up-regulation
of beta1 integrins, increased invasion, and metastasis of human
breast and ovarian cancer cells. Cancer Res. 63:196–206.
2003.PubMed/NCBI
|
|
50
|
Irie HY, Pearline RV, Grueneberg D, Hsia
M, Ravichandran P, Kothari N, Natesan S and Brugge JS: Distinct
roles of Akt1 and Akt2 in regulating cell migration and
epithelial-mesenchymal transition. J Cell Biol. 171:1023–1034.
2005. View Article : Google Scholar : PubMed/NCBI
|
|
51
|
Kasimir-Bauer S, Hoffmann O, Wallwiener D,
Kimmig R and Fehm T: Expression of stem cell and
epithelial-mesenchymal transition markers in primary breast cancer
patients with circulating tumor cells. Breast Cancer Res.
14:R152012. View Article : Google Scholar : PubMed/NCBI
|
|
52
|
Ginestier C, Hur MH, Charafe-Jauffret E,
Monville F, Dutcher J, Brown M, Jacquemier J, Viens P, Kleer CG,
Liu S, et al: ALDH1 is a marker of normal and malignant human
mammary stem cells and a predictor of poor clinical outcome. Cell
Stem Cell. 1:555–567. 2007. View Article : Google Scholar : PubMed/NCBI
|
|
53
|
Liu Y, Lv DL, Duan JJ, Xu SL, Zhang JF,
Yang XJ, Zhang X, Cui YH, Bian XW and Yu SC: ALDH1A1 expression
correlates with clinicopathologic features and poor prognosis of
breast cancer patients: A systematic review and meta-analysis. BMC
Cancer. 14:4442014. View Article : Google Scholar : PubMed/NCBI
|
|
54
|
Morimoto K, Kim SJ, Tanei T, Shimazu K,
Tanji Y, Taguchi T, Tamaki Y, Terada N and Noguchi S: Stem cell
marker aldehyde dehydrogenase 1-positive breast cancers are
characterized by negative estrogen receptor, positive human
epidermal growth factor receptor type 2 and high Ki67 expression.
Cancer Sci. 100:1062–1068. 2009. View Article : Google Scholar : PubMed/NCBI
|
|
55
|
Pan H, Wu N, Huang Y, Li Q, Liu C, Liang
M, Zhou W, Liu X and Wang S: Aldehyde dehydrogenase 1 expression
correlates with the invasion of breast cancer. Diagn Pathol.
10:662015. View Article : Google Scholar : PubMed/NCBI
|
|
56
|
Aktas B, Tewes M, Fehm T, Hauch S, Kimmig
R and Kasimir-Bauer S: Stem cell and epithelial-mesenchymal
transition markers are frequently overexpressed in circulating
tumor cells of metastatic breast cancer patients. Breast Cancer
Res. 11:R462009. View Article : Google Scholar : PubMed/NCBI
|
|
57
|
Livak KJ and Schmittgen TD: Analysis of
relative gene expression data using real-time quantitative PCR and
the 2(-Delta Delta C(T)) method. Methods. 25:402–408. 2001.
View Article : Google Scholar : PubMed/NCBI
|