Introduction
Asthma is a common chronic respiratory tract disease
in children, and it affects more than 6.1 million American children
in recent years (1). Minority and
low-income children were reported that suffered from a higher ratio
of asthma morbidity and mortality (2). Asthma is characterized by allergy,
recurring airway obstruction, and bronchospasm (3). It is mainly caused by a combination
of genetic and environmental factors, such as air pollution,
allergens, viral infection, aspirin and beta blockers (4). Although great scientific advances
have improved our understanding of asthma and promoted abilities to
control asthma effectively, the mechanism of asthma is still
unclear and needs to be explored. Exploring the progressive of
asthma and assessing asthma severity, especially asthma in
children, have been defined as urgent and persistent task to
initiating appropriate therapy.
Recent studies on asthma in children have focused on
genetic factors, especially critical genes and mRNAs in the
pathogenesis of childhood asthma (5). β2-AR agonist is now the most
important bronchodilator for the treatment of asthma in clinical,
and the polymorphism of the ADRB2 response to inhaled
beta-agonists in children with asthma (6). Besides, imbalance of CD4+ T cell
subgroup were also major factors resulting in asthma, and study
showed that differentiation of Th2 cell, regulatory T cells (Treg)
were involved in the occurrence of asthma (7). To date, the pathogenetic basis for
the relationship between potential gene expression changes and
asthma has not been clearly elucidated.
In 2017, Yang et al (8) identified the DNA methylation and gene
expression changes in nasal-epithelium (NE) tissue associated with
childhood asthma. They demonstrated that the methylation marks in
the nasal epithelia of children with allergic asthma were
associated with gene expression changes. Based on the microarray
data deposited by Yang et al (8), as well as other three microarray data
of asthma downloaded from GEO database, we identified many
differentially expressed genes (DEGs) from different tissue samples
associated with asthma in children. Furthermore, we constructed
protein-protein interaction (PPI) network for the DEGs and
investigated the functional modules of DEGs in NE, peripheral blood
mononuclear cells (PBMC) and peripheral blood (PB) samples. Gene
Ontology (GO) functional analysis and Kyoto Encyclopedia of Genes
and Genomes (KEGG) pathway enrichment analysis were performed. In
addition, gene co-expression network was constructed to identify
the critical DEGs in asthmatic children. Our study might provide
novel diagnostic biomarkers and therapeutic target molecules in
progression of asthma in children.
Materials and methods
Data source
The four microarray datasets associated with asthma
in children [access nos. GSE65204 (8), GSE40732 (9), GSE40888 (10), and GSE35571 (11)] were downloaded from National Center
of Biotechnology Information (NCBI) GEO database. GSE65204 dataset
was sequenced on the platform of GPL14550 Agilent-028004 SurePrint
G3 Human GE 8× 60K Microarray (www.ncbi.nlm.nih.gov/geo/query/acc.cgi?acc=GPL14550),
including NE tissue samples from 36 asthmatic and 33 non-asthmatic
children (Table I). GSE40732
dataset included PBMCs from 97 atopic asthmatic and 97 nonatopic
nonasthmatic children, which was sequenced on platform of GPL16025
NimbleGen Homo sapiens Expression Array [(100718_HG18_opt_expr)
www.ncbi.nlm.nih.gov/geo/query/acc.cgi?acc=GPL16025].
GSE40888 dataset was sequenced on the platform of GPL6244
(HuGene-1_0-st) Affymetrix Human Gene 1.0 ST Array, including PBMCs
samples from 41 asthmatic and 24 non-asthmatic children. GSE35571
dataset contained PB samples from 60 asthmatic and 64 non-asthmatic
children based on the platform of GPL570 (HG-U133_Plus_2)
Affymetrix Human Genome U133 Plus 2.0 Array.
 | Table I.Microarray databases associated with
asthmatic children, including GSE65204, GSE40732, GSE40888 and
GSE35571. |
Table I.
Microarray databases associated with
asthmatic children, including GSE65204, GSE40732, GSE40888 and
GSE35571.
| Accession | Platform | Tissue | Asthmatic samples
(n) | Non-asthmatic
samples (n) |
|---|
| GSE65204 | GPL14550 |
Nasal-epithelium | 36 | 33 |
| GSE40732 | GPL16025 | Peripheral blood
mononuclear cells | 97 | 97 |
| GSE40888 | GPL6244 | Peripheral blood
mononuclear cells | 41 | 24 |
| GSE35571 | GPL570 | Peripheral
blood | 60 | 64 |
DEGs screening
The DEGs between disease groups and control groups
were screened by the limma package (12) in R software. The adjusted P-value
<0.05 and |log2 fold-change (FC)|>1 were considered as
cut-off criteria.
The microarray data from GSE40732 and GSE40888
datasets were analyzed to identify DEGs in PBMCs samples between
asthmatic children and healthy groups. Besides, GSE35571 dataset
was used to identify DEGs in PB samples and GSE65204 dataset were
used to identify DEGs in NE tissue samples.
Identification of co-expression
modules
To identify the gene co-expression modules related
to different tissue samples, we used weighted gene co-expression
network analysis (WGCNA) (13)
package to further mine the modules. The WGCNA provided topology
properties of co-expression network, as well as the correlation of
two node genes and relevant other genes. Besides, we changed the
connection coefficient into weight coefficient and screened
significant co-expression modules that related to different tissue
samples using WGCNA analysis.
PPI network construction
For the identified DEGs, we screened the PPI
relationship pairs of DEGs from some common databases. The
databases included HPRD (www.hprd.org/), BIOGRID (thebiogrid.org/), DIP (dip.doe-mbi.ucla.edu/dip/Main.cgi), MINT (mint.bio.uniroma2.it/mint/Welcome.do),
menthe (mentha.uniroma2.it/index.php), PINA (cbg.garvan.unsw.edu.au/pina/), InnateDB
(www.innatedb.com/), Instruct (instruct.yulab.org/index.html). We then
obtained the regression coefficient value of each relationship pair
in different conditions through linear regression analysis.
To investigate the changes of adjust power under two
conditions, we proposed a method to calculate the changes of adjust
power associated with screened PPI relationship pairs. The equation
is as follows:
dDRli=C2coefi-C1coefiC2sdi2+C1sdi2+m
C1coefi and
C2coefi represent regression coefficient value of
each relationship pairs in condition 1 and condition 2,
respectively; C1sdi and C2csdi
represent standard deviation (SD) values responding to regression
coefficient in condition 1 and condition 2, respectively; M
represents compensation coefficient; If a relationship pair is only
presented in the condition of disease, then its regression
coefficients and SD value would be zero in other conditions;
dDRl ranging from positive to negative value represents that
the regulative relations are increased or decreased from condition
1 to 2. The higher the absolute values of dDRl, the greater
change of adjust power.
In our study, we mainly compared the gene
relationships in three types of tissues: NE-Normal (from normal to
NE), PB-Normal (from normal to PB) and PBMC-Normal (from normal to
PBMC). After calculating dDRl values of the whole
relationships, we constructed the weighted correlation network. In
the network, the dDRl values represented edge weight. The
higher the absolute values of dDRl, the greater significance
of relationship pairs. Besides, we performed the KEGG pathway and
GO analyses to identify the enrichment functions of DEGs in the
network.
Identification of specific genes
In the weighted correlation network, the dDRl values
were used to evaluate the adjusted power of DEGs. For the specific
gene g, we calculated its adjusted power through the following
formula:
dDRgg=∑i=1k|dDRli|
g represents the specific genes; k represents the
number of relationships corresponding with the specific gene; the
dDRl can be displayed as dDRli (i=1, 2, . . ., k). The
higher the dDRg values, the greater effect of the specific genes on
the network. Finally, we exacted top 10 genes according to the
dDRg value.
Results
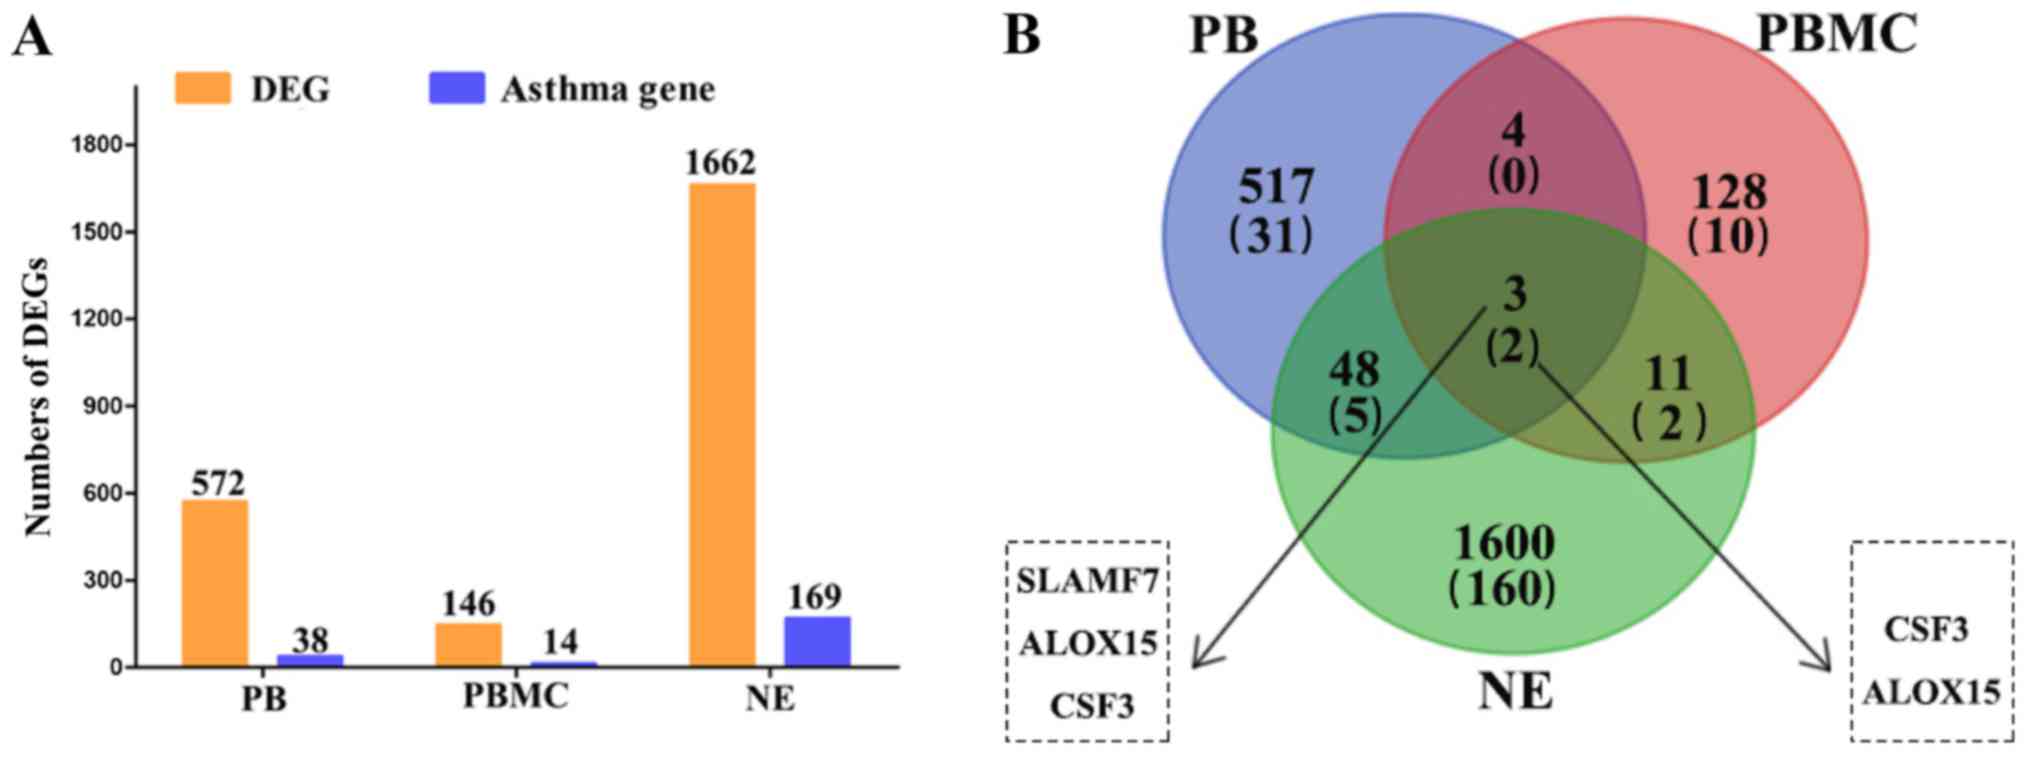
Identification of DEGs
We identified many DEGs from different tissue
samples, including 1,662 DEGs from NE tissue samples, 572 DEGs from
PB samples, 146 DEGs from PBMC samples. Furthermore, the genes
related to asthma were downloaded from DisGeNET database and the
number of genes in three types of tissue was counted, respectively.
A total of 169 DEGs related to asthma were screened from NE tissue,
38 DEGs were screened from PB and 14 DEGs were screened from PBMC
(Fig. 1A).
The Venn diagram was used to visualize the DEGs
screened from differential tissues (Fig. 1B). Among these genes, colony
stimulating factor 3 (CSF3) and arachidonate 15-lipoxygenase
(ALOX15) were significantly differentially expressed in all
three types of tissue.
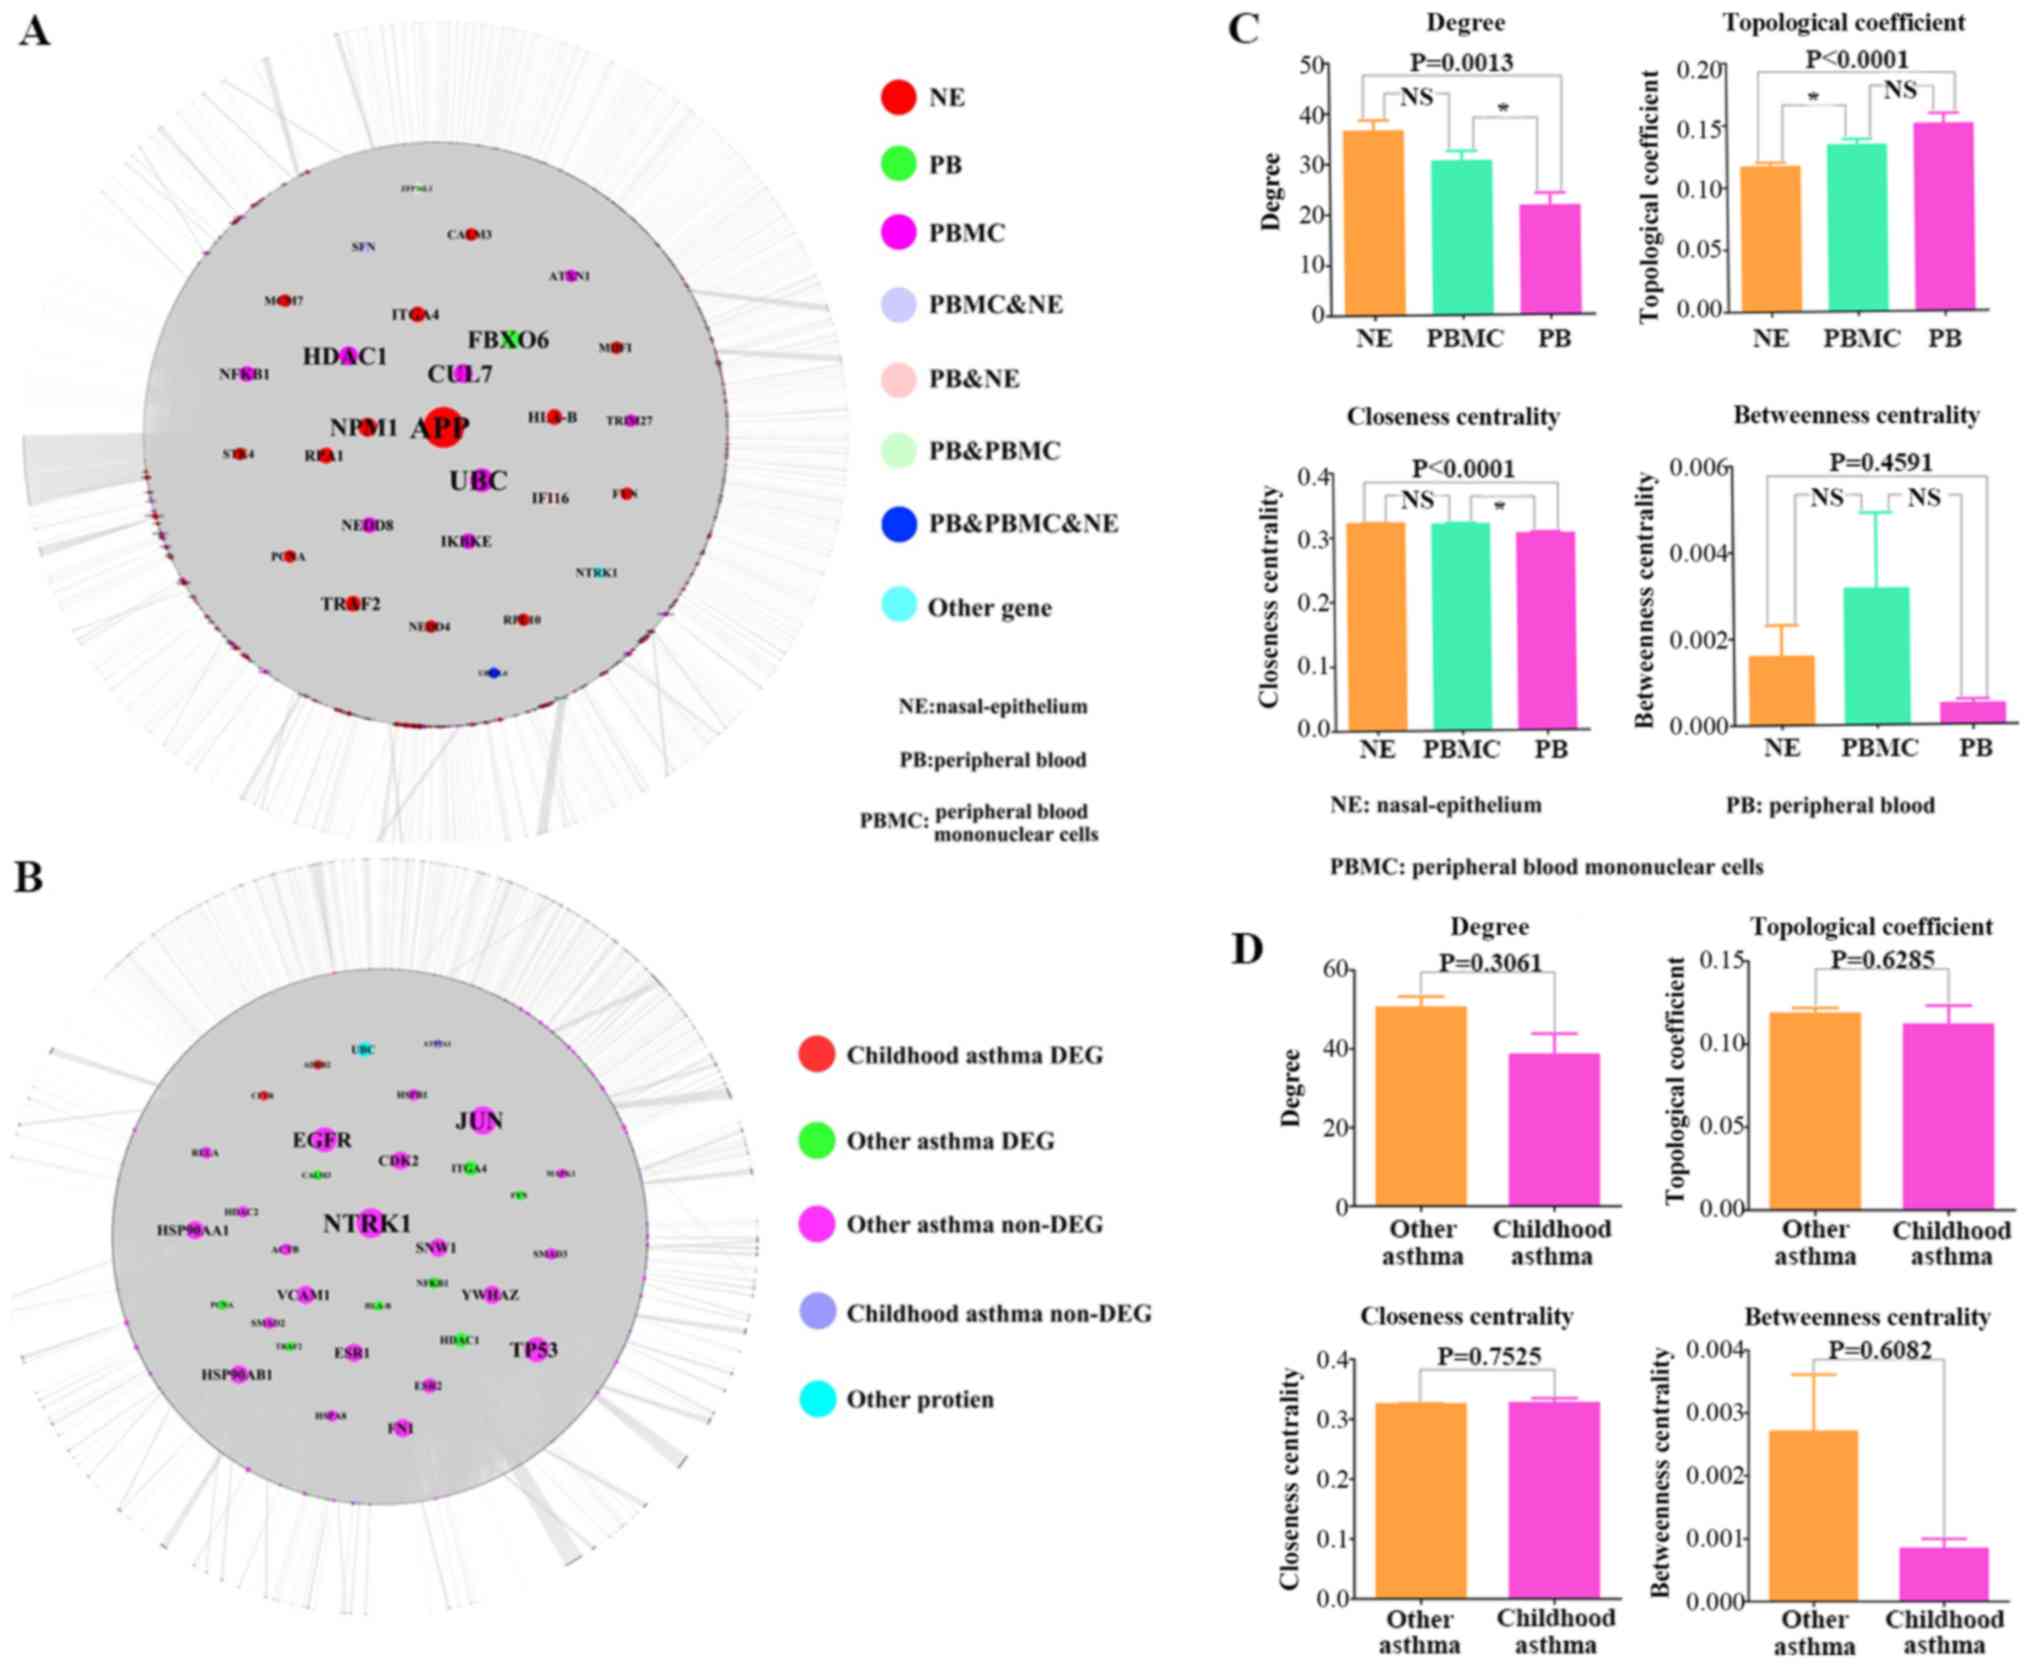
PPI network analysis
The PPI relationship pairs associated with DEGs were
extracted from common databases and the PPI network was
constructed. To further explore the DEGs related to PBMC tissue, we
take the union set of DEGs in two databases (GSE40732 and GSE40888)
to construct the PPI network. In the PPI network, a total of 13496
nodes and 71275 relationship pairs were identified (Fig. 2A). F-box only protein 6 (FBXO6) and
histone deacetylase 1 (HDAC1) were hub genes and played an
important role in the process of asthma. Additionally, we performed
the topological centrality analysis of the network. The results
showed that there were significance differences between the DEGs in
NE and PB samples according to the degree, topological coefficient,
and closeness centrality analyses. The values of degree in NE
tissue were higher than that in PBMC tissue. The values of degree
and closeness centrality in PBMC tissue were higher than that in PB
tissue (Fig. 2C).
The DEGs related to asthma were downloaded from
DisGeNET databases (http://www.disgenet.org/web/DisGeNET/menu/home;jsessionid=mjbtjh4yncdzuqjlnk3rnvbn)
and a total of 1,403 DEGs were screened, including 104 DEGs
associated with asthma in children. We integrated the PPI
relationship pairs and constructed the PPI network related to
asthma, including 11,960 nodes and 61,164 relationship pairs
(Fig. 2B). Based on the topology
properties analysis (including degree, topological coefficient,
closeness centrality and betweenness centrality), we found that
there was no significant difference between childhood asthma DEGs
and other asthma DEGs (Fig.
2D).
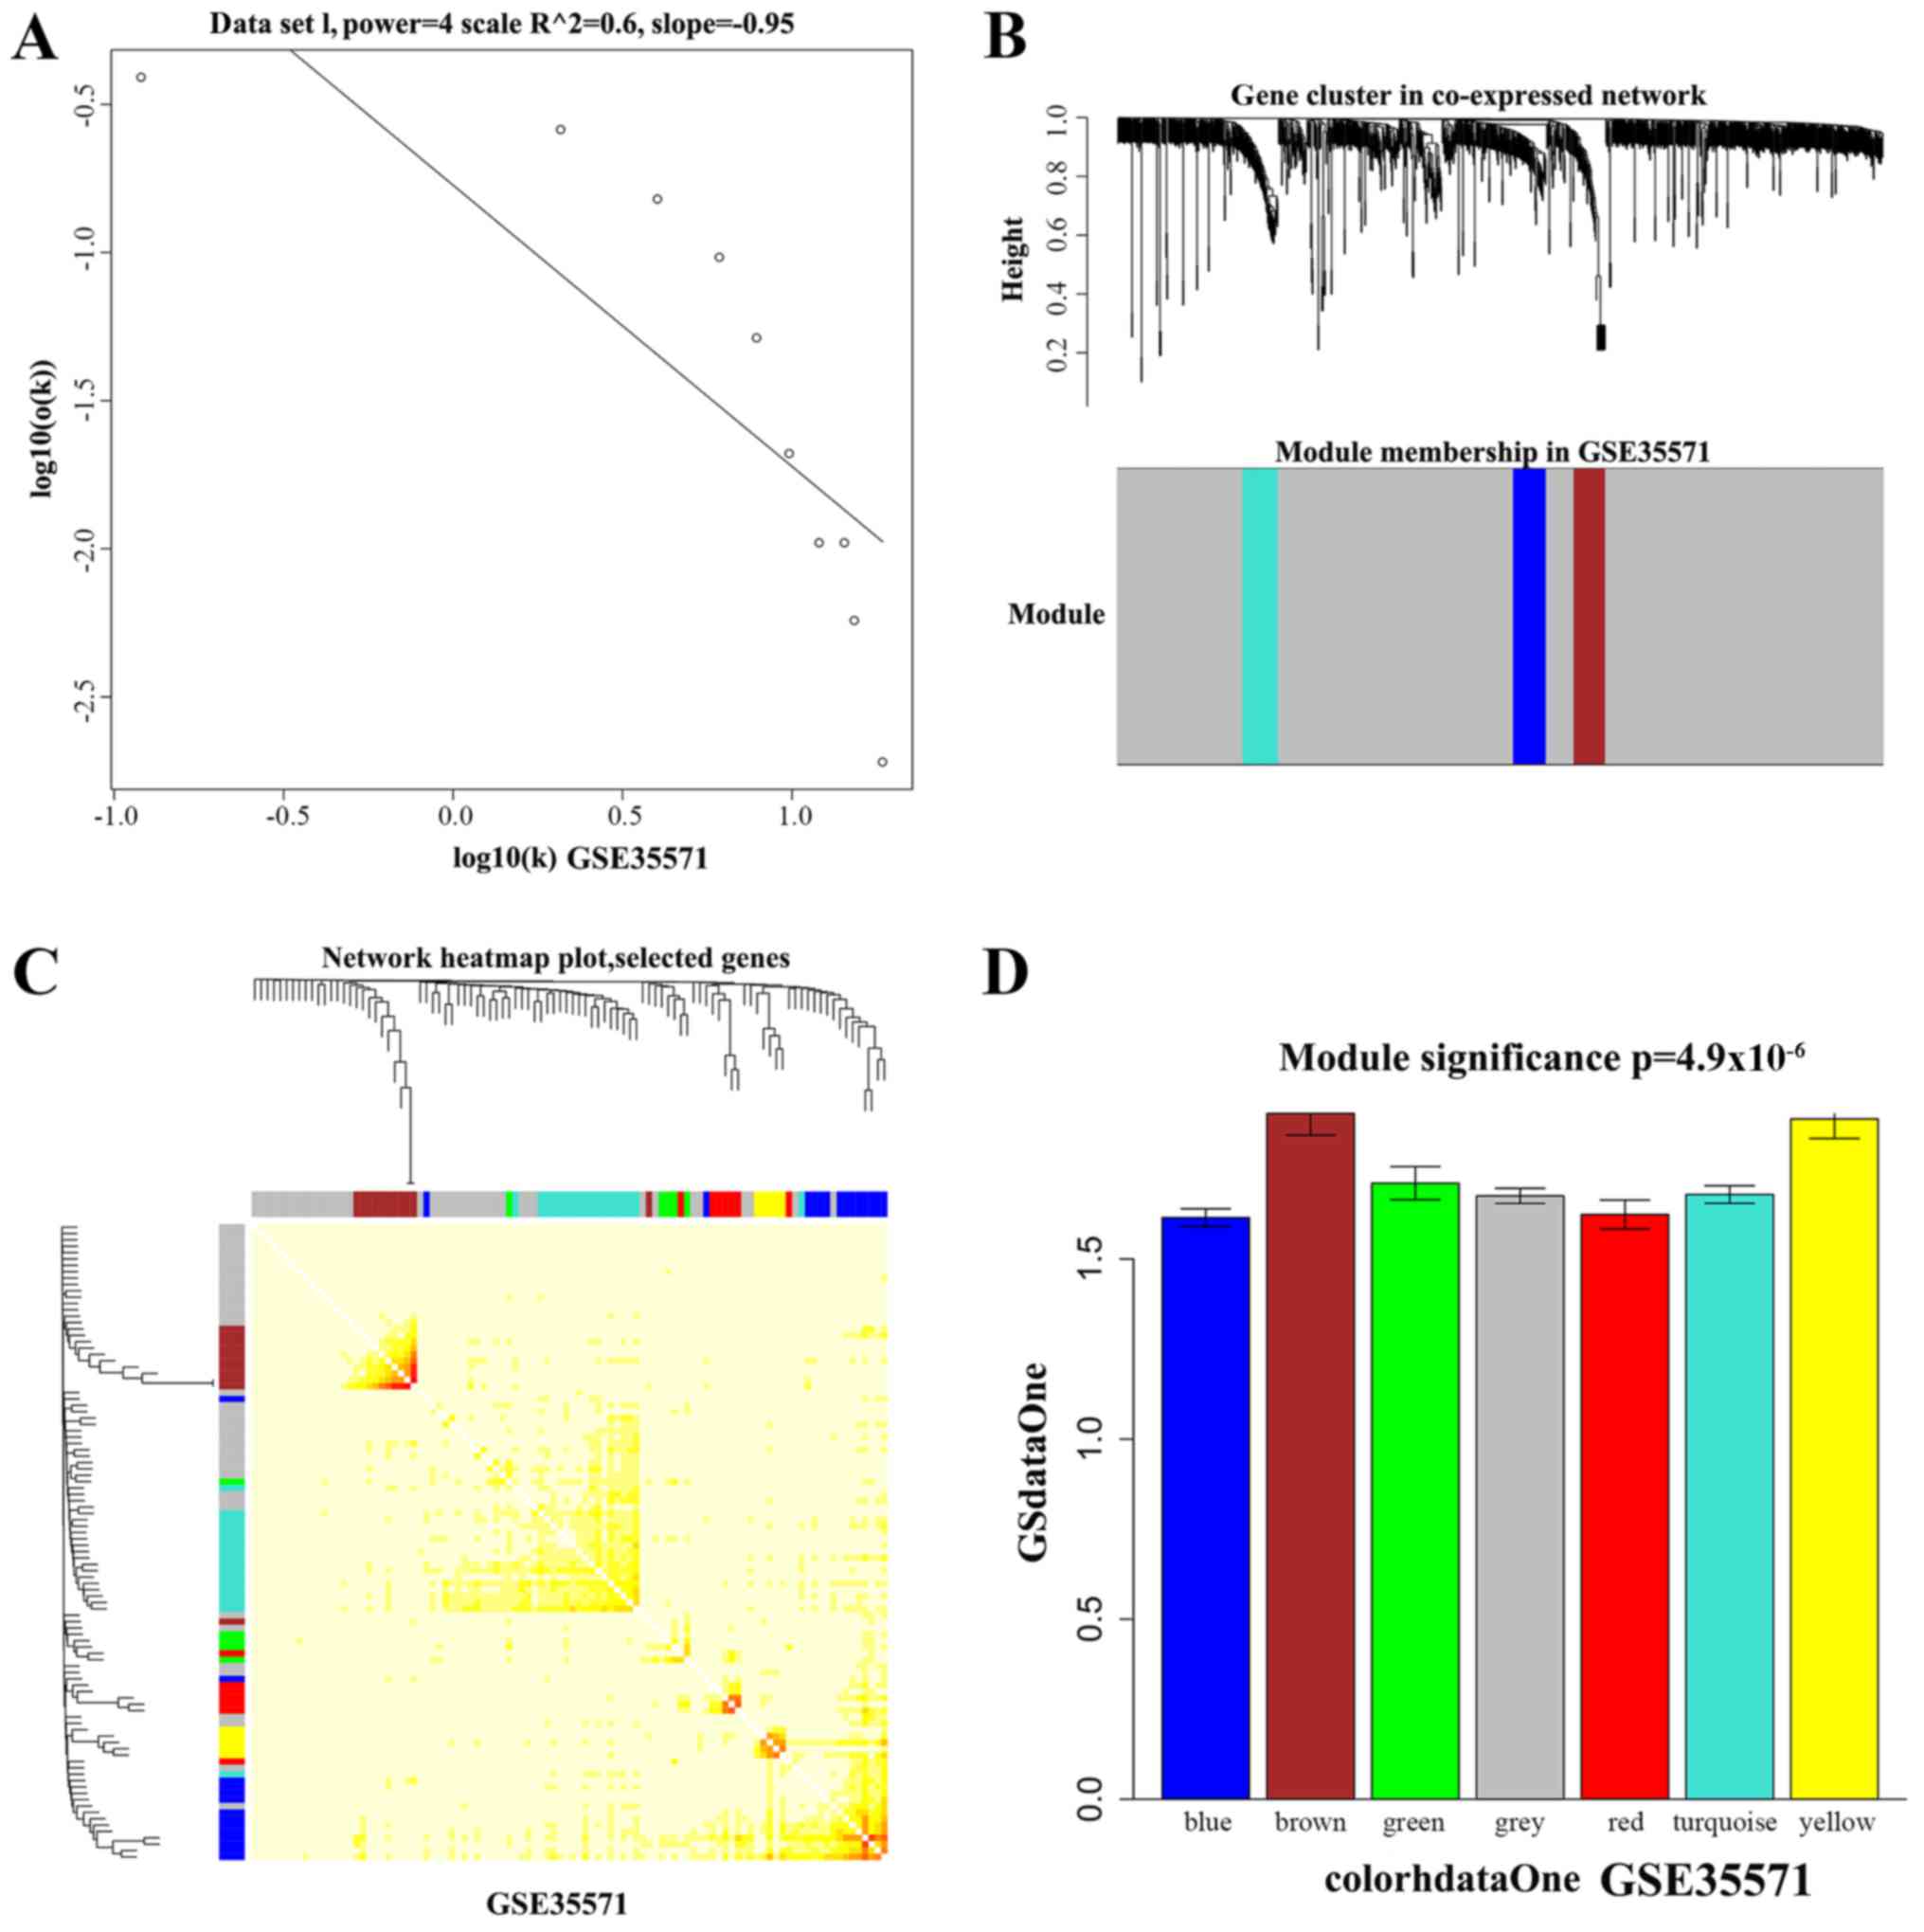
Gene co-expression network
analysis
The cuttee Static Color function in the WGCNA
package was used to mine the functional modules associated with
different tissues. The parameters were set as follows: The X-axis
represents gene degrees k, Y-axis represents the ratio of genes p
(k) (Fig. 3A). Hierarchical
cluster diagrams were used to visualize the functional modules
associated with different tissues (Fig. 3B). A total of 100 genes were
selected randomly from network modules and the correlation between
these genes were further investigated (Fig. 3C).
We analyzed the P-values of each DEG in the disease
groups and normal tissues. A higher degree indicated that the DEG
had greater connection with other genes and might play an important
role in the progression of asthma. K represents the degree of each
DEG in the modules. P-values represent the significance of each
DEG. The correlation between K values and -log10 (p) was
calculated. According to the GO and pathway analysis, we obtained
the functional modules related to different tissues. Fig. 3D showed functional modules of PB
tissue, and functional modules of other tissues were also obtained
with the same method (data not shown).
Two functional modules in the color of brown and
yellow were screened significantly associated with PB tissue;
modules of black and green were significantly related to NE tissue;
functional modules in the color of green and red were significantly
associated with PBMC tissue.
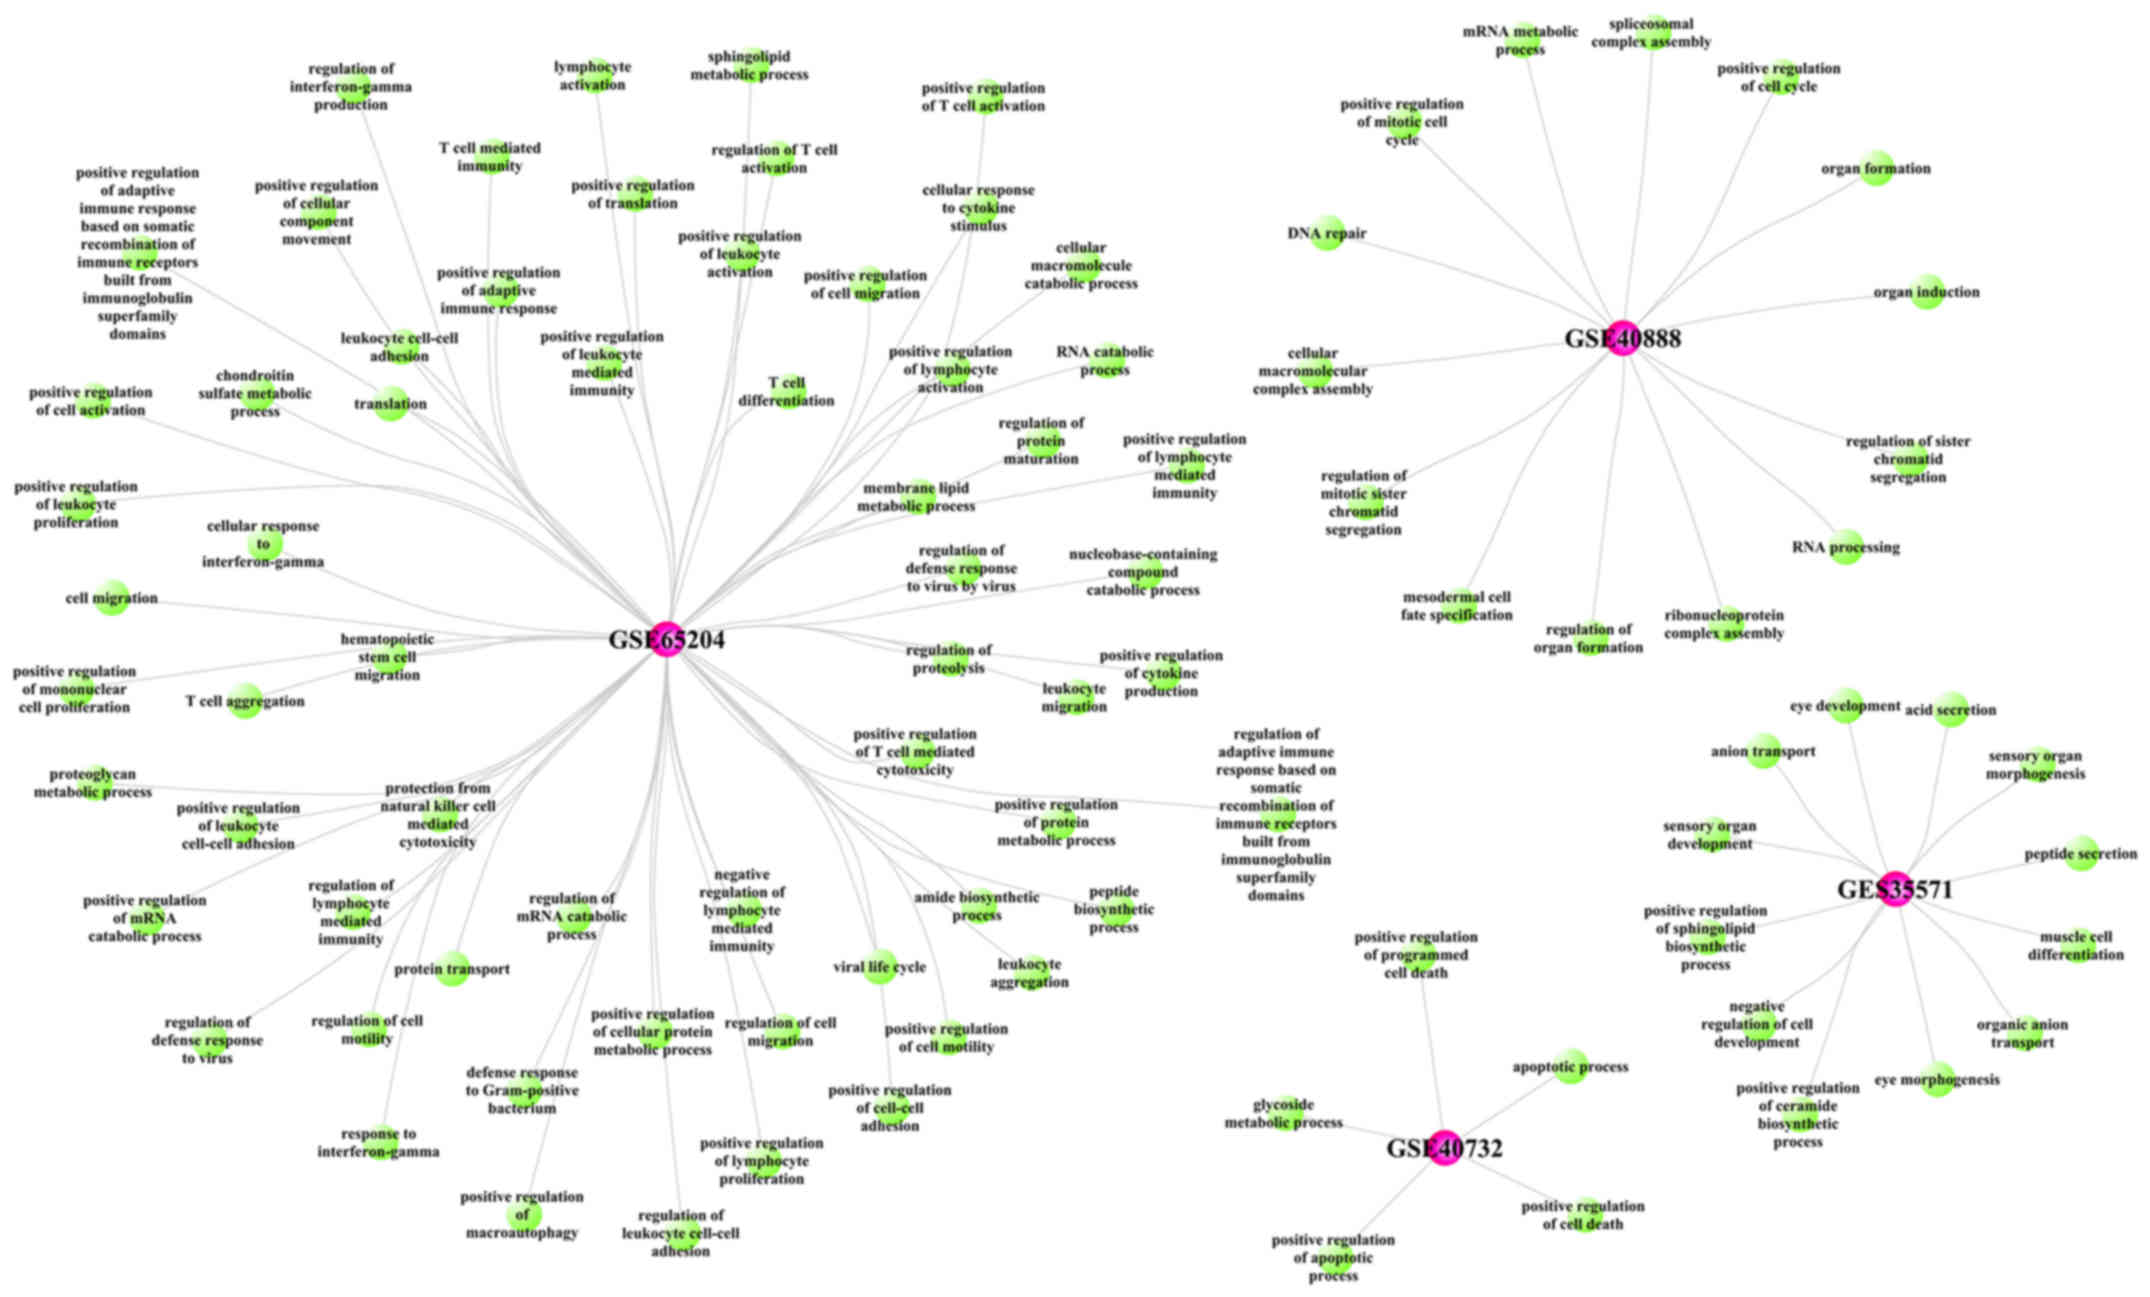
The GO biological process (BP) enrichment analysis
was performed to identify the function of DEGs associated with
different tissue in asthmatic children (Fig. 4). The GO functional analysis
results showed that the DEGs related to PB tissue were mainly
enriched in the processes of acid secretion, sensory organ
development and negative regulation of cell development, etc; the
DEGs related to NE tissue were mainly involved in the processes of
positive regulation of cell motility, and positive regulation of
cellular component movement; the DEGs in PBMC tissue were mainly
enriched in the processes of positive regulation of apoptotic
process, and organ induction.
Construction of regulatory
network
We constructed the regulatory network related to
DEGs in different tissues (Fig.
5). As for the PBMC tissue, we took the interaction of DEGs in
two databases to perform WGCNA analysis and the gene expression
profile of GSE40732 dataset were used to analysis the adjust
power.
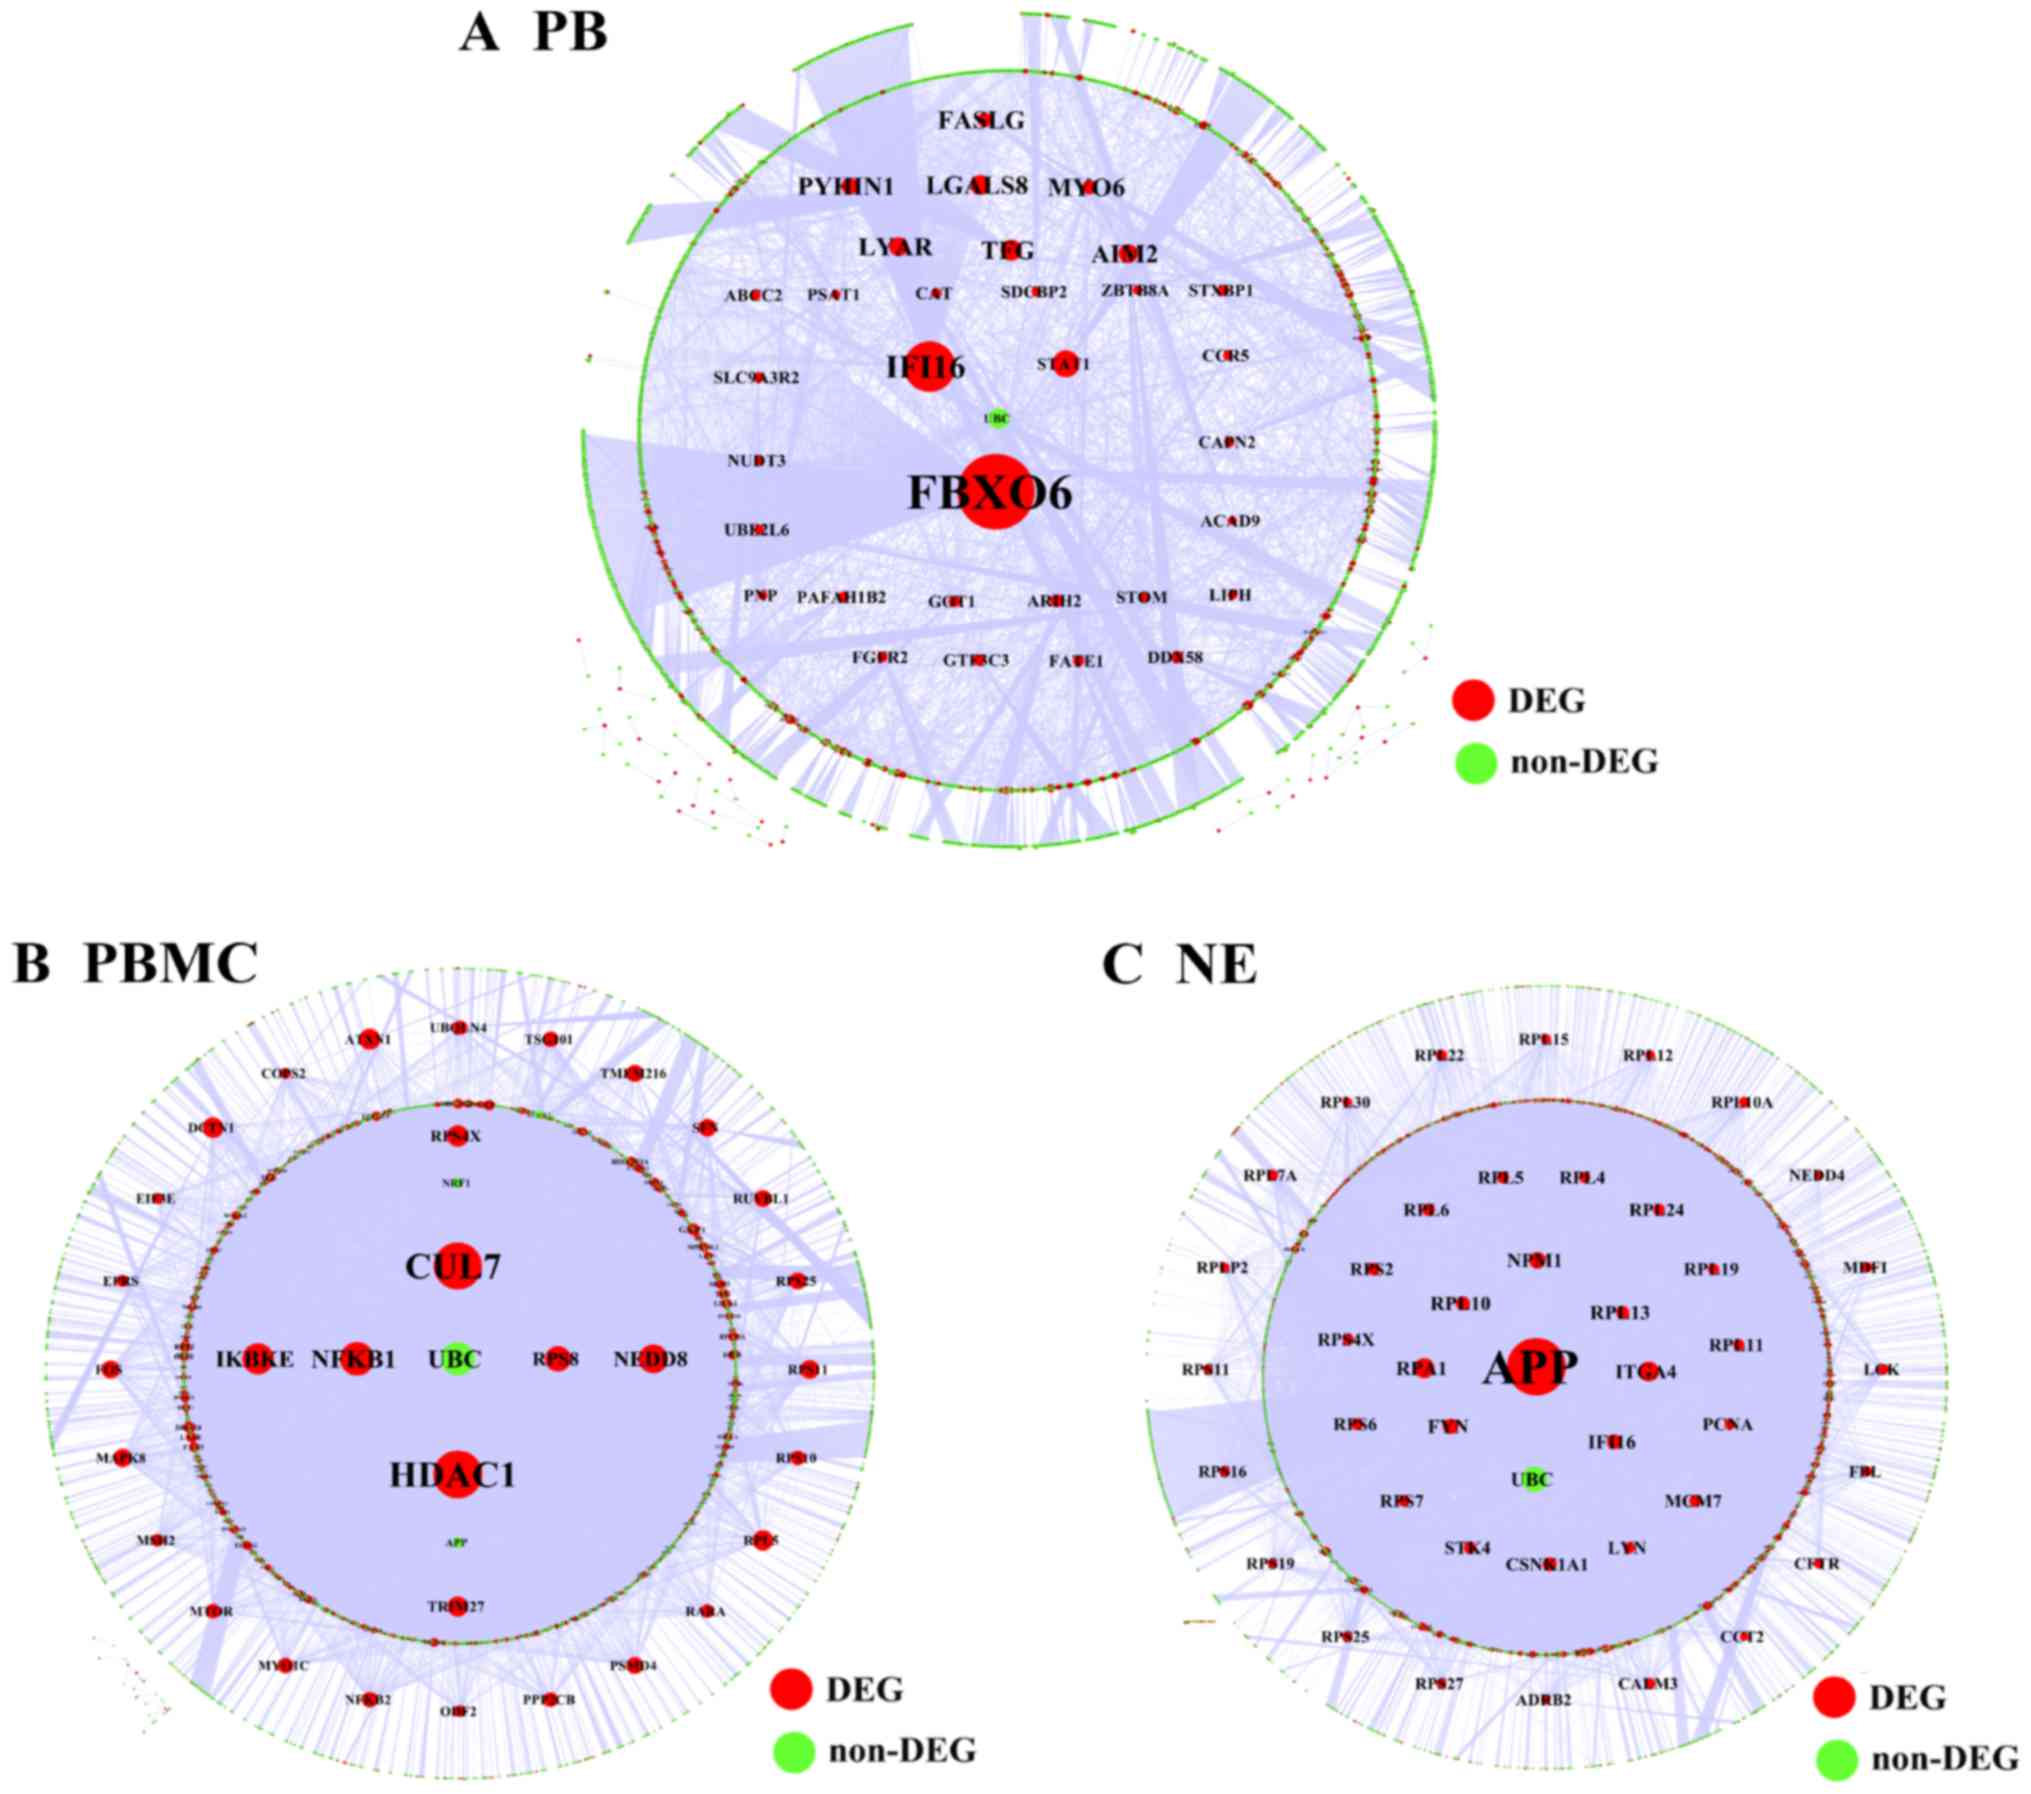
The results showed that FBXO6 was a hub gene
in the regulatory network associated with PB tissue, which included
3,670 nodes and 5,330 relationship pairs (Fig. 5A). HDAC1 and cullin-7
(CUL7) were hub genes in the regulatory network of PBMC
tissue, which included 6,803 nodes and 18,220 relationship pairs
(Fig. 5B). Additionally, the
regulatory network associated with NE tissue included 6,276 nodes
and 18,209 relationship pairs, and amyloid β precursor protein
(APP) was a hub gene (Fig.
5C).
GO and KEGG pathway analyses of DEGs
in regulatory network
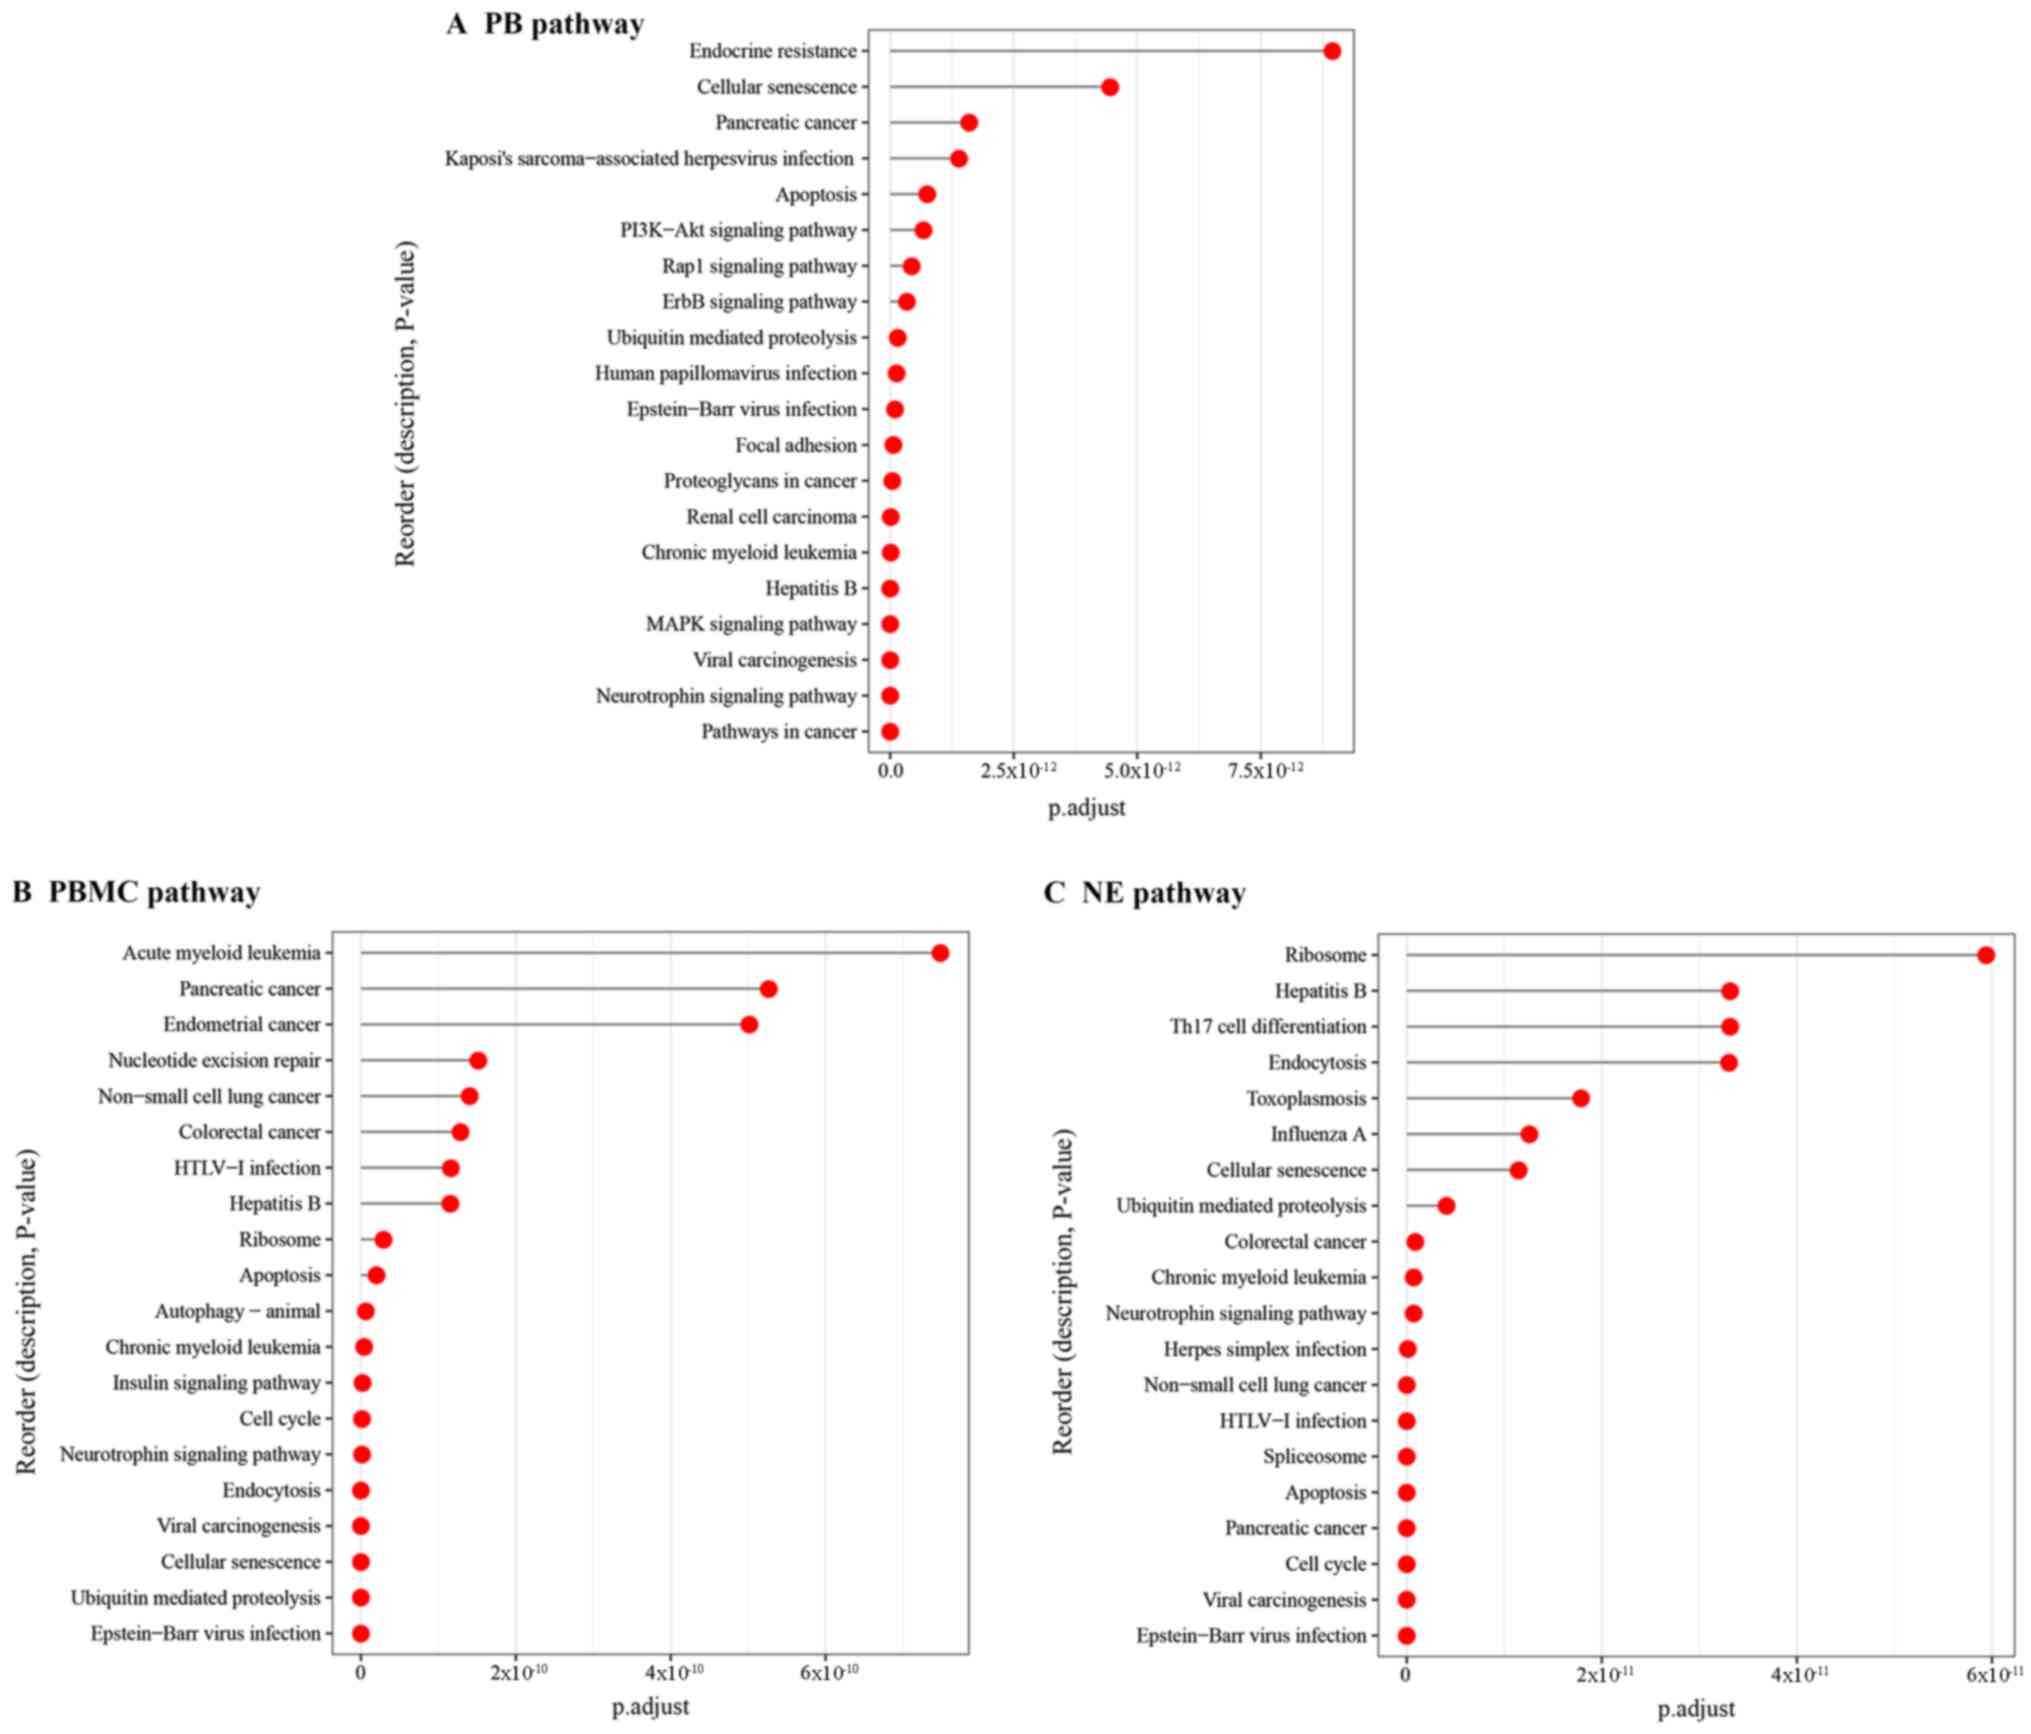
The pathway analysis results showed that the DEGs in
the PB tissue were mainly enriched in MAPK signaling pathway,
PI3K-Akt signaling pathway and neurotrophin signaling pathway, etc.
(Fig. 6A). As for the DEGs in the
PBMC tissue, the enriched pathways included neurotrophin signaling
pathway, and insulin signaling pathway, etc. (Fig. 6B). The DEGs in the NE tissue were
significantly enriched in ubiquitin mediated proteolysis, cell
cycle and neurotrophin signaling pathway (Fig. 6C).
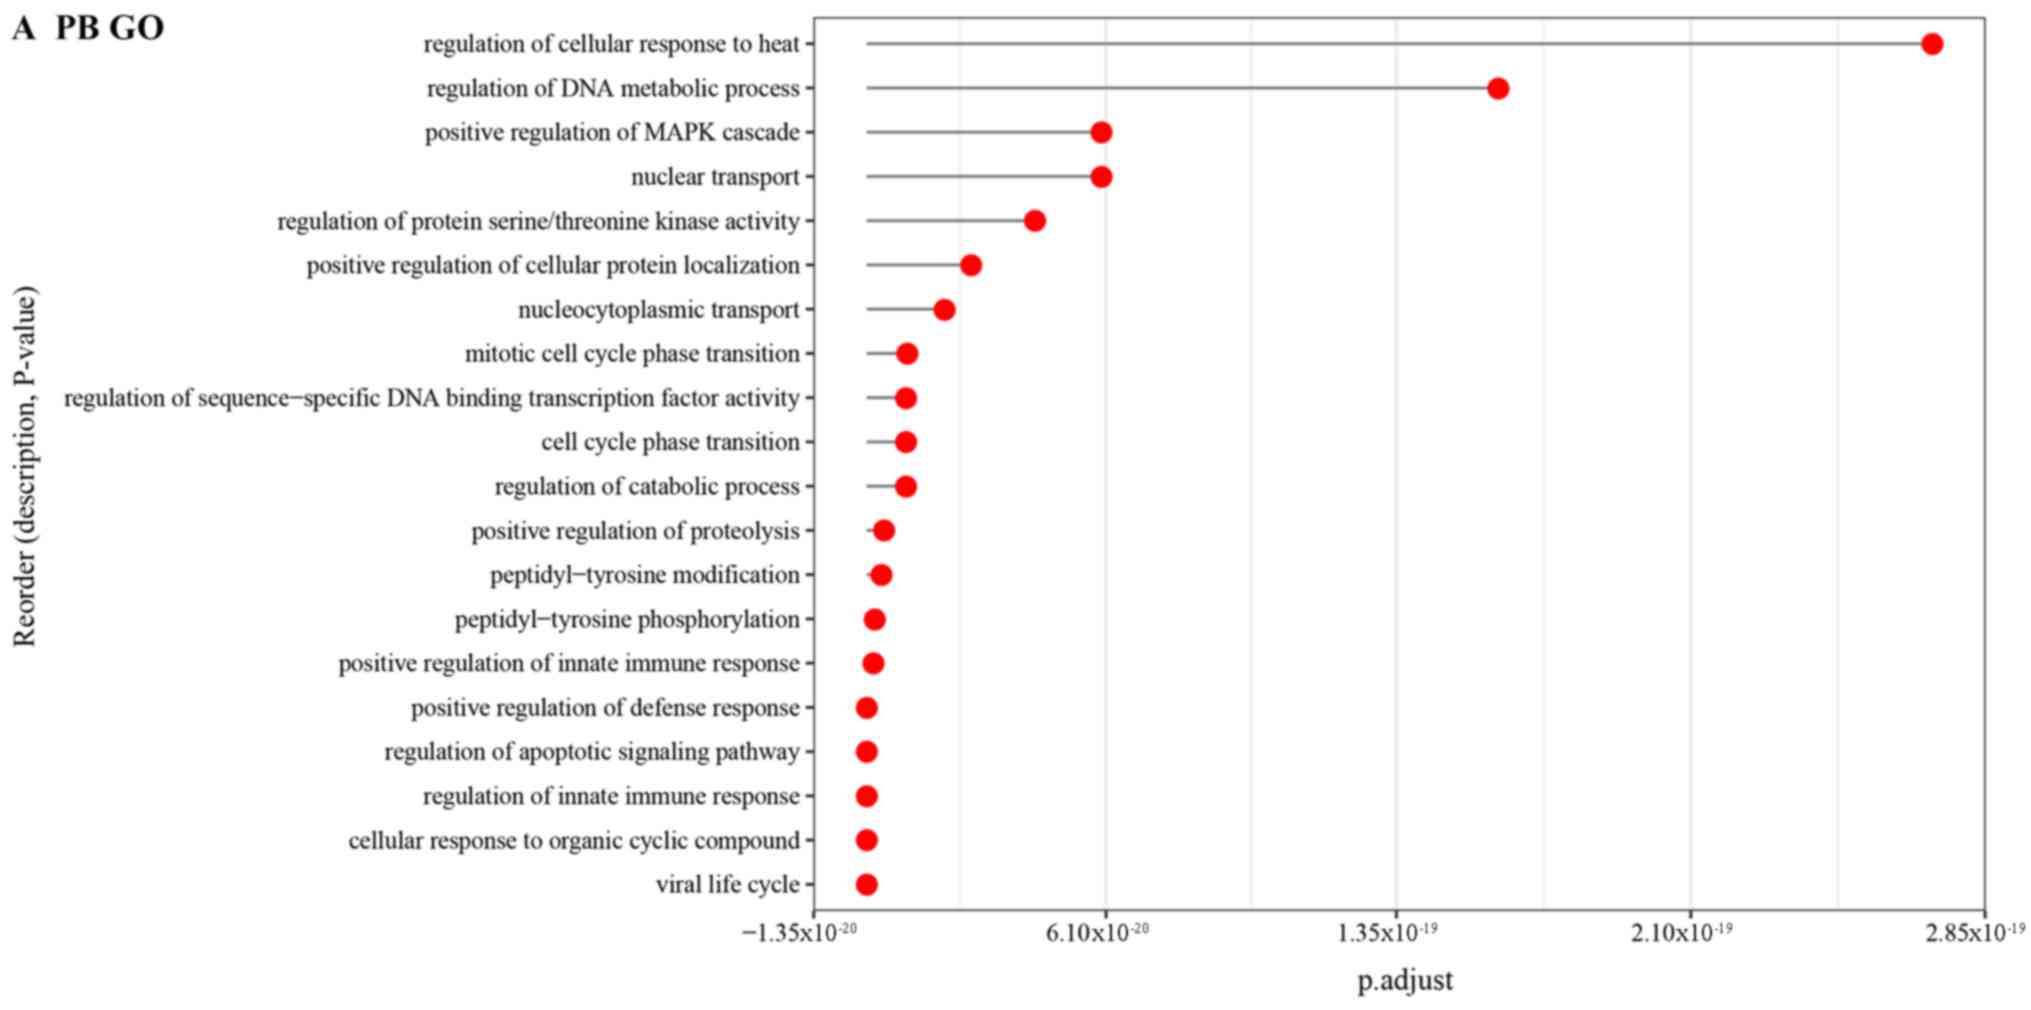
Moreover, the GO BP terms enriched by DEGs in PB
tissue were mainly associated with cellular response to organic
cyclic compound (Fig. 7A). As for
the DEGs in PBMC together with DEGs in NE tissue samples, the GO BP
terms were related to cell cycle phase transition (Fig. 7B and C).
Specific DEGs in the regulatory
network
The DEGs in the regulatory network were sequenced by
dDRg values and top 20 DEGs were selected (Table II). The results showed that
proliferating cell nuclear antigen (PCNA), integrin α-4 (ITGA4),
catenin α-1 (CTNNA1), nuclear factor-κB1 (NF-κB1) and mechanistic
target of rapamycin (MTOR) were specific DEGs that related to
asthma. Besides, these DEGs were also identified in DisGetNET
database associated with asthma. Our results indicated that PCNA,
ITGA4, CTNNA1, NF-κB1 and MTOR might be the potential genes related
to asthma in children.
| Table II.Top 20 nodes in the regulatory
network associated with the DEGs of asthmatic children. |
Table II.
Top 20 nodes in the regulatory
network associated with the DEGs of asthmatic children.
|
| NE Samples | PB Samples | PBMC samples |
|---|
|
|
|
|
|
|---|
| No. | DEG | dDRg | Label | DEG | dDRg | Label | DEG | dDRg | Label |
|---|
| 1 | APP | 202.5712 | No | FBXO6 | 42.82477 | No | HDAC1a | 106.7973 | Other asthma |
| 2 | SETDB1 |
78.09696 | No | ARIH2 | 36.51952 | No | RPS8 |
61.2846 | No |
| 3 | RPA1 |
68.47313 | No | IFI16 | 33.23794 | No | RPS11 |
58.52655 | No |
| 4 | STK4 |
66.04559 | No | PAFAH1B2 | 30.54515 | No | RPS4X |
39.92426 | No |
| 5 | NEDD4 |
61.91617 | No | TFG | 29.83253 | No | TRIM27 |
39.09394 | No |
| 6 | CSNK1A1 |
57.83066 | No | FGFR2 | 26.67677 | No | RPL5 |
35.9798 | No |
| 7 | EDC4 |
53.42212 | No | LGALS8 | 26.21989 | No | CUL7 |
29.2522 | No |
| 8 | CTDP1 |
49.7963 | No | NEK6 | 24.95025 | No | NEDD8 |
28.72204 | No |
| 9 | RPS2 |
43.28688 | No | LYAR | 22.42635 | No | RPS10 |
27.68076 | No |
| 10 | CALM3 |
41.95928 | No | SPINT2 | 19.52418 | No | RPS25 |
27.62278 | No |
| 11 | RPS7 |
40.06917 | No | GOT1 | 17.31375 | No | TMEM216 |
27.26486 | No |
| 12 | IFI16 |
39.24005 | No | MYO6 | 17.17874 | No | NFKB1a |
25.80718 | Other asthma |
| 13 | MID2 |
35.10338 | No | PELO | 16.25726 | No | RPL35A |
25.62394 | No |
| 14 | PCNAa |
32.54975 | Other asthma | PTK6 | 15.76188 | No | PSMD4 |
25.04536 | No |
| 15 | RPL10 |
30.89499 | No | CTNNA1a | 15.75888 | Other asthma | EIF3E |
19.85108 | No |
| 16 | RPS16 |
29.85522 | No | NTRK2 | 14.60812 | No | MTORa |
19.81246 | Other asthma |
| 17 | ITGA4a |
29.2464 | Other asthma | LIPH | 12.77759 | No | DDX24 |
19.53866 | No |
| 18 | MCM7 |
28.55749 | No | CA10 | 12.35675 | No | UBQLN4 |
19.34685 | No |
| 19 | SPTAN1 |
28.18446 | No | NUDT3 | 11.95574 | No | ATXN1 |
18.88822 | No |
| 20 | LZTS2 |
28.04549 | No | SLC9A3R2 | 11.93033 | No | IKBKE |
17.33138 | No |
Discussion
In the current study, we identified many DEGs from
three types of tissue samples, including 1,662 DEGs from NE tissue
samples, 572 DEGs from PB samples, and 146 DEGs from PBMC samples.
In PPI network, FBXO6, HDAC1 and APP were hub genes
and might play an important role in the process of asthma. In
addition, PCNA, ITGA4, CTNNA1, NF-κB1 and MTOR
might be critical DEGs related to asthma in children.
FBXO6 encodes a member of the F-box protein
family, which constitutes the subunit of ubiquitin protein ligase
complex called SKP1-cullin-F-box (SCFs) (14). Overexpression of F-box protein
FBXL19 can abrogate the inflammatory effects of IL-33
and lessen the severity of pulmonary inflammation in mouse models
of pneumonia (15). However, the
role of FBXO6 in asthma has not been reported. In our study,
we found that FBXO6 were hub gene in the PPI network.
Together with previous findings, we proposed that FBXO6
might relate to the inflammation in asthma.
HDAC1 is a member of HDAC family and
highly expressed in inflammation-related diseases, such as
arthritis (16). Deletion of
HDAC1 increased allergic airway inflammation and promoted
Th2 cytokine production in asthma mice, while asthmatic mice
treated with herbal extract can resulted in significant
anti-inflammatory and anti-allergic activity by increasing
expression level of alveolar macrophages HDAC1 (17). Recent study showed that a
polymorphism in the HDAC1 gene is associated with the
response to corticosteroids in asthmatics (18). Our study revealed that HDAC1
was a hub gene in the PPI network and might play an important role
in the process of asthma, which was consisting with previous
studies. PCNA served as a factor to coordinate DNA
replication and epigenetic inheritance, such as DNA methylation
(19). A study showed that
PCNA interacted with HDAC1 in human cells in
vitro can co-localize in the cell nucleus, and finally led to
integration of DNA replication (20). DNA methylation changes in PB were
associated with childhood allergic asthma (9). These finding indicated that
PCNA interacted with HDAC1 might involve in DNA
methylation of asthma in children. In addition, a previous study
showed that PCNA expression was associated with the
epithelium thickness in corticosteroid-dependent asthma (21). The cell proliferation related
molecule PCNA and cell activation related molecule
NF-κB were both highly expressed in
corticosteroid-dependent asthmatic subjects (21), revealing the potential role in the
treatment and disease epithelium repair.
ITGA4 is also named as CD49d. A study
reported that up-regulation of lysophosphatidic acid receptor 1 and
down-regulation of ITGA4 can increase the number of
monocytes in the PB and finally impact on immune function (22). However, the relationships between
ITGA4 and asthma disease were unclear. The PPI network
analysis in our study revealed that ITGA4 might be a major
factor related to asthma in children. CTNNA1 is also known
as αE-catenin, and it plays a major role in epithelial tissue, both
at adherent junctions and in signaling pathways (23). Epithelial damage from airway
inflammation during asthma may result in immune response to
self-antigens, including αE-catenin and epidermal group
factor receptor (EGFR); and finally contributes to the
pathogenesis of asthma (24).
Moreover, a replication study in a Caucasian worker population
revealed that α-catenin gene variants were also associated with
diisocyanate asthma (25). These
results suggested that CTNNA1 might be critical gene that
regulated the progressive of asthma in children.
MTOR is a serine/threonine kinase that is
evolutionary conserved and can regulate lymphocyte cellular
immunity by activating cytokine secreted from inflammatory cells
(26). MTORC2 regulated the
differentiation of naive CD4+ T cells into Th9 cells, and
mTORC2 deficiency in T cells could result in less severe
inflammation in the murine allergic airway inflammation model
(27). Zhang et al
(28) revealed that increased
serum mTOR pathway activation can lead to elevated levels of
Th17 cells and IL-4, following decreased Treg cells and IFN-γ. Our
study demonstrated a clear relationship between MTOR in the
PBMC of childhood patients with allergic asthma. These findings
strongly suggested a necessary for mTOR pathway activation
in asthma process. In addition, NF-κB1 is reported as
a transcription factor that is activated by multiple intra-cellular
and extra-cellular stimuli such as cytokines, oxidant-free
radicals, and bacterial or viral products (29). Activated NF-κB can
stimulate the expression of genes involved in many biological or
pathological processes, including acute lung injury/acute
respiratory distress syndrome and asthma. Recent study showed that
the over-expression of PI3K and NF-κB in
childhood asthma were negatively correlated with pulmonary
functions, which indicated that PI3K and NF-κB
might involve in the development of bronchial asthma in children
(30). Inhibition of the
NF-κB signaling pathway can improve airway
inflammation in an ovalbumin-induced rat model (31). In our study, we also found that the
NF-κB1 and mTOR were hub genes related to
asthma in children. Considering the previous studies, we suggested
that NF-κB1 interacted with mTOR might play an
important role in the progression of asthma in children, such as
inflammation in asthma. Additionally, a study of asthmatic mouse
model indicated that mTOR is activated during asthma onset and
inhibited during asthma remission, and blocking the mTOR pathway in
asthmatic mice restores the Th17/Treg and Th1/Th2 cytokines
balances (28). These findings
strongly documented a critical role of mTOR pathway activation in
asthma onset, revealing potential targets for asthma
treatments.
Using the network analysis, we also identified
APP hitherto not associated with asthma as important hub
gene in regulatory network associated with NE tissue. APP
gene encoding the amyloid beta precursor protein is known as a
major player in Alzheimer's disease (AD) that have immune and
inflammatory components (32).
Recent studies also suggested a link between APP and asthma
genes (32,33). It is revealed that APP was
potentially associated with airway hyperresponsiveness through the
interaction with a disintegrin and metalloproteinase
(ADAM33) (33).
ADAM33 is an asthma susceptibility gene with catalytic
properties, functioned as a negative regulator of APP
(34). In our module, APP
was found potentially interacted with other asthma genes, it is
speculated that these possible connections can provide new insights
for exploring the functional role and relationships of these genes
in asthma, as well as in AD.
In conclusion, our findings suggest that genes are
differentially expressed in the three type tissue samples of
asthmatic children, including NE, PB and PBMC samples. Among these
DEGs, FBXO6, HDAC1 and APP interact with PCNA,
ITGA4, CTNNA1, NF-κB1 and mTOR might be critical
DEGs related to asthma in children.
Acknowledgements
Not applicable.
Funding
The present study was supported by The Science and
Technology Development Fund of Fengxian District, Shanghai (grant
no. 20151236).
Availability of data and materials
All data generated or analyzed during this study are
included in this published article.
Authors' contributions
GW and CW conceived and designed the present study.
CW, HL and LC conducted the data analysis. CW and GW prepared the
manuscript. All of the authors reviewed the manuscript.
Ethics approval and consent to
participate
Not applicable.
Consent for publication
Not applicable.
Competing interests
The authors declare that they have no competing
interests.
References
|
1
|
U.S. Department of Health and Human
Services, Centers for Disease Control and Prevention and National
Center for Health Statistics: Tables of Summary Health Statistics:
National Health Interview Survey. Table C-1b. 3–4. 2016.
|
|
2
|
James CV and Rosenbaum S: Paying for
quality care: Implications for racial and ethnic health disparities
in pediatric asthma. Pediatrics. 123 Suppl 3:S205–S210. 2009.
View Article : Google Scholar : PubMed/NCBI
|
|
3
|
Lin HW and Lin SC: Environmental factors
association between asthma and acute bronchiolitis in young
children-a perspective cohort study. Eur J Pediatr. 171:1645–1650.
2012. View Article : Google Scholar : PubMed/NCBI
|
|
4
|
Martinez FD: Genes, environments,
development and asthma: A reappraisal. Eur Respir J. 29:179–184.
2007. View Article : Google Scholar : PubMed/NCBI
|
|
5
|
Goetghebuer T, Isles K, Moore C, Thomson
A, Kwiatkowski D and Hull J: Genetic predisposition to wheeze
following respiratory syncytial virus bronchiolitis. Clin Exp
Allergy. 34:801–803. 2004. View Article : Google Scholar : PubMed/NCBI
|
|
6
|
Finkelstein Y, Bournissen FG, Hutson JR
and Shannon M: Polymorphism of the ADRB2 gene and response to
inhaled beta-agonists in children with asthma: A meta-analysis. J
Asthma. 46:900–905. 2009. View Article : Google Scholar : PubMed/NCBI
|
|
7
|
Wills-Karp M: Immunologic basis of
antigen-induced airway hyperresponsiveness. Annu Rev Immunol.
17:255–281. 1999. View Article : Google Scholar : PubMed/NCBI
|
|
8
|
Yang IV, Pedersen BS, Liu AH, O'Connor GT,
Pillai D, Kattan M, Misiak RT, Gruchalla R, Szefler SJ, Hershey
Khurana GK, et al: The nasal methylome and childhood atopic asthma.
J Allergy Clin Immunol. 139:1478–1488. 2017. View Article : Google Scholar : PubMed/NCBI
|
|
9
|
Yang IV, Pedersen BS, Liu A, O'Connor GT,
Teach SJ, Kattan M, Misiak RT, Gruchalla R, Steinbach SF, Szefler
SJ, et al: DNA methylation and childhood asthma in the inner city.
J Allergy Clin Immunol. 136:69–80. 2015. View Article : Google Scholar : PubMed/NCBI
|
|
10
|
Raedler D, Ballenberger N, Klucker E, Böck
A, Otto R, da Costa Prazeres O, Holst O, Illig T, Buch T, von
Mutius E and Schaub B: Identification of novel immune phenotypes
for allergic and nonallergic childhood asthma. J Allergy Clin
Immunol. 135:81–91. 2015. View Article : Google Scholar : PubMed/NCBI
|
|
11
|
Williams-DeVane CR, Reif DM, Hubal EC,
Bushel PR, Hudgens EE, Gallagher JE and Edwards SW: Decision
tree-based method for integrating gene expression, demographic, and
clinical data to determine disease endotypes. BMC Syst Biol.
7:1192013. View Article : Google Scholar : PubMed/NCBI
|
|
12
|
Ritchie ME, Phipson B, Wu D, Hu Y, Law CW,
Shi W and Smyth GK: Limma powers differential expression analyses
for RNA-sequencing and microarray studies. Nucleic Acids Res.
43:e472015. View Article : Google Scholar : PubMed/NCBI
|
|
13
|
Langfelder P and Horvath S: WGCNA: An R
package for weighted correlation network analysis. BMC
Bioinformatics. 9:5592008. View Article : Google Scholar : PubMed/NCBI
|
|
14
|
Chen X, Duan LH, Luo PC, Hu G, Yu X, Liu
J, Lu H and Liu B: FBXO6-mediated ubiquitination and degradation of
Ero1L inhibits endoplasmic reticulum stress-induced apoptosis. Cell
Physiol Biochem. 39:2501–2508. 2016. View Article : Google Scholar : PubMed/NCBI
|
|
15
|
Zhao J, Wei J, Mialki RK, Mallampalli DF,
Chen BB, Coon T, Zou C, Mallampalli RK and Zhao Y: F-box protein
FBXL19-mediated ubiquitination and degradation of the receptor for
IL-33 limits pulmonary inflammation. Nat Immunol. 13:651–658. 2012.
View Article : Google Scholar : PubMed/NCBI
|
|
16
|
Cantley MD, Fairlie DP, Bartold PM, Marino
V, Gupta PK and Haynes DR: Inhibiting histone deacetylase 1
suppresses both inflammation and bone loss in arthritis.
Rheumatology (Oxford). 54:1713–1723. 2015. View Article : Google Scholar : PubMed/NCBI
|
|
17
|
Grausenburger R, Bilic I, Boucheron N,
Zupkovitz G, El-Housseiny L, Tschismarov R, Zhang Y, Rembold M,
Gaisberger M, Hartl A, et al: Conditional deletion of histone
deacetylase 1 in T cells leads to enhanced airway inflammation and
increased Th2 cytokine production. J Immunol. 185:3489–3497. 2010.
View Article : Google Scholar : PubMed/NCBI
|
|
18
|
Kim MH, Kim SH, Kim YK, Hong SJ, Min KU,
Cho SH and Park HW: A polymorphism in the histone deacetylase 1
gene is associated with the response to corticosteroids in
asthmatics. Korean J Intern Med. 28:708–714. 2013. View Article : Google Scholar : PubMed/NCBI
|
|
19
|
Chuang LS, Ian HI, Koh TW, Ng HH, Xu G and
Li BF: Human DNA-(cytosine-5) methyltransferase-PCNA complex as a
target for p21WAF1. Science. 277:1996–2000. 1997. View Article : Google Scholar : PubMed/NCBI
|
|
20
|
Milutinovic S, Zhuang Q and Szyf M:
Proliferating cell nuclear antigen associates with histone
deacetylase activity, integrating DNA replication and chromatin
modification. J Biol Chem. 277:20974–20978. 2002. View Article : Google Scholar : PubMed/NCBI
|
|
21
|
Vignola AM, Chiappara G, Siena L, Bruno A,
Gagliardo R, Merendino AM, Polla BS, Arrigo AP, Bonsignore G,
Bousquet J and Chanez P: Proliferation and activation of bronchial
epithelial cells in corticosteroid-dependent asthma. J Allergy Clin
Immunol. 108:738–746. 2001. View Article : Google Scholar : PubMed/NCBI
|
|
22
|
Maugeri N, Powell JE, t Hoen PA, de Geus
EJ, Willemsen G, Kattenberg M, Henders AK, Wallace L, Penninx B,
Hottenga JJ, et al: LPAR1 and ITGA4 regulate peripheral blood
monocyte counts. Hum Mutat. 32:873–876. 2011. View Article : Google Scholar : PubMed/NCBI
|
|
23
|
Herrenknecht K, Ozawa M, Eckerskorn C,
Lottspeich F, Lenter M and Kemler R: The uvomorulin-anchorage
protein alpha catenin is a vinculin homologue. Proc Natl Acad Sci
USA. 88:9156–9160. 1991. View Article : Google Scholar : PubMed/NCBI
|
|
24
|
Liu M, Subramanian V, Christie C, Castro M
and Mohanakumar T: Immune responses to self-antigens in asthma
patients: Clinical and immunopathological implications. Hum
Immunol. 73:511–516. 2012. View Article : Google Scholar : PubMed/NCBI
|
|
25
|
Bernstein DI, Kashon M, Lummus ZL, Johnson
VJ, Fluharty K, Gautrin D, Malo JL, Cartier A, Boulet LP, Sastre J,
et al: CTNNA3 (α-catenin) gene variants are associated with
diisocyanate asthma: A replication study in a Caucasian worker
population. Toxicol Sci. 131:242–246. 2013. View Article : Google Scholar : PubMed/NCBI
|
|
26
|
Wullschleger S, Loewith R and Hall MN: TOR
signaling in growth and metabolism. Cell. 124:471–484. 2006.
View Article : Google Scholar : PubMed/NCBI
|
|
27
|
Chen H, Zhang L, Wang P, Su H, Wang W, Chu
Z, Zhang L, Zhang X and Zhao Y: mTORC2 controls Th9 polarization
and allergic airway inflammation. Allergy. 72:1510–1520. 2017.
View Article : Google Scholar : PubMed/NCBI
|
|
28
|
Zhang Y, Jing Y, Qiao J, Luan B, Wang X,
Wang L and Song Z: Activation of the mTOR signaling pathway is
required for asthma onset. Sci Rep. 7:45322017. View Article : Google Scholar : PubMed/NCBI
|
|
29
|
Meyer R, Hatada EN, Hohmann HP, Haiker M,
Bartsch C, Röthlisberger U, Lahm HW, Schlaeger EJ, van Loon AP and
Scheidereit C: Cloning of the DNA-binding subunit of human nuclear
factor kappa B: The level of its mRNA is strongly regulated by
phorbol ester or tumor necrosis factor alpha. Proc Natl Acad Sci
USA. 88:966–970. 1991. View Article : Google Scholar : PubMed/NCBI
|
|
30
|
Shi HL, Liu JB and Lu AP: Expression
profiles of PI3K, NF-κB, and STAT1 in peripheral blood mononuclear
cells in children with bronchial asthma. Zhongguo Dang Dai Er Ke Za
Zhi. 18:614–617. 2016.(In Chinese). PubMed/NCBI
|
|
31
|
Li Z, Zheng J, Zhang N and Li C: Berberine
improves airway inflammation and inhibits NF-κB signaling pathway
in an ovalbumin-induced rat model of asthma. J Asthma. 53:999–1005.
2016. View Article : Google Scholar : PubMed/NCBI
|
|
32
|
Liu Y, Brossard M, Sarnowski C, Vaysse A,
Moffatt M, Margaritte-Jeannin P, Llinares-López F, Dizier MH,
Lathrop M, Cookson W, et al: Network-assisted analysis of GWAS data
identifies a functionally-relevant gene module for childhood-onset
asthma. Sci Rep. 7:9382017. View Article : Google Scholar : PubMed/NCBI
|
|
33
|
Vishweswaraiah S, Veerappa AM, Mahesh PA,
Jayaraju BS, Krishnarao CS and Ramachandra NB: Molecular
interaction network and pathway studies of ADAM33 potentially
relevant to asthma. Ann Allergy Asthma Immunol. 113:418–424.e1.
2014. View Article : Google Scholar : PubMed/NCBI
|
|
34
|
Zou J, Zhu F, Liu J, Wang W, Zhang R,
Garlisi CG, Liu YH, Wang S, Shah H, Wan Y and Umland SP: Catalytic
activity of human ADAM33. J Biol Chem. 279:9818–9830. 2004.
View Article : Google Scholar : PubMed/NCBI
|