Introduction
Prostate carcinoma is an adenocarcinoma arising from
the peripheral zone of the prostate gland and is common in elderly
men, with an average onset age of 72 years (1,2).
Pathological types of prostate carcinoma include adenocarcinoma,
duct adenocarcinoma, urothelial cancer, epidermoid carcinoma and
adenosquamous carcinoma (3). The
growth rate of prostate carcinoma is variable (4). Metastasized prostate cancer is
incurable with the current therapies, and median survival is
generally 1–3 years (5). A deep
understanding of the molecular mechanism underlying prostate
carcinoma development may facilitate the design of novel strategies
for the treatment of this disease.
The development and growth of prostate cancer
depends on the androgen receptor (AR) protein, which is the
intracellular mediator of androgen action. Aberrant activation of
AR contributes to the progression of prostate carcinoma to an
androgen-independent stage (6).
Previous studies have reported that interfering with the synthesis
of AR in cancer tissues may control cell differentiation and
effectively induce apoptosis in prostate cancer (7,8).
Increased AR expression has been demonstrated to be associated with
the development of hormone refractory prostate cancer (9). As a transcriptional coactivator of
AR, coactivator-associated arginine methyltransferase 1 is
upregulated in prostate carcinoma, and it may be a novel
therapeutic target in hormone-independent prostate carcinoma
(10). Interleukin 6 may promote
the progression of androgen-independent prostate cancer by
facilitating AR expression and activating AR (11,12).
However, the molecular events underlying prostate cancer
development are largely unknown.
Genome-wide measurements of protein-DNA interactions
and the transcriptome are increasingly being performed using deep
DNA sequencing methods [chromatin immunoprecipitation sequencing
(ChIP-Seq) and RNA sequencing (RNA-seq)] (13). In a previous study, He et al
(14) developed and analyzed DNAse
sequencing (DNase-seq) dataset GSE33216, and demonstrated that AR
and estrogen receptor-α had distinct modes of interaction with
chromatin, and that DNase I hypersensitivity dynamics provided a
general approach for predicting cell-type specific cistromes. Hu
et al (15) identified 320
differentially expressed genes (DEGs) between prostate cancer
samples and normal controls by generating RNA-seq dataset GSE22260.
However, there has been no integrated analysis of DNase-seq and
RNA-seq data, to the best of our knowledge. Therefore, the above
DNase-seq and RNA-seq data was downloaded in the present study, and
integrated analysis was performed to further examine the open
chromosomal regions adjacent to the promoters of the abnormal genes
and the corresponding transcriptional regulatory elements that were
associated with prostate cancer development. The influences of AR
activation on chromosome structure were assessed in prostate
carcinoma cells, based on the public DNase-seq data. Potential
functions of open chromosomal regions with dynamic alterations were
annotated. In addition, combined with the public RNA-seq data,
every open chromosomal region adjacent to the promoter of an
abnormal gene was detected. Finally, transcriptional regulatory
elements crucial to the development of prostate carcinoma were
analyzed. The present study may provide fundamental data on the
pathogenic mechanisms of prostate carcinoma, and the predicted
regulatory elements may be novel targets for the treatment of this
disease.
Materials and methods
Data sources
The DNase-seq data GSE33216 (14) were downloaded from the Gene
Expression Omnibus (GEO) database (www.ncbi.nlm.nih.gov/geo) of the National Center for
Biotechnology Information (NCBI), including DNase-seq data for
LNCaP cells prior to (GSM822387) and following (GSM822388)
stimulation with androgen. To generate this dataset,
androgen-dependent LNCaP prostate cancer cells were maintained in
RPMI-1640 medium containing 10% fetal bovine serum (FBS). LNCaP
cells were starved in phenol-red-free medium containing 10%
charcoal-stripped FBS for 3 days and subsequently treated with 10
nM active androgen 5α-dihydrotestosterone (DHT) or ethanol for 4 h
(14). This dataset was sequenced
on an Illumina HiSeq2000 system (Illumina, Inc., San Diego, CA,
USA) using single-end sequencing.
The RNA-seq data GSE22260 (15) were additionally downloaded from the
NCBI GEO database, including four prostate cancer samples
(GSM554078, GSM554082, GSM554086 and GSM554088) and four matched
normal prostate samples surrounding prostate tumor tissues
(GSM554118, GSM554120, GSM554122 and GSM554124). The RNA-seq data
were sequenced on the platform Illumina GA II (Illumina, Inc.)
using paired-end sequencing.
Data processing
All DNase-seq data were mapped to the reference
human genome (hg19) of the University of California, Santa Cruz
(genome.ucsc.edu) using Bowtie 0.12.9 (16). Each read had a unique align
position and no more than two mismatches. Other parameters were the
default settings. Reads that met the above conditions were
extracted.
All RNA-seq data were aligned using Tophat software
(version 1.3.1) (17). For each
read with a unique align position, mismatches of ≤2 bases were
permitted. Other parameters were set to the default. Following read
alignment, based on the gene annotation data of the Reference
Sequence database (www.ncbi.nlm.nih.gov/RefSeq), transcripts were
assembled using Cufflinks (version 1.0.3) (18) and their expression levels were
calculated using the fragments per kilobase per million reads
method in Cuffdiff (version 2.1.1) (18).
Genome-wide detection of DNase I
hypersensitive sites (DHS)
All polymerase chain reaction (PCR) duplicates were
removed using SAMtools (version 0.1.19) (19). For multireads aligned with the same
chromosome site, truncation was performed and only one read was
allowed in one align position. Subsequently, peak calling was
performed on processed reads via Model-based Analysis of ChIP-Seq
(MACS 1.4.0) (20). A P-value
<10-5 was set as the cut-off criterion.
Dynamically altered DHS among
samples
All detected DHS were integrated. Subsequently,
reads enriched in peak regions were normalized using the random
particle-mesh method (21), to
eliminate the bias caused by the length of the peak region and the
differences in available reads numbers. The difference of peak
enrichment between cancer and normal samples was analyzed using
NOISeq (version 1.10) (22) with a
q-value ≥0.8.
DEG identification
DEGs between cancer and normal samples were
identified via paired t-tests (23). Genes with |log2 fold
change (FC) | ≥2 and a P-value <0.05 were considered to be
differentially expressed.
Functional enrichment analysis and
annotation of specific genes
Gene Ontology (GO) functional enrichment analysis of
DEGs was performed using the Database for Annotation, Visualization
and Integrated Discovery (DAVID) (24). Subsequently, based on the database
of transcription factors (TFs), DEGs with regulatory functions were
selected and annotated. Finally, according to the tumor suppressor
genes (25) and Disease and Gene
Annotation (dga.nubic.northwestern.edu) databases, oncogenes and
tumor suppressor genes were selected from the DEGs.
Detection of upstream regulatory
element of DEGs
In the present study, the promoter region was from 1
kb upstream to 0.5 kb downstream of the transcription start site
(TSS). For the promoter regions of upegulated and downregulated
genes, motif finding was performed using Seqpos (version 1.0.0)
(26) to predict the TFs of DEGs.
A P-value <10-5 was set as the cut-off criterion.
Reverse transcription-quantitative PCR
(RT-qPCR)
To verify the results of the analyses described
above, the expression levels of key transcriptional regulatory
elements in human LNCaP cells were detected by RT-qPCR. In the
present study, untransformed prostate epithelial BPH-1 cells and
androgen-dependent LNCaP cells were obtained from the American Type
Culture Collection (Manassas, VA, USA). As previously described
(14), the LNCaP cells were
starved in phenol-red-free medium (Gibco; Thermo Fisher Scientific,
Inc.) containing 10% charcoal-stripped FBS (Gibco; Thermo Fisher
Scientific, Inc.) and maintained in a 37°C incubator with 5% CO2
for 3 days, followed by treatment with 10 nM DHT for 4 h. BPH-1
cells were starved for 3 days as the control group. Therefore,
three groups were obtained, including BPH-1, LNCaP, and LNCaP +
DHT. Total RNA was isolated from the different treated groups using
TRIzol reagent (Invitrogen; Thermo Fisher Scientific, Inc.,
Waltham, MA, USA), according to the manufacturer's protocol.
Following measurement of the concentration of total RNA with a
NanoDrop 2000 spectrometer (Thermo Fisher Scientific, Inc.,
Wilmington, DE, USA), RT was performed using the PrimeScript RT
Master Mix kit (Takara Bio, Inc., Otsu, Japan). Subsequently, qPCR
was performed using a SYBR-Green kit (Applied Biosystems; Thermo
Fisher Scientific, Inc.), in accordance with the manufacturer's
protocol. The primer sequences (5′-3′) of the selected DEGs were
used as follows: inhibitor of DNA binding 1 HLH protein (ID1),
forward CTG CTC TAC GAC ATG AAC GG and reverse GAA GGT CCC TGA TGT
AGT CGAT; CCCTC-binding factor (CTCF), forward CAG TGG AGA ATT GGT
TCG GCA and reverse CTG GCG TAA TCG CAC ATG GA; ELK1 ETS
transcription factor (ELK1) forward CCC GTC CGT GGC CTT ATT TA and
reverse CTC TGC ATC CAC CAG CTT GA; and GAPDH, forward TGA CAA CTT
TGG TAT CGT GGA AGG and reverse AGG CAG GGA TGA TGT TCT GGA GAG.
The thermocycling conditions for the qPCR were set as follows: 50°C
for 3 min, 95°C for 3 min, 40 cycles of 95°C for 10 sec and 60°C
for 30 sec, and a final melt curve (60–95°C with 0.5°C increments
for 10 sec). The expression levels of selected DEGs were normalized
to GAPDH and calculated using the 2-ΔΔCq method, as described
previously (27). Each sample was
analyzed in triplicate. The obtained data are presented as the mean
± standard deviation. Significant differences between groups were
analyzed using the post hoc Tukey test following one-way analysis
of variance, using SPSS 22.0 software (IBM Corp., Armonk, NY, USA).
The results were visualized using GraphPad Prism 5.0 software
(GraphPad Software, Inc., La Jolla, CA, USA). P<0.05 was
considered to indicate a statistically significant difference.
Results
Distribution of the open chromosomal
regions in LNCaP cells
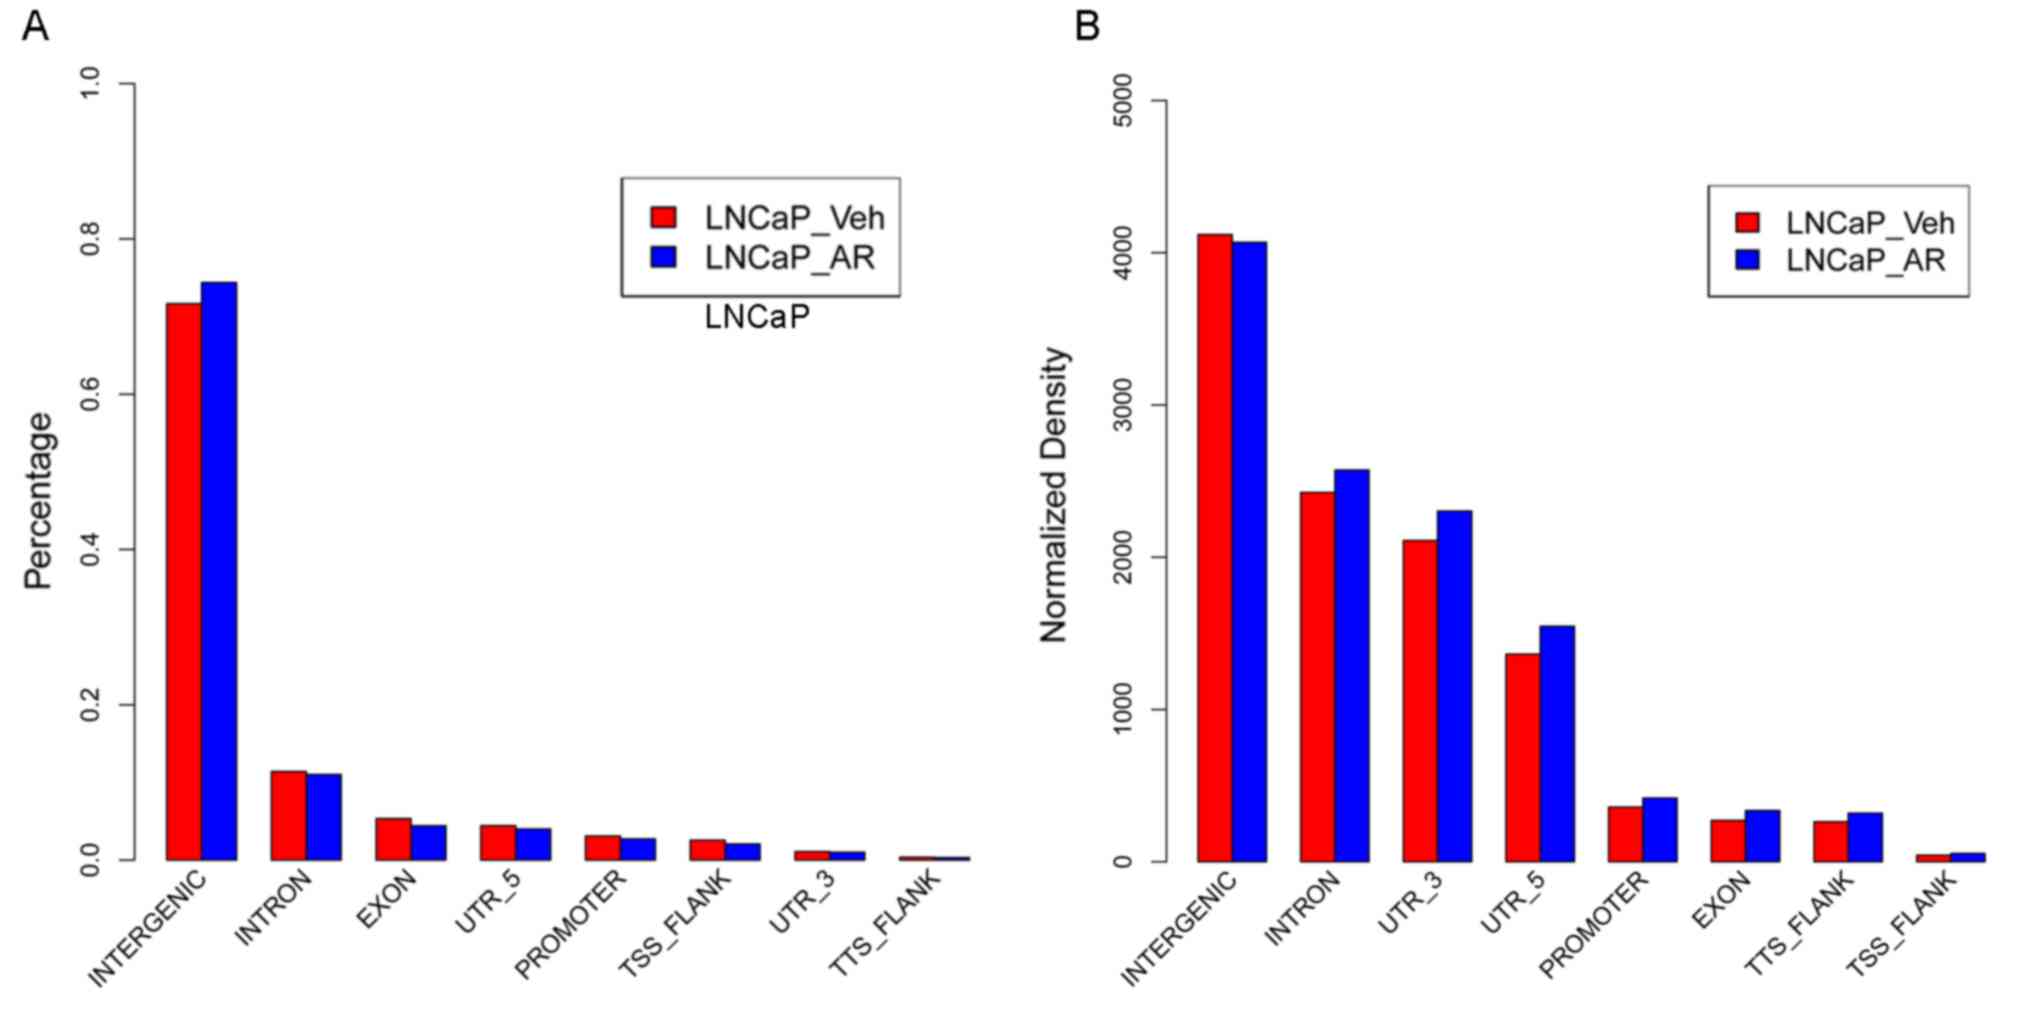
In the LNCaP cells prior to and following androgen
stimulation, the number and distribution of open chromosomal
regions in different functional genomic regions were analyzed. As
presented in Fig. 1A, in LNCaP
cells prior to androgen stimulation, there were 69,044 open
chromosomal regions with an overall length of 94,915,563 bp and an
average length of 1,375 bp, accounting for ~3.16% of the total
chromosomal regions; following androgen stimulation, there were
70,141 open chromosomal regions with a total length of 88,852,553
bp and an average length of 1,267 bp, accounting for ~2.96% of the
overall chromosomal regions. However, androgen stimulation exerted
no influence on the gene distribution of the open chromosomal
regions (Fig. 1B), and the
majority of the open chromosomal regions were located in intergenic
regions, followed by introns, exons, 5′ untranslated regions,
promoter regions, and the surrounding regions of transcription
termination sites (TTS) and TSS.
Detection of DHS regions and
functional enrichment analysis
In order to detect whether open chromosomal regions
in LNCaP cells altered dynamically following the activation of AR
induced by androgen, the different dysregulated open chromosomal
regions in LNCaP cells prior to and following androgen stimulation
were analyzed using a permutation test. A total of 244 upregulated
and 486 downregulated open chromosomal regions were identified in
LNCaP cells following AR activation. Subsequently, the regions with
dynamic alterations were further analyzed to identify their
correlations with gene expression. In total, 730 adjacent genes to
the open chromosomal regions were examined. The promoters of 41
genes contained upregulated open chromosomal signals and the
promoters of 24 genes overlapped with downregulated open
chromosomal signals (data not shown). However, only ~1% of open
chromosomal regions changed dynamically.
GO functional enrichment analyses of genes adjacent
to the open chromosomal regions were performed. The results
demonstrated that 41 genes with upregulated open chromosomal
signals within their promoter regions were significantly involved
the biological processes of ‘apoptosis’ (P=0.005187071), ‘protein
phosphorylation’ (P=0.007965814), ‘regulation of synaptic
transmission’ (P=0.027853425) and ‘MAPK kinase cascade’
(P=0.048303904) (Table I).
Nevertheless, 24 genes with downregulated open chromosomal signals
within promoter regions were not significantly enriched in any GO
terms.
 | Table I.Enriched functions for genes adjacent
to the open chromosomal regions. |
Table I.
Enriched functions for genes adjacent
to the open chromosomal regions.
| Term | No. genes | Gene symbols | P-value |
|---|
|
GO:0006915~apoptosis | 6 | SGK1, MAP3K5,
CDK11A, SOS2, BUB1B, CDK11B, LOC100133692, KALRN | 0.005187071 |
| GO:0006468~protein
amino acid phosphorylation | 6 | SGK1, MAP3K5,
CDK11A, NTRK2, CDK11B, MAPK10, LOC100133692, KALRN | 0.007965814 |
|
GO:0008624~induction of apoptosis by
extracellular signals | 3 | MAP3K5, SOS2,
KALRN | 0.019397183 |
|
GO:0050804~regulation of synaptic
transmission | 3 | NTRK2, GRIA4,
CALB1 | 0.027853425 |
|
GO:0007242~intracellular signaling
cascade | 7 | DUSP4, MAP3K5,
SOS2, BUB1B, AKAP7, MAPK10, KALRN | 0.028874403 |
|
GO:0051966~regulation of synaptic
transmission, glutamatergic | 2 | NTRK2, GRIA4 | 0.03591552 |
| GO:0000165~MAPKKK
cascade | 3 | DUSP4, MAP3K5,
MAPK10 | 0.048303904 |
Identification of crucial open
chromosomal regions
Firstly, RNA-seq data (GSE22260) of prostate cancer
patients were used to investigate the association between gene
expression and the dynamic alterations in open chromosomal regions
prior to and following AR activation. In total, 211 upregulated and
150 downregulated genes were identified in prostate cancer samples
compared with normal samples. Among the DEGs, eight DEGs served as
transcription factors (Table
II).
| Table II.Identification of differentially
expressed genes and TF in prostate cancer. |
Table II.
Identification of differentially
expressed genes and TF in prostate cancer.
|
| No. genes | No. TF | TF symbols |
|---|
| Downregulated | 211 | 4 | IFI16, NEUROG3,
RARG, SIM1 |
| Upregulated | 150 | 4 | DMBX1, NCOA2,
ONECUT2, ZNF83 |
Subsequently, the correlation analysis between
dynamic alterations in open chromosomal regions and gene expression
regulation was performed. However, only one of the 226 open
chromosomal regions adjacent to downregulated genes exhibited a
downregulated signal following the activation of AR, which was in
accordance with that of the 243 open chromosomal regions adjacent
to the upregulated genes (Table
III).
| Table III.DHS adjacent to upregulated and
downregulated genes in prostate cancer. |
Table III.
DHS adjacent to upregulated and
downregulated genes in prostate cancer.
|
| DHS upregulated in
AR activation | DHS downregulated
in AR activation | Non-dynamic
DHS |
|---|
| DHS adjacent to
downregulated genes | 1 | 0 | 225 |
| DHS adjacent to
upregulated genes | 0 | 0 | 243 |
Motif analysis of transcription
factors in crucial open chromosomal regions
Based on dynamic alterations in open chromosomal
regions and the screened DEGs, TF motif scanning was performed. A
total of nine regulatory elements associated with DEGs in prostate
cancer were identified, including CTCF, ELK1 and zinc finger
protein 143 (ZNF143) enriched in open promoter regions of
downregulated DEGs, and cone-rod homeobox (CRX), GA binding protein
transcription factor α subunit (GABPA), histone H4 transcription
factor (HINFP), ID1, methyl-CpG binding protein 2 (MECP2) and
paired box 6 (PAX6) enriched in open promoter regions of
upregulated genes (Table IV).
Notably, ID1 was the only significantly upregulated TF that
exhibited motif enrichment in promoter regions of upregulated genes
(Fig. 2).
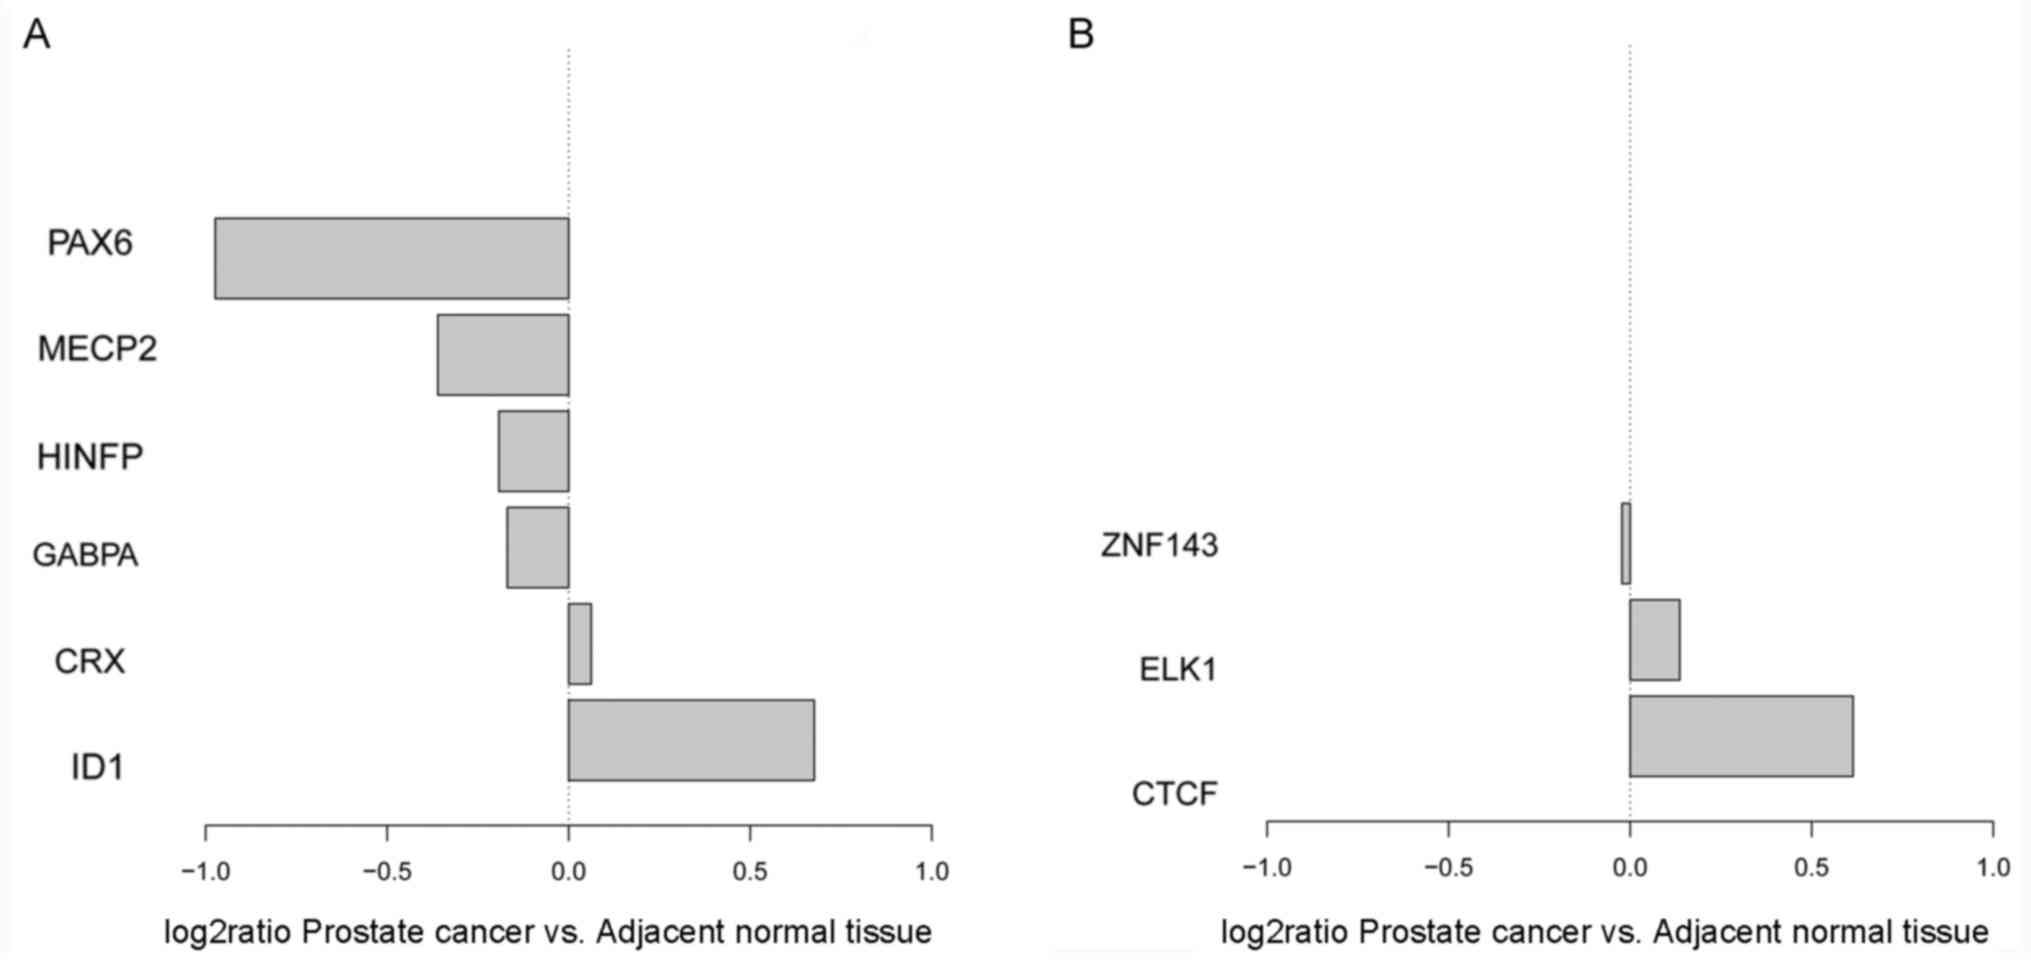 | Figure 2.Expression alterations in upstream
regulatory elements in the abnormal genes. (A) TF motif from DHS
adjacent to upregulated genes. (B) TF motif from DHS adjacent to
downregulated genes. TF, transcription factor; DHS, DNase I
hypersensitive sites; PAX6, paired box 6; MECP2, methyl-CpG binding
protein 2; HINFP, histone H4 transcription factor; GABPA, GA
binding protein transcription factor α subunit; CRX, cone-rod
homeobox; ID1, inhibitor of DNA binding 1 HLH protein; ZNF143, zinc
finger protein 143; ELK1, ELK1 ETS transcription factor; CTCF,
CCCTC-binding factor. |
| Table IV.Prediction of upstream regulatory
elements of differentially expressed genes in prostate cancer. |
Table IV.
Prediction of upstream regulatory
elements of differentially expressed genes in prostate cancer.
| Term | No. genes | Gene symbols | P-value |
|---|
|
GO:0006915~apoptosis | 6 | SGK1, MAP3K5,
CDK11A, SOS2, BUB1B, CDK11B, LOC100133692, KALRN | 0.005187071 |
| GO:0006468~protein
amino acid phosphorylation | 6 | SGK1, MAP3K5,
CDK11A, NTRK2, CDK11B, MAPK10, LOC100133692, KALRN | 0.007965814 |
|
GO:0008624~induction of apoptosis by
extracellular signals | 3 | MAP3K5, SOS2,
KALRN | 0.019397183 |
|
GO:0050804~regulation of synaptic
transmission | 3 | NTRK2, GRIA4,
CALB1 | 0.027853425 |
|
GO:0007242~intracellular signaling
cascade | 7 | DUSP4, MAP3K5,
SOS2, BUB1B, AKAP7, MAPK10, KALRN | 0.028874403 |
|
GO:0051966~regulation of synaptic
transmission, glutamatergic | 2 | NTRK2, GRIA4 | 0.03591552 |
| GO:0000165~MAPKKK
cascade | 3 | DUSP4, MAP3K5,
MAPK10 | 0.048303904 |
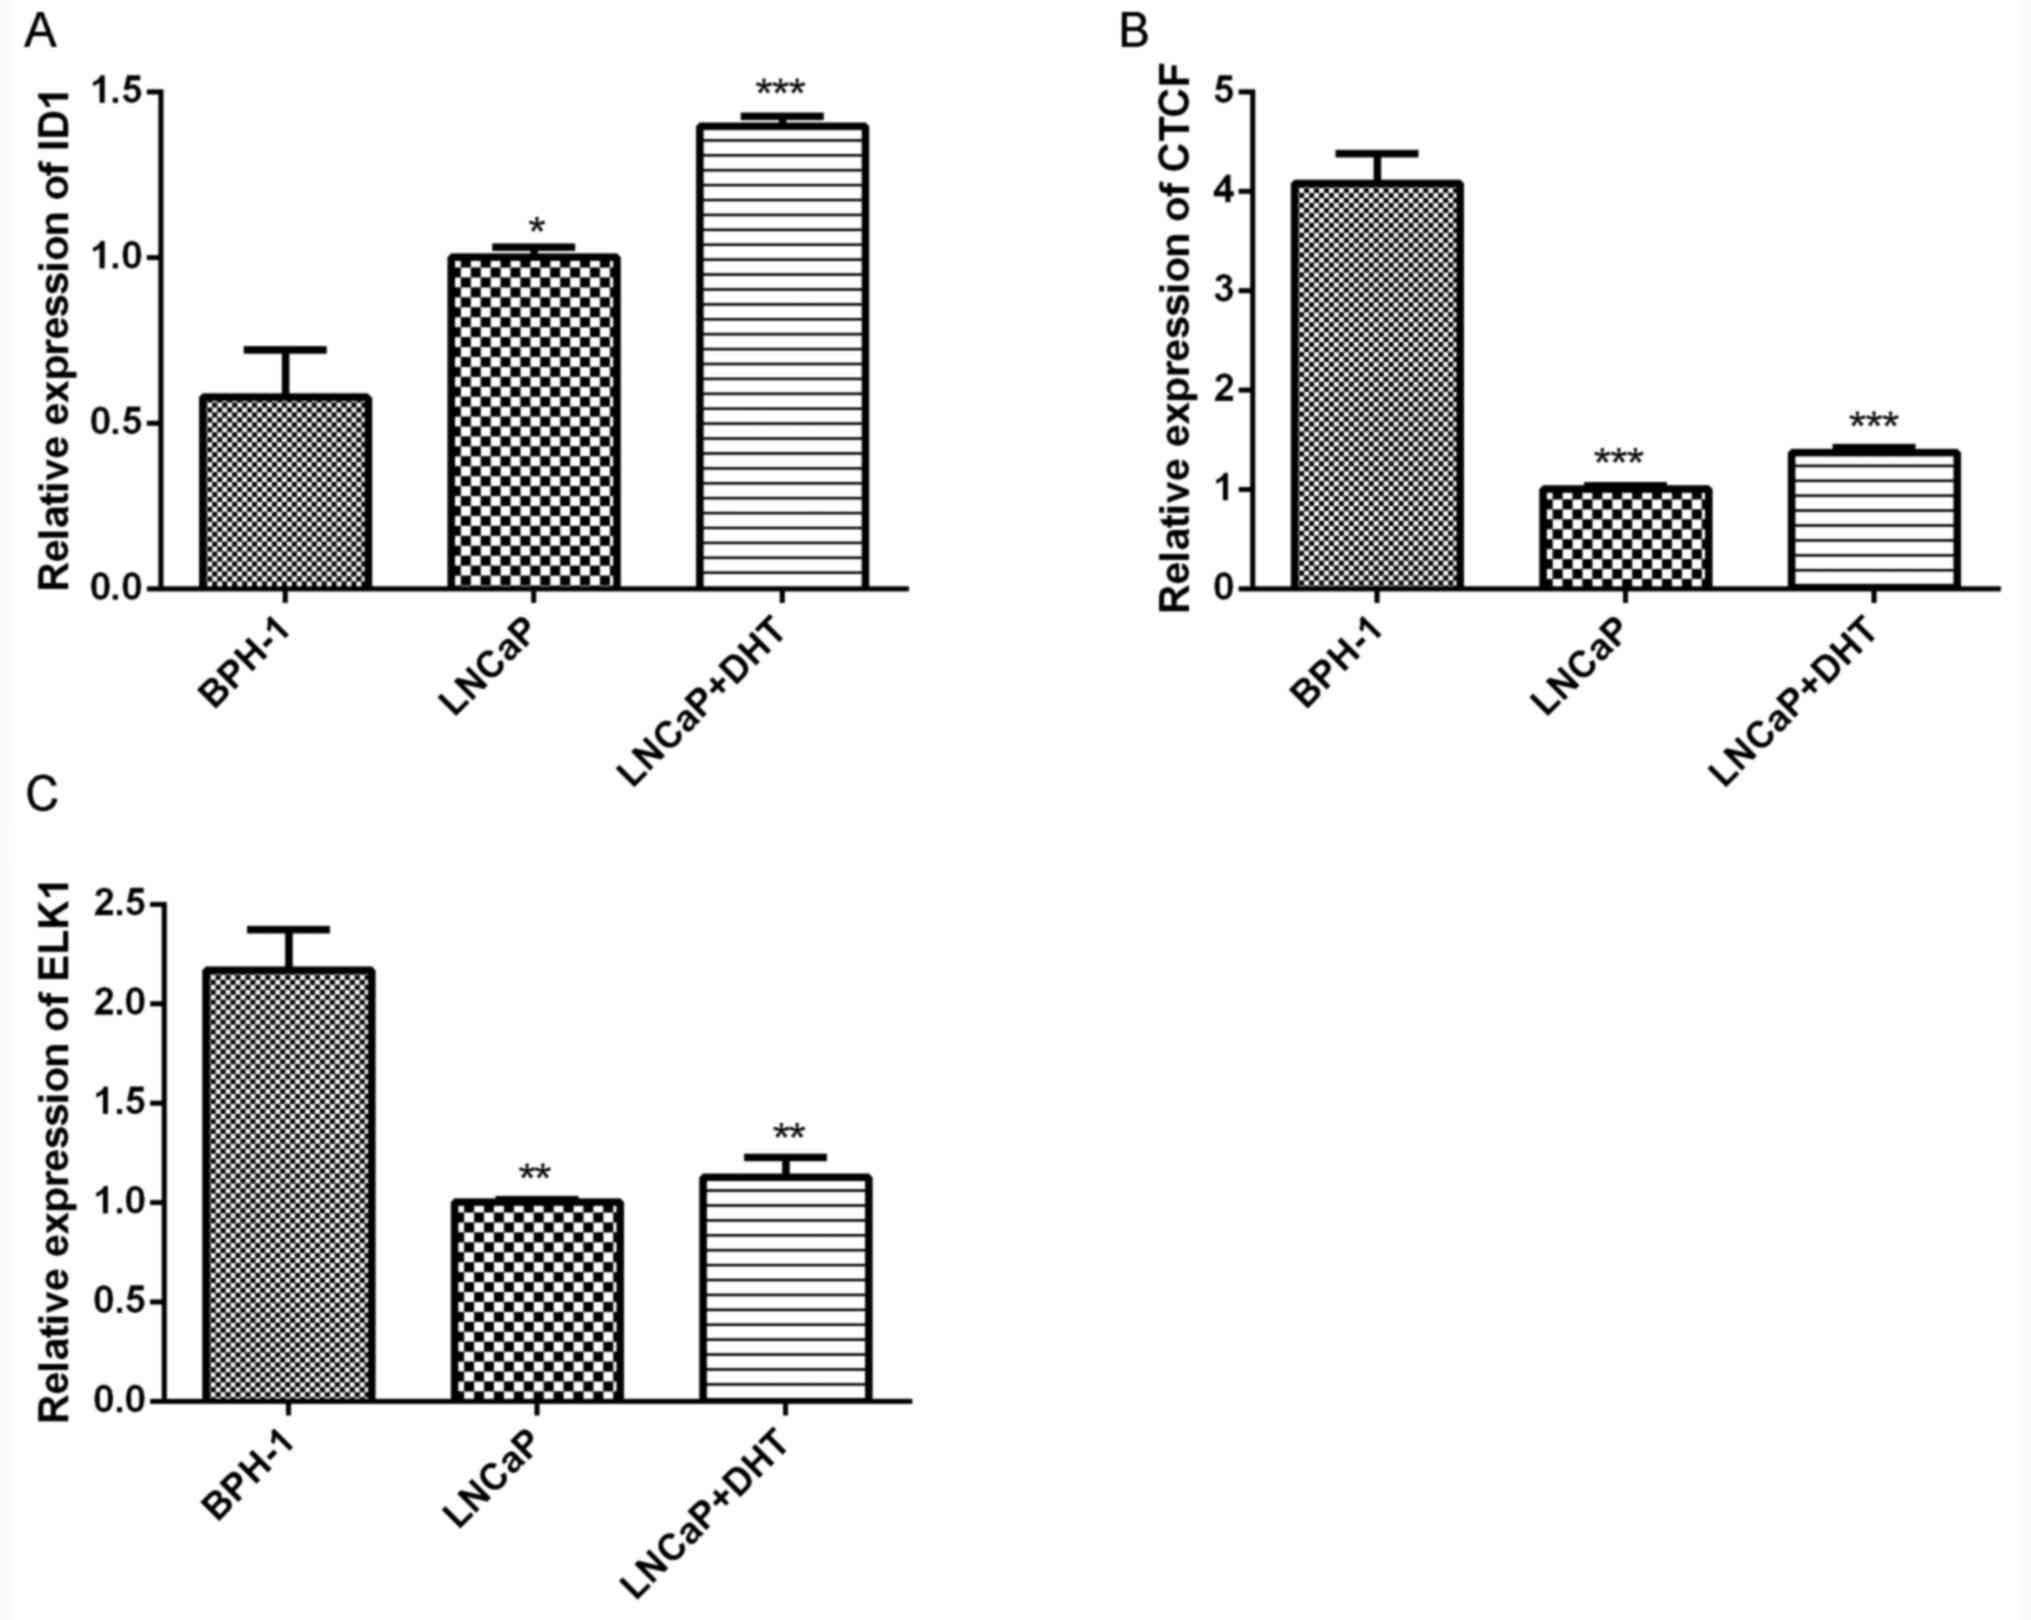
Validation of gene expression using RT-qPCR. In
order to validate the results of the above bioinformatics analyses,
the expression levels of key transcriptional regulatory elements,
including ID1, CTCF and ELK1, were detected by RT-qPCR. ID1 was the
only significantly upregulated TF which exhibited motif enrichment
in the promoter regions of upregulated genes. CTCF and ELK1 were
potential upstream regulatory elements in the open promoter regions
of downregulated DEGs. Consistent with the results of above
bioinformatics analyses, the expression of ID1 was significantly
upregulated in LNCaP cells and DHT-treated LNCaP cells compared
with that in BPH1 cells (P<0.05; Fig. 3A), whereas CTCF and ELK1 were
significantly downregulated in LNCaP cells and DHT-treated LNCaP
cells (P<0.05; Fig. 3B and
C).
Discussion
Previous studies have indicated that prostate cancer
development is associated with genetic and epigenetic alterations
induced by AR activation (28,29).
The application of cytogenetic and molecular genetic methods has
led to the identification of numerous tumor-associated chromosomal
regions during the tumorigenesis of prostate cancer (30). In present study, 244 upregulated
and 486 downregulated open chromosomal regions were identified in
LNCaP cells following AR activation induced by androgen. However,
only ~1% of open chromosomal regions altered dynamically following
AR activation, indicating the limited influence of the activated AR
on dynamic alterations in the chromosome. In addition, 211
upregulated and 150 downregulated DEGs were identified in prostate
cancer samples compared with normal samples. There was only one,
out of the 226 open chromosomal regions adjacent to downregulated
genes, which exhibited a downregulated signal post-AR activation,
which was in accordance with that of the 243 open chromosomal
regions adjacent to upregulated genes. These results suggested that
dynamic alterations of open chromosomal regions following AR
activation did not affect gene expression regulation in prostate
cancer. Notably, nine regulatory elements (CTCF, ELK1, ZNF143, CRX,
GABPA, HINFP, ID1, MECP2 and PAX6) of DEGs were identified. ID1 was
the only significantly upregulated TF which exhibited motif
enrichment in the promoter regions of upregulated genes. CTCF and
ELK1 were potential upstream regulatory elements. Notably,
consistent with the results of the above bioinformatics analyses,
RT-qPCR analysis confirmed that ID1 was significantly upregulated
in LNCaP cells and DHT-treated LNCaP cells compared with that in
BPH1 cells, whereas CTCF and ELK1 were significantly downregulated
in LNCaP cells and DHT-treated LNCaP cells.
ID1 is a member of the helix-loop-helix
transcription factor family that lacks a basic domain (31). Increased ID1 expression has been
confirmed to be associated with cell proliferation,
immortalization, invasion and an aggressive malignant phenotype in
a number of human cell lines (32). ID1 expression has been detected in
numerous types of human cancer (including breast cancer,
hepatocellular carcinoma, human oral squamous cell carcinoma,
papillary thyroid cancer and pancreatic cancer) and its expression
level has been suggested to be a marker for malignant progression
in a number of types of human cancer, including prostate cancer
(33,34). Furthermore, it has been reported
that ID1 may be activated by AR (35). In androgen-dependent prostate
cancer, androgen negatively regulates ID1, which may partially
induce androgen-independent prostate cancer following prolonged
androgen deprivation therapy (36). ID1 may serve as an upstream
regulator of nuclear factor-κB, which may inhibit cellular
apoptosis and induce cell proliferation; therefore, the
inactivation of ID1 may be a promising therapeutic strategy for
promoting chemotherapeutic drug-induced apoptosis in prostate
cancer cells (37). Based on the
results of the present study, it may be hypothesized that ID1 may
have a close association with prostate cancer development.
ELK1, a known carcinogenic factor, is able to
stimulate transcription from the c-fos serum response element or
from an ETS binding site (38).
Transient transfection assays have demonstrated that the androgen
receptor-mediated activation of mitogen-activated protein kinase
results in enhanced activity of the transcription factor ELK1
(39). A previous study reported
that ELK1 leads to transcriptional activation by combining with a
cis-acting element to promote the expression of downstream genes
(40). ELK1 regulates selective
and sustained genes that are essential for growth signaling by AR
in prostate cancer cells, and the ELK1-AR interaction may be a
potential drug target in the treatment of prostate cancer (41). Furthermore, haploinsufficiency of
CTCF has been demonstrated to destabilize DNA methylation and to
predispose to cancer (42). CTCF
has been observed to serve a role in certain human tumors (43,44).
Histone methylation and DNA methylation analysis of the imprinting
control region of insulin-like growth factor 2/H19, located at the
CTCF binding domain, has increased the understanding of
carcinogenesis and may improve the diagnosis of prostate cancer
(45). Therefore, CTCF and ELK1
expression levels may be associated with prostate cancer
development.
In conclusion, open chromosomal regions adjacent to
the promoter of the abnormal genes were analyzed, and the
corresponding transcriptional regulatory elements were predicted.
In LNCaP cells following AR activation, 244 upregulated and 486
downregulated open chromosomal regions were identified.
Furthermore, a total of 211 upregulated and 150 downregulated genes
were identified in prostate cancer samples. In addition, ID1, CTCF,
and ELK1 may serve a role in prostate cancer development. These
results may improve our understanding of prostate carcinoma and
provide potential diagnostic targets for treatment. However, the
sample size of the present study was small. Furthermore, the
RNA-seq data of prostate cancer samples, and not the RNA-seq data
for LNCaP cells treated with or without androgen, were analyzed in
the present study. If the RNA-seq data for LNCaP cells treated with
or without androgen were additionally analyzed, more direct and
notable findings may be obtained for the clearer elucidation of the
molecular mechanism underlying prostate cancer development
associated with AR activation. Furthermore, the present study did
not verify the difference in a large number of cell lines and in
human carcinoma tissues. Therefore, further studies with a larger
sample size and more datasets are required to confirm the results
of the present study.
Acknowledgements
Not applicable.
Funding
No funding was received.
Availability of data and materials
The datasets used and analysed during the current
study are available from the corresponding author on reasonable
request.
Authors' contributions
XJ and LS were involved in the conception and design
of the research. YL and YH participated in the acquisition of data.
LY and YH performed the analysis and interpretation of data. XW and
LY were involved in the conception of the study, participated in
its design and coordination and aided in the writing of the
manuscript. All authors read and approved the final manuscript.
Ethics approval and consent to
participate
Not applicable.
Consent for publication
Not applicable.
Competing interests
The authors declare that they have no competing
interests.
References
|
1
|
Heidenreich A, Bellmunt J, Bolla M, Joniau
S, Mason M, Matveev V, Mottet N, Schmid HP, van der Kwast T, Wiegel
T, et al: EAU guidelines on prostate cancer. Part 1: Screening,
diagnosis, and treatment of clinically localised disease. Eur Urol.
59:61–71. 2011. View Article : Google Scholar : PubMed/NCBI
|
|
2
|
Howlader N, Noone A, Krapcho M, Neyman N,
Aminou R, Waldron W, Altekruse SF, Kosary CL, Ruhl J, Tatalovich Z,
et al: SEER cancer statistics review, 1975–2008. Bethesda, MD:
National Cancer Institute; 2011, Also available online. Last
accessed. December 1–2011
|
|
3
|
Grignon DJ: Unusual subtypes of prostate
cancer. Mod Pathol. 17:316–327. 2004. View Article : Google Scholar : PubMed/NCBI
|
|
4
|
Siegel R, Naishadham D and Jemal A: Cancer
statistics, 2012. CA Cancer J Clin. 62:10–29. 2012. View Article : Google Scholar : PubMed/NCBI
|
|
5
|
Edge SB and Compton CC: The American Joint
Committee on Cancer: The 7th edition of the AJCC cancer staging
manual and the future of TNM. Ann Surg Oncol. 17:1471–1474. 2010.
View Article : Google Scholar : PubMed/NCBI
|
|
6
|
Culig Z, Hobisch A, Cronauer MV, Radmayr
C, Trapman J, Hittmair A, Bartsch G and Klocker H: Androgen
receptor activation in prostatic tumor cell lines by insulin-like
growth factor-I, keratinocyte growth factor, and epidermal growth
factor. Cancer Res. 54:5474–5478. 1994.PubMed/NCBI
|
|
7
|
Collins AT, Berry PA, Hyde C, Stower MJ
and Maitland NJ: Prospective identification of tumorigenic prostate
cancer stem cells. Cancer Res. 65:10946–10951. 2005. View Article : Google Scholar : PubMed/NCBI
|
|
8
|
Heinlein CA and Chang C: Androgen receptor
(AR) coregulators: An overview. Endocr Rev. 23:175–200. 2002.
View Article : Google Scholar : PubMed/NCBI
|
|
9
|
Edwards J, Krishna N, Grigor K and
Bartlett J: Androgen receptor gene amplification and protein
expression in hormone refractory prostate cancer. Br J Cancer.
89:552–556. 2003. View Article : Google Scholar : PubMed/NCBI
|
|
10
|
Hong H, Kao C, Jeng MH, Eble JN, Koch MO,
Gardner TA, Zhang S, Li L, Pan CX, Hu Z, et al: Aberrant expression
of CARM1, a transcriptional coactivator of androgen receptor, in
the development of prostate carcinoma and androgen-independent
status. Cancer. 101:83–89. 2004. View Article : Google Scholar : PubMed/NCBI
|
|
11
|
Lin DL, Whitney MC, Yao Z and Keller ET:
Interleukin-6 induces androgen responsiveness in prostate cancer
cells through up-regulation of androgen receptor expression. Clin
Cancer Res. 7:1773–1781. 2001.PubMed/NCBI
|
|
12
|
Malinowska K, Neuwirt H, Cavarretta IT,
Bektic J, Steiner H, Dietrich H, Moser PL, Fuchs D, Hobisch A and
Culig Z: Interleukin-6 stimulation of growth of prostate cancer in
vitro and in vivo through activation of the androgen receptor.
Endocr Relat Cancer. 16:155–169. 2009. View Article : Google Scholar : PubMed/NCBI
|
|
13
|
Pepke S, Wold B and Mortazavi A:
Computation for ChIP-seq and RNA-seq studies. Nat Methods. 6 11
Suppl:S22–S32. 2009. View Article : Google Scholar : PubMed/NCBI
|
|
14
|
He HH, Meyer CA, Chen MW, Jordan VC, Brown
M and Liu XS: Differential DNase I hypersensitivity reveals
factor-dependent chromatin dynamics. Genome Res. 22:1015–1025.
2012. View Article : Google Scholar : PubMed/NCBI
|
|
15
|
Hu FY, Zhao XM, Tang NL, Zhang Y and Chen
L: Comparative analysis of protein-coding genes and long non-coding
RNAs of prostate cancer between Caucasian and Chinese populations.
Systems Biology (ISB), 2012 IEEE 6th International Conference on
IEEE. 291–296. 2012. View Article : Google Scholar
|
|
16
|
Li H and Durbin R: Fast and accurate
long-read alignment with Burrows-Wheeler transform. Bioinformatics.
26:589–595. 2010. View Article : Google Scholar : PubMed/NCBI
|
|
17
|
Trapnell C, Pachter L and Salzberg SL:
TopHat: Discovering splice junctions with RNA-Seq. Bioinformatics.
25:1105–1111. 2009. View Article : Google Scholar : PubMed/NCBI
|
|
18
|
Trapnell C, Williams BA, Pertea G,
Mortazavi A, Kwan G, van Baren MJ, Salzberg SL, Wold BJ and Pachter
L: Transcript assembly and quantification by RNA-Seq reveals
unannotated transcripts and isoform switching during cell
differentiation. Nat Biotechnol. 28:511–515. 2010. View Article : Google Scholar : PubMed/NCBI
|
|
19
|
Li H, Handsaker B, Wysoker A, Fennell T,
Ruan J, Homer N, Marth G, Abecasis G and Durbin R: 1000 Genome
Project Data Processing Subgroup: The sequence alignment/map format
and SAMtools. Bioinformatics. 25:2078–2079. 2009. View Article : Google Scholar : PubMed/NCBI
|
|
20
|
Zhang Y, Liu T, Meyer CA, Eeckhoute J,
Johnson DS, Bernstein BE, Nusbaum C, Myers RM, Brown M, Li W and
Liu XS: Model-based analysis of ChIP-Seq (MACS). Genome Biol.
9:R1372008. View Article : Google Scholar : PubMed/NCBI
|
|
21
|
Ewert R: Broadband slat noise prediction
based on CAA and stochastic sound sources from a fast random
particle-mesh (RPM) method. Comput Fluids. 37:369–387. 2008.
View Article : Google Scholar
|
|
22
|
Tarazona S, García-Alcalde F, Dopazo J,
Ferrer A and Conesa A: Differential expression in RNA-seq: A matter
of depth. Genome Res. 21:2213–2223. 2011. View Article : Google Scholar : PubMed/NCBI
|
|
23
|
Hsu H and Lachenbruch PA: Paired t test.
Wiley Encyclopedia of Clinical Trials. 2008. View Article : Google Scholar
|
|
24
|
da Huang W, Sherman BT and Lempicki RA:
Systematic and integrative analysis of large gene lists using DAVID
bioinformatics resources. Nat Protoc. 4:44–57. 2009. View Article : Google Scholar : PubMed/NCBI
|
|
25
|
Zhao M, Sun J and Zhao Z: TSGene: A web
resource for tumor suppressor genes. Nucleic Acids Res.
41:D970–D976. 2013. View Article : Google Scholar : PubMed/NCBI
|
|
26
|
He HH, Meyer CA, Shin H, Bailey ST, Wei G,
Wang Q, Zhang Y, Xu K, Ni M, Lupien M, et al: Nucleosome dynamics
define transcriptional enhancers. Nat Genet. 42:343–347. 2010.
View Article : Google Scholar : PubMed/NCBI
|
|
27
|
Livak KJ and Schmittgen TD: Analysis of
relative gene expression data using real-time quantitative PCR and
the 2−ΔΔCT method. Methods. 25:402–408. 2001.
View Article : Google Scholar : PubMed/NCBI
|
|
28
|
Schwarzenbach H, Chun FK, Isbarn H, Huland
H and Pantel K: Genomic profiling of cell-free DNA in blood and
bone marrow of prostate cancer patients. J Cancer Res Clin Oncol.
137:811–819. 2011. View Article : Google Scholar : PubMed/NCBI
|
|
29
|
Steinkamp MP, O'Mahony OA, Brogley M,
Rehman H, Lapensee EW, Dhanasekaran S, Hofer MD, Kuefer R,
Chinnaiyan A, Rubin MA, et al: Treatment-dependent androgen
receptor mutations in prostate cancer exploit multiple mechanisms
to evade therapy. Cancer Res. 69:4434–4442. 2009. View Article : Google Scholar : PubMed/NCBI
|
|
30
|
Costa VL, Henrique R and Jerónimo C:
Epigenetic markers for molecular detection of prostate cancer. Dis
Markers. 23:31–41. 2007. View Article : Google Scholar : PubMed/NCBI
|
|
31
|
Perk J, Iavarone A and Benezra R: Id
family of helix-loop-helix proteins in cancer. Nat Rev Cancer.
5:603–614. 2005. View
Article : Google Scholar : PubMed/NCBI
|
|
32
|
Parrinello S, Lin CQ, Murata K, Itahana Y,
Singh J, Krtolica A, Campisi J and Desprez PY: Id-1, ITF-2, and
Id-2 comprise a network of helix-loop-helix proteins that regulate
mammary epithelial cell proliferation, differentiation, and
apoptosis. J Biol Chem. 276:39213–39219. 2001. View Article : Google Scholar : PubMed/NCBI
|
|
33
|
Kebebew E, Treseler PA, Duh QY and Clark
OH: The helix-loop-helix transcription factor, Id-1, is
overexpressed in medullary thyroid cancer. Surgery. 128:952–957.
2000. View Article : Google Scholar : PubMed/NCBI
|
|
34
|
O'Toole PJ, Inoue T, Emerson L, Morrison
IE, Mackie AR, Cherry RJ and Norton JD: Id proteins negatively
regulate basic helix-loop-helix transcription factor function by
disrupting subnuclear compartmentalization. J Biol Chem.
278:45770–45776. 2003. View Article : Google Scholar : PubMed/NCBI
|
|
35
|
Ao J, Meng J, Zhu L, Nie H, Yang C, Li J,
Gu J, Lin Q, Long W, Dong X and Li C: Activation of androgen
receptor induces ID1 and promotes hepatocellular carcinoma cell
migration and invasion. Mol Onco. 6:507–515. 2012. View Article : Google Scholar
|
|
36
|
Xu B, Sun Y, Tang G, Xu C, Wang L, Zhang Y
and Ji J: Id-1 expression in androgen-dependent prostate cancer is
negatively regulated by androgen through androgen receptor. Cancer
Lett. 278:220–229. 2009. View Article : Google Scholar : PubMed/NCBI
|
|
37
|
Ling MT, Wang X, Ouyang XS, Xu K, Tsao SW
and Wong YC: Id-1 expression promotes cell survival through
activation of NF-kappaB signalling pathway in prostate cancer
cells. Oncogene. 22:4498–4508. 2003. View Article : Google Scholar : PubMed/NCBI
|
|
38
|
Li QJ, Yang SH, Maeda Y, Sladek FM,
Sharrocks AD and Martins-Green M: MAP kinase
phosphorylation-dependent activation of Elk-1 leads to activation
of the co-activator p300. EMBO J. 22:281–291. 2003. View Article : Google Scholar : PubMed/NCBI
|
|
39
|
Chen A, Xu J and Johnson A: Curcumin
inhibits human colon cancer cell growth by suppressing gene
expression of epidermal growth factor receptor through reducing the
activity of the transcription factor Egr-1. Oncogene. 25:278–287.
2005. View Article : Google Scholar
|
|
40
|
Liu T, Wu J and He F: Evolution of
cis-acting elements in 5′ flanking regions of vertebrate actin
genes. J Mol Evol. 50:22–30. 2000. View Article : Google Scholar : PubMed/NCBI
|
|
41
|
Patki M, Chari V, Sivakumaran S, Gonit M,
Trumbly R and Ratnam M: The ETS domain transcription factor ELK1
directs a critical component of growth signaling by the androgen
receptor in prostate cancer cells. J Biol Chem. 288:11047–11065.
2013. View Article : Google Scholar : PubMed/NCBI
|
|
42
|
Kemp CJ, Moore JM, Moser R, Bernard B,
Teater M, Smith LE, Rabaia NA, Gurley KE, Guinney J, Busch SE, et
al: CTCF haploinsufficiency destabilizes DNA methylation and
predisposes to cancer. Cell Reports. 7:1020–1029. 2014. View Article : Google Scholar : PubMed/NCBI
|
|
43
|
Ulaner GA, Vu TH, Li T, Hu JF, Yao XM,
Yang Y, Gorlick R, Meyers P, Healey J, Ladanyi M and Hoffman AR:
Loss of imprinting of IGF2 and H19 in osteosarcoma is accompanied
by reciprocal methylation changes of a CTCF-binding site. Hum Mol
Genet. 12:535–549. 2003. View Article : Google Scholar : PubMed/NCBI
|
|
44
|
Rakha EA, Pinder SE, Paish CE and Ellis
IO: Expression of the transcription factor CTCF in invasive breast
cancer: A candidate gene located at 16q22.1. Br J Cancer.
91:1591–1596. 2004. View Article : Google Scholar : PubMed/NCBI
|
|
45
|
Paradowska A, Fenic I, Konrad L, Sturm K,
Wagenlehner F, Weidner W and Steger K: Aberrant epigenetic
modifications in the CTCF binding domain of the IGF2/H19 gene in
prostate cancer compared with benign prostate hyperplasia. Int J
Oncol. 35:87–96. 2009. View Article : Google Scholar : PubMed/NCBI
|