Introduction
Lung cancer is one of the most frequent malignancies
worldwide and is the most common cause of global cancer-associated
mortality, with over a million succumbing each year (1). Global mortality from lung cancer
increased from 3.5 million in 1990 to 4.2 million in 2015 (2) and it is estimated that there will be
2.1 million new lung cancer cases and 1.8 million deaths in 2018,
representing close to 1 in 5 (18.4%) cases of cancer-associated
mortality (3). The five-year
survival rate for lung cancer patients is very low. This may be
attributed to the lack of effective therapeutic methods and the
difficulty in early diagnosis for lung cancer (4). Lung cancer is considered to be a
heterogeneous disease and a number of factors including genetic
mutations, environmental factors and individual habits can
contribute to cancer occurrence, progression and metastasis
(5). A number of genes and
cellular pathways have been reported to participate in these
processes (6,7). Thus, understanding the precise
molecular mechanisms underlying lung cancer progression is
important for the development of diagnostic and therapeutic
strategies.
Microarray has increasingly become a promising tool
in studying medical oncology (8).
A previous study on gene expression profiling in cancer used
microarray technology (9), but
only a few of these studies have been conducted on lung cancer
(10). In addition, comparative
analysis of the differentially expressed genes (DEGs) remains
relatively limited (10), and a
reliable biomarker profile discriminating cancer from normal
tissues remains to be identified. The expression changes of genes
in the development and progression of lung cancer require further
analysis. In addition, the interactions among the identified DEGs,
particularly the important signaling pathways and the interaction
networks, should be elucidated.
In the present study, original data (GSE19804) were
downloaded from Gene Expression Omnibus (GEO; www.ncbi.nlm.nih.gov/geo), which is a hub for the
archiving of microarray data and their retrieval. Following the
elimination of mismatched chips, the DEGs between lung cancer
tissues and normal tissues were identified by comparing gene
expression profiles. Subsequently, the DEGs were screened using
Gene-Spring software for Gene Ontology (GO) and pathway enrichment
analysis. By investigating their hub nodes and modules using a
protein-protein interaction (PPI) network, the present study aimed
to further understand the molecular mechanisms for lung cancer
development and to identify potential candidate biomarkers for
diagnosis, therapeutic targets and prognosis. At the same time, the
present study focused on Toll-like receptor (TLR) pathways, which
exert important immune regulatory functions and have been
implicated in tumor progression (11,12).
Materials and methods
Microarray data
The gene expression profile GSE19804, a
comprehensive analysis of the molecular signature of non-smoking
patients with non-small cell lung cancer (NSCLC), were obtained
from the GEO database. The majority of the tumors were
adenocarcinomas (93%), and 78% of the samples were in stage I or
II. Gene expression profile analysis was performed based on the
GPL570 platform (HG-U133-Plus-2; Affymetrix Human Genome U133 Plus
2.0 Array) by Lu et al (13) and then subjected to bioinformatics
analysis. There were 120 chips in this dataset. Following quality
control by signal strength distribution normalization, correlation
analysis and principal component analysis in Agilent Gene-Spring GX
v.11.5 (14), the mismatched ones
were eliminated and the remaining 31 pairs of cancerous and normal
tissues were used for subsequent analysis.
Identification of DEGs
The raw data used for the analysis were
pre-processed using the Affy package (version 1.48.0; bioconductor.org/packages/release/bioc/html/affy.html)
in R language (15). Hierarchical
clustering analysis was applied to categorize the data into two
groups of different expression patterns. Significance analysis by
Student's t-test and fold-change (FC) in the expression of genes
between each pair of cancerous and normal tissues were jointly used
to identify DEGs. Then, the Benjamini and Hochberg method (16) was used to calculate the adjusted
P-values [the false discovery rate (FDR)]. The criterion of
statistical significance was FDR<0.05 and |Log2 (FC)|>1.
GO and pathway enrichment analysis of
DEGs
The Database for Annotation, Visualization and
Integrated Discovery database (DAVID; version 6.8; david.ncifcrf.gov/), an essential tool for
systematically extracting biological information from numerous
genes (17), was used to perform
GO (www.geneontology.org) enrichment and
Kyoto Encyclopedia of Genes and Genomes (KEGG; www.genome.jp/) pathway analysis; P<0.05 was
considered to indicate a statistically significant difference.
Integration of PPI network and
screening of modules
The Search Tool for the Retrieval of Interacting
Genes (STRING, version 10.0; string-db.org/) (18), covering 9,643,763 proteins from
2,031 organisms and 932,553,897 interactions, was used to retrieve
predicted PPIs. All associations obtained in STRING were provided
with a confidence score. Only experimentally validated interactions
with a combined score >0.4 were selected to construct the PPI
network using Cytoscape software (version 3.4.0; www.cytoscape.org/) (19). The Molecular Complex Detection
(MCODE) plugin in Cytoscape was utilized to screen the modules of
the PPI network, Furthermore, functional and pathway enrichment
analyses were performed on the DEGs in the modules. P<0.05 was
considered to indicate a statistically significant difference.
Results
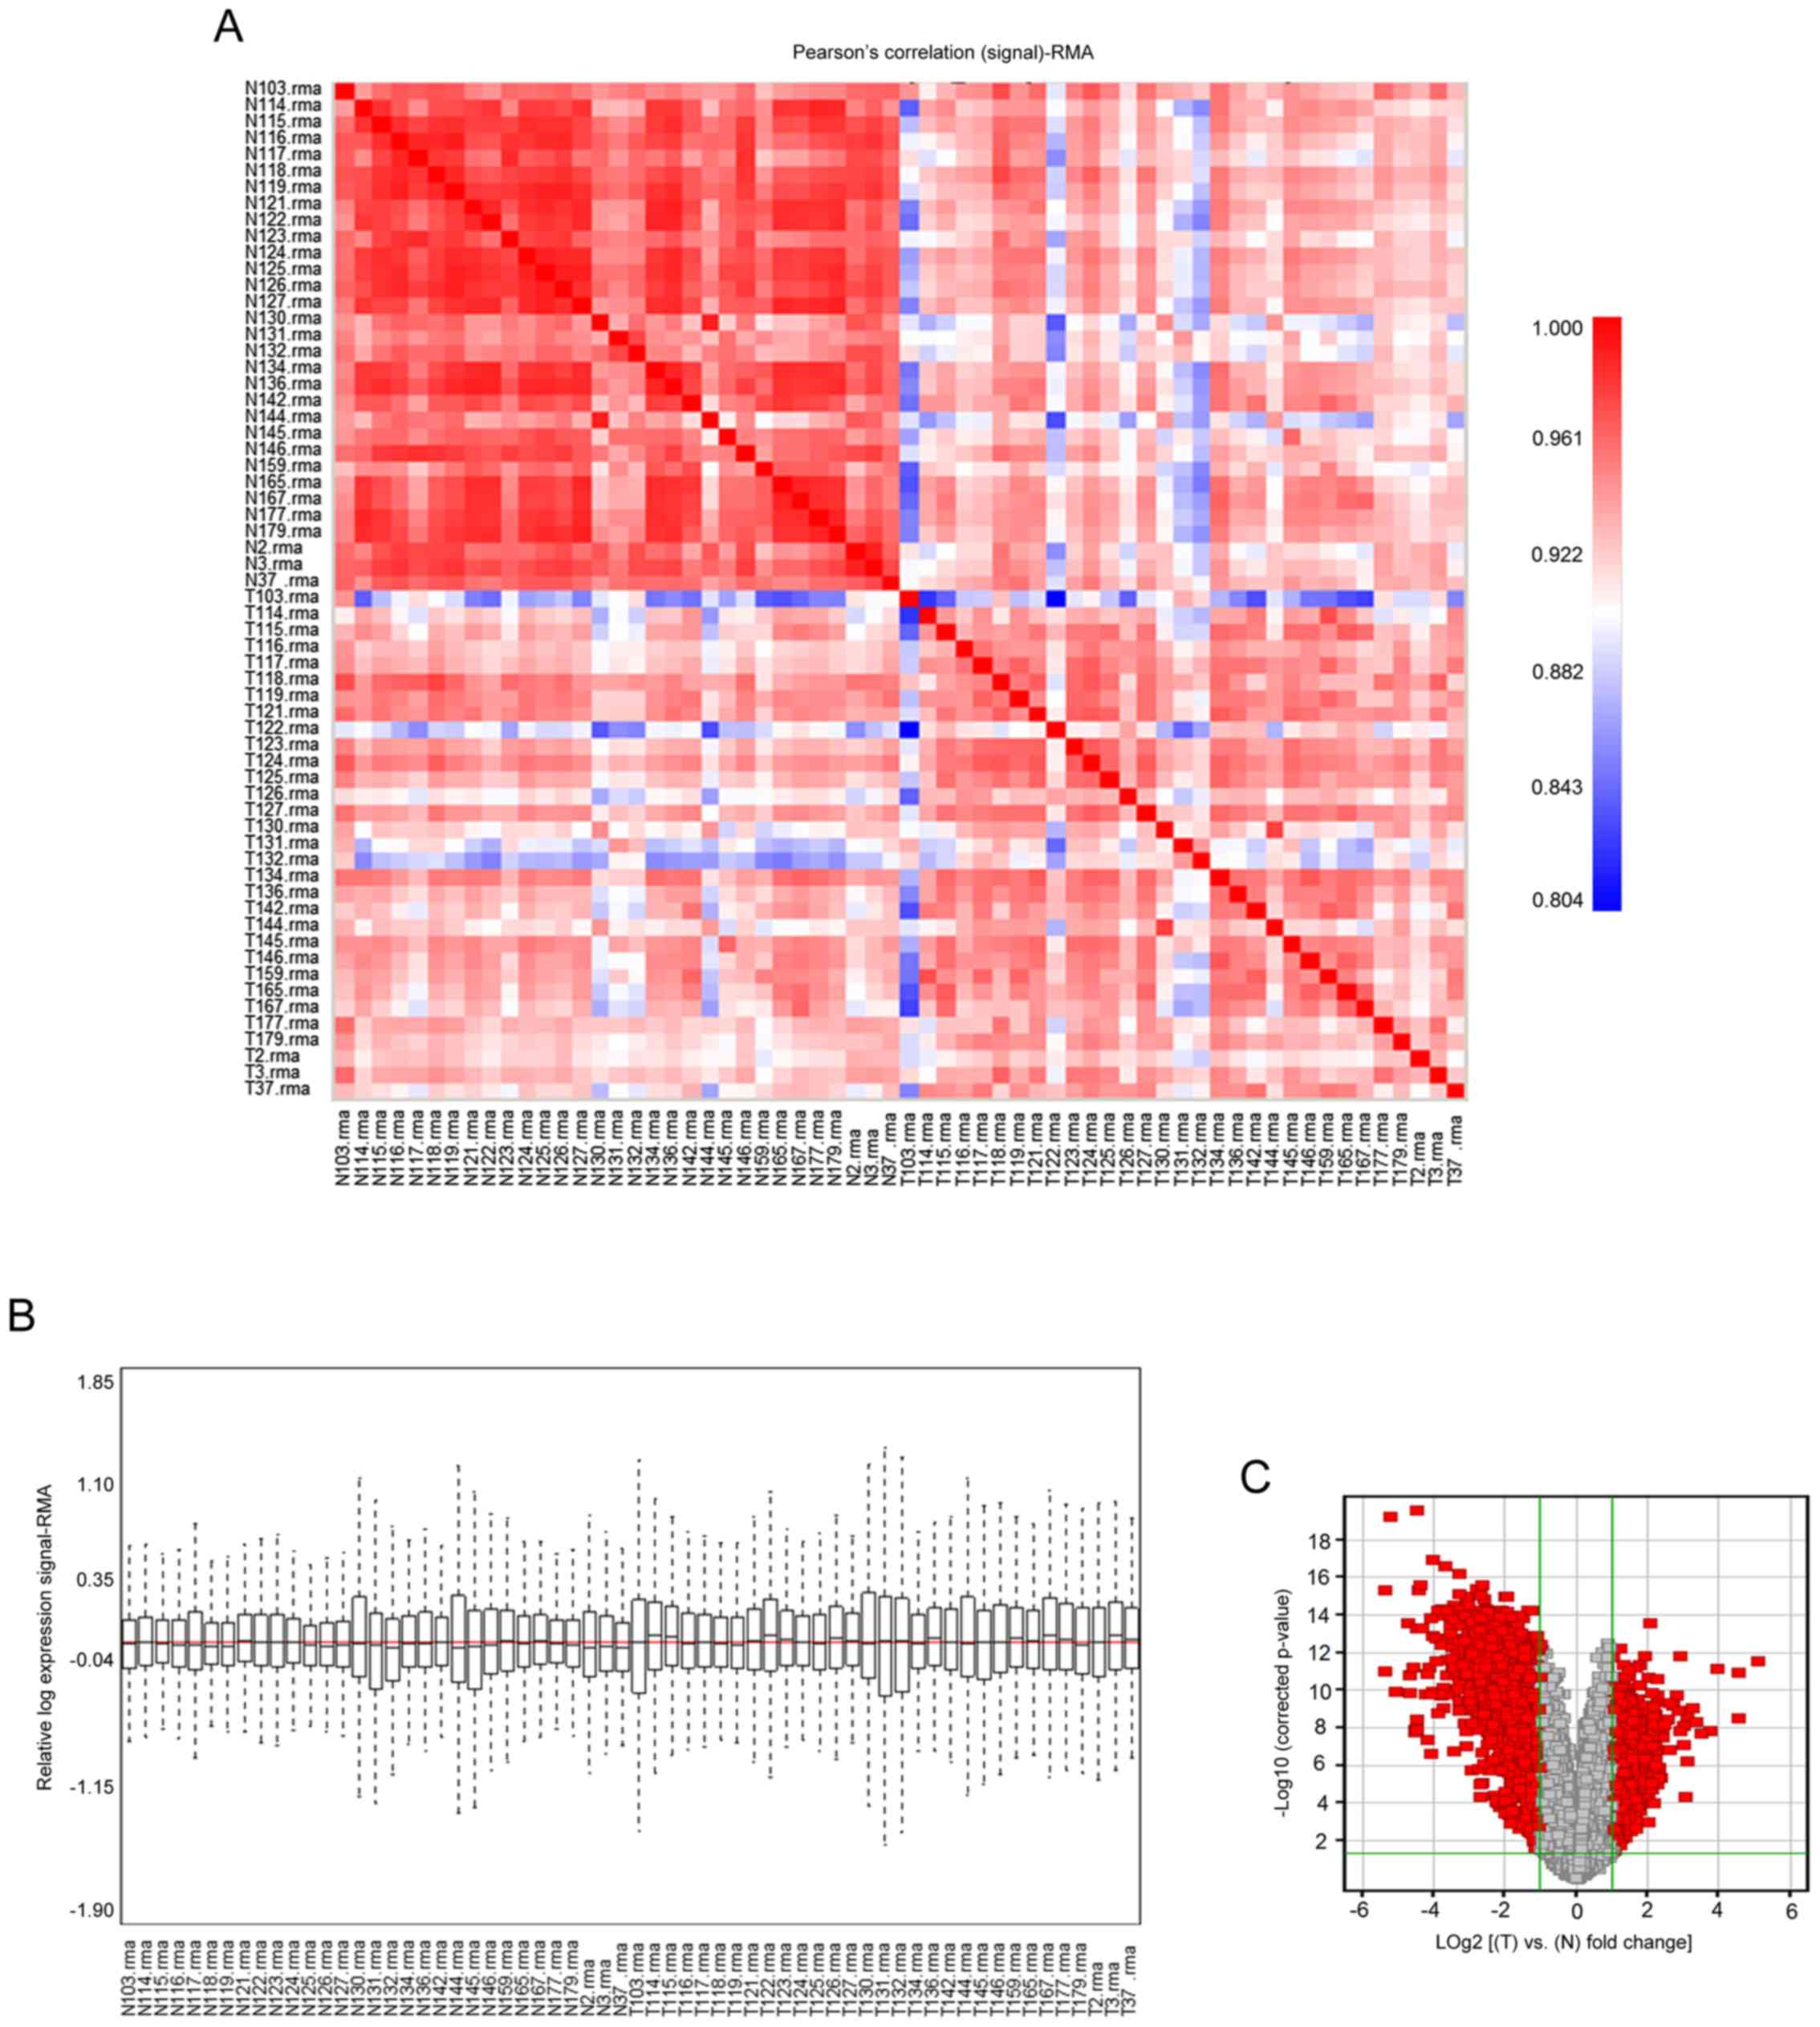
Identification of DEGs
A total of 120 chips were acquired from the GEO
datasets. Subsequent to quality control (signal strength
distribution normalization, correlation analysis and principal
component analysis in Gene-Spring), 62 chips were selected,
including data from 31 lung cancer tissues and their matched normal
lung tissues. The Pearson's correlation (signal) map (Fig. 1A) and Relative Signal Box Plot map
(Fig. 1B) of the pre-treated data
presented the performance of normalization. The series from each
chip were analyzed separately and the DEGs lists were identified.
Information on the expression levels of 54,675 genes was obtained
using the GPL570 platform. A total of 1,970 DEGs (cancer tissues
vs. normal tissues), including 534 up-regulated and 1,436
down-regulated genes (data not shown), were selected based on the
criteria of FDR<0.05 and |Log2 (FC)|>1 (Fig. 1C). The statistical metrics for key
DEGs was shown in Table I.
 | Table I.Statistical metrics for key
differentially expressed genes. |
Table I.
Statistical metrics for key
differentially expressed genes.
| Probe Set ID | Gene | P-value | Fold change (tumor
vs. normal) |
|---|
| 210081_at | AGER |
1.08×10⁻¹⁹ | −42.35560 |
| 232578_at | CLDN18 |
9.04×10⁻¹⁴ | −41.43548 |
| 204712_at | WIF1 |
1.82×10⁻¹² | −34.45463 |
| 209875_s_at | SPP1 |
2.01×10⁻¹⁴ | 34.41545 |
| 203980_at | FABP4 |
4.45×10⁻¹⁷ | −27.01589 |
| 219230_at | TMEM100 |
4.84×10⁻¹⁴ | −24.15423 |
| 37892_at | COL11A1 |
1.10×10⁻¹⁰ | 22.98382 |
| 209469_at | GPM6A |
5.90×10⁻²⁵ | −22.56606 |
| 205725_at | SCGB1A1 |
1.21×10⁻¹⁰ | −22.50023 |
| 213317_at | CLIC5 |
1.04×10⁻¹⁶ | −22.22463 |
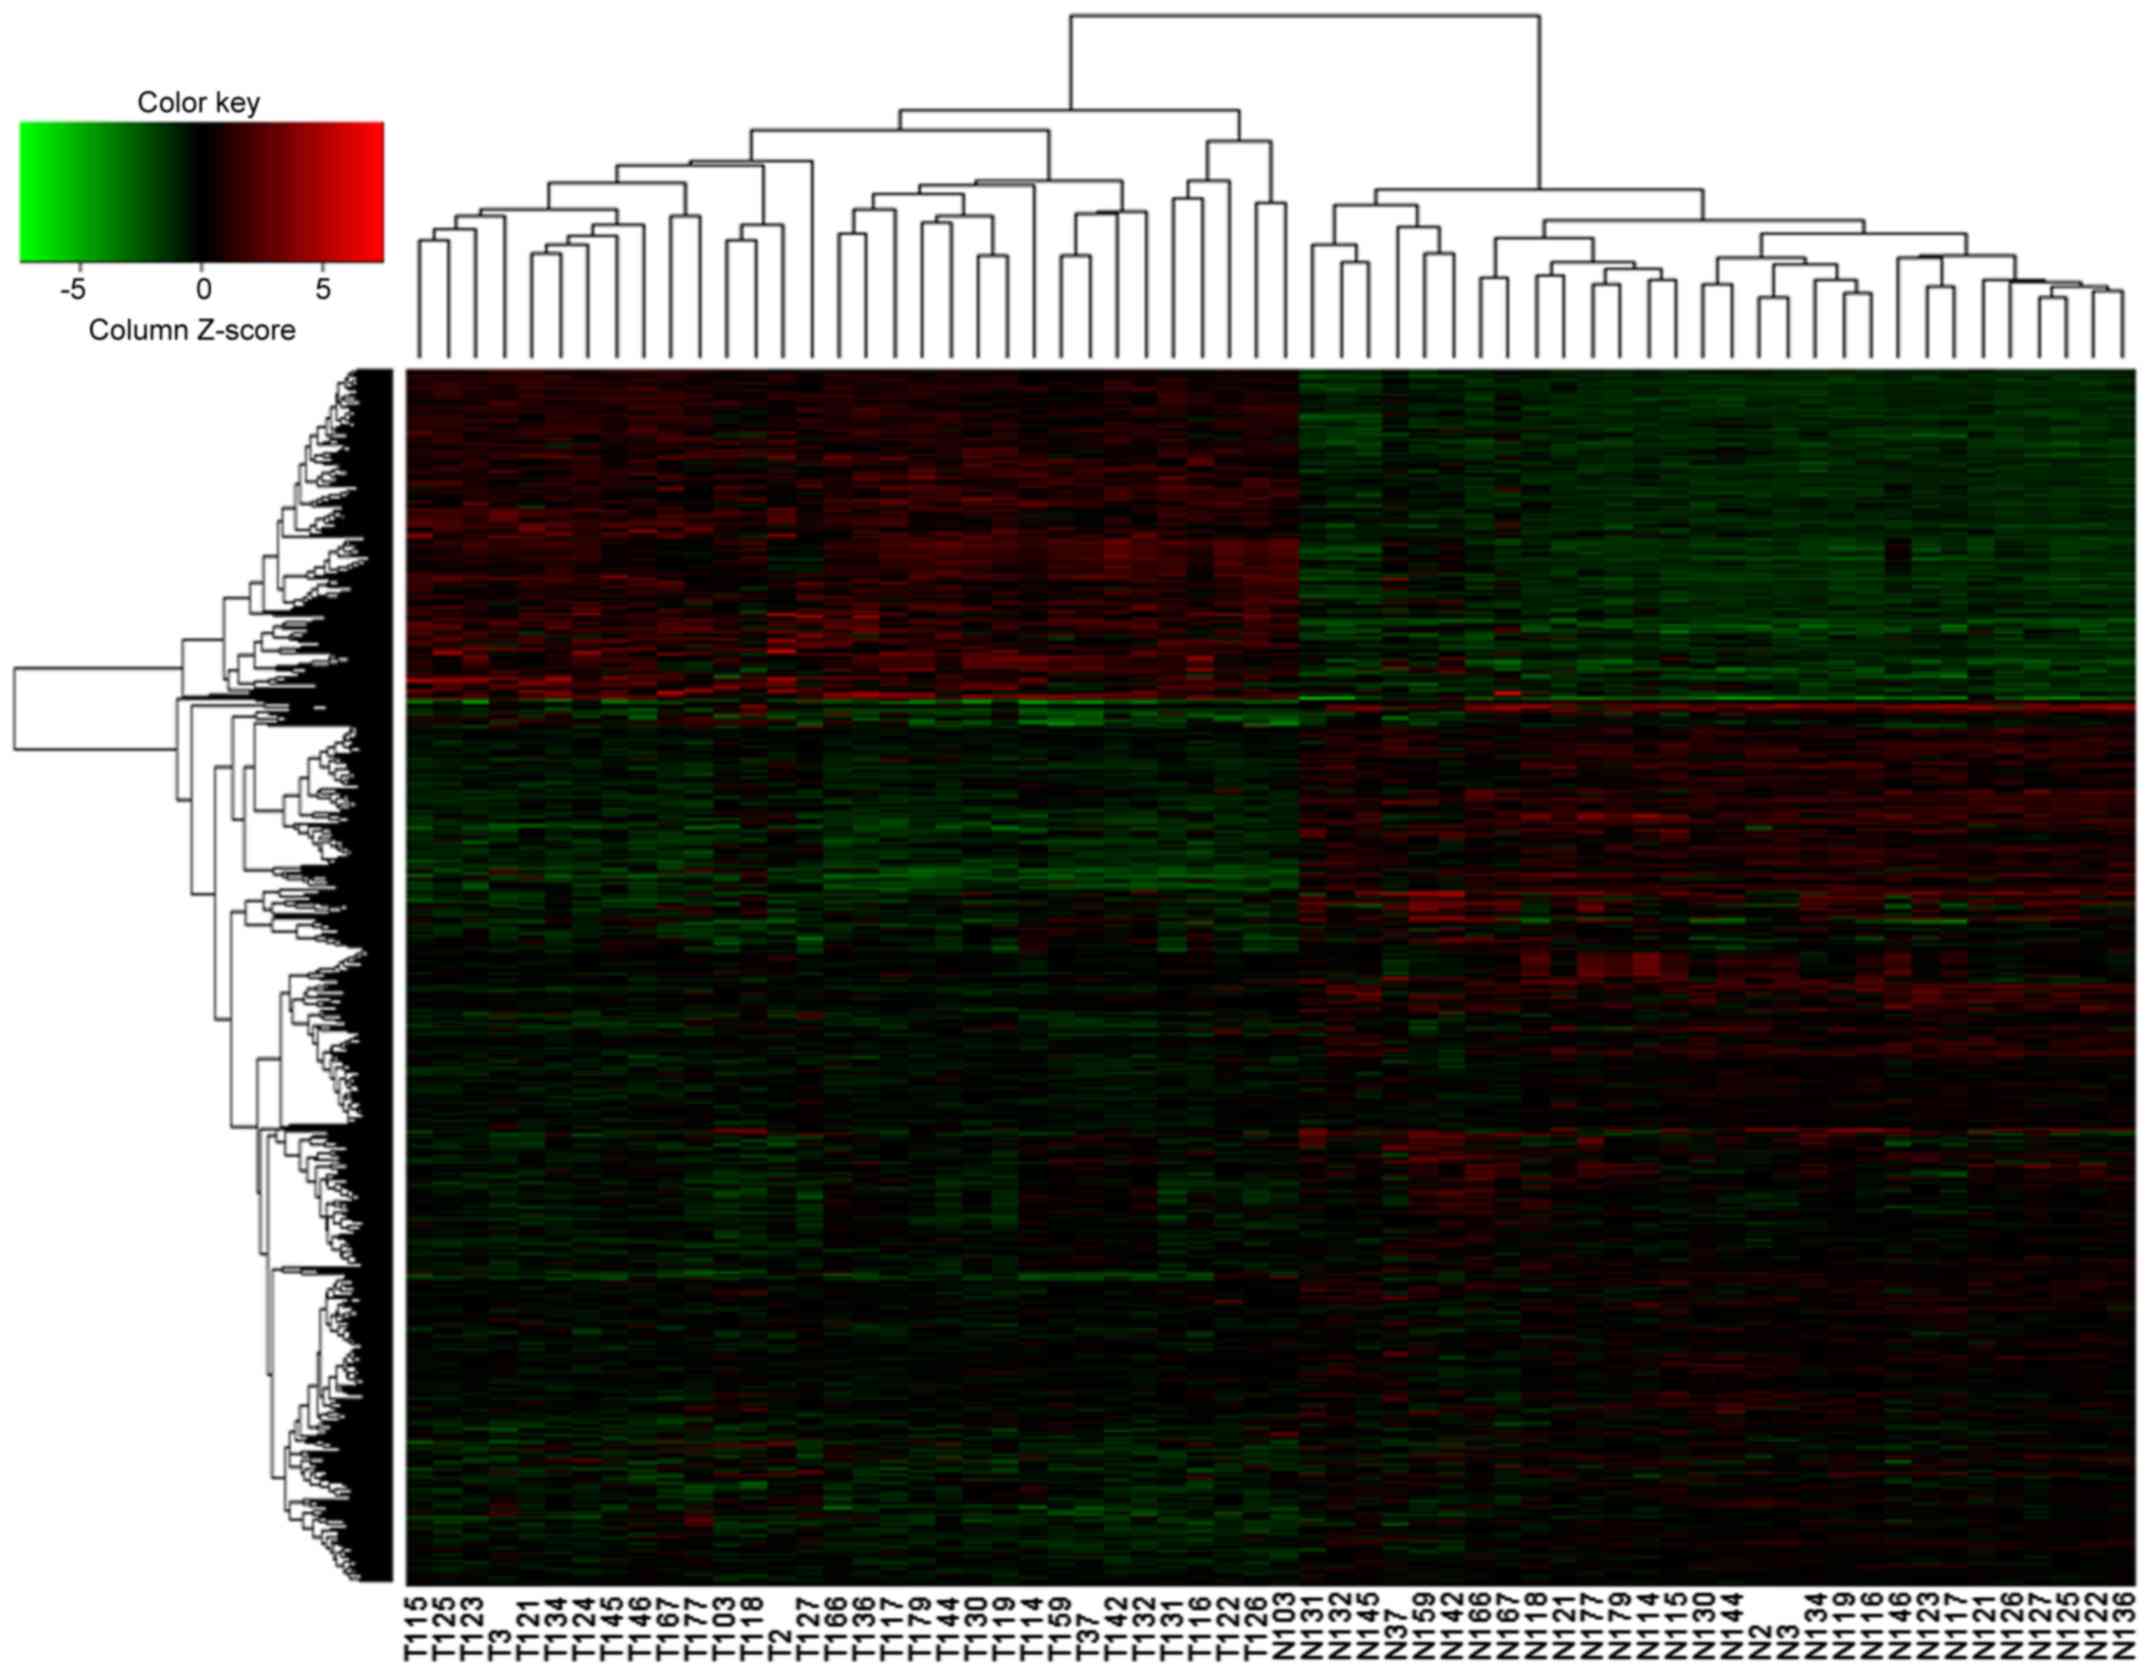
Hierarchical clustering analysis of
DEGs
Hierarchical clustering analysis was performed for
DEGs following the extraction of the expression values. As shown in
Fig. 2, the 62 specimens were
divided into the lung cancer group and the normal group. The
volcano plot demonstrated that compared with normal tissues, there
were more downregulated genes than upregulated genes in lung cancer
tissues. These results indicated that the DEGs possessed distinct
expression patterns in tumors and normal tissues.
GO term enrichment analysis
To investigate the function of the DEGs, GO term
enrichment analysis was conducted with the online software DAVID.
In general, the DEGs were significantly enriched in biological
processes (BP), molecular function (MF) and cellular component (CC)
(Table II). In particular,
upregulated DEGs were significantly enriched in BP, including
‘mitotic cell cycle process’, ‘mitotic cell cycle’, ‘cell
division’, ‘chromosome segregation’ and ‘multicellular organism
catabolic process’ (Table III).
The down-regulated DEGs were also significantly enriched in BP,
including ‘circulatory system development’, ‘cardiovascular system
development’, ‘vasculature development’, ‘blood vessel development’
and ‘locomotion’ (Table III),
respectively.
| Table II.Gene Ontology analysis of
differentially expressed genes. |
Table II.
Gene Ontology analysis of
differentially expressed genes.
| Gene set name |
| Gene counts | % | P-value |
|---|
| GOTERM | GO:0016477-cell
migration | 257 | 14.1 |
3.64×10−40 |
| -BP-FAT |
GO:0072358-cardiovascular system
development | 222 | 12.2 |
5.09×10−40 |
|
|
GO:0072359-circulatory system
development | 222 | 12.2 |
5.09×10−40 |
|
| GO:0048870-cell
motility | 277 | 15.2 |
5.51×10−40 |
|
|
GO:0051674-localization of cell | 277 | 15.2 |
5.51×10−40 |
| GOTERM | GO:0005102-receptor
binding | 222 | 12.2 |
3.09×10⁻¹⁴ |
| -MF-FAT |
GO:0005539-glycosaminoglycan binding | 56 | 3.1 |
4.52×10⁻¹³ |
|
| GO:0019838-growth
factor binding | 39 | 2.1 |
4.62×10⁻¹¹ |
|
|
GO:0098772-molecular function
regulator | 199 | 10.9 |
3.11×10⁻¹⁰ |
|
| GO:0008201-heparin
binding | 42 | 2.3 |
1.20×10⁻⁹ |
| GOTERM |
GO:0005576-extracellular region | 635 | 34.9 |
4.41×10⁻²³ |
| -CC-FAT |
GO:0044421-extracellular region part | 551 | 30.3 |
1.42×10⁻²² |
|
|
GO:0005615-extracellular space | 253 | 13.9 |
2.95×10⁻²⁰ |
|
|
GO:0005578-proteinaceous extracellular
matrix | 97 | 5.3 |
8.71×10⁻²⁰ |
|
|
GO:0031012-extracellular matrix | 123 | 6.8 |
3.43×10⁻¹⁹ |
| Table III.Gene Ontology functional enrichment
analyses of differentially expressed genes associated with lung
cancer. |
Table III.
Gene Ontology functional enrichment
analyses of differentially expressed genes associated with lung
cancer.
| A,
Up-regulated |
|---|
|
|---|
| Category | Term/gene
function | Gene count | % | P-value |
|---|
| GOTERM_BP_FAT | GO:1903047-mitotic
cell cycle process | 62 | 12.5 |
2.47×10⁻¹² |
| GOTERM_BP_FAT | GO:0000278-mitotic
cell cycle | 64 | 12.9 |
9.70×10⁻¹² |
| GOTERM_BP_FAT | GO:0051301-cell
division | 45 | 9.1 |
1.16×10⁻¹⁰ |
| GOTERM_BP_FAT |
GO:0007059-chromosome segregation | 33 | 6.7 |
1.83×10⁻¹⁰ |
| GOTERM_BP_FAT |
GO:0044243-multicellular organism
catabolic process | 16 | 3.2 |
3.58×10⁻¹⁰ |
| GOTERM_MF_FAT |
GO:0005201-extracellular matrix structural
constituent | 12 | 2.4 |
7.34×10⁻⁶ |
| GOTERM_MF_FAT |
GO:0042802-identical protein binding | 60 | 12.1 |
3.73×10⁻⁵ |
| GOTERM_MF_FAT |
GO:0008574-ATP-dependent microtubule motor
activity, plus-end-directed | 6 | 1.2 |
5.13×10⁻⁵ |
| GOTERM_MF_FAT |
GO:1990939-ATP-dependent microtubule motor
activity | 6 | 1.2 |
6.96×10⁻⁵ |
| GOTERM_MF_FAT |
GO:0016758-transferase activity,
transferring hexosyl groups | 16 | 3.2 |
2.89×10⁻⁴ |
| GOTERM_CC_FAT |
GO:0005578-proteinaceous extracellular
matrix | 31 | 6.3 |
1.75×10⁻⁷ |
| GOTERM_CC_FAT |
GO:0005576-extracellular region | 176 | 35.5 |
5.35×10⁻⁶ |
| GOTERM_CC_FAT | GO:0098643-banded
collagen fibril | 6 | 1.2 |
1.26×10⁻⁵ |
| GOTERM_CC_FAT |
GO:0005583-fibrillar collagen trimer | 6 | 1.2 |
1.26×10⁻⁵ |
| GOTERM_CC_FAT |
GO:0000779-condensed chromosome,
centromeric region | 14 | 1.9 |
1.87×10⁻⁵ |
|
| B,
Down-regulated |
|
|
Category | Term/gene
function | Gene
count | % | P-value |
|
| GOTERM_BP_FAT |
GO:0072359-circulatory system
development | 190 | 14.3 |
3.52×10−44 |
| GOTERM_BP_FAT |
GO:0072358-cardiovascular system
development | 190 | 14.3 |
3.52×10−44 |
| GOTERM_BP_FAT |
GO:0001944-vasculature development | 146 | 11.0 |
9.36×10−43 |
| GOTERM_BP_FAT | GO:0001568-blood
vessel development | 137 | 10.3 |
9.96×10−40 |
| GOTERM_BP_FAT |
GO:0040011-locomotion | 242 | 18.3 |
3.86×10−38 |
| GOTERM_MF_FAT | GO:0005102-receptor
binding | 179 | 13.5 |
7.17×10⁻¹⁶ |
| GOTERM_MF_FAT |
GO:0005539-glycosaminoglycan binding | 45 | 3.4 |
6.57×10⁻¹² |
| GOTERM_MF_FAT |
GO:0098772-molecular function
regulator | 155 | 11.7 |
2.41×10⁻¹⁰ |
| GOTERM_MF_FAT | GO:0008201-heparin
binding | 36 | 2.7 |
3.61×10⁻¹⁰ |
| GOTERM_MF_FAT | GO:0003779-actin
binding | 62 | 4.7 |
9.32×10⁻¹⁰ |
| GOTERM_CC_FAT |
GO:0044421-extracellular region part | 401 | 30.3 |
6.04×10⁻¹⁸ |
| GOTERM_CC_FAT |
GO:0005576-extracellular region | 459 | 34.6 |
8.97×10⁻¹⁸ |
| GOTERM_CC_FAT |
GO:0005615-extracellular space | 187 | 14.1 |
4.24×10⁻¹⁶ |
| GOTERM_CC_FAT | GO:0009986-cell
surface | 118 | 8.9 |
1.97×10⁻¹⁵ |
| GOTERM_CC_FAT |
GO:0031012-extracellular matrix | 89 | 6.7 |
7.14×10⁻¹⁴ |
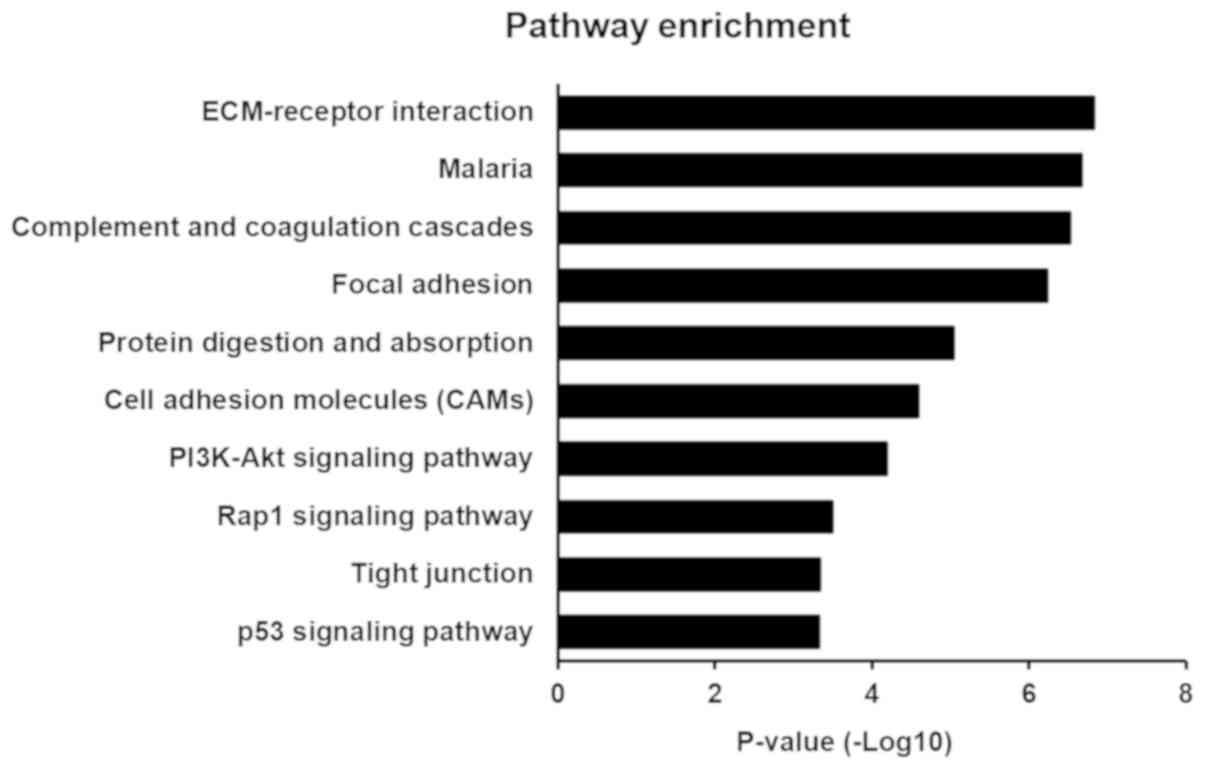
KEGG pathway analysis
KEGG pathway analysis was used to identify pathways
for these DEGs. A total of 19 and 58 significantly enriched
pathways for up-regulated and down-regulated genes, respectively,
were identified. The most significantly enriched pathways
associated with lung cancer were ‘extracellular matrix
(ECM)-receptor interaction’, ‘malaria’, ‘complement and coagulation
cascades’, ‘focal adhesion’, ‘protein digestion and absorption’,
‘cell adhesion molecules’, ‘PI3K-Akt signaling pathway’, ‘Rap1
signaling pathway’, ‘tight junction’ and ‘p53 signaling pathway’
(Fig. 3 and Table IV). In addition, the enriched KEGG
pathways also included the ‘TLR signaling pathway’.
| Table IV.Top 10 most overrepresented Kyoto
Encyclopedia of Genes and Genomes pathways of differentially
expressed genes. |
Table IV.
Top 10 most overrepresented Kyoto
Encyclopedia of Genes and Genomes pathways of differentially
expressed genes.
| Gene set name | Count | % | P-value |
|---|
| hsa04512:
ECM-receptor interaction | 28 | 1.5 |
1.52×10⁻⁷ |
| hsa05144:
Malaria | 20 | 1.1 |
2.20×10⁻⁷ |
| hsa04610:
Complement and coagulation cascades | 24 | 1.3 |
3.03×10⁻⁷ |
| hsa04510: Focal
adhesion | 47 | 2.6 |
5.97×10⁻⁷ |
| hsa04974: Protein
digestion and absorption | 25 | 1.4 |
9.42×10⁻⁶ |
| hsa04514: Cell
adhesion molecules (CAMs) | 33 | 1.8 |
2.59×10⁻⁵ |
| hsa04151: PI3K-Akt
signaling pathway | 61 | 3.3 |
6.57×10⁻⁵ |
| hsa04015: Rap1
signaling pathway | 40 | 2.2 |
3.29×10⁻⁴ |
| hsa04530: Tight
junction | 29 | 1.6 |
4.68×10⁻⁴ |
| hsa04115: p53
signaling pathway | 18 | 1.0 |
4.77×10⁻⁴ |
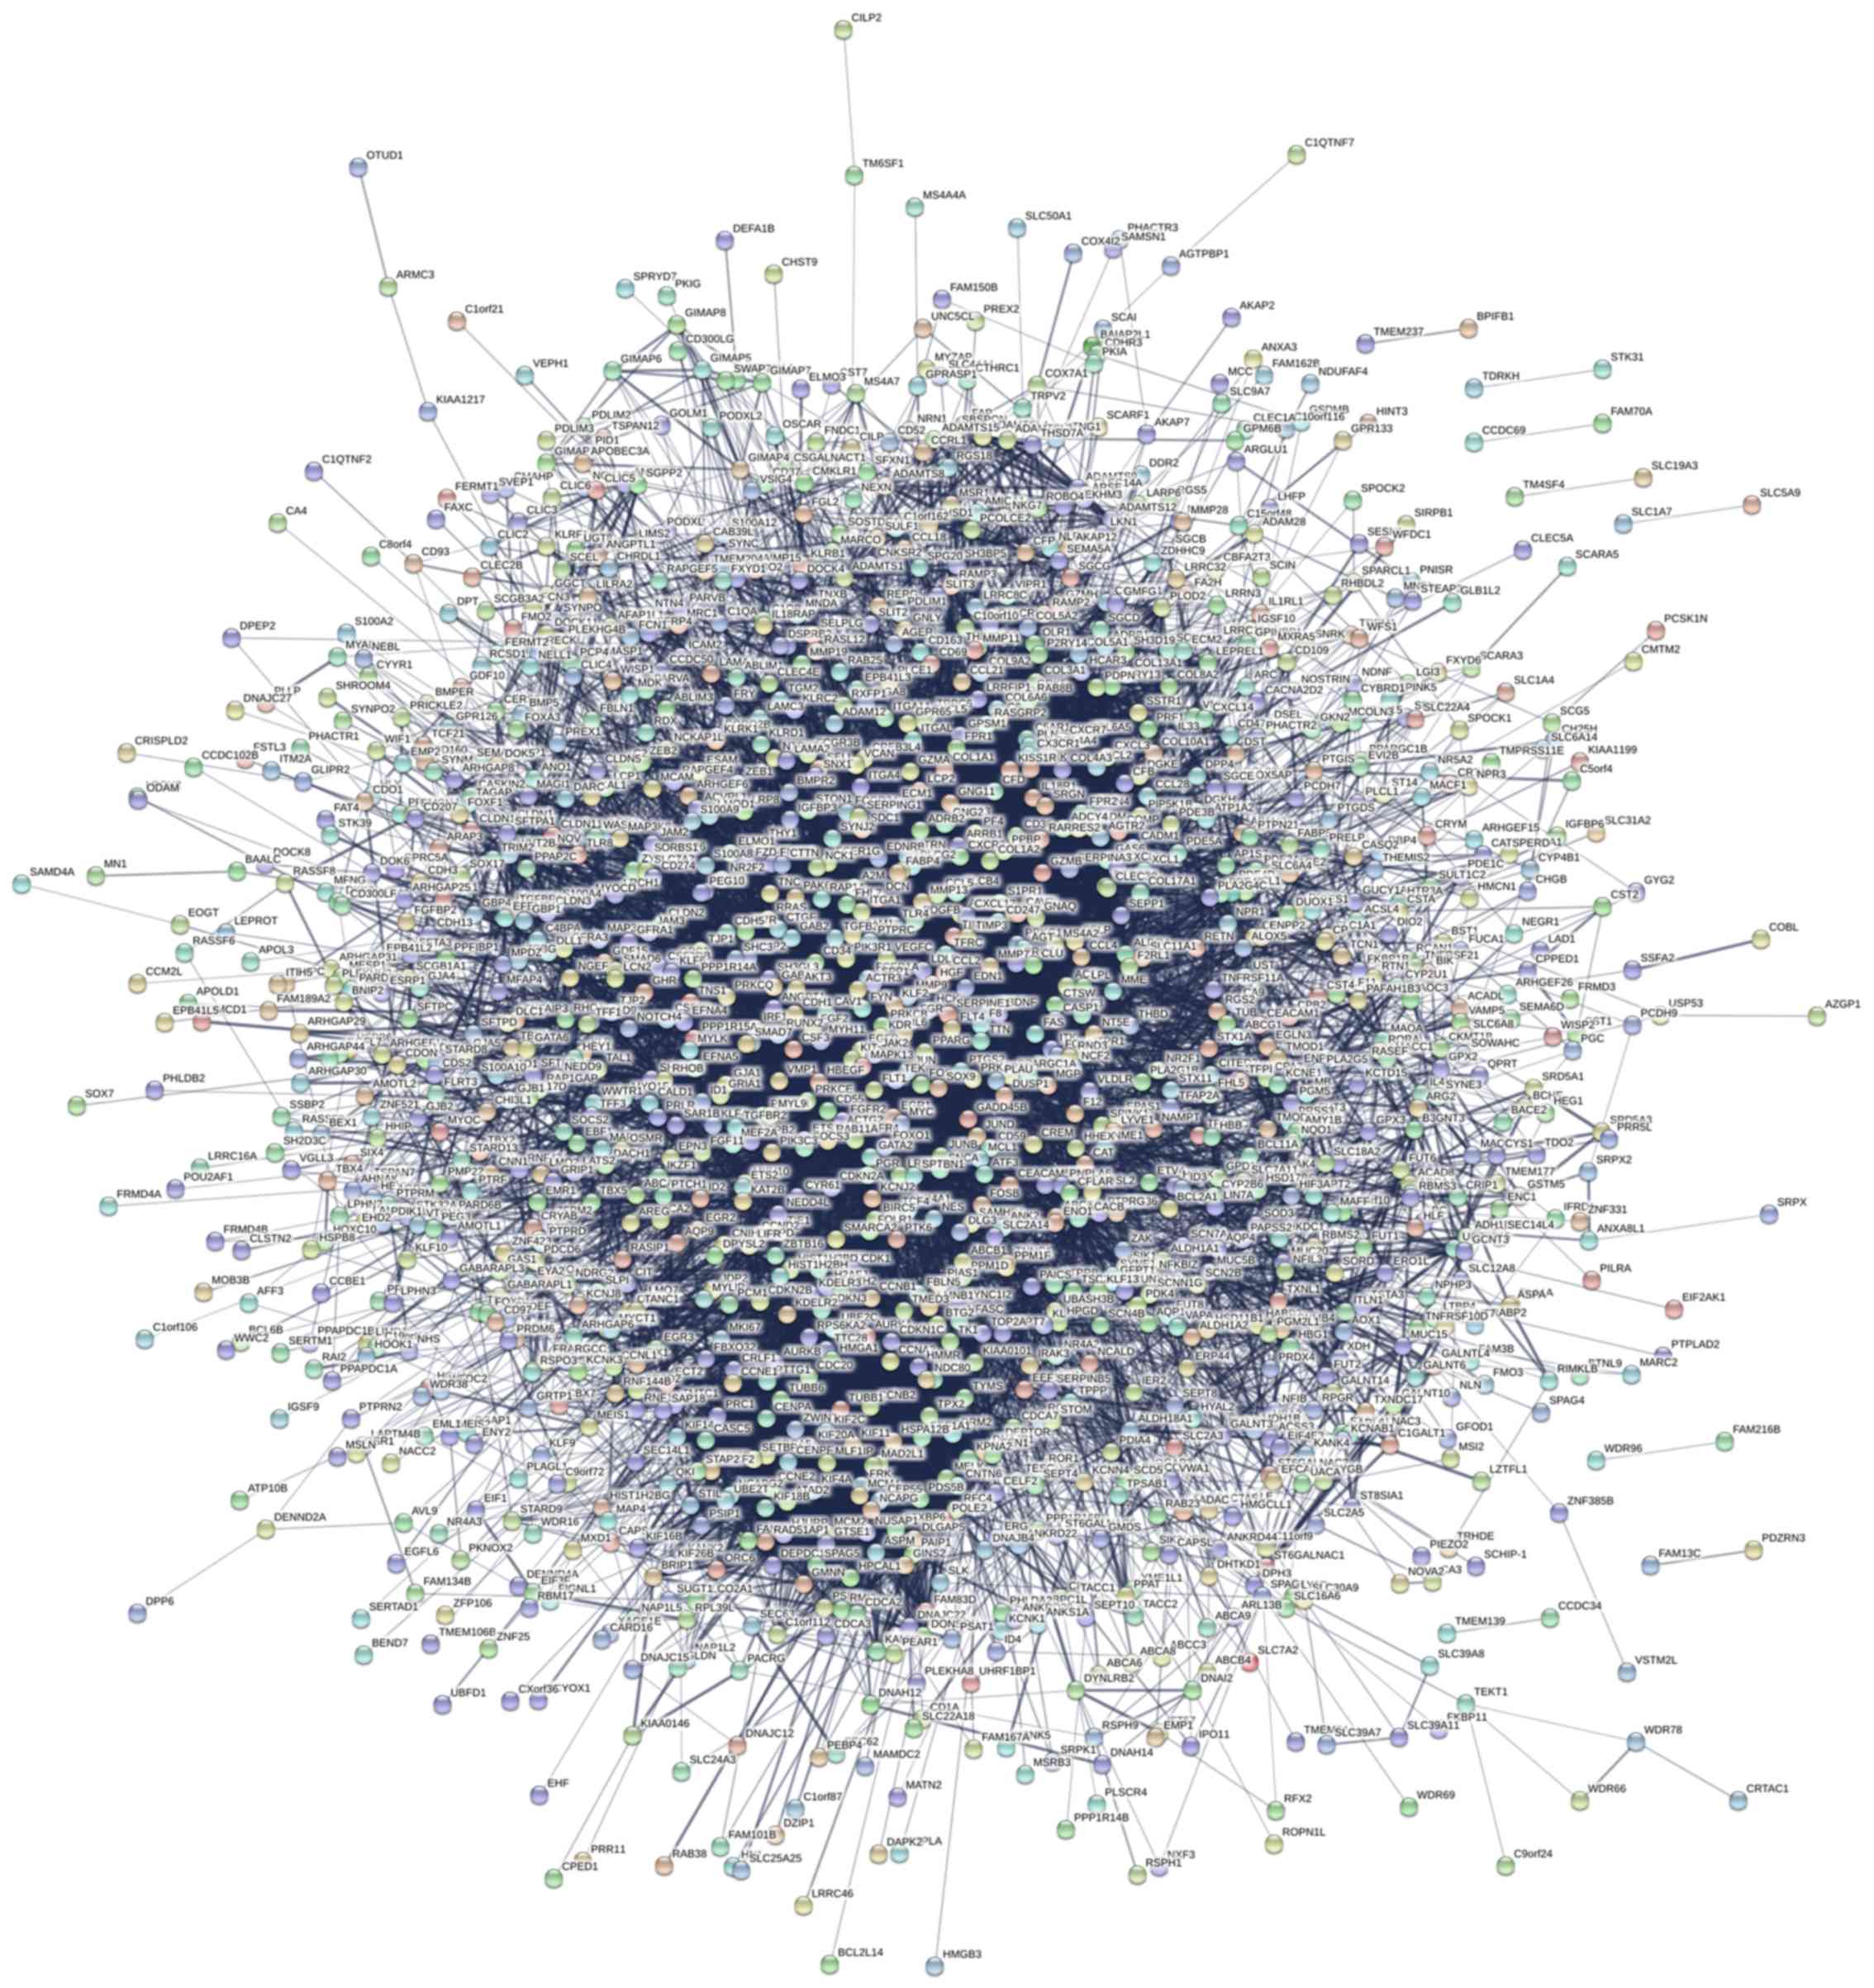
Construction of the PPI network and
screening of modules
Based on the predicted interactions of identified
DEGs, the PPI network was constructed to identify the most
important proteins and biological modules that may serve crucial
roles in the development of lung cancer. A total of 1,770 nodes and
10,667 edges were screened from the PPI network (Fig. 4). Each gene was assigned a degree
representing the number of neighboring nodes in the network and
changes in the proteins/genes. The top 10 hub nodes with the
highest degrees in lung cancer were epidermal growth factor
receptor (EGFR), Jun proto-oncogene activator protein (AP)-1
transcription factor subunit (JUN), Fos proto-oncogene AP-1
transcription factor subunit (FOS), interleukin 6 (IL6), MYC
proto-oncogene basic helix-loop-helix protein 39 (MYC), matrix
metalloproteinase 9 (MMP9), Cyclin dependent kinase 1 (CDK1),
Cadherin 1 (CDH1), FYN proto-oncogene Src family tyrosine kinase
(FYN) and fibroblast growth factor 2 (FGF2) (Table V). EGFR exhibited the highest node
degree of 198 and the betweenness was 0.088. The high degree of
these hub genes indicated that these proteins may serve crucial
roles in maintaining the whole protein interaction network. In
addition, to explore the significance of these DEGs, the top 3
significant modules were selected, and the functional annotation of
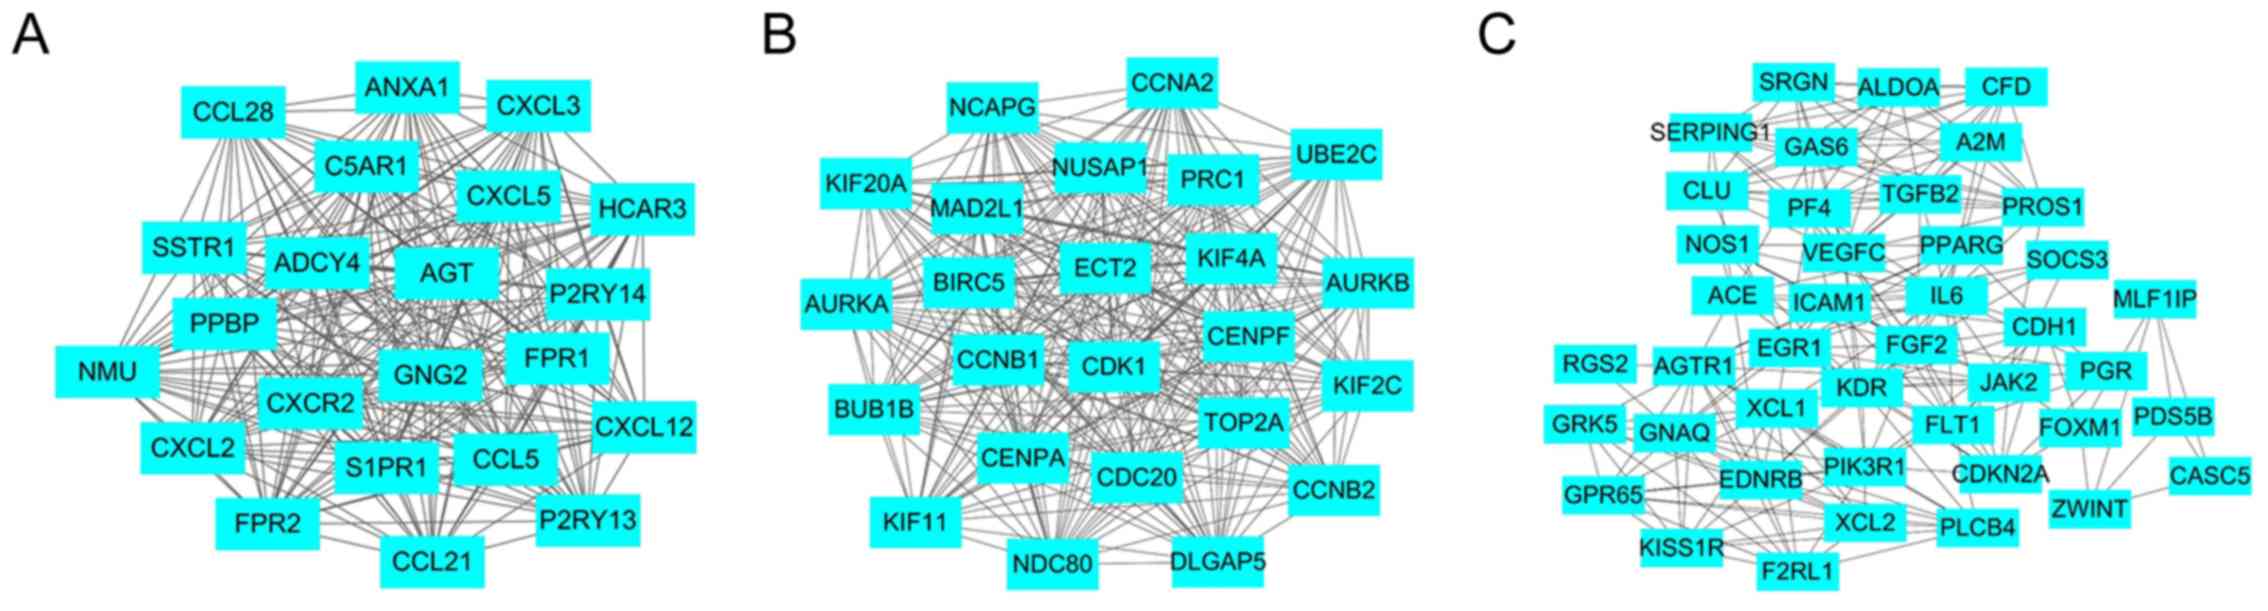
the genes associated with the modules was analyzed (Fig. 5 and Table VI). The results demonstrated that
these modules were associated with the chemokine signaling pathway
(Fig. 5A), cell cycle (Fig. 5B) and pathways in cancer (Fig. 5C).
| Table V.Top 10 hub nodes with highest degrees
of interaction in lung cancer. |
Table V.
Top 10 hub nodes with highest degrees
of interaction in lung cancer.
| Name | Node degree | Betweenness
centrality | Closeness
centrality | Stress
centrality | Clustering
coefficient |
|---|
| EGFR | 198 | 0.088 | 0.464 | 2,403,514 | 0.085 |
| JUN | 185 | 0.055 | 0.457 | 1,936,238 | 0.116 |
| FOS | 164 | 0.038 | 0.447 | 1,365,032 | 0.120 |
| IL6 | 139 | 0.031 | 0.427 | 1,039,056 | 0.138 |
| MYC | 136 | 0.030 | 0.441 | 1,089,702 | 0.147 |
| MMP9 | 135 | 0.028 | 0.433 | 1,011,434 | 0.148 |
| CDK1 | 121 | 0.032 | 0.427 | 936,828 | 0.105 |
| CDH1 | 119 | 0.035 | 0.426 | 1,062,348 | 0.111 |
| FYN | 118 | 0.035 | 0.410 | 1,089,798 | 0.127 |
| FGF2 | 114 | 0.013 | 0.420 | 577,568 | 0.184 |
| Table VI.Top 3 modules from the
protein-protein interaction network. |
Table VI.
Top 3 modules from the
protein-protein interaction network.
| Modules | Term | P-value | False discovery
rate | Genes |
|---|
| 1 | Chemokine signaling
pathway |
6.11×10⁻¹² |
6.23×10⁻⁹ | ADCY4, CXCL5, PPBP,
CCL21, CXCL3, CXCL2, CXCR2, GNG2, CCL5, CXCL12, CCL28 |
|
| Neuroactive
ligand-receptor interaction |
5.62×10⁻⁵ | 0.057248 | P2RY13, S1PR1,
C5AR1, SSTR1, P2RY14, FPR1, FPR2 |
|
| Cytokine-cytokine
receptor interaction |
2.51×10⁻⁴ | 0.255655 | PPBP, CCL21, CXCR2,
CCL5, CXCL12, CCL28 |
| 2 | Cell cycle |
2.53×10⁻⁹ |
1.80×10⁻⁶ | CCNB1, CDK1, CCNB2,
MAD2L1, BUB1B, CDC20, CCNA2 |
|
|
Progesterone-mediated oocyte
maturation |
2.90×10⁻⁶ | 0.002056 | CCNB1, CDK1, CCNB2,
MAD2L1, CCNA2 |
|
| Oocyte meiosis |
2.99×10⁻⁴ | 0.212472 | CDK1, MAD2L1,
CDC20, AURKA |
| 3 | Pathways in
cancer |
7.30×10⁻⁷ |
8.72×10⁻⁴ | AGTR1, EDNRB,
VEGFC, IL6, CDKN2A, PLCB4, GNAQ, PPARG, CDH1, FGF2, PIK3R1,
TGFB2 |
|
| Chagas disease
(American trypanosomiasis) |
9.65×10⁻⁶ | 0.011527 | ACE, IL6, PLCB4,
GNAQ, PIK3R1, TGFB2 |
|
| African
trypanosomiasis |
2.00×10⁻⁵ | 0.023928 | ICAM1, IL6, PLCB4,
GNAQ, F2RL1 |
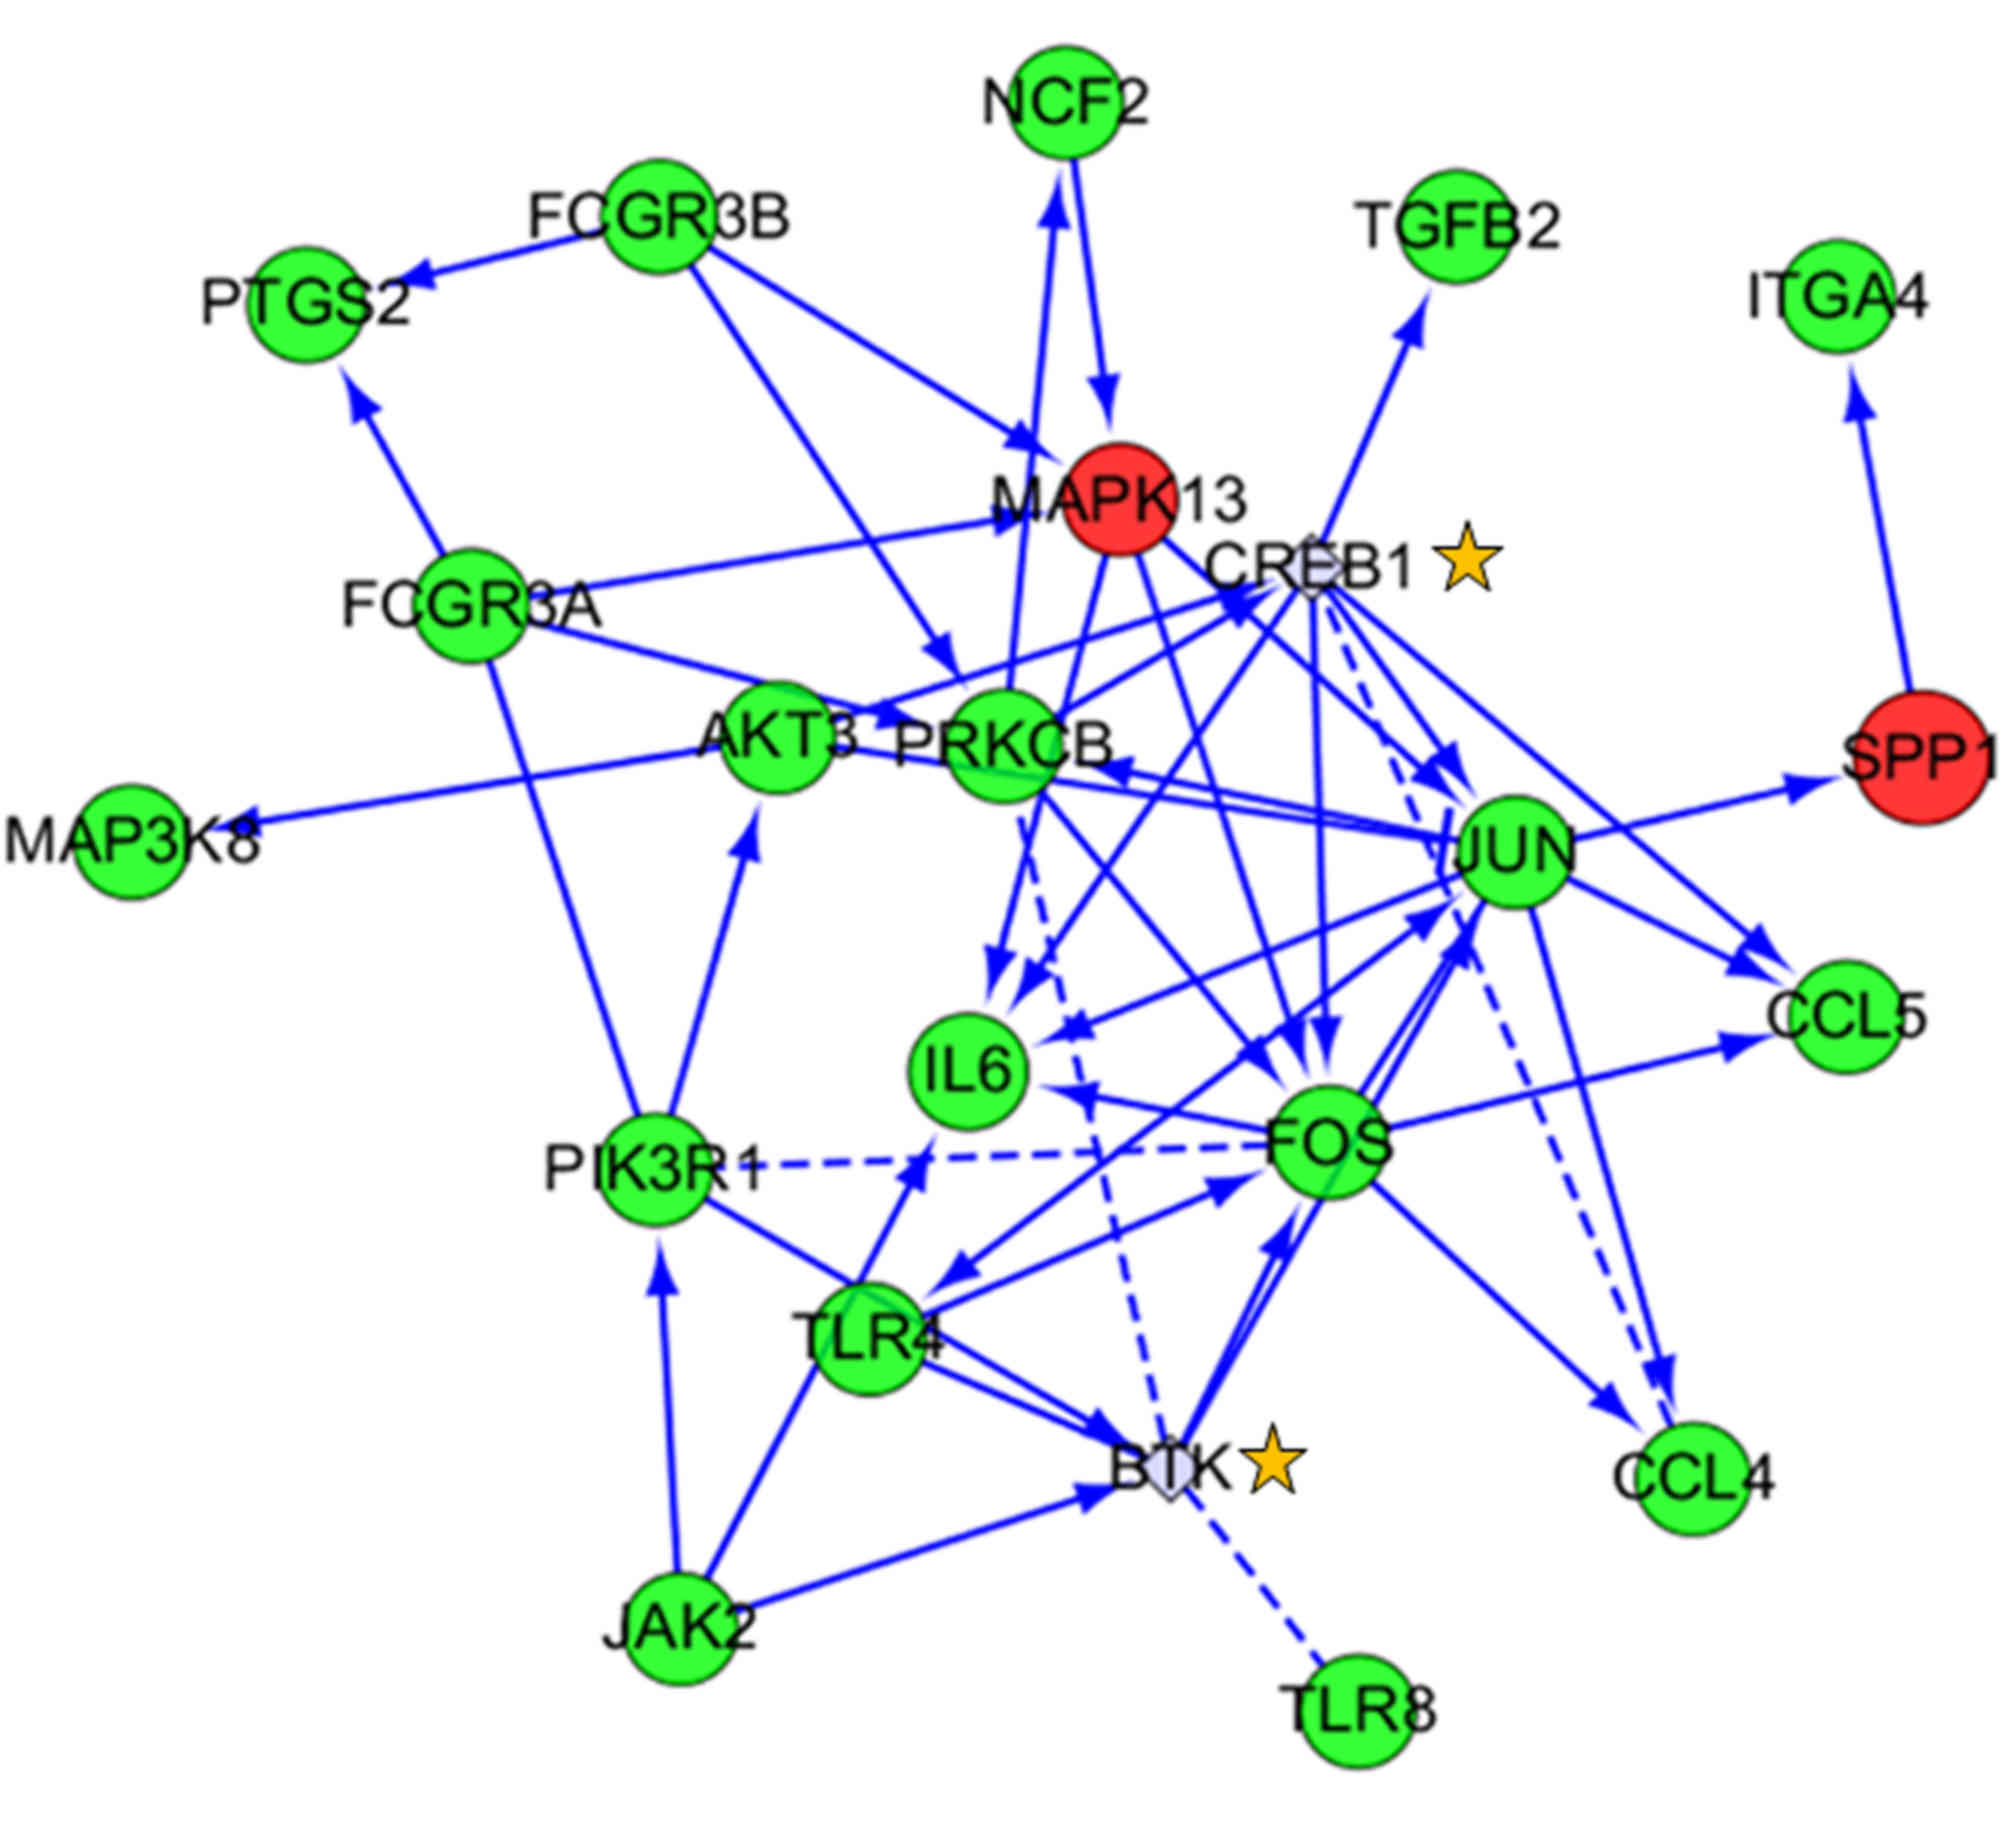
DEGs and pathway analysis of the TLR
pathway
Among all of the significantly enriched pathways for
DEGs, the TLR signaling pathway was the focus of the present study
due to its close association with cancer. There were 12 DEGs
primarily involved in this pathway, including secreted
phosphoprotein 1, IL6, mitogen-activated protein kinase kinase
kinase 8, TLR8, FOS, chemokine ligand 4 (CCL4), TLR4, CCL5, JUN,
phosphoinositide-3- kinase regulatory subunit 1, protein kinase 3
and mitogen-activated protein kinase 13 (Fig. 6 and Table VII). Using the available gene
data of this signaling pathway, a network diagram was constructed
including a series of receptors, signaling kinases, transcription
factors and cytokines. These genes form a complete signaling
pathway to serve an important regulatory role. These results
suggested that the TLR pathway could be one of the significant
pathways involved in cancer treatment, providing a target for drug
development.
| Table VII.Main genes associated with Toll-like
receptors pathways. |
Table VII.
Main genes associated with Toll-like
receptors pathways.
| Gene ID | Gene | P-value | Fold change |
|---|
| 6696 | SPP1 |
2.01×10⁻¹⁴ | 34.41545 |
| 3569 | IL6 |
1.05×10⁻¹² | −8.05396 |
| 1326 | MAP3K8 |
5.29×10⁻¹⁵ | −4.17527 |
| 51311 | TLR8 |
5.01×10⁻¹⁰ | −3.84351 |
| 2353 | FOS |
5.20×10⁻¹² | −3.81020 |
| 6351 | CCL4 |
5.31×10⁻⁹ | −2.77206 |
| 7099 | TLR4 |
3.40×10⁻⁷ | −2.50968 |
| 6352 | CCL5 |
1.51×10⁻⁶ | −2.42054 |
| 3725 | JUN |
1.05×10⁻⁸ | −2.36435 |
| 5295 | PIK3R1 |
8.86×10⁻¹⁰ | −2.26284 |
| 10000 | AKT3 |
9.98×10⁻¹¹ | −2.22438 |
| 5603 | MAPK13 |
7.48×10⁻¹¹ | 2.14546 |
Discussion
Cancer is essentially a genetic disease, and many
genetic alterations accumulate during the multistep process of
carcinogenesis, which eventually leads to abnormal unrestrained
cell growth and malignant phenotype (20). Lung cancer is the most common
primary pulmonary malignant tumor in terms of incidence and
mortality (21). The total number
of lung cancer cases has become a major public health concern in
China (rates are 40 per 100,000), and the situation in other parts
of world, including Micronesia/Polynesia (rates are >76.5 per
100,000) and Eastern Europe (rates are >61.2 per 100,000) is
even worse (3), which is mainly
attributable to cigarette smoking (22). Therefore, the early diagnosis and
effective treatment of lung cancer is urgently required, which may
be achieved via the identification of the DEGs between lung cancer
and normal tissues, and by understanding the underlying molecular
mechanism. Microarray and high throughput sequencing analysis can
screen a large number of genes in the human genome for further
functional analysis, and can be widely used to screen biomarkers
for early diagnosis and specific therapeutic targets. Therefore,
they may aid the diagnosis of lung cancer in the early stages and
the development of targeted treatment, thus improving
prognosis.
Microarray studies possess great potential to
provide novel insights into the pathogenesis of complex diseases
(23). The present study
systematically applied integrated bioinformatics methods to
identify new candidates that serve roles in the progression of lung
cancer. The data extracted from the GEO dataset contained 31 pairs
of lung cancer and normal samples. A total of 534 up-regulated and
1,436 down-regulated DEGs in cancerous tissues, when compared with
normal samples, were identified using bioinformatics analysis,
indicating that the occurrence and development of cancer is closely
associated with genetic mutations (24). Then, GO and KEGG pathway analyses
were used to investigate the interactions of these DEGs. Finally a
PPI network identified specific key genes. The results of the
present study may provide potential biomarkers for the diagnosis of
lung cancer. For example, it was identified that advanced
glycosylation end-product specific receptor (AGER), with a 42-fold
decrease in patients with lung cancer, was the most differentially
expressed gene in DEG analysis. AGER belongs to the immunoglobulin
superfamily and is an oncogenic transmembrane receptor up-regulated
in various types of human cancers, including squamous cervical
cancer (25) and pancreatic tumor
(26). However, it has an
inhibitory effect on lung cancer development (27). In patients with lung
adenocarcinoma, AGER polymorphisms are associated with disease
susceptibility and prognosis, and can predict survival (28,29).
Therefore, AGER may be effective as a potential marker for lung
cancer, however, further studies are required.
GO analysis is helpful for annotating genes and gene
products. GO analysis in the present study demonstrated that
up-regulated DEGs were mainly involved in the cell cycle and
material metabolism, including ‘mitotic cell cycle’, ‘cell
division’ and ‘multicellular organism catabolic’ processes, which
mainly refer to cellular processes. However, the down-regulated
DEGs were mainly involved in organ systems, including the
circulatory system, cardiovascular system and vasculature
development, all of which are associated with systemic processes.
This is consistent with the knowledge that the defective
functioning of cell biological processes (30) and the state of the body system
status are important causes of tumor development and progression.
Also it indicated that cellular activity was enhanced and system
function was weakened. Therefore, monitoring the expression of
these DEGs may aid the discovery of mechanisms for tumorigenesis
and tumor progression. It is known that signal transduction in
cancer cells differs substantially from normal cells (31). The KEGG pathway database contains
information on systematic analysis of gene functions, linking
genomics with functional information. Enrichment analysis
identified important KEGG pathways associated with lung cancer,
including ‘ECM-receptor interaction’, ‘malaria’, ‘complement and
coagulation cascades’, ‘focal adhesion’, and ‘protein digestion and
absorption’. Pathway disturbance in ‘ECM-receptor interaction’,
‘complement and coagulation cascades’ and ‘adhesive attraction’
(32–34) have been highly noted in lung
cancer. The present study identified that the ECM-tumor cell
interactions may activate intracellular signaling pathways, which
is responsible for tumor cell invasion and metastasis (35,36).
The present study focused on the TLR pathway among
the enriched pathways that are expressed in a wide variety of
cancer cells and immune cells (37). This pathway is centrally involved
in the initiation of innate immunity and induction of adaptive
immune responses (38), which is
useful for maintaining organism integrity and is markedly involved
in cancer progression, development and defense (39). However, the activation of TLRs in
tumor cells induces the synthesis of pro-inflammatory factors and
immunosuppressive molecules, which can enhance the resistance of
tumor cells to cytotoxic lymphocyte attack and lead to immune
evasion (40). Cancer cells can
avoid immune surveillance as TLRs trigger cells to release a number
of biological factors, including IL6, vascular endothelial growth
factor and MMP (41). Notably,
these factors were included in the DEGs between lung cancer tissues
and normal tissues. Therefore, it was suggested that targeting
tumor TLR signaling pathways may provide promising therapeutic
methods (40).
A PPI network was constructed with DEGs, which
revealed that the top 10 hub genes with highest degrees were EGFR,
JUN, FOS, IL6, MYC, MMP9, CDK1, CDH1, FYN and FGF2. EGFR was at the
core of the PPI network and exhibited the highest degree with a
connectivity of 198, suggesting a role for EGFR as a potential
marker for lung cancer. EGFR is a transmembrane receptor tyrosine
kinase and is frequently observed in lung cancer patients with poor
differentiation and poor prognosis (42). It can lead to signal transduction
including cell differentiation, proliferation and apoptosis through
phosphorylating other proteins, and has been reported to be
overexpressed in patients with NSCLC (43). Activating mutations in the EGFR
gene are considered to be favorable prognostic markers (44) and have become a novel personalized
treatment target for patients with NSCLC (45). However, the role of EGFR as a
marker of lung cancer diagnosis and treatment is unclear and
requires further investigation. JUN and FOS are the predominant
components of AP-1, which serves a critical role in the
transcriptional regulation of genes involved in cell survival,
proliferation, migration and transformation (46). These two proteins are overexpressed
in the development of various carcinomas, including pulmonary
malignancies (47). The IL6 gene
is co-expressed with a number of oncogenic genes, and IL6 is
produced and secreted by immune and tumor cells (48). It is involved in different
physiologic and pathophysiologic processes such as promoting
tumorigenesis and modifying various tumor behaviors, including
apoptosis, migration, proliferation, angiogenesis and metabolism
(49,50). Elevated levels of serum IL6 are
associated with poor prognosis in the majority of malignancies
(51). The MYC gene is an oncogene
with a high frequency of amplification in lung cancer (52) and its protein has important roles
in cell proliferation and differentiation. It is closely associated
with tumor occurrence, progression and prognosis in different types
of tumors (53). The other 5 hub
genes also serve important roles in cell migration, proliferation,
differentiation, apoptosis and cell cycle process (54–56),
affecting the development of cancer. MMP9 degrades and restores the
ECM, and its overexpression not only promotes NSCLC metastasis
directly but can also facilitate metastatic spread (57). CDK1 is expressed in high levels in
tumor tissues, and is associated with poor prognosis and shorter
survival time in patients with NSCLC (58). The CDH1 gene encodes a tumor
suppressor protein and its mutation or deletion results in the
promotion of cancer invasion and metastasis (55) in addition to poor prognosis
(59). FYN contributes to the
progression of cancer by regulating cell cycle, differentiation,
adhesion, motility and survival of cells (56). FGF2 has been shown to be activated
in lung cancer (60) and is
involved in angiogenesis by initiating a signal transduction
cascade that promotes cell proliferation, motility and angiogenesis
(61). Therefore, all the hub
genes may possess key roles in lung cancer and could interact with
each other. They may be used as potential effective candidates for
early diagnosis or prognosis.
The PPI module contained 1,770 nodes and 10,667
edges, and the top 3 modules extracted were ‘chemokine signaling
pathway’, ‘cell cycle’ and ‘pathways in cancer’, all of which are
associated with lung cancer. The chemokine signaling pathway
contains a number of chemokine proteins, including chemokine (C-X-C
motif) ligand (CXCL)-2, CXCL3 and CCL18, which are differentially
expressed in lung cancer. As chemokine gradients direct cell
migration towards the site of inflammation (62), they are key in immune system
functioning, and are important for the removal of pathogens,
inflammation, cell and organ development, wound repair, occurrence
of tumors and metastasis, and transplantation immune rejection
(63–65). Cell cycle disorders and overgrowth
of cells are common biological characteristics of tumors, leading
to increased cell proliferation and decreased apoptosis (66). It should be noted that the cell
cycle is a tightly regulated process and is frequently aberrant in
lung cancer (67). The relevant
inhibitors of the cell cycle have emerged as novel drugs for the
treatment of lung cancer by suppressing the unrestricted cell
division and growth of lung cancer cells (67). Finally, pathways in cancer are of
similar significance in cancer cell proliferation, apoptosis,
metastasis, angiogenesis and survival.
However, there were still certain limitations in the
present study. First, although a set number of genes were revealed
to be potential markers for lung cancer, further experiments are
still required to evaluate the roles of these genes as novel
biomarkers. Secondly, the gene expression profile was composed of
93% adenocarcinomas and 7% squamous cancer, since there is great
genetic heterogeneity between adenocarcinoma and squamous cancer.
Furthermore, the variation trend of JUN, FOS, IL6, MYC and FGF2 in
this study is inconsistent with that reported in previous studies
(46,47); this may be due to the limited
numbers of chips. Therefore, further data for lung cancer are
required to validate the results of the present study. Thirdly, due
to the limitation of the dataset used, it was not possible to
construct a miRNA-target gene regulatory network or transcription
factor-target gene regulatory network. Finally, survival analysis
could not be performed based on the data presented in the present
study.
In conclusion, the present study provided a
comprehensive bioinformatics analysis of DEGs in lung cancer.
Analysis of these altered genes provided information regarding the
molecular mechanisms of lung cancer and significant biomarkers or
targets for the diagnosis and treatment of lung cancer. However,
further molecular biological experiments are required to confirm
the function of the DEGs and pathways in different types of lung
cancer.
Acknowledgements
Not applicable.
Funding
The present study was supported by the Funds of
National Natural Science Foundation of China (grant nos. 81473388
and 8274144).
Availability of data and materials
The datasets used and/or analyzed in the current
study are available from the corresponding authors on reasonable
request.
Authors' contributions
TL and YB conceived and designed the study. ZL and
XZ analyzed the microarray datasets and interpreted the results. SY
and HT downloaded the gene expression profile from the Gene
Expression Omnibus. TL wrote and edited the manuscript. All authors
read and approved the final manuscript.
Ethics approval and consent to
participate
Not applicable.
Patient consent for publication
Not applicable.
Competing interests
The authors declare that they have no competing
interests.
Glossary
Abbreviations
Abbreviations:
|
DEGs
|
differentially expressed genes
|
|
KEGG
|
Kyoto Encyclopedia of Genes and
Genomes
|
|
PPI
|
protein-protein interaction
|
|
GEO
|
Gene Expression Omnibus
|
|
BP
|
biological processes
|
|
MF
|
molecular function
|
|
CC
|
cellular component
|
|
DAVID
|
Database for Annotation, Visualization
and Integrated Discovery
|
|
FC
|
fold-change
|
|
STRING
|
Search Tool for the Retrieval of
Interacting Genes
|
References
|
1
|
Cancer Genome Atlas Research Network:
Comprehensive molecular profiling of lung adenocarcinoma. Nature.
511:543–550. 2014. View Article : Google Scholar : PubMed/NCBI
|
|
2
|
Cohen AJ, Brauer M, Burnett R, Anderson
HR, Frostad J, Estep K, Balakrishnan K, Brunekreef B, Dandona L,
Dandona R, et al: Estimates and 25-year trends of the global burden
of disease attributable to ambient air pollution: An analysis of
data from the Global Burden of Diseases Study 2015. Lancet.
389:1907–1918. 2017. View Article : Google Scholar : PubMed/NCBI
|
|
3
|
Bray F, Ferlay J, Soerjomataram I, Siegel
RL, Torre LA and Jemal A: Global cancer statistics 2018: GLOBOCAN
estimates of incidence and mortality worldwide for 36 cancers in
185 countries. CA Cancer J Clin. 68:394–424. 2018. View Article : Google Scholar : PubMed/NCBI
|
|
4
|
Wang LQ, Zhao LH and Qiao YZ:
Identification of potential therapeutic targets for lung cancer by
bioinformatics analysis. Mol Med Rep. 13:1975–1982. 2016.
View Article : Google Scholar : PubMed/NCBI
|
|
5
|
Aran V, Victorino AP, Thuler LC and
Ferreira CG: Colorectal cancer: Epidemiology, disease mechanisms
and interventions to reduce onset and mortality. Clin Colorectal
Cancer. 15:195–203. 2016. View Article : Google Scholar : PubMed/NCBI
|
|
6
|
Zhang M, Gao C, Yang Y, Li G, Dong J, Ai
Y, Ma Q and Li W: MiR-424 promotes non-small cell lung cancer
progression and metastasis through regulating the tumor suppressor
gene TNFAIP1. Cell Physiol Biochem. 42:211–221. 2017. View Article : Google Scholar : PubMed/NCBI
|
|
7
|
Singleton KR, Hinz TK, Kleczko EK, Marek
LA, Kwak J, Harp T, Kim J, Tan AC and Heasley LE: Kinome RNAi
screens reveal synergistic targeting of MTOR and FGFR1 pathways for
treatment of lung cancer and HNSCC. Cancer Res. 75:4398–4406. 2015.
View Article : Google Scholar : PubMed/NCBI
|
|
8
|
Liang B, Li C and Zhao J: Identification
of key pathways and genes in colorectal cancer using bioinformatics
analysis. Med Oncol. 33:1112016. View Article : Google Scholar : PubMed/NCBI
|
|
9
|
Descotes F, Dessen P, Bringuier PP,
Decaussin M, Martin PM, Adams M, Villers A, Lechevallier E,
Rebillard X, Rodriguez-Lafrasse C, et al: Microarray gene
expression profiling and analysis of bladder cancer supports the
sub-classification of T1 tumours into T1a and T1b stages. BJU Int.
113:333–342. 2014. View Article : Google Scholar : PubMed/NCBI
|
|
10
|
Sakashita H, Inoue H, Akamine S, Ishida T,
Inase N, Shirao K, Mori M and Mimori K: Identification of the
NEDD4L gene as a prognostic marker by integrated microarray
analysis of copy number and gene expression profiling in non-small
cell lung cancer. Ann Surg Oncol. 20 Suppl 3:S590–S598. 2013.
View Article : Google Scholar : PubMed/NCBI
|
|
11
|
Yu L, Wang L and Chen S: Dual character of
Toll-like receptor signaling: Pro-tumorigenic effects and
anti-tumor functions. Biochim Biophys Acta 1835. 144–154. 2013.
|
|
12
|
Pinto A, Morello S and Sorrentino R: Lung
cancer and Toll-like receptors. Cancer Immunol Immunother.
60:1211–1220. 2011. View Article : Google Scholar : PubMed/NCBI
|
|
13
|
Lu TP, Tsai MH, Lee JM, Hsu CP, Chen PC,
Lin CW, Shih JY, Yang PC, Hsiao CK, Lai LC and Chuang EY:
Identification of a novel biomarker, SEMA5A, for non-small cell
lung carcinoma in nonsmoking women. Cancer Epidemiol Biomarkers
Prev. 19:2590–2597. 2010. View Article : Google Scholar : PubMed/NCBI
|
|
14
|
Hu WP, Zeng YY, Zuo YH and Zhang J:
Identification of novel candidate genes involved in the progression
of emphysema by bioinformatic methods. Int J Chron Obstruct Pulmon
Dis. 13:3733–3747. 2018. View Article : Google Scholar : PubMed/NCBI
|
|
15
|
Gautier L, Cope L, Bolstad BM and Irizarry
RA: Affy-analysis of Affymetrix GeneChip data at the probe level.
Bioinformatics. 20:307–315. 2004. View Article : Google Scholar : PubMed/NCBI
|
|
16
|
Hardcastle TJ: Generalised empirical
Bayesian methods for discovery of differential data in
high-throughput biology. Bioinformatics. 32:195–202.
2016.PubMed/NCBI
|
|
17
|
Huang DW, Sherman BT, Tan Q, Kir J, Liu D,
Bryant D, Guo Y, Stephens R, Baseler MW, Lane HC and Lempicki RA:
DAVID Bioinformatics Resources: Expanded annotation database and
novel algorithms to better extract biology from large gene lists.
Nucleic Acids Res. 35:W169–W175. 2007. View Article : Google Scholar : PubMed/NCBI
|
|
18
|
Franceschini A, Szklarczyk D, Frankild S,
Kuhn M, Simonovic M, Roth A, Lin J, Minguez P, Bork P, von Mering C
and Jensen LJ: STRING v9.1: Protein-protein interaction networks,
with increased coverage and integration. Nucleic Acids Res.
41:D808–D815. 2013. View Article : Google Scholar : PubMed/NCBI
|
|
19
|
Bader GD and Hogue CW: An automated method
for finding molecular complexes in large protein interaction
networks. BMC Bioinformatics. 4:22003. View Article : Google Scholar : PubMed/NCBI
|
|
20
|
Carter SL, Eklund AC, Kohane IS, Harris LN
and Szallasi Z: A signature of chromosomal instability inferred
from gene expression profiles predicts clinical outcome in multiple
human cancers. Nat Genet. 38:1043–1048. 2006. View Article : Google Scholar : PubMed/NCBI
|
|
21
|
Dela Cruz CS, Tanoue LT and Matthay RA:
Lung cancer: Epidemiology, etiology, and prevention. Clin Chest
Med. 32:605–644. 2011. View Article : Google Scholar : PubMed/NCBI
|
|
22
|
Wang GZ, Cheng X, Li XC, Liu YQ, Wang XQ,
Shi X, Wang ZY, Guo YQ, Wen ZS, Huang YC and Zhou GB: Tobacco smoke
induces production of chemokine CCL20 to promote lung cancer.
Cancer Lett. 363:60–70. 2015. View Article : Google Scholar : PubMed/NCBI
|
|
23
|
Masuda K, Kuwano Y, Nishida K and Rokutan
K: Application of DNA microarray technology to gerontological
studies. Methods Mol Biol 1048. 285–308. 2013. View Article : Google Scholar
|
|
24
|
Chew SK, Lu D, Campos LS, Scott KL, Saci
A, Wang J, Collinson A, Raine K, Hinton J, Teague JW, et al:
Polygenic in vivo validation of cancer mutations using transposons.
Genome Biol. 15:4552014. View Article : Google Scholar : PubMed/NCBI
|
|
25
|
Zhu X, Zhou L, Li R, Shen Q, Cheng H, Shen
Z and Zhu H: AGER promotes proliferation and migration in cervical
cancer. Biosci Rep. 38:BSR201713292018. View Article : Google Scholar : PubMed/NCBI
|
|
26
|
Kang R, Tang D, Lotze MT and Zeh HJ III:
AGER/RAGE-mediated autophagy promotes pancreatic tumorigenesis and
bioenergetics through the IL6-pSTAT3 pathway. Autophagy. 8:989–991.
2012. View Article : Google Scholar : PubMed/NCBI
|
|
27
|
Pan Z, Liu L, Nie W, Miggin S, Qiu F, Cao
Y, Chen J, Yang B, Zhou Y, Lu J and Yang L: Long non-coding RNA
AGER-1 functionally upregulates the innate immunity gene AGER and
approximates its anti-tumor effect in lung cancer. Mol Carcinog.
57:305–318. 2018. View
Article : Google Scholar : PubMed/NCBI
|
|
28
|
Yamaguchi K, Iwamoto H, Sakamoto S,
Horimasu Y, Masuda T, Miyamoto S, Nakashima T, Ohshimo S, Fujitaka
K, Hamada H and Hattori N: AGER rs2070600 polymorphism elevates
neutrophil-lymphocyte ratio and mortality in metastatic lung
adenocarcinoma. Oncotarget. 8:94382–94392. 2017.PubMed/NCBI
|
|
29
|
Wang X, Cui E, Zeng H, Hua F, Wang B, Mao
W and Feng X: RAGE genetic polymorphisms are associated with risk,
chemotherapy response and prognosis in patients with advanced
NSCLC. PLoS One. 7:e437342012. View Article : Google Scholar : PubMed/NCBI
|
|
30
|
Evan GI and Vousden KH: Proliferation,
cell cycle and apoptosis in cancer. Nature. 411:342–348. 2001.
View Article : Google Scholar : PubMed/NCBI
|
|
31
|
Kolch W, Halasz M, Granovskaya M and
Kholodenko BN: The dynamic control of signal transduction networks
in cancer cells. Nat Rev Cancer. 15:515–527. 2015. View Article : Google Scholar : PubMed/NCBI
|
|
32
|
Lv M and Wang L: Comprehensive analysis of
genes, pathways, and TFs in nonsmoking Taiwan females with lung
cancer. Exp Lung Res. 41:74–83. 2015. View Article : Google Scholar : PubMed/NCBI
|
|
33
|
Ajona D, Pajares MJ, Corrales L,
Perez-Gracia JL, Agorreta J, Lozano MD, Torre W, Massion PP,
de-Torres JP, Jantus-Lewintre E, et al: Investigation of complement
activation product c4d as a diagnostic and prognostic biomarker for
lung cancer. J Natl Cancer Inst. 105:1385–1393. 2013. View Article : Google Scholar : PubMed/NCBI
|
|
34
|
Fonseca FL, Azzalis LA, Feder D, Nogoceke
E, Junqueira VB, Valenti VE and de Abreu LC: Adhesion molecules
affected by treatment of lung cancer cells with epidermal growth
factor. Lung. 189:383–389. 2011. View Article : Google Scholar : PubMed/NCBI
|
|
35
|
Wang H, Zhu Y, Zhao M, Wu C, Zhang P, Tang
L, Zhang H, Chen X, Yang Y and Liu G: miRNA-29c suppresses lung
cancer cell adhesion to extracellular matrix and metastasis by
targeting integrin β1 and matrix metalloproteinase 2 (MMP2). PLoS
One. 8:e701922013. View Article : Google Scholar : PubMed/NCBI
|
|
36
|
Ungewiss C, Rizvi ZH, Roybal JD, Peng DH,
Gold KA, Shin DH, Creighton CJ and Gibbons DL: The
microRNA-200/Zeb1 axis regulates ECM-dependent β1-integrin/FAK
signaling, cancer cell invasion and metastasis through CRKL. Sci
Rep. 6:186522016. View Article : Google Scholar : PubMed/NCBI
|
|
37
|
Rakoff-Nahoum S and Medzhitov R: Toll-like
receptors and cancer. Nat Rev Cancer. 9:57–63. 2009. View Article : Google Scholar : PubMed/NCBI
|
|
38
|
Kawai T and Akira S: The role of
pattern-recognition receptors in innate immunity: Update on
Toll-like receptors. Nat Immunol. 11:373–384. 2010. View Article : Google Scholar : PubMed/NCBI
|
|
39
|
Chen R, Alvero AB, Silasi DA, Steffensen
KD and Mor G: Cancers take their Toll-the function and regulation
of Toll-like receptors in cancer cells. Oncogene. 27:225–233. 2008.
View Article : Google Scholar : PubMed/NCBI
|
|
40
|
Huang B, Zhao J, Unkeless JC, Feng ZH and
Xiong H: TLR signaling by tumor and immune cells: A double-edged
sword. Oncogene. 27:218–224. 2008. View Article : Google Scholar : PubMed/NCBI
|
|
41
|
Li D, Jin Y, Sun Y, Lei J and Liu C:
Knockdown of toll-like receptor 4 inhibits human NSCLC cancer cell
growth and inflammatory cytokine secretion in vitro, in
vivo. Int J Oncol. 45:813–821. 2014. View Article : Google Scholar : PubMed/NCBI
|
|
42
|
Jo U, Park KH, Whang YM, Sung JS, Won NH,
Park JK and Kim YH: EGFR endocytosis is a novel therapeutic target
in lung cancer with wild-type EGFR. Oncotarget. 5:1265–1278. 2014.
View Article : Google Scholar : PubMed/NCBI
|
|
43
|
Sequist LV and Lynch TJ: EGFR tyrosine
kinase inhibitors in lung cancer: An evolving story. Annu Rev Med.
59:429–442. 2008. View Article : Google Scholar : PubMed/NCBI
|
|
44
|
Fang S and Wang Z: EGFR mutations as a
prognostic and predictive marker in non-small-cell lung cancer.
Drug Des Devel Ther. 8:1595–1611. 2014.PubMed/NCBI
|
|
45
|
Moschini I, Dell'Anna C, Losardo PL, Bordi
P, D'Abbiero N and Tiseo M: Radiotherapy of non-small-cell lung
cancer in the era of EGFR gene mutations and EGF receptor tyrosine
kinase inhibitors. Future Oncol. 11:2329–2342. 2015. View Article : Google Scholar : PubMed/NCBI
|
|
46
|
Li Y, Yang Z, Li W, Xu S, Wang T, Wang T,
Niu M, Zhang S, Jia L and Li S: TOPK promotes lung cancer
resistance to EGFR tyrosine kinase inhibitors by phosphorylating
and activating c-Jun. Oncotarget. 7:6748–6764. 2016.PubMed/NCBI
|
|
47
|
Durchdewald M, Angel P and Hess J: The
transcription factor Fos: A Janus-type regulator in health and
disease. Histol Histopathol. 24:1451–1461. 2009.PubMed/NCBI
|
|
48
|
Ataie-Kachoie P, Pourgholami MH and Morris
DL: Inhibition of the IL-6 signaling pathway: A strategy to combat
chronic inflammatory diseases and cancer. Cytokine Growth Factor
Rev. 24:163–173. 2013. View Article : Google Scholar : PubMed/NCBI
|
|
49
|
Kumari N, Dwarakanath BS, Das A and Bhatt
AN: Role of interleukin-6 in cancer progression and therapeutic
resistance. Tumour Biol. 37:11553–11572. 2016. View Article : Google Scholar : PubMed/NCBI
|
|
50
|
Nilsson MB, Langley RR and Fidler IJ:
Interleukin-6, secreted by human ovarian carcinoma cells, is a
potent proangiogenic cytokine. Cancer Res. 65:10794–10800. 2005.
View Article : Google Scholar : PubMed/NCBI
|
|
51
|
Heikkilä K, Ebrahim S and Lawlor DA:
Systematic review of the association between circulating
interleukin-6 (IL-6) and cancer. Eur J Cancer. 44:937–945. 2008.
View Article : Google Scholar : PubMed/NCBI
|
|
52
|
Tai MC, Kajino T, Nakatochi M, Arima C,
Shimada Y, Suzuki M, Miyoshi H, Yatabe Y, Yanagisawa K and
Takahashi T: miR-342-3p regulates MYC transcriptional activity via
direct repression of E2F1 in human lung cancer. Carcinogenesis.
36:1464–1473. 2015.PubMed/NCBI
|
|
53
|
Gabay M, Li Y and Felsher DW: MYC
activation is a hallmark of cancer initiation and maintenance. Cold
Spring Harb Perspect Med. 4:a0142412014. View Article : Google Scholar : PubMed/NCBI
|
|
54
|
Sica A, Allavena P and Mantovani A: Cancer
related inflammation: The macrophage connection. Cancer Lett.
267:204–215. 2008. View Article : Google Scholar : PubMed/NCBI
|
|
55
|
Yu Q, Guo Q, Chen L and Liu S:
Clinicopathological significance and potential drug targeting of
CDH1 in lung cancer: A meta-analysis and literature review. Drug
Des Devel Ther. 9:2171–2178. 2015.PubMed/NCBI
|
|
56
|
Thomas SM and Brugge JS: Cellular
functions regulated by Src family kinases. Annu Rev Cell Dev Biol.
13:513–609. 1997. View Article : Google Scholar : PubMed/NCBI
|
|
57
|
Zhen Y, Liu J, Huang Y, Wang Y, Li W and
Wu J: miR-133b inhibits cell growth, migration, and invasion by
targeting MMP9 in non-small cell lung cancer. Oncol Res.
25:1109–1116. 2017. View Article : Google Scholar : PubMed/NCBI
|
|
58
|
Zhang C, Elkahloun AG, Robertson M, Gills
JJ, Tsurutani J, Shih JH, Fukuoka J, Hollander MC, Harris CC,
Travis WD, et al: Loss of cytoplasmic CDK1 predicts poor survival
in human lung cancer and confers chemotherapeutic resistance. PLoS
One. 6:e238492011. View Article : Google Scholar : PubMed/NCBI
|
|
59
|
Liu X, Su L and Liu X: Loss of CDH1
up-regulates epidermal growth factor receptor via phosphorylation
of YBX1 in non-small cell lung cancer cells. FEBS Lett.
587:3995–4000. 2013. View Article : Google Scholar : PubMed/NCBI
|
|
60
|
Behrens C, Lin HY, Lee JJ, Raso MG, Hong
WK, Wistuba II and Lotan R: Immunohistochemical expression of basic
fibroblast growth factor and fibroblast growth factor receptors 1
and 2 in the pathogenesis of lung cancer. Clin Cancer Res.
14:6014–6022. 2008. View Article : Google Scholar : PubMed/NCBI
|
|
61
|
Ribatti D, Vacca A, Rusnati M and Presta
M: The discovery of basic fibroblast growth factor/fibroblast
growth factor-2 and its role in haematological malignancies.
Cytokine Growth Factor Rev. 18:327–334. 2007. View Article : Google Scholar : PubMed/NCBI
|
|
62
|
Zhang L, Yu M, Deng J, Lv X, Liu J, Xiao
Y, Yang W, Zhang Y and Li C: Chemokine signaling pathway involved
in CCL2 expression in patients with rheumatoid arthritis. Yonsei
Med J. 56:1134–1142. 2015. View Article : Google Scholar : PubMed/NCBI
|
|
63
|
González-Motos V, Jürgens C, Ritter B,
Kropp KA, Durán V, Larsen O, Binz A, Ouwendijk WJD, Lenac Rovis T,
Jonjic S, et al: Varicella zoster virus glycoprotein C increases
chemokine-mediated leukocyte migration. PLoS Pathog.
13:e10063462017. View Article : Google Scholar : PubMed/NCBI
|
|
64
|
Griffith JW, Sokol CL and Luster AD:
Chemokines and chemokine receptors: Positioning cells for host
defense and immunity. Annu Rev Immunol. 32:659–702. 2014.
View Article : Google Scholar : PubMed/NCBI
|
|
65
|
Franciszkiewicz K, Boissonnas A, Boutet M,
Combadière C and Mami-Chouaib F: Role of chemokines and chemokine
receptors in shaping the effector phase of the antitumor immunonse.
Cancer Res. 72:6325–6332. 2012. View Article : Google Scholar : PubMed/NCBI
|
|
66
|
Hsiao CJ, Hsiao G, Chen WL, Wang SW,
Chiang CP, Liu LY, Guh JH, Lee TH and Chung CL: Cephalochromin
induces G0/G1 cell cycle arrest and apoptosis in A549 human
non-small-cell lung cancer cells by inflicting mitochondrial
disruption. J Nat Prod. 77:758–765. 2014. View Article : Google Scholar : PubMed/NCBI
|
|
67
|
Shcherba M, Liang Y, Fernandes D,
Perez-Soler R and Cheng H: Cell cycle inhibitors for the treatment
of NSCLC. Expert Opin Pharmacother. 15:991–1004. 2014. View Article : Google Scholar : PubMed/NCBI
|