Introduction
Breast reconstruction and augmentation are
frequently performed surgical procedures worldwide due to the high
prevalence of breast cancer (1)
and cosmetic demand. Autologous fat transfer to the subcutaneous
tissue is the most commonly used technique in these plastic and
reconstructive surgical procedures as it appears to be relatively
inexpensive, readily obtainable, safe and complication-free
compared with artificial implants (2). However, the long-term replacement
outcomes may not be satisfactory, which may be, in part, attributed
to low graft survival and poor vascularization (3). Therefore, it is necessary to further
improve the autologous fat grafting technique to overcome the above
limitations.
Human adipose-derived stem cells (HASCs) are a
population of pluripotent cells, which have a high proliferation
capacity, possess preferential potential to differentiate into
adipocytes and can secrete angiogenic growth factors. Therefore,
the addition of HASCs to lipoaspirate may prevent graft volume loss
and enhance blood vessel generation in the grafts. This hypothesis
has been confirmed in previous clinical trials (4–6).
However, the use of autologous HASCs has not been Food and Drug
Administration-approved; this may be due to the fact that the
reconstructive mechanism of HASCs remains to be fully elucidated.
Therefore, it is essential to investigate the molecular mechanisms
that induce the transition of HASCs towards adipocytes and attempt
to develop a more effective combination to improve the efficacy of
HASC therapy for breast reconstruction and augmentation (7).
Currently, several genes have been identified to be
associated with adipogenesis for HASCs. Cytokine interleukin-1α
(IL-1α) is demonstrated to evidently inhibit the proliferation and
adipogenic differentiation of HASCs through the activation of
nuclear factor (NF)-κB and extracellular signal-regulated kinase
1/2 pathways; and subsequent upregulation of pro-inflammatory
cytokines, including interleukin (IL)-8, IL-6, C-C motif chemokine
ligand 2 and IL-1β, in adipose-derived stem cells (8). A study by Strong et al
(9) analyzed the overall cytokine
profile of HASCs undergoing adipogenic differentiation and also
found a decrease in the expression of IL-1, but reported increases
in IL-12, IL-17 and intercellular adhesion molecule-1. By
transcriptome profile analysis, Satish et al (10) identified several novel genes and
signaling pathways involved in regulating adipogenesis, including
periostin, protein phosphatase 1 regulatory inhibitor subunit 1A
and fibroblast growth factor 11. MicroRNAs (miRNAs) are a class of
small RNAs that are important for the regulation of cellular
processes by downregulating gene expression via binding to the
3′-untranslated region. There is also evidence to indicate the
roles of miRNAs in adipogenic differentiation. The levels of miRNA
(miR)-27a and miR-27b have been found to be downregulated following
the adipogenic induction of HASCs. The overexpression of miR-27a or
miR-27b inhibits adipocyte differentiation by downregulating the
expression of prohibitin; and the target association between
miR-27a/b and prohibitin was confirmed using a luciferase reporter
assay (11). miR-17-5p and
miR-106a were shown to promote the adipogenic lineage commitment of
HASCs by directly targeting bone morphogenetic protein 2 and
subsequently increasing adipogenic CCAAT enhancer binding protein α
(C/EBPα) and peroxisome proliferator activated receptor (PPAR)γ
(12). In addition to miRNAs, long
non-coding RNAs (lncRNAs) have emerged as important factors
contributing to adipocyte differentiation in HASCs. Nuermaimaiti
et al (13) demonstrated
that the knockdown of HOXA11-AS1 inhibited adipocyte
differentiation, leading to the suppression of adipogenic-related
gene transcription in addition to decreased lipid accumulation in
HASCs. The knockdown of MIR31HG also inhibited adipocyte
differentiation, whereas the overexpression of MIR31HG promoted
adipogenesis in vitro and in vivo (14). However, the adipogenic
differentiation-related genes, miRNAs and lncRNAs of HASCs have
received limited investigation.
Several scholars have put forward the competing
endogenous RNAs (ceRNAs) hypothesis as an lncRNA-miRNA-mRNA link:
LncRNAs may serve as molecular sponges for miRNAs and functionally
liberate mRNA-targeted regulated by the aforementioned active
miRNAs. Certain adipocyte differentiation-related lncRNA-miRNA-mRNA
interaction axes have previously been obtained in bone marrow
mesenchymal stem cells (BMSCs) (15,16),
but not in HASCs.
The aim of the present study was to screen crucial
miRNAs, lncRNAs and mRNAs associated with the adipocyte
differentiation of HASCs by constructing the miRNA-lncRNA-mRNA
ceRNA regulatory network using microarray data collected from a
public database. The results of the present study may improve
current understanding of the molecular mechanisms that induce the
transition of HASCs towards adipocytes and provide targets for
inducing adipogenic differentiation.
Materials and methods
Gene Expression Omnibus (GEO)
dataset
The lncRNA, miRNA and mRNA expression profiles of
HASCs prior to and following adipocyte differentiation were
retrieved from the public GEO database (http://www.ncbi.nlm.nih.gov/geo/) under accession nos.
GSE57593, GSE25715 and GSE61302 (10), respectively. The GSE57593
microarray dataset (platform: GPL18109, Agilent-038314 CBC Homo
sapiens lncRNA + mRNA microarray V2.0) included samples from four
undifferentiated HASCs and six differentiated adipocyte cells,
which were induced following adipogenic medium culture for 3 and 6
days, with three replicates of each. The GSE25715 non-coding RNA
sequencing dataset (platform: GPL9442, AB SOLiD System 3.0, Homo
sapiens), included samples from four undifferentiated HASCs [two
with adapter set A (from the 5′ to the 3′ end) and two with adapter
set B (from the 3′ to the 5′ end)] and eight adipocyte
differentiated cells that were induced using adipogenic medium for
3 and 8 days, with two replicates of each and using adapter sets A
and B. The GSE61302 microarray dataset (platform: GPL570,
Affymetrix Human Genome U133 Plus 2.0 Array) included samples from
five undifferentiated HASCs and 10 differentiated adipocyte cells
which were induced with adipogenic medium for 7 days (four
replicates) and 21 days (six replicates).
Data preprocessing and differential
expression analysis
For the microarray data, the raw data were
preprocessed using the Robust Multichip Average algorithm (17) as implemented in the Bioconductor R
package (version 3.4.1; http://www.bioconductor.org/packages/release/bioc/html/affy.html),
including background correction, quantile normalization and median
summarization. For the sequencing data, low expression value data
(=0, 70%) were filtered.
In consideration of the different differentiated
time, the present study only focused on the differentially
expressed genes (DEGs), lncRNAs (DELs) and miRNAs (DEMs) between
the undifferentiated and differentiated cells. The DEGs, DELs and
DEMs were identified using the Linear Models for Microarray data
method (18) in the Bioconductor R
package (version 3.4.1; http://www.bioconductor.org/packages/release/bioc/html/limma.html).
The empirical Bayes t-test was used to calculate the p-value, which
was subsequently adjusted by the Benjamini-Hochberg (BH) procedure
(19). Genes were considered
differentially expressed if they met the following conditions:
P-value (adjusted) P<0.05 and |logFC(fold change)| >1 (that
is, FC>2). A hierarchical cluster heatmap was created using the
R package pheatmap (version: 1.0.8; http://cran.r-project.org/web/packages/pheatmap)
based on the Euclidean distance to observe the ability of the DEGs,
DELs and DEMs to distinguish the differentiated from the
undifferentiated samples.
Protein-protein interaction (PPI)
network
To screen crucial genes, the DEGs were imported into
PPI data that were collected from the Search Tool for the Retrieval
of Interacting Genes (version 10.0; http://string
db.org/) database (20). The
PPIs with combined scores ≥0.4 (medium confidence) were selected to
construct the PPI network, which was visualized using Cytoscape
software (version 3.4; www.cytoscape.org/) (21). The network topological features,
including the degree (number of interactions per node or protein),
betweenness (number of shortest paths that pass through each node),
and closeness centrality (average length of the shortest paths to
access all other proteins in the network) were determined using the
CytoNCA plugin in Cytoscape software (http://apps.cytoscape.org/apps/cytonca) (22) to rank the nodes in the PPI network
and screen hub genes. Modules were identified to be significant
with an Molecular Complex Detection (MCODE) score ≥4 and ≥6
nodes.
Furthermore, the MCODE (version:1.4.2, http://apps.cytoscape.org/apps/mcode)
plugin of Cytoscape software was also used to identify functionally
related and highly interconnected modules from the PPI network with
a degree cut-off of 2, node score cut-off of 0.2, k-core of 2 and
maximum depth of 100 (23).
ceRNA regulatory network
construction
The DEM-related target genes were predicted using
the miRWalk database (version 2.0; http://www.zmf.umm.uni-heidelberg.de/apps/zmf/mirwalk2)
(24), which provides the largest
collection of predicted and experimentally verified miR-target
interactions with various miRNA databases, including miRWalk,
miRanda, miRDB, miRMap, RNA22 and TargetScan. The miRNA-target gene
interaction pairs were selected if they were predicted in at least
five databases. The target genes were then overlapped with the DEGs
to screen the DEM (upregulated)-DEG (downregulated) or DEM
(downregulated)-DEG (upregulated) interaction pairs.
The miRWalk (version 2.0; http://www.zmf.umm.uni-heidelberg.de/apps/zmf/mirwalk2)
(24) and lnCeDB (http://gyanxet-beta.com/lncedb/) (25) databases were used to screen the
interactions between DELs and DEMs. The DEL (upregulated)-DEM
(downregulated) and DEL (downregulated)-DEM (upregulated)
interaction pairs were collected.
The DEL-DEM and DEM-DEG interactions were integrated
to construct the lncRNA-miRNA-mRNA ceRNA network, which was
visualized using Cytoscape software (version 3.4; www.cytoscape.org/) (21).
Function enrichment analysis
Gene Ontology (GO) and Kyoto Encyclopedia of Genes
and Genomes (KEGG) pathway enrichment analyses were performed using
the clusterProfiler tool (version 3.2.11; http://www.bioconductor.org/packages/release/bioc/html/clusterProfiler.html)
to reveal the function of the DEGs in the PPI and the target genes
of miRNAs. Adjusted P<0.05 using the BH method was set as the
cut-off value (19).
Results
Differential expression analysis
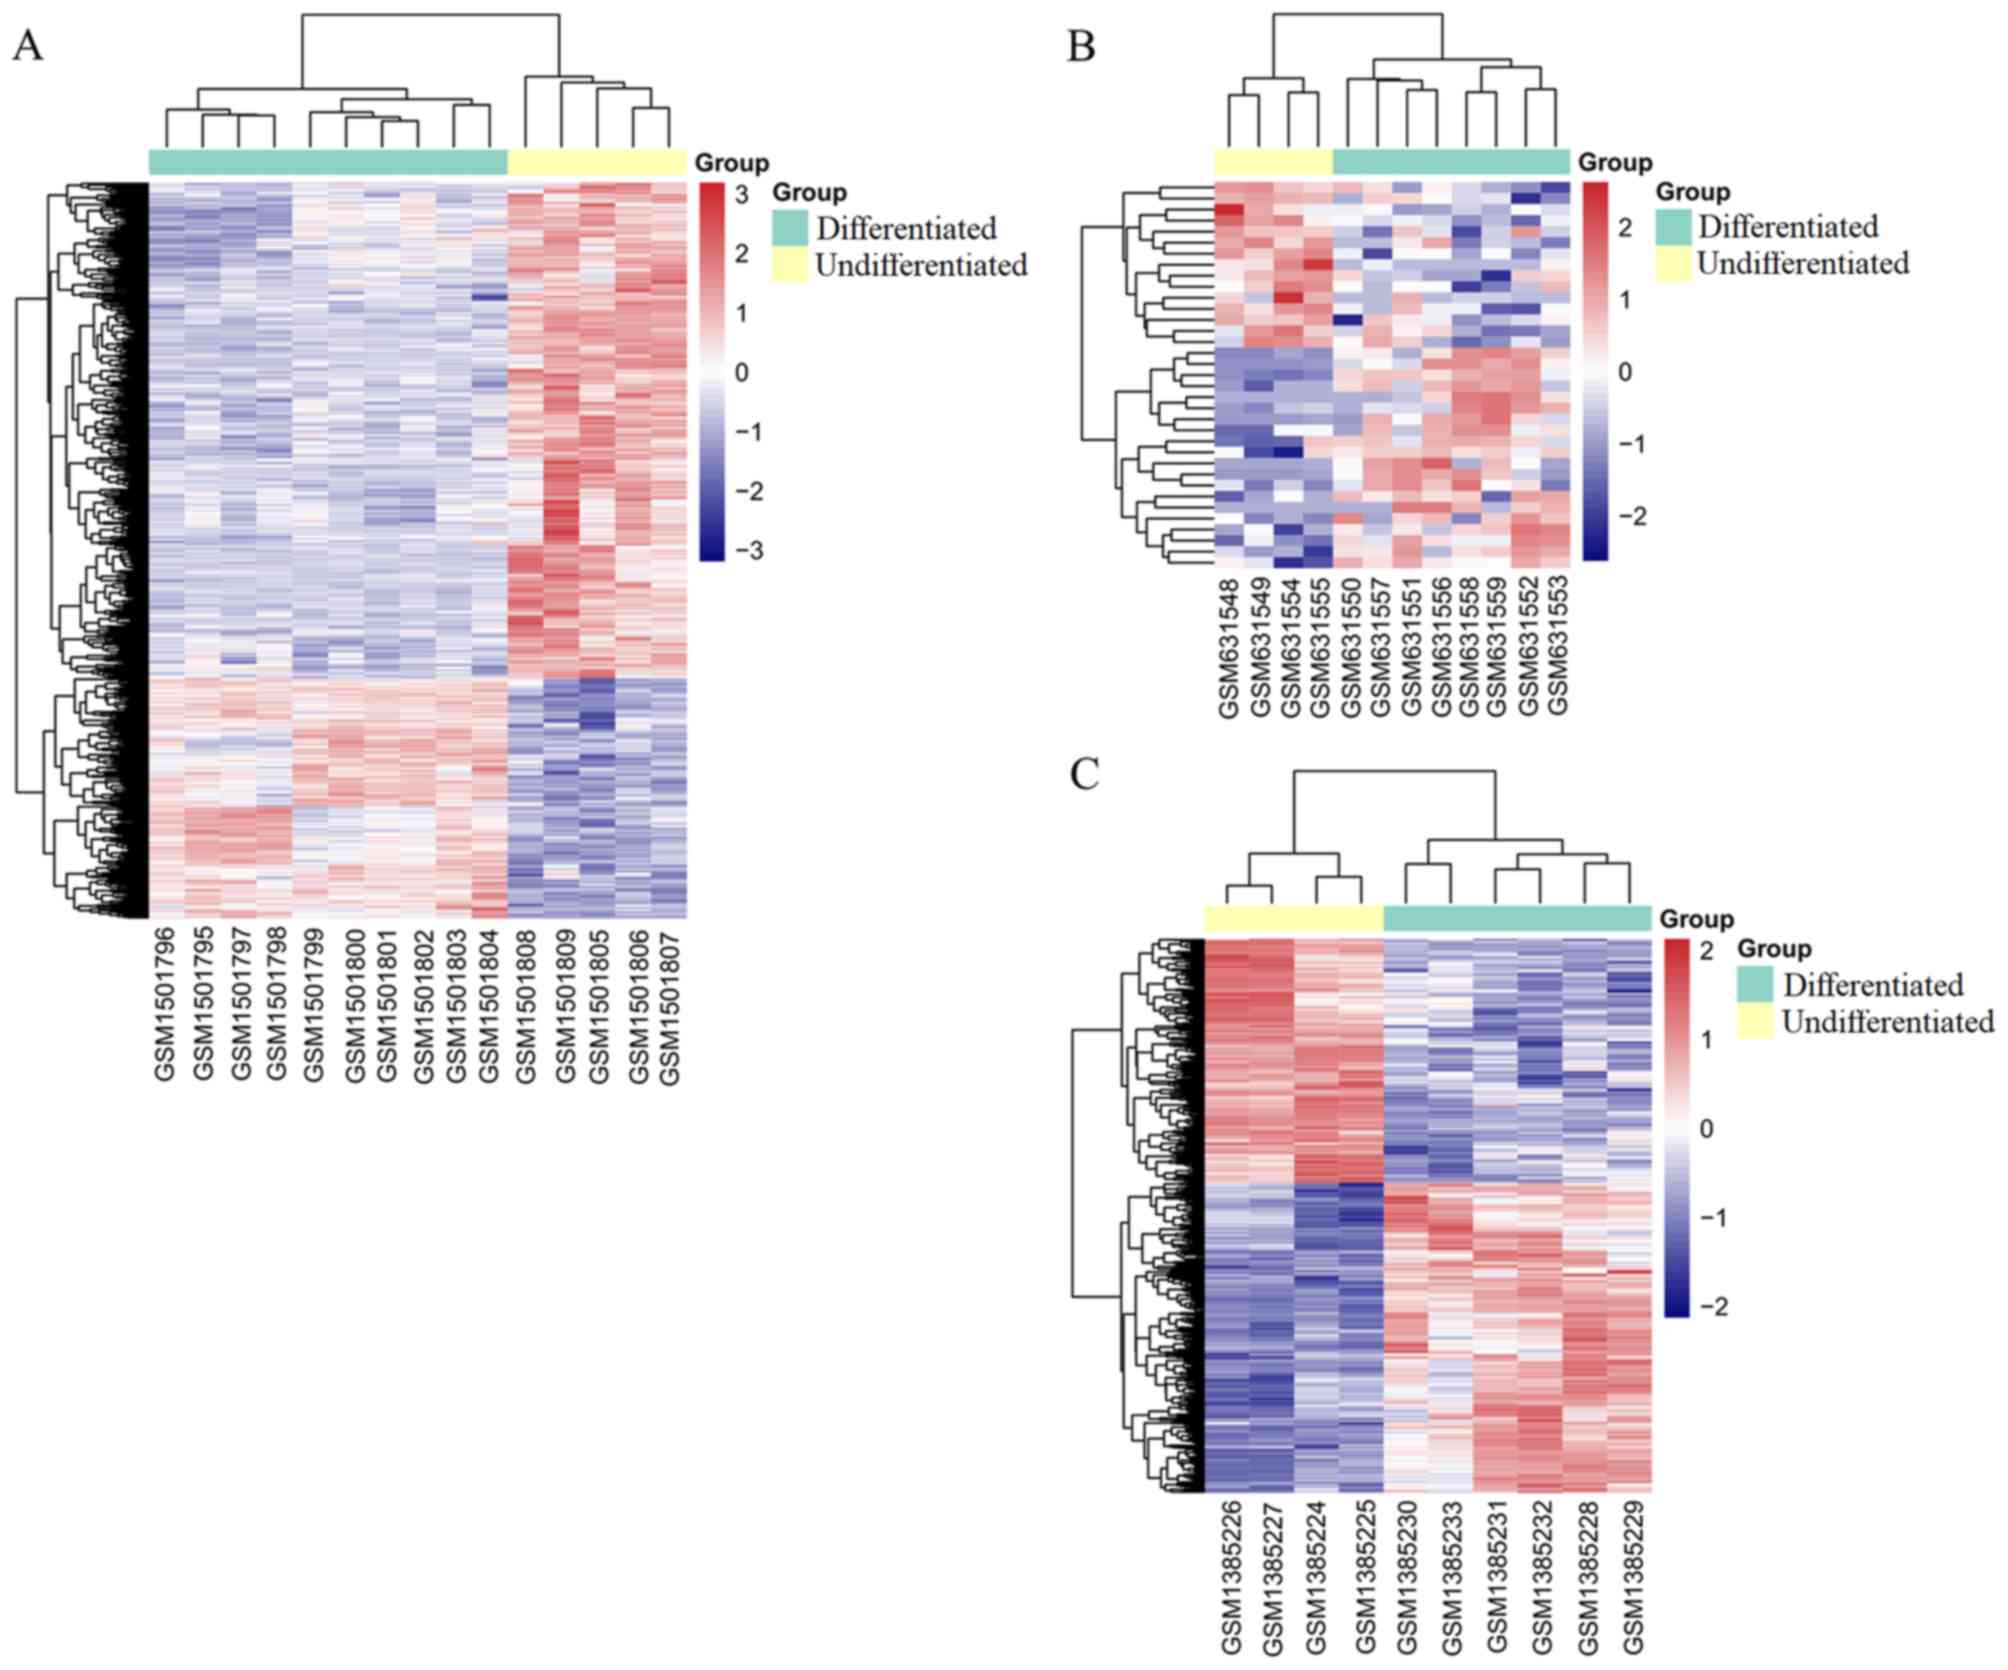
Based on the given threshold (adjusted P<0.05 and
|logFC| >1), a total of 925 DEGs were identified from 20,514
mRNAs between the undifferentiated HASCs and differentiated
adipocyte cells, including 302 upregulated and 623 downregulated
DEGs; 577 DELs were screened from 7,882 lncRNAs between the
undifferentiated HASCs and differentiated adipocyte cells,
including 323 upregulated and 254 downregulated DELs. A total of 35
DEMs were screened from 499 miRNAs between the undifferentiated
HASCs and differentiated adipocyte cells (including 20 upregulated
and 15 downregulated), based on the threshold of P<0.05 and
|logFC| >1. The top 20 DEGs, DEMs and DELs are shown in Table I. The heatmap indicated that these
DEGs (Fig. 1A), DEMs (Fig. 1B) and DELs (Fig. 1C) distinguished the differentiated
from the undifferentiated samples.
 | Table I.Top 10 upregulated and downregulated
differentially expressed lncRNAs, miRNAs and mRNAs. |
Table I.
Top 10 upregulated and downregulated
differentially expressed lncRNAs, miRNAs and mRNAs.
| lncRNAs | mRNAs | miRNAs |
|---|
|
|
|
|---|
| lncRNA | logFC | Adjusted
P-value | miRNA | logFC | P-value | mRNA | logFC | Adjusted
P-value |
|---|
| ZBED3-AS1 | 4.74 |
2.74×10⁻⁷ | hsa-miR-29b-2* | 2.89 |
3.08×10⁻⁵ | FGF11 | 2.14 |
3.54×10⁻⁷ |
| RP11-95P13.1 | 4.95 |
5.72×10⁻⁷ |
hsa-miR-642a-3p | 5.28 |
4.29×10⁻⁴ | DDIT4L | 3.38 |
4.11×10⁻⁷ |
| AC104654.2 | 4.12 |
1.08×10⁻⁵ | hsa-miR-2114 | 2.80 |
1.31×10⁻³ | PKP2 | 1.74 |
4.11×10⁻⁷ |
| RP11-196G18.3 | 2.19 |
1.41×10⁻⁵ | hsa-miR-30a* | 2.54 |
2.20×10⁻³ | GPR155 | 1.57 |
4.11×10⁻⁷ |
| RP11-439A17.9 | 2.19 |
1.41×10⁻⁵ | hsa-miR-34b* | 4.57 |
3.85×10⁻³ | ZNF582-AS1 | 1.20 |
4.11×10⁻⁷ |
| RP5-998N21.4 | 2.19 |
1.41×10⁻⁵ | hsa-miR-668 | 2.29 |
4.38×10⁻³ | PGRMC1 | 1.10 |
4.11×10⁻⁷ |
| CTC-564N23.2 | 4.65 |
2.62×10⁻⁵ | hsa-miR-345 | 1.81 |
4.20×10⁻³ | ZNF436-AS1 | 2.26 |
5.34×10⁻⁷ |
| CHL1-AS1 | 3.53 |
5.17×10⁻⁵ | hsa-miR-675* | 2.60 |
5.68×10⁻³ | FAM162A | 1.14 |
5.34×10⁻⁷ |
| AC104653.1 | 2.94 |
5.17×10⁻⁵ | hsa-miR-34a | 3.54 |
8.48×10⁻³ | BNIP3 | 1.23 |
1.44×10⁻⁶ |
| RP11-696N14.1 | 2.15 |
5.17×10⁻⁵ | hsa-miR-378c | 3.10 |
9.65×10⁻³ | IGFBP5 | 1.74 |
1.85×10⁻⁶ |
| LINC01085 | −4.82 |
1.20×10⁻⁷ | hsa-miR-485-3p | −3.30 |
9.05×10⁻⁴ | FOSB | −6.71 |
1.28×10⁻¹⁴ |
| APCDD1L-AS1 | −3.14 |
2.45×10⁻⁶ | hsa-miR-3151 | −2.15 |
1.80×10⁻³ | IER2 | −1.72 |
2.51×10⁻⁹ |
| RP11-54A9.1 | −3.45 |
5.73×10⁻⁶ | hsa-miR-130b* | −1.42 |
6.82×10⁻³ | KLF2 | −2.02 |
3.82×10⁻⁹ |
| CTD-2354A18.1 | −3.16 |
7.55×10⁻⁶ | hsa-miR-302d | −1.66 |
8.82×10⁻³ | ID1 | −4.29 |
1.64×10⁻⁸ |
| CTD-2066L21.2 | −5.09 |
1.11×10⁻⁵ | hsa-miR-487a | −2.39 |
7.82×10⁻³ | SKIL | −1.49 |
4.79×10⁻⁸ |
| RP11-114H23.1 | −1.83 |
1.11×10⁻⁵ | hsa-miR-411* | −1.31 |
4.96×10⁻² | PRIMA1 | −2.89 |
9.17×10⁻⁸ |
| RP3-410C9.2 | −5.035 |
1.30×10⁻⁵ | hsa-miR-154* | −2.12 |
1.72×10⁻² | RRM2 | −4.51 |
9.17×10⁻⁸ |
| APOBEC3B-AS1 | −3.97 |
1.30×10⁻⁵ | hsa-let-7e | −1.35 |
2.81×10⁻³ | EGR3 | −5.27 |
9.17×10⁻⁸ |
| RP11-30P6.6 | −3.10 |
1.41×10⁻⁵ |
hsa-miR-125b-1* | −1.54 |
2.84×10⁻² | C16orf89 | −2.88 |
1.73×10⁻⁷ |
| LINC00460 | −3.07 |
2.39×10⁻⁵ | hsa-miR-23b | −1.03 |
4.18×10⁻² | NFKBIZ | −1.84 |
2.89×10⁻⁷ |
PPI network analysis of DEGs to screen
hub genes
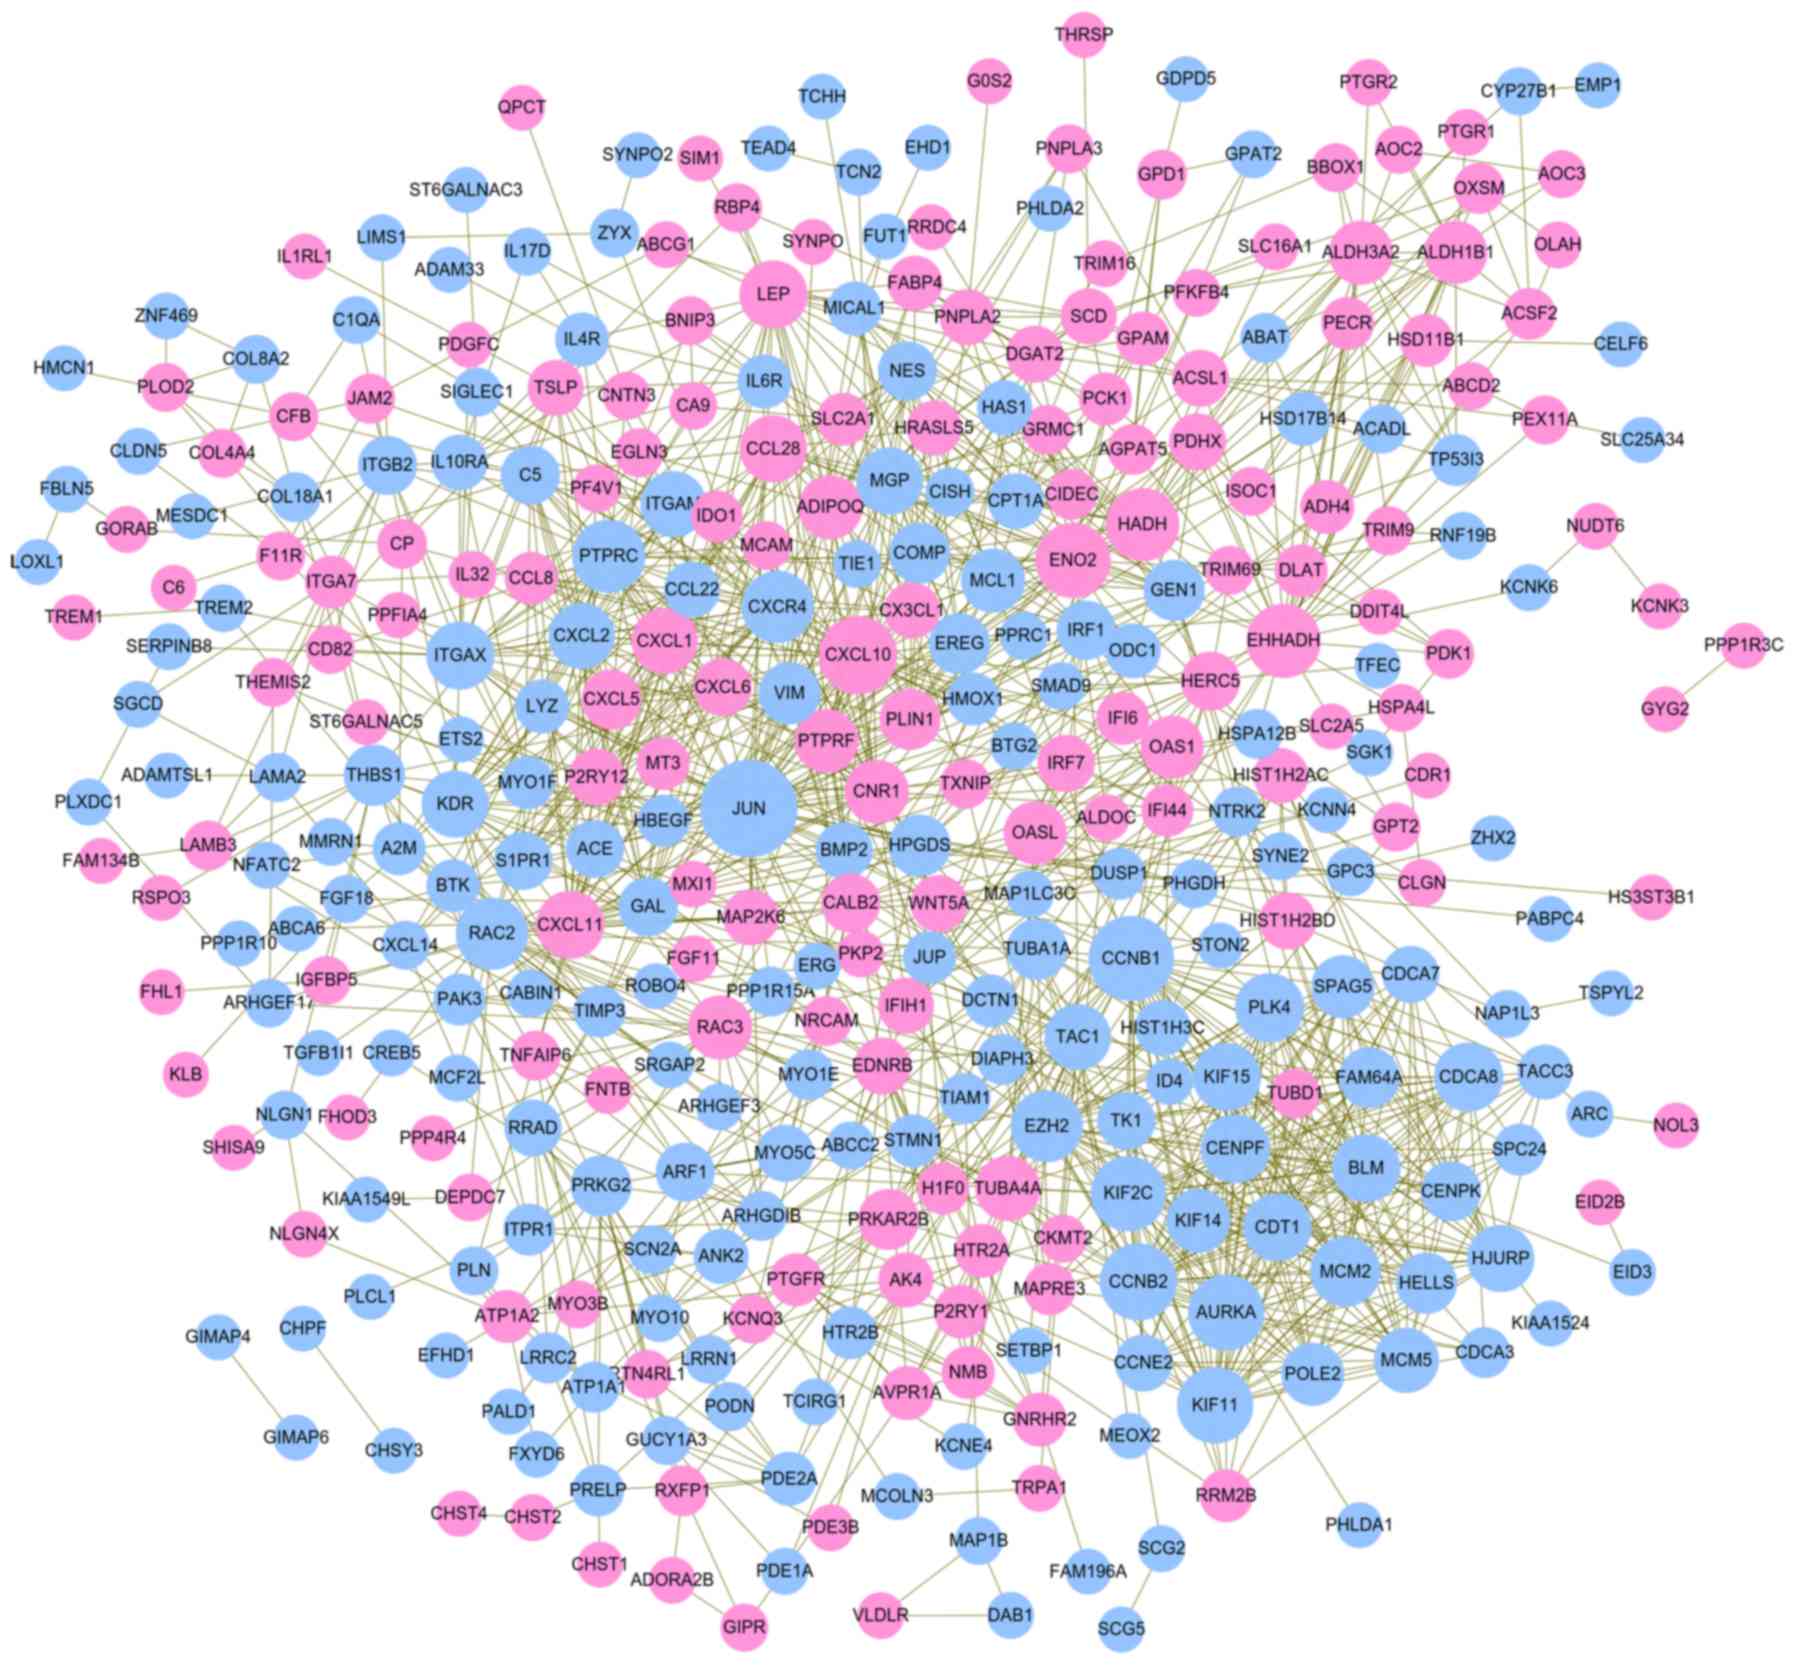
A PPI network was constructed using the screened
DEGs, which included 360 nodes (162 upregulated and 198
downregulated) and 1,381 interaction pairs (Fig. 2). According to the rank of three
topological features, JUN, cyclin B1 (CCNB1), C-X-C motif chemokine
ligand 10 (CXCL10), enolase 2 (ENO2), enoyl-CoA hydratase and
3-hydroxyacyl CoA dehydrogenase (EHHADH), protein tyrosine
phosphatase, receptor type C (PTPRC), Rac family small GTPase 2
(RAC2), leptin (LEP) and kinase insert domain receptor (KDR) were
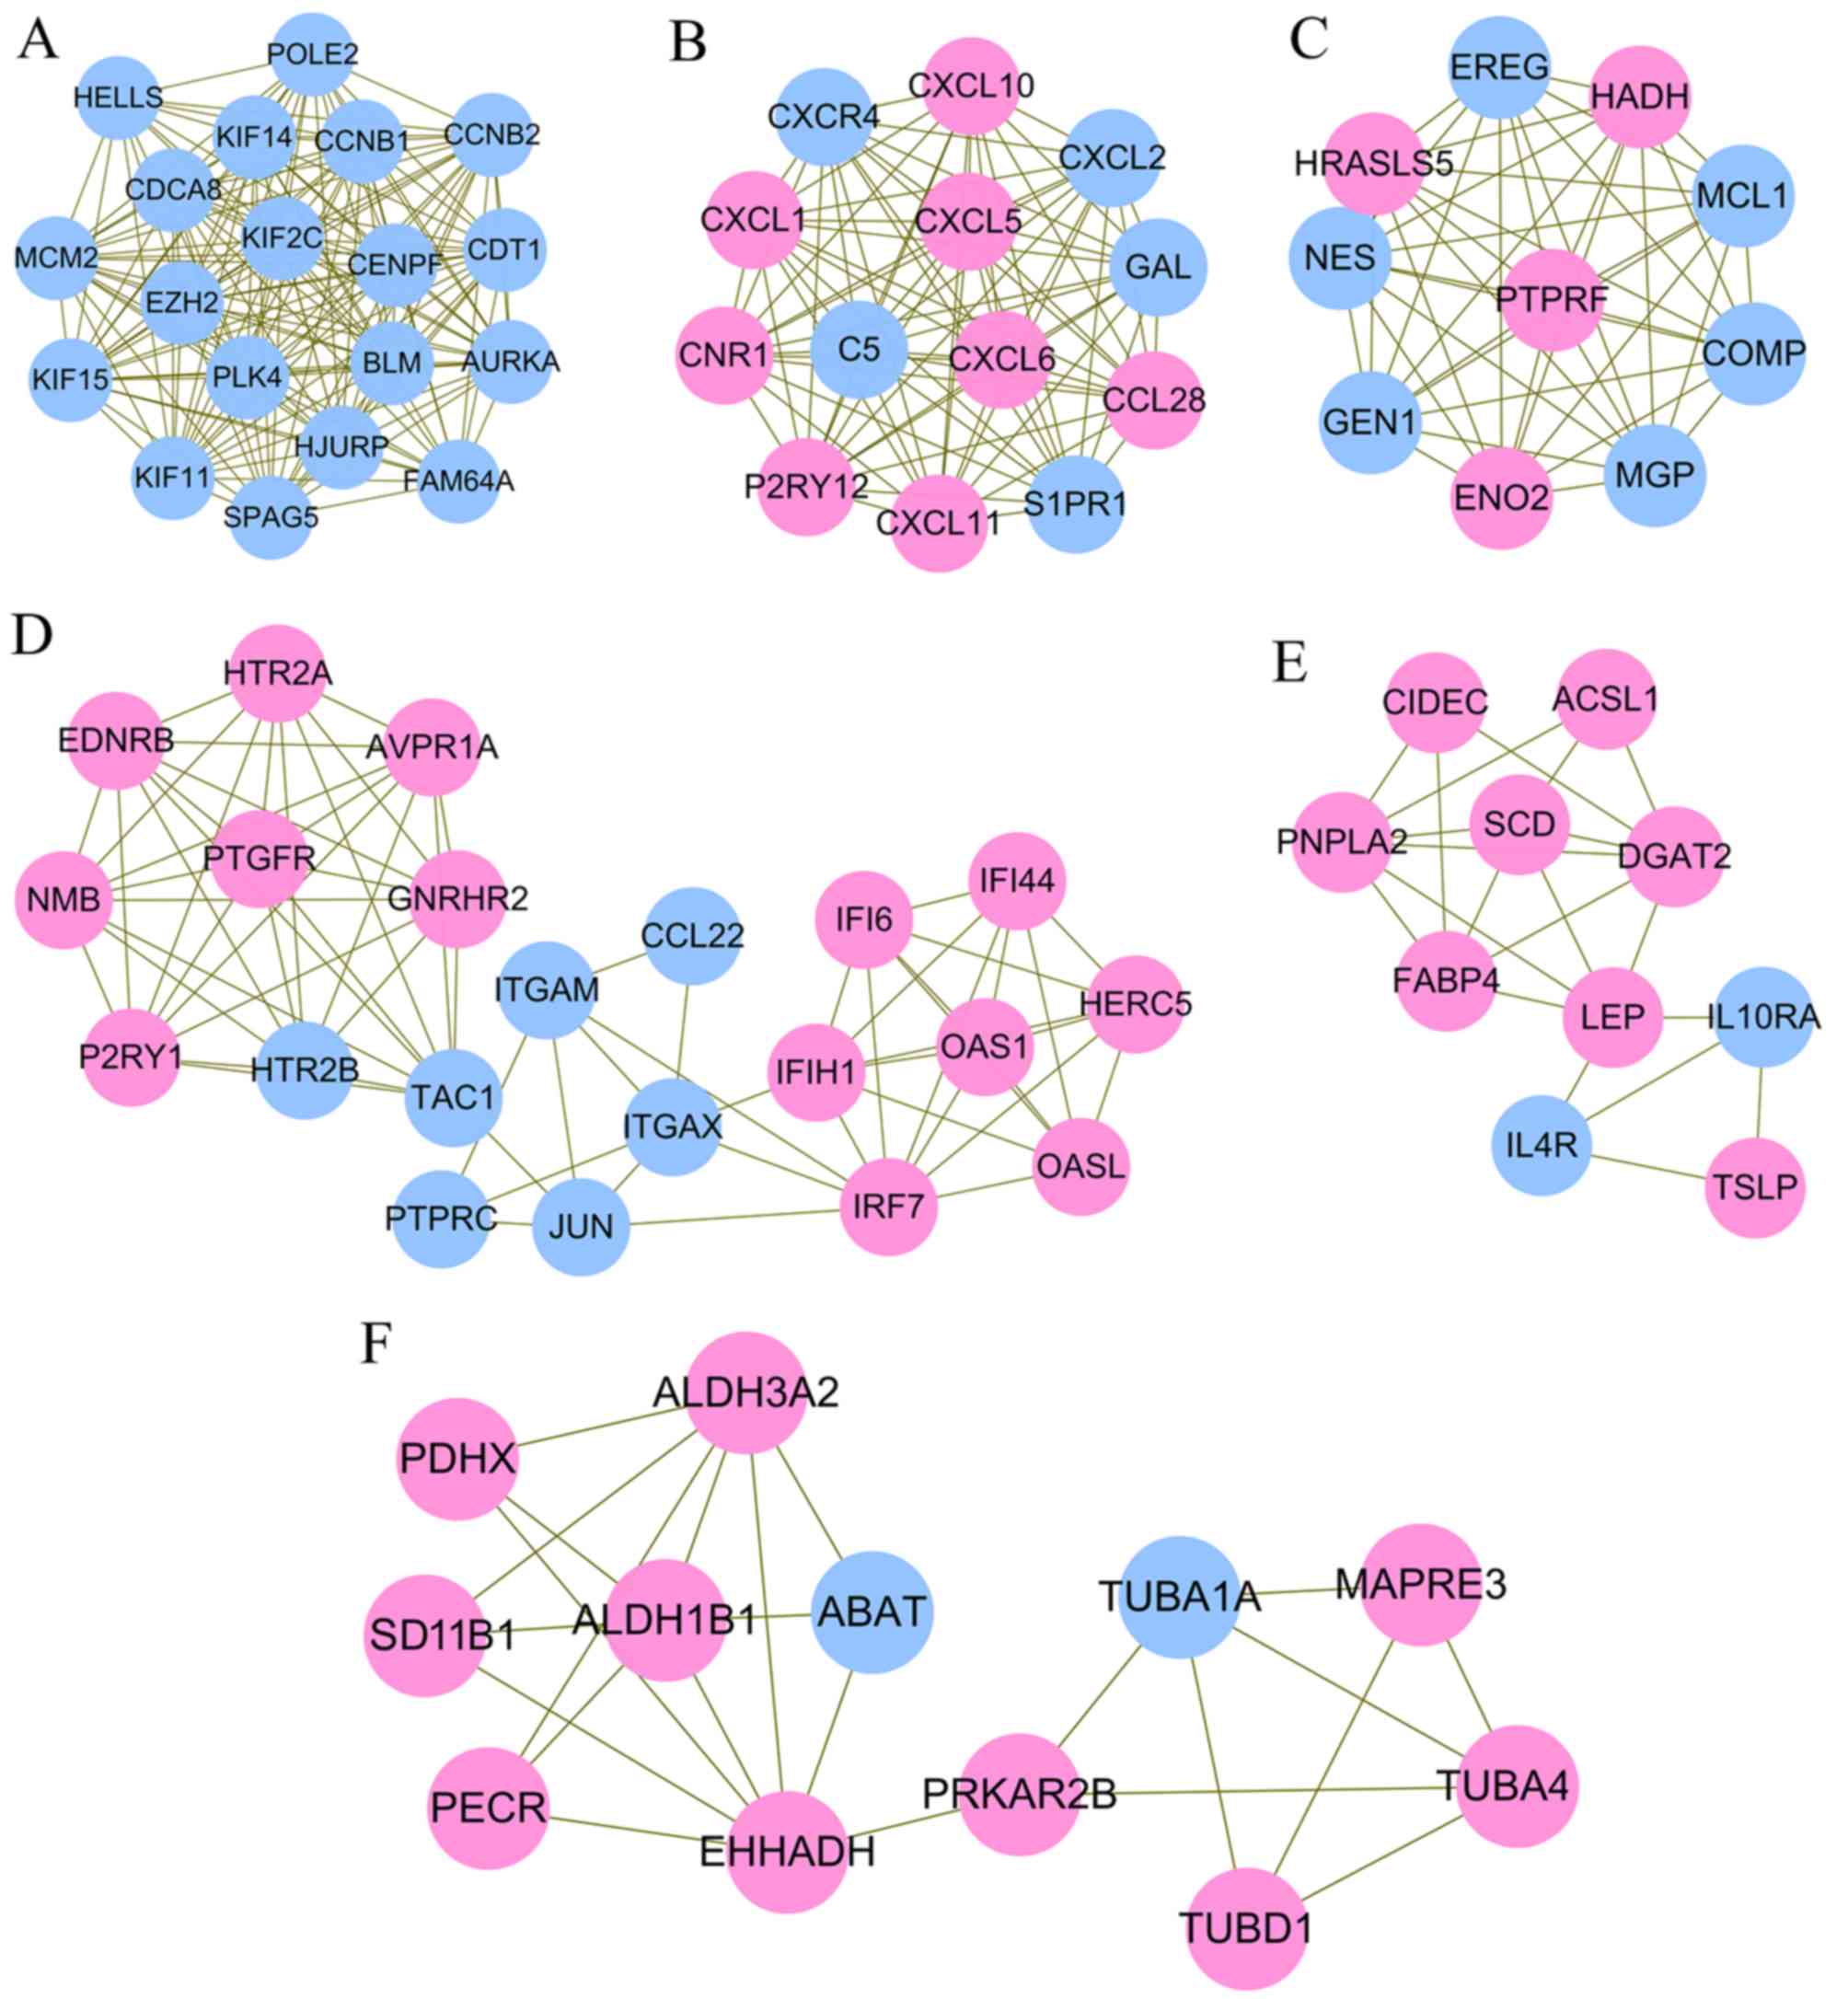
considered as hub genes in the PPI network (Table II). Six significant functionally
related and highly interconnected modules were extracted from the
whole PPI network (Fig. 3;
Table III). Hub gene CCNB1 was
enriched in module 1, which was associated with cell cycle
(Fig. 3A). Hub gene CXCL10 was
enriched in module 2 (Fig. 3B),
which was associated with several inflammation pathways, including
the chemokine signaling pathway, cytokine-cytokine receptor
interaction, IL-17 signaling pathway, and tumor necrosis factor
(TNF) signaling pathway. Hub gene ENO2 and PTPRC were respectively
enriched into module 3 (Fig. 3C)
and 4 (Fig. 3D). Hub gene JUN in
module 4 was enriched in the NOD-like receptor signaling pathway or
infection. Hub gene LEP in module 5 (Fig. 3E) was important in the Janus kinase
(JAK)-signal transducer and activator of transcription (STAT)
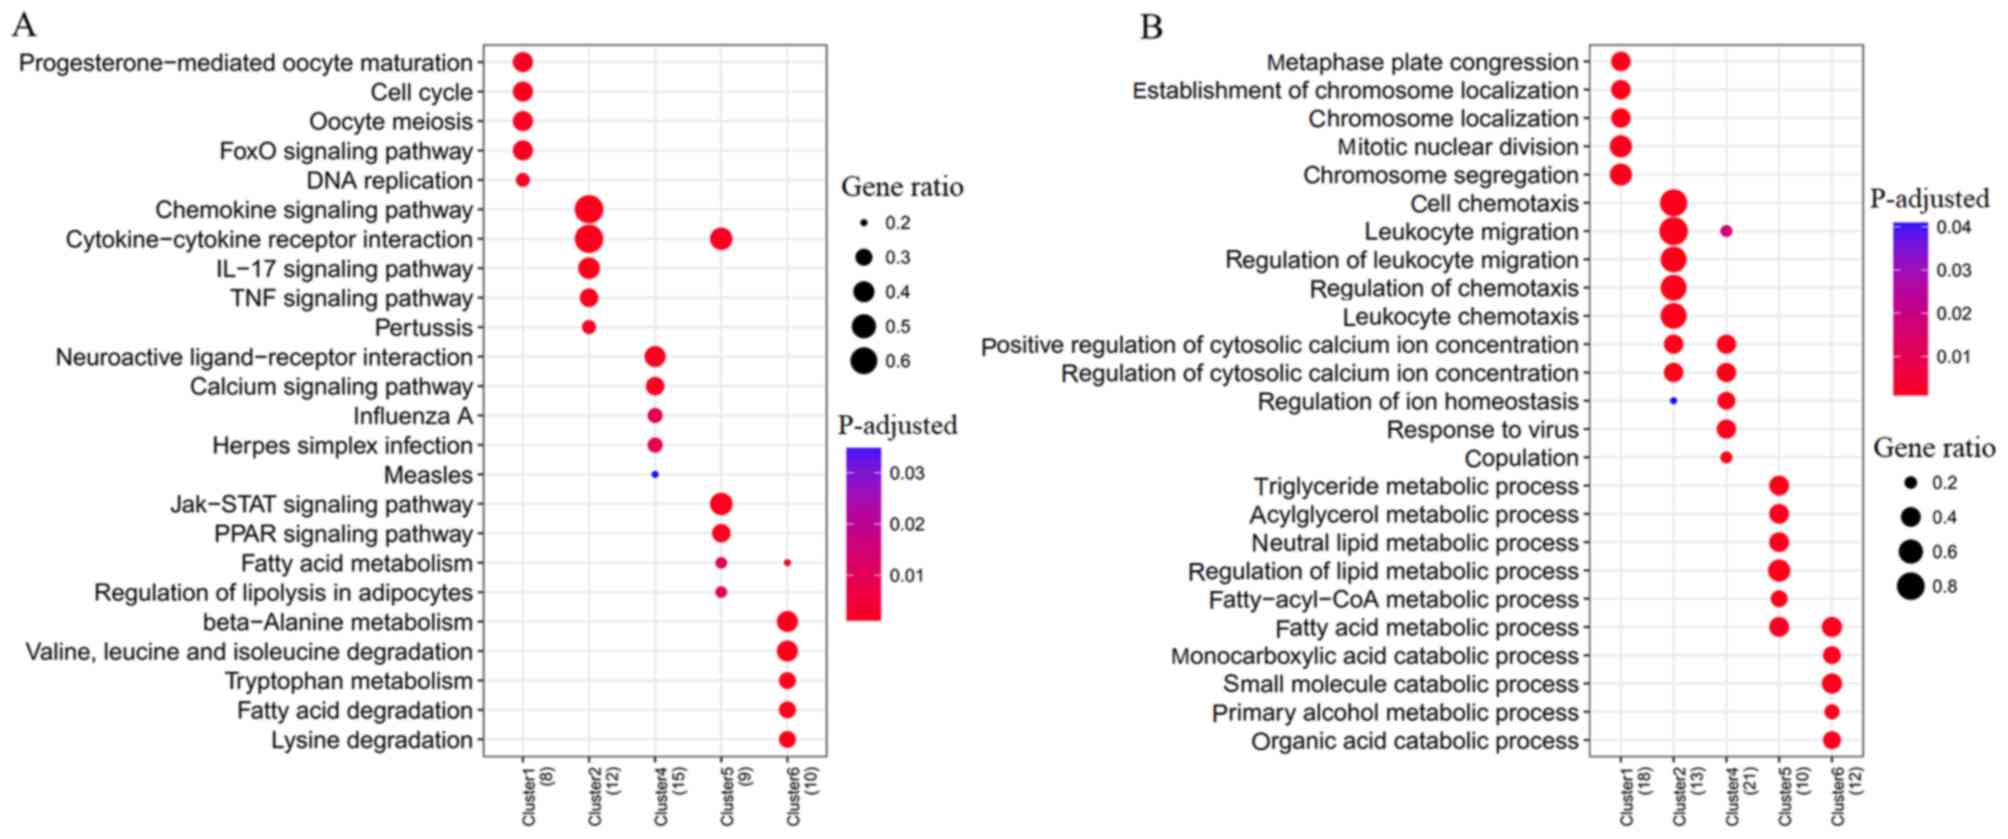
signaling pathway. Hub gene EHHADH in module 6 (Fig. 3F) was amino acid- or glucose
metabolism-related (Table IV;
Fig. 4A). As hub gene PTPRC and
ENO2 were respectively enriched into module 4 and 3, but they were
not included in the pathway-related genes, GO enrichment analysis
was also performed. As a result, PTPRC was predicted to be involved
in positive regulation of cytosolic calcium ion concentration
(Table V; Fig. 4B). The function of ENO2 was not
predicted.
| Table II.Topological features of DEGs in the
protein-protein interaction network. |
Table II.
Topological features of DEGs in the
protein-protein interaction network.
| DEG | Degree | DEG | Betweenness | DEG | Closeness | Overlapped | Expression |
|---|
| JUN | 52 | JUN | 31682.11 | JUN | 0.12 | JUN | Down |
| CCNB1 | 40 | EHHADH | 14484.48 | PTPRC | 0.12 | CCNB1 | Down |
| CXCL10 | 33 | RAC2 | 9452.98 | ENO2 | 0.12 | CXCL10 | Up |
| CCNB2 | 32 | CCNB1 | 9055.00 | CCNB1 | 0.12 | ENO2 | Up |
| AURKA | 31 | TAC1 | 8899.64 | RAC2 | 0.12 | EHHADH | Up |
| KIF11 | 31 | ENO2 | 8383.99 | KDR | 0.12 | PTPRC | Down |
| ENO2 | 30 | KDR | 7498.68 | VIM | 0.12 | RAC2 | Down |
| KIF2C | 30 | PTPRC | 6640.64 | EHHADH | 0.12 | LEP | UP |
| EHHADH | 29 | PRKAR2B | 6288.09 | HPGDS | 0.12 | KDR | Down |
| PTPRC | 28 | THBS1 | 5735.04 | MCL1 | 0.12 | ITGAM | Down |
| HADH | 28 | VIM | 4843.88 | TAC1 | 0.12 | ITGAX | Down |
| RAC2 | 27 | LEP | 4442.09 | CXCL10 | 0.11 | CXCR4 | Down |
| CXCR4 | 27 | CXCL10 | 4424.07 | MGP | 0.11 | HADH | Up |
| EZH2 | 27 | HADH | 4155.38 | CXCR4 | 0.11 | MGP | Down |
| MCM2 | 25 | MGP | 3982.14 | LEP | 0.11 | TAC1 | Down |
| PLK4 | 24 | HPGDS | 3752.53 | BMP2 | 0.11 |
|
|
| CENPF | 24 | CNR1 | 3700.56 | PTPRF | 0.11 |
|
|
| CDCA8 | 24 | PRKG2 | 3608.14 | ADIPOQ | 0.11 |
|
|
| LEP | 23 | CALB2 | 3569.40 | WNT5A | 0.11 |
|
|
| ITGAX | 23 | WNT5A | 3556.75 | ACE | 0.11 |
|
|
| CXCL11 | 23 | ITGAX | 3251.43 | ITGAM | 0.11 |
|
|
| BLM | 23 | AK4 | 3154.06 | THBS1 | 0.11 |
|
|
| KIF15 | 23 | TUBA4A | 2982.07 | NES | 0.11 |
|
|
| CDT1 | 23 | HMOX1 | 2856.41 | CPT1A | 0.11 |
|
|
| KDR | 22 | PTPRF | 2836.38 | PLIN1 | 0.11 |
|
|
| MGP | 22 | ADIPOQ | 2766.04 | CX3CL1 | 0.11 |
|
|
| CCL28 | 22 | ITGAM | 2744.81 | BTK | 0.11 |
|
|
| HJURP | 22 | CXCR4 | 2674.93 | MAP2K6 | 0.11 |
|
|
| TAC1 | 21 | ITGA7 | 2632.36 | CXCL2 | 0.11 |
|
|
| ITGAM | 21 | BMP2 | 2624.89 | CXCL1 | 0.11 |
|
|
| CXCL2 | 21 | PLIN1 | 2616.07 | CALB2 | 0.11 |
|
|
| CXCL1 | 21 | ACE | 2575.42 | ITGAX | 0.11 |
|
|
| TUBA4A | 20 | ITGB2 | 2559.34 | HADH | 0.11 |
|
|
| MCM5 | 20 | ALDH3A2 | 2510.02 | IRF1 | 0.11 |
|
|
| MCL1 | 19 | RRAD | 2504.60 | CCL28 | 0.11 |
|
|
| Table III.Module analysis results. |
Table III.
Module analysis results.
| Cluster | Scorea | Nodes (n) | Edges (n) | Node IDs |
|---|
| 1 | 17.89 | 19 | 161 | HELLS, EZH2, HJURP,
CDT1, CENPF, MCM2, POLE2, FAM64A, SPAG5, KIF2C, BLM, PLK4, CDCA8,
KIF14, AURKA, KIF11, KIF15, CCNB1, CCNB2 |
| 2 | 13.00 | 13 | 78 | CXCL10, GAL, CXCL5,
CXCL11, C5, P2RY12, CCL28, CNR1, S1PR1, CXCL2, CXCL1, CXCR4,
CXCL6 |
| 3 | 9.78 | 10 | 44 | GEN1, COMP, HADH,
PTPRF, HRASLS5, ENO2, MCL1, MGP, EREG, NES |
| 4 | 7.00 | 21 | 70 | OAS1, JUN, GNRHR2,
AVPR1A, P2RY1, ITGAM, CCL22, HERC5, EDNRB, OASL, PTGFR, IFIH1,
PTPRC, IRF7, IFI44, HTR2A, ITGAX, TAC1, IFI6, NMB, HTR2B |
| 5 | 4.67 | 10 | 21 | ACSL1, SCD, DGAT2,
PNPLA2, LEP, CIDEC, IL4R, IL10RA, TSLP, FABP4 |
| 6 | 4.36 | 12 | 24 | TUBA1A, PRKAR2B,
ABAT, EHHADH, ALDH3A2, TUBD1, ALDH1B1, MAPRE3, PECR, PDHX, TUBA4A,
HSD11B1 |
| 7 | 3.33 | 4 | 5 | PDE2A, PRELP, RRAD,
LRRC2 |
| 8 | 3.13 | 17 | 25 | MMRN1, ANK2,
ATP1A2, NRCAM, VIM, KDR, ATP1A1, PLOD2, TIMP3, COL8A2, COL4A4,
CALB2, PLN, KCNQ3, A2M, COL18A1, SCN2A |
| 9 | 3.00 | 3 | 3 | HIST1H3C,
HIST1H2AC, HIST1H2BD |
| 10 | 3.00 | 3 | 3 | HSD17B14, ADH4,
TP53I3 |
| 11 | 3.00 | 3 | 3 | TRIM69, RNF19B,
TRIM9 |
| 12 | 3.00 | 3 | 3 | GPAT2, AGPAT5,
GPD1 |
| 13 | 3.00 | 3 | 3 | VLDLR, DAB1,
MAP1B |
| 14 | 3.00 | 3 | 3 | LAMB3, ITGA7,
LAMA2 |
| Table IV.Kyoto Encyclopedia of Genes and
Genomes pathway enrichment for genes in modules. |
Table IV.
Kyoto Encyclopedia of Genes and
Genomes pathway enrichment for genes in modules.
| Cluster | ID | Description | Adjusted
P-value | Genes |
|---|
| 1 | hsa04914 |
Progesterone-mediated oocyte
maturation |
1.16×10⁻³ |
AURKA/CCNB1/CCNB2 |
| 1 | hsa04110 | Cell cycle |
1.16×10⁻³ |
MCM2/CCNB1/CCNB2 |
| 1 | hsa04114 | Oocyte meiosis |
1.16×10⁻³ |
AURKA/CCNB1/CCNB2 |
| 1 | hsa04068 | FoxO signaling
pathway |
1.16×10⁻³ |
PLK4/CCNB1/CCNB2 |
| 1 | hsa03030 | DNA
replication |
2.02×10⁻³ | MCM2/POLE2 |
| 1 | hsa04115 | p53 signaling
pathway |
5.99×10⁻³ | CCNB1/CCNB2 |
| 1 | hsa04218 | Cellular
senescence |
2.73×10⁻² | CCNB1/CCNB2 |
| 2 | hsa04062 | Chemokine signaling
pathway |
1.96×10⁻⁹ |
CXCL10/CXCL5/CXCL11/CCL28/CXCL2/CXCL1/CXCR4/CXCL6 |
| 2 | hsa04060 | Cytokine-cytokine
receptor interaction |
2.03×10⁻⁸ |
CXCL10/CXCL5/CXCL11/CCL28/CXCL2/CXCL1/CXCR4/CXCL6 |
| 2 | hsa04657 | IL-17 signaling
pathway |
2.28×10⁻⁶ |
CXCL10/CXCL5/CXCL2/CXCL1/CXCL6 |
| 2 | hsa04668 | TNF signaling
pathway |
1.60×10⁻⁴ |
CXCL10/CXCL5/CXCL2/CXCL1 |
| 2 | hsa05133 | Pertussis |
1.41×10⁻³ | CXCL5/C5/CXCL6 |
| 2 | hsa05323 | Rheumatoid
arthritis |
1.94×10⁻³ |
CXCL5/CXCL1/CXCL6 |
| 2 | hsa04672 | Intestinal immune
network for IgA production |
1.28×10⁻² | CCL28/CXCR4 |
| 2 | hsa05134 | Legionellosis |
1.41×10⁻² | CXCL2/CXCL1 |
| 2 | hsa05132 | Salmonella
infection |
0.02.99×10−2 | CXCL2/CXCL1 |
| 2 | hsa04620 | Toll-like receptor
signaling pathway |
3.88×10⁻² | CXCL10/CXCL11 |
| 4 | hsa04080 | Neuroactive
ligand-receptor interaction |
7.99×10⁻⁴ |
AVPR1A/P2RY1/EDNRB/PTGFR/HTR2A/HTR2B |
| 4 | hsa04020 | Calcium signaling
pathway |
8.35×10⁻⁴ |
AVPR1A/EDNRB/PTGFR/HTR2A/HTR2B |
| 4 | hsa05164 | Influenza A |
8.30×10⁻³ |
OAS1/JUN/IFIH1/IRF7 |
| 4 | hsa05168 | Herpes simplex
infection |
8.30×10⁻³ |
OAS1/JUN/IFIH1/IRF7 |
| 4 | hsa05162 | Measles |
3.60×10⁻² |
OAS1/IFIH1/IRF7 |
| 4 | hsa05161 | Hepatitis B |
3.68×10⁻² | JUN/IFIH1/IRF7 |
| 4 | hsa04621 | NOD-like receptor
signaling pathway |
4.88×10⁻² | OAS1/JUN/IRF7 |
| 5 | hsa04630 | Jak-STAT signaling
pathway |
6.39×10⁻⁴ |
LEP/IL4R/IL10RA/TSLP |
| 5 | hsa03320 | PPAR signaling
pathway |
8.88×10⁻⁴ |
ACSL1/SCD/FABP4 |
| 5 | hsa04060 | Cytokine-cytokine
receptor interaction |
1.57×10⁻³ |
LEP/IL4R/IL10RA/TSLP |
| 5 | hsa01212 | Fatty acid
metabolism |
9.00×10⁻³ | ACSL1/SCD |
| 5 | hsa04923 | Regulation of
lipolysis in adipocytes |
9.10×10⁻³ | PNPLA2/FABP4 |
| 5 | hsa00561 | Glycerolipid
metabolism |
9.65×10⁻³ | DGAT2/PNPLA2 |
| 5 | hsa04920 | Adipocytokine
signaling pathway |
0.01.06×10−2 | ACSL1/LEP |
| 5 | hsa04152 | AMPK signaling
pathway |
2.76×10⁻² | SCD/LEP |
| 5 | hsa00061 | Fatty acid
biosynthesis |
4.36×10⁻² | ACSL1 |
| 6 | hsa00410 | β-alanine
metabolism |
1.50×10⁻⁶ |
ABAT/EHHADH/ALDH3A2/ALDH1B1 |
| 6 | hsa00280 | Valine, leucine and
isoleucine degradation |
4.60×10⁻⁶ |
ABAT/EHHADH/ALDH3A2/ALDH1B1 |
| 6 | hsa00380 | Tryptophan
metabolism |
1.65×10⁻⁴ |
EHHADH/ALDH3A2/ALDH1B1 |
| 6 | hsa00071 | Fatty acid
degradation |
1.66×10⁻⁴ |
EHHADH/ALDH3A2/ALDH1B1 |
| 6 | hsa00310 | Lysine
degradation |
3.22×10⁻⁴ |
EHHADH/ALDH3A2/ALDH1B1 |
| 6 | hsa00340 | Histidine
metabolism |
1.98×10⁻³ |
ALDH3A2/ALDH1B1 |
| 6 | hsa00053 | Ascorbate and
aldarate metabolism |
2.21×10⁻³ |
ALDH3A2/ALDH1B1 |
| 6 | hsa00650 | Butanoate
metabolism |
2.21×10⁻³ | ABAT/EHHADH |
| 6 | hsa00640 | Propanoate
metabolism |
2.57×10⁻³ | ABAT/EHHADH |
| 6 | hsa00620 | Pyruvate
metabolism |
3.44×10⁻³ |
ALDH3A2/ALDH1B1 |
| 6 | hsa01212 | Fatty acid
metabolism |
4.70×10⁻³ | EHHADH/PECR |
| 6 | hsa00330 | Arginine and
proline metabolism |
4.70×10⁻³ |
ALDH3A2/ALDH1B1 |
| 6 | hsa05130 | Pathogenic
Escherichia coli infection |
5.24×10⁻³ | TUBA1A/TUBA4A |
| 6 | hsa00561 | Glycerolipid
metabolism |
6.00×10⁻³ |
ALDH3A2/ALDH1B1 |
| 6 | hsa00010 |
Glycolysis/Gluconeogenesis |
6.90×10⁻³ |
ALDH3A2/ALDH1B1 |
| 6 | hsa04146 | Peroxisome |
9.55×10⁻³ | EHHADH/PECR |
| 6 | hsa04540 | Gap junction |
1.01×10⁻² | TUBA1A/TUBA4A |
| 6 | hsa04210 | Apoptosis |
2.27×10⁻² | TUBA1A/TUBA4A |
| 6 | hsa04145 | Phagosome |
2.58×10⁻² | TUBA1A/TUBA4A |
| 6 | hsa04530 | Tight junction |
3.03×10⁻² | TUBA1A/TUBA4A |
| 6 | hsa01040 | Biosynthesis of
unsaturated fatty acids |
4.23×10⁻² | PECR |
| Table V.GO enrichment for genes in
modules. |
Table V.
GO enrichment for genes in
modules.
| Cluster | ID | Description | Adjusted
P-value | Genes |
|---|
| 1 | GO:0051310 | Metaphase plate
congression |
4.09×10⁻¹¹ |
CDT1/CENPF/SPAG5/KIF2C/CDCA8/KIF14/CCNB1 |
| 1 | GO:0051303 | Establishment of
chromosome localization |
1.45×10⁻¹⁰ |
CDT1/CENPF/SPAG5/KIF2C/CDCA8/KIF14/CCNB1 |
| 1 | GO:0050000 | Chromosome
localization |
1.45×10⁻¹⁰ |
CDT1/CENPF/SPAG5/KIF2C/CDCA8/KIF14/CCNB1 |
| 1 | GO:0140014 | Mitotic nuclear
division |
1.71×10⁻¹⁰ |
CDT1/CENPF/SPAG5/KIF2C/CDCA8/KIF14/AURKA/KIF11/CCNB1 |
| 1 | GO:0000280 | Nuclear
division |
5.46×10⁻⁹ |
CDT1/CENPF/SPAG5/KIF2C/CDCA8/KIF14/AURKA/KIF11/CCNB1 |
| 2 | GO:0060326 | Cell
chemotaxis |
9.21×10⁻¹⁴ |
CXCL10/CXCL5/CXCL11/C5/CCL28/S1PR1/CXCL2/CXCL1/CXCR4/CXCL6 |
| 2 | GO:0050900 | Leukocyte
migration |
9.21×10⁻¹⁴ |
CXCL10/CXCL5/CXCL11/C5/P2RY12/CCL28/S1PR1/CXCL2/CXCL1/CXCR4/CXCL6 |
| 2 | GO:0002685 | Regulation of
leukocyte migration |
9.21×10⁻¹⁴ |
CXCL10/CXCL5/CXCL11/C5/P2RY12/CCL28/CXCL2/CXCL1/CXCL6 |
| 2 | GO:0050920 | Regulation of
chemotaxis |
1.35×10⁻¹³ |
CXCL10/CXCL5/CXCL11/C5/S1PR1/CXCL2/CXCL1/CXCR4/CXCL6 |
| 2 | GO:0030595 | Leukocyte
chemotaxis |
2.66×10⁻¹³ |
CXCL10/CXCL5/CXCL11/C5/S1PR1/CXCL2/CXCL1/CXCR4/CXCL6 |
| 4 | GO:0007204 | Positive regulation
of cytosolic calcium ion concentration |
6.33×10⁻⁷ |
AVPR1A/P2RY1/EDNRB/PTPRC/HTR2A/TAC1/NMB/HTR2B |
| 4 | GO:0009615 | Response to
virus |
6.33×10⁻⁷ |
OAS1/CCL22/HERC5/OASL/IFIH1/PTPRC/IRF7/IFI44 |
| 4 | GO:0051480 | Regulation of
cytosolic calcium ion concentration |
6.33×10⁻⁷ |
AVPR1A/P2RY1/EDNRB/PTPRC/HTR2A/TAC1/NMB/HTR2B |
| 4 | GO:2000021 | Regulation of ion
homeostasis |
8.55×10⁻⁷ |
AVPR1A/EDNRB/PTPRC/HTR2A/TAC1/IFI6/HTR2B |
| 4 | GO:0007620 | Copulation |
1.45×10⁻⁶ |
AVPR1A/P2RY1/EDNRB/TAC1 |
| 5 | GO:0006641 | Triglyceride
metabolic process |
8.23×10⁻⁵ |
ACSL1/DGAT2/PNPLA2/FABP4 |
| 5 | GO:0006639 | Acylglycerol
metabolic process |
8.23×10⁻⁵ |
ACSL1/DGAT2/PNPLA2/FABP4 |
| 5 | GO:0006638 | Neutral lipid
metabolic process |
8.23×10⁻⁵ |
ACSL1/DGAT2/PNPLA2/FABP4 |
| 5 | GO:0019216 | Regulation of lipid
metabolic process |
1.38×10⁻⁴ |
ACSL1/SCD/DGAT2/PNPLA2/LEP |
| 5 | GO:0035337 | Fatty-acyl-CoA
metabolic process |
1.60×10⁻⁴ |
ACSL1/SCD/DGAT2 |
| 6 | GO:0072329 | Monocarboxylic acid
catabolic process |
2.81×10⁻⁴ |
ABAT/EHHADH/ALDH3A2/PECR |
| 6 | GO:0006631 | Fatty acid
metabolic process |
2.81×10⁻⁴ |
PRKAR2B/EHHADH/ALDH3A2/PECR/PDHX |
| 6 | GO:0044282 | Small molecule
catabolic process |
2.81×10⁻⁴ |
ABAT/EHHADH/ALDH3A2/ALDH1B1/PECR |
| 6 | GO:0034308 | Primary alcohol
metabolic process |
5.03×10⁻⁴ |
ALDH3A2/ALDH1B1/PECR |
| 6 | GO:0016054 | Organic acid
catabolic process |
8.48×10⁻⁴ |
ABAT/EHHADH/ALDH3A2/PECR |
DEM-DEG regulatory association
analysis
A total of 7,381 target genes were predicted for the
21 upregulated DEMs, and 5,841 were predicted for the 15
downregulated DEMs. Following overlapping with the DEGs, 654
interactions were obtained for the 21 upregulated DEMs and 247
downregulated DEGs, and 197 interactions were obtained for the 14
downregulated DEMs and 96 upregulated DEGs.
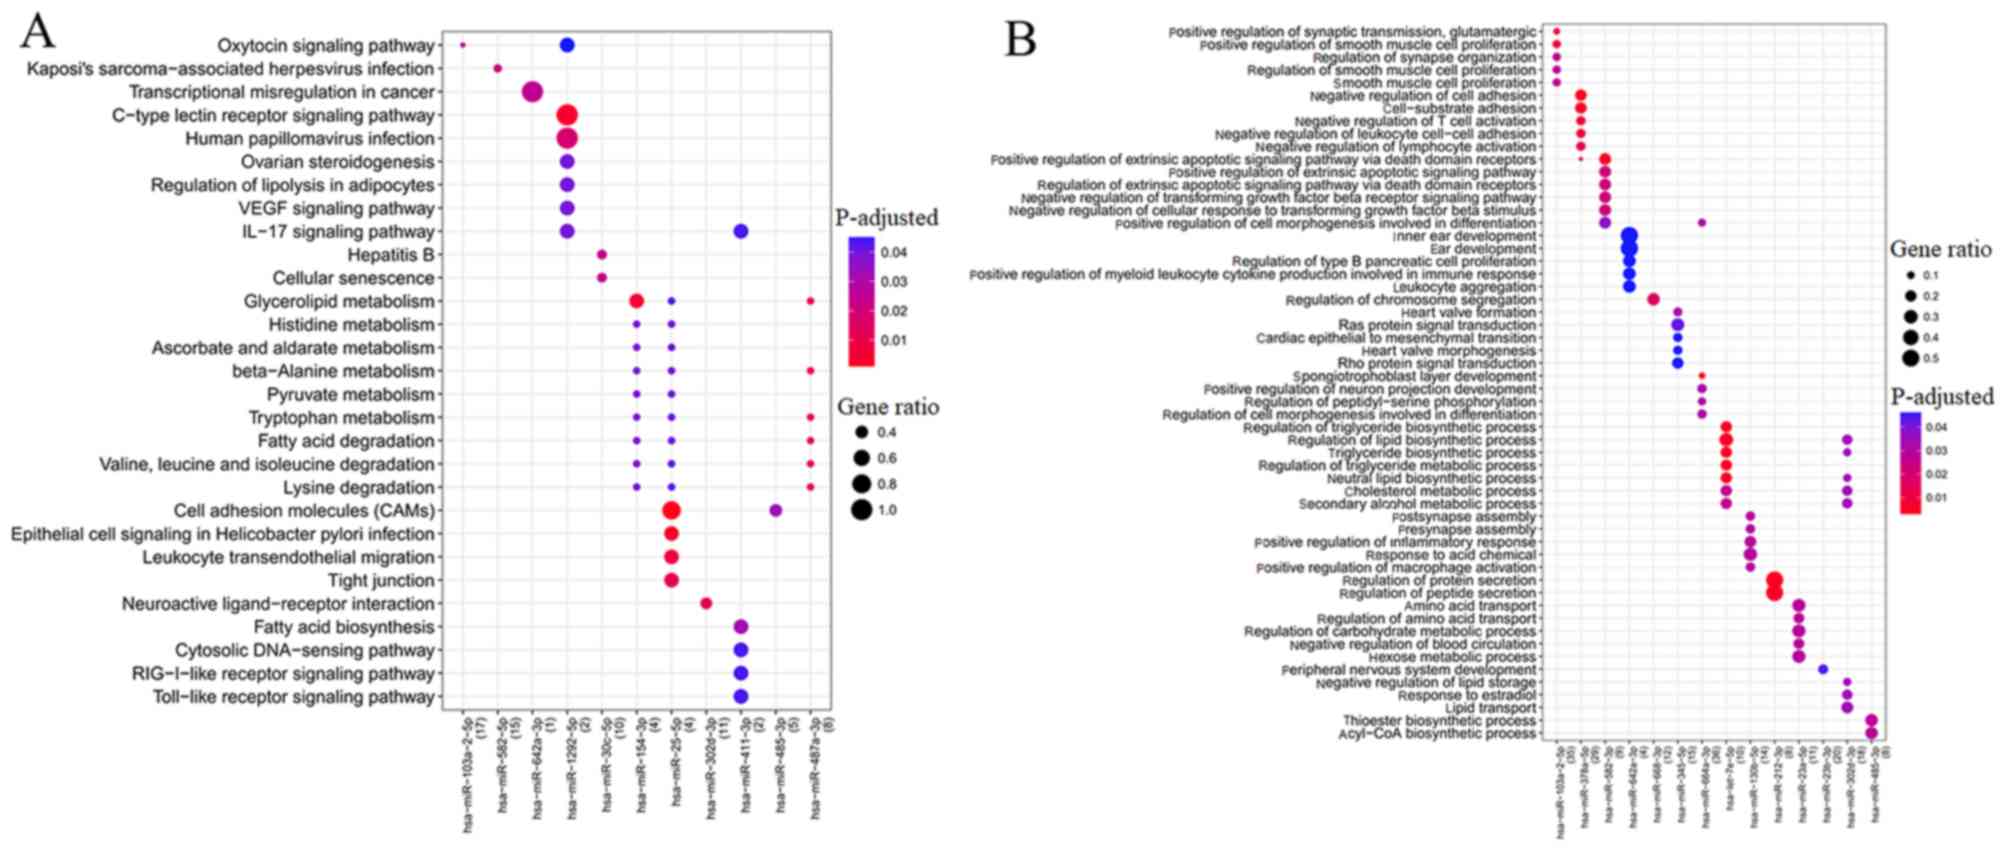
The target genes of five upregulated DEMs
(hsa-miR-103a-2-5p, hsa-miR-582-5p, hsa-miR-642a-5p,
hsa-miR-1292-5p and hsa-miR-30c-5p and) were enriched into 29 KEGG
pathways, whereas 36 KEGG pathways were enriched for six
downregulated DEMs (hsa-miR-302d-3p, hsa-miR-154-3p,
hsa-miR-485-3p, hsa-miR-25-5p, hsa-miR-487a and hsa-miR-411-3p)
(Fig. 5A). Among them,
hsa-miR-302d-3p regulated hub gene LEP to be involved in
neuroactive ligand-receptor interaction; whereas hsa-miR-487a
targeted hub gene EHHADH for involvement in amino acid (β-alanine,
lysine, valine, leucine and isoleucine) metabolism; hub gene CXCL10
regulated by hsa-miR-411-3p was involved in the IL-17 signaling
pathway, Toll-like receptor signaling pathway, and TNF signaling
pathway (Table VI).
| Table VI.Kyoto Encyclopedia of Genes and
Genomes pathway enrichment for target genes of microRNAs. |
Table VI.
Kyoto Encyclopedia of Genes and
Genomes pathway enrichment for target genes of microRNAs.
| Expression | Cluster | ID | Description | Adjusted
P-value | Genes |
|---|
| Up |
hsa-miR-103a-2-5p | hsa04921 | Oxytocin signaling
pathway |
2.67×10⁻² |
NFATC2/OXTR/GUCY1A3/PTGS2 |
|
| hsa-miR-582-5p | hsa05167 | Kaposi's
sarcoma-associated herpesvirus infection |
2.16×10⁻² |
PTGS2/ANGPT2/CXCL2/NFATC2 |
|
|
hsa-miR-642a-3p | hsa05202 | Transcriptional
misregulation in cancer |
2.51×10⁻² | NR4A3 |
|
|
hsa-miR-1292-5p | hsa04625 | C-type lectin
receptor signaling pathway |
3.91×10⁻³ | PTGS2/IRF1 |
|
|
hsa-miR-1292-5p | hsa05165 | Human
papillomavirus infection |
1.85×10⁻² | PTGS2/IRF1 |
|
|
hsa-miR-1292-5p | hsa04923 | Regulation of
lipolysis in adipocytes |
3.92×10⁻² | PTGS2 |
|
|
hsa-miR-1292-5p | hsa04370 | VEGF signaling
pathway |
3.92×10⁻² | PTGS2 |
|
|
hsa-miR-1292-5p | hsa04917 | Prolactin signaling
pathway |
3.92×10⁻² | IRF1 |
|
|
hsa-miR-1292-5p | hsa05140 | Leishmaniasis |
3.92×10⁻² | PTGS2 |
|
|
hsa-miR-1292-5p | hsa05133 | Pertussis |
3.92×10⁻² | IRF1 |
|
|
hsa-miR-1292-5p | hsa04657 | IL-17 signaling
pathway |
3.92×10⁻² | PTGS2 |
|
|
hsa-miR-1292-5p | hsa04064 | NF-κB signaling
pathway |
3.92×10⁻² | PTGS2 |
|
|
hsa-miR-1292-5p | hsa04668 | TNF signaling
pathway |
4.04×10⁻² | PTGS2 |
|
|
hsa-miR-1292-5p | hsa05160 | Hepatitis C |
4.38×10⁻² | IRF1 |
|
| hsa-miR-30c-5p | hsa05161 | Hepatitis B |
2.34×10⁻² |
NFATC2/CCNA1/CCNE2 |
|
| hsa-miR-30c-5p | hsa04218 | Cellular
senescence |
2.34×10⁻² |
NFATC2/CCNA1/CCNE2 |
| Down | hsa-miR-154-3p | hsa00561 | Glycerolipid
metabolism |
5.15×10⁻³ | GPAM/ALDH1B1 |
|
| hsa-miR-154-3p | hsa00340 | Histidine
metabolism |
3.86×10⁻² | ALDH1B1 |
|
| hsa-miR-154-3p | hsa00053 | Ascorbate and
aldarate metabolism |
3.86×10⁻² | ALDH1B1 |
|
| hsa-miR-154-3p | hsa00410 | β-alanine
metabolism |
3.86×10⁻² | ALDH1B1 |
|
| hsa-miR-154-3p | hsa00620 | Pyruvate
metabolism |
3.86×10⁻² | ALDH1B1 |
|
| hsa-miR-25-5p | hsa04514 | Cell adhesion
molecules (CAMs) |
5.22×10⁻⁴ |
PTPRF/F11R/JAM2 |
|
| hsa-miR-25-5p | hsa05120 | Epithelial cell
signaling in Helicobacter pylori infection |
4.44×10⁻³ | F11R/JAM2 |
|
| hsa-miR-25-5p | hsa04670 | Leukocyte
transendothelial migration |
8.00×10⁻³ | F11R/JAM2 |
|
| hsa-miR-25-5p | hsa04530 | Tight junction |
1.37×10⁻² | F11R/JAM2 |
|
| hsa-miR-25-5p | hsa00340 | Histidine
metabolism |
4.01×10⁻² | ALDH1B1 |
|
|
hsa-miR-302d-3p | hsa04080 | Neuroactive
ligand-receptor interaction |
1.35×10⁻² |
EDNRB/LEP/RXFP1/PTGFR |
|
| hsa-miR-485-3p | hsa04514 | Cell adhesion
molecules (CAMs) |
3.30×10⁻² | PTPRF/NLGN4X |
|
|
hsa-miR-487a-3p | hsa00410 | β-alanine
metabolism |
1.07×10⁻² | ALDH1B1/EHHADH |
|
|
hsa-miR-487a-3p | hsa00380 | Tryptophan
metabolism |
1.07×10⁻² | ALDH1B1/EHHADH |
|
|
hsa-miR-487a-3p | hsa00071 | Fatty acid
degradation |
1.07×10⁻² | ALDH1B1/EHHADH |
|
|
hsa-miR-487a-3p | hsa00280 | Valine, leucine and
isoleucine degradation |
1.07×10⁻² | ALDH1B1/EHHADH |
|
|
hsa-miR-487a-3p | hsa00310 | Lysine
degradation |
1.15×10⁻² | ALDH1B1/EHHADH |
|
|
hsa-miR-487a-3p | hsa00561 | Glycerolipid
metabolism |
1.15×10⁻² | GPAM/ALDH1B1 |
|
| hsa-miR-411-3p | hsa00061 | Fatty acid
biosynthesis |
3.16×10⁻² | OLAH |
|
| hsa-miR-411-3p | hsa04623 | Cytosolic
DNA-sensing pathway |
4.34×10⁻² | CXCL10 |
|
| hsa-miR-411-3p | hsa04622 | RIG-I-like receptor
signaling pathway |
4.34×10⁻² | CXCL10 |
|
| hsa-miR-411-3p | hsa04657 | IL-17 signaling
pathway |
4.34×10⁻² | CXCL10 |
|
| hsa-miR-411-3p | hsa04620 | Toll-like receptor
signaling pathway |
4.34×10⁻² | CXCL10 |
|
| hsa-miR-411-3p | hsa04668 | TNF signaling
pathway |
4.34×10⁻² | CXCL10 |
Furthermore, GO biological process term enrichment
analysis was also performed to predict the functions of DEMs
(Fig. 5B). As a result, GO terms
were enriched for nine upregulated DEMs (hsa-miR-103-5p,
hsa-let-7e-5p, hsa-miR-212-3p, hsa-miR-345-5p, hsa-miR-378a-5p,
hsa-miR-642a-3p, hsa-miR-582-3p, hsa-miR-664a-3p and
hsa-miR-668-3p) and five downregulated DEMs (hsa-miR-302d-3p,
hsa-miR-485-3p, hsa-miR-130b-5p, hsa-miR-23a-5p and
hsa-miR-23b-5p). hsa-miR-378a-5p may regulate hub gene RAC2 to be
involved in cell-substrate adhesion. hsa-miR-130b-5p,
hsa-miR-23a-5p and hsa-miR-302d-3p may regulate hub gene LEP to be
involved in regulation of inflammatory response and IL-8 secretion
(Table VII).
| Table VII.GO term enrichment for target genes
of microRNAs. |
Table VII.
GO term enrichment for target genes
of microRNAs.
| Expression | Cluster | ID | Description | Adjusted
P-value | Genes |
|---|
| Up |
hsa-miR-103a-2-5p | GO:0051968 | Positive regulation
of synaptic transmission, glutamatergic |
1.18×10⁻² |
OXTR/NLGN1/PTGS2 |
|
|
hsa-miR-103a-2-5p | GO:0048661 | Positive regulation
of smooth muscle cell proliferation |
1.18×10⁻² |
IL10/NR4A3/IL6R/PTGS2 |
|
|
hsa-miR-103a-2-5p | GO:0050807 | Regulation of
synapse organization |
2.79×10⁻² | OXTR/IL10/NLGN1/
LRRTM2 |
|
|
hsa-miR-103a-2-5p | GO:0048660 | Regulation of
smooth muscle cell proliferation |
2.79×10⁻² |
IL10/NR4A3/IL6R/PTGS2 |
|
|
hsa-miR-103a-2-5p | GO:0048659 | Smooth muscle cell
proliferation |
2.79×10⁻² |
IL10/NR4A3/IL6R/PTGS2 |
|
|
hsa-miR-378a-5p | GO:0007162 | Negative regulation
of cell adhesion |
3.27×10⁻³ |
IRF1/PELI1/ANGPT2/IL10/SMAD7/SEMA3E |
|
|
hsa-miR-378a-5p | GO:0031589 | Cell-substrate
adhesion |
6.55×10⁻³ |
LIMS1/RAC2/KIF14/ANGPT2/SEMA3E/PEAK1 |
|
|
hsa-miR-378a-5p | GO:0050868 | Negative regulation
of T cell activation |
8.67×10⁻³ |
IRF1/PELI1/IL10/SMAD7 |
|
|
hsa-miR-378a-5p | GO:1903038 | Negative regulation
of leukocyte cell-cell adhesion |
9.77×10⁻³ |
IRF1/PELI1/IL10/SMAD7 |
|
|
hsa-miR-378a-5p | GO:0051250 | Negative regulation
of lymphocyte activation |
1.53×10⁻² |
IRF1/PELI1/IL10/SMAD7 |
|
| hsa-miR-582-3p | GO:1902043 | Positive regulation
of extrinsic apoptotic signaling pathway via death domain
receptors |
6.49×10⁻³ | SKIL/TIMP3 |
|
| hsa-miR-582-3p | GO:2001238 | Positive regulation
of extrinsic apoptotic signaling pathway |
2.23×10⁻² | SKIL/TIMP3 |
|
| hsa-miR-582-3p | GO:1902041 | Regulation of
extrinsic apoptotic signaling pathway via death domain
receptors |
2.23×10⁻² | SKIL/TIMP3 |
|
| hsa-miR-582-3p | GO:0030512 | Negative regulation
of transforming growth factor β receptor signaling pathway |
2.23×10⁻² | SKIL/HTRA4 |
|
| hsa-miR-582-3p | GO:1903845 | Negative regulation
of cellular response to transforming growth factor β stimulus |
2.23×10⁻² | SKIL/HTRA4 |
|
|
hsa-miR-642a-3p | GO:0048839 | Inner ear
development |
4.66×10⁻² | NR4A3/MCOLN3 |
|
|
hsa-miR-642a-3p | GO:0043583 | Ear
development |
4.66×10⁻² | NR4A3/MCOLN3 |
|
|
hsa-miR-642a-3p | GO:0061469 | Regulation of type
B pancreatic cell proliferation |
4.66×10⁻² | NR4A3 |
|
|
hsa-miR-642a-3p | GO:0061081 | Positive regulation
of myeloid leukocyte cytokine production involved in immune
response |
4.66×10⁻² | NR4A3 |
|
|
hsa-miR-642a-3p | GO:0070486 | Leukocyte
aggregation |
4.66×10⁻² | NR4A3 |
|
| hsa-miR-668-3p | GO:0051983 | Regulation of
chromosome segregation |
1.74×10⁻² |
KIF2C/MKI67/GEN1 |
|
| hsa-miR-345-5p | GO:0003188 | Heart valve
formation |
3.30×10⁻² | HEY2/ERG |
|
| hsa-miR-345-5p | GO:0007265 | Ras protein signal
transduction |
4.24×10⁻² |
CDC42EP2/NGFR/RASAL2/P2RY8 |
|
| hsa-miR-345-5p | GO:0060317 | Cardiac epithelial
to mesenchymal transition |
4.65×10⁻² | HEY2/ERG |
|
| hsa-miR-345-5p | GO:0003179 | Heart valve
morphogenesis |
4.65×10⁻² | HEY2/ERG |
|
| hsa-miR-345-5p | GO:0007266 | Rho protein signal
transduction |
4.65×10⁻² |
CDC42EP2/NGFR/P2RY8 |
|
|
hsa-miR-664a-3p | GO:0060712 | Spongiotrophoblast
layer development |
3.57×10⁻³ | LIF/NRK/PHLDA2 |
|
|
hsa-miR-664a-3p | GO:0010976 | Positive regulation
of neuron projection development |
3.11×10⁻² |
MAP1B/NTRK2/PAK3/SKIL/NLGN1 |
|
|
hsa-miR-664a-3p | GO:0033135 | Regulation of
peptidyl-serine phosphorylation |
3.11×10⁻² |
LIF/PTGS2/NTRK2/RASSF2 |
|
|
hsa-miR-664a-3p | GO:0010770 | Positive regulation
of cell morphogenesis involved in differentiation |
3.11×10⁻² |
MAP1B/NTRK2/PAK3/SKIL |
|
|
hsa-miR-664a-3p | GO:0010769 | Regulation of cell
morphogenesis involved in differentiation |
3.11×10⁻² |
MAP1B/NTRK2/PAK3/SKIL/NLGN1 |
|
| hsa-let-7e-5p | GO:0010866 | Regulation of
triglyceride biosynthetic process |
5.26×10⁻³ | THRSP/DGAT2 |
|
| hsa-let-7e-5p | GO:0046890 | Regulation of lipid
biosynthetic process |
5.26×10⁻³ |
THRSP/SCD/DGAT2 |
|
| hsa-let-7e-5p | GO:0019432 | Triglyceride
biosynthetic process |
5.26×10⁻³ | THRSP/DGAT2 |
|
| hsa-let-7e-5p | GO:0090207 | Regulation of
triglyceride metabolic process |
5.26×10⁻³ | THRSP/DGAT2 |
|
| hsa-let-7e-5p | GO:0046460 | Neutral lipid
biosynthetic process |
5.26×10⁻³ | THRSP/DGAT2 |
|
| hsa-miR-212-3p | GO:0050708 | Regulation of
protein |
5.15×10⁻³ |
SLC2A1/IL1RL1/GPAM/PDE8B |
|
| hsa-miR-212-3p | GO:0002791 | Regulation of
peptide secretion |
5.15×10⁻³ |
SLC2A1/IL1RL1/GPAM/PDE8B |
| Down |
hsa-miR-130b-5p | GO:0001101 | Response to acid
chemical |
2.93×10⁻² |
WNT5A/ACSL1/LEP/PTGFR |
|
|
hsa-miR-130b-5p | GO:0043032 | Positive regulation
of macrophage activation |
2.93×10⁻² | WNT5A/IL1RL1 |
|
|
hsa-miR-130b-5p | GO:0050727 | Regulation of
inflammatory response |
3.66×10⁻² |
WNT5A/LEP/CX3CL1/IL1RL1 |
|
|
hsa-miR-130b-5p | GO:0072606 | Interleukin-8
secretion |
3.66×10⁻² | WNT5A/LEP |
|
|
hsa-miR-130b-5p | GO:0001819 | Positive regulation
of cytokine production |
3.66×10⁻² |
WNT5A/LEP/CX3CL1/IL1RL1 |
|
| hsa-miR-23a-5p | GO:0006865 | Amino acid
transport |
2.87×10⁻² |
LEP/SLC6A6/ATP1A2 |
|
| hsa-miR-23a-5p | GO:0051955 | Regulation of amino
acid transport |
2.87×10⁻² | LEP/ATP1A2 |
|
| hsa-miR-23a-5p | GO:0006109 | Regulation of
carbohydrate metabolic process |
2.87×10⁻² |
LEP/IGFBP5/PFKFB4 |
|
| hsa-miR-23a-5p | GO:0019229 | Regulation of
vasoconstriction |
2.87×10⁻² | LEP/ATP1A2 |
|
| hsa-miR-23a-5p | GO:0046942 | Carboxylic acid
transport |
2.87×10⁻² |
LEP/SLC6A6/ATP1A2 |
|
| hsa-miR-23a-5p | GO:0001909 | Leukocyte mediated
cytotoxicity |
3.30×10⁻² | LEP/TREM1 |
|
| hsa-miR-23a-5p | GO:0014897 | Striated muscle
hypertrophy |
3.80×10⁻² | LEP/IGFBP5 |
|
| hsa-miR-23a-5p | GO:0010906 | Regulation of
glucose metabolic process |
3.80×10⁻² | LEP/IGFBP5 |
|
| hsa-miR-23a-5p | GO:0010675 | Regulation of
cellular carbohydrate metabolic process |
4.72×10⁻² | LEP/IGFBP5 |
|
| hsa-miR-23b-3p | GO:0007422 | Peripheral nervous
system development |
4.39×10⁻² |
ALDH3A2/EDNRB/HOXD10 |
|
|
hsa-miR-302d-3p | GO:0010888 | Negative regulation
of lipid storage |
3.41×10⁻² | LEP/ABCG1 |
|
|
hsa-miR-302d-3p | GO:0032355 | Response to
estradiol |
3.41×10⁻² |
LEP/TXNIP/PTGFR |
|
|
hsa-miR-302d-3p | GO:0008203 | Cholesterol
metabolic process |
3.41×10⁻² |
VLDLR/LEP/ABCG1 |
|
|
hsa-miR-302d-3p | GO:1902652 | Secondary alcohol
metabolic process |
3.41×10⁻² |
VLDLR/LEP/ABCG1 |
|
|
hsa-miR-302d-3p | GO:0006869 | Lipid
transport |
3.41×10⁻² |
VLDLR/LEP/THRSP/ABCG1 |
|
|
hsa-miR-302d-3p | GO:1900015 | Regulation of
cytokine production involved in inflammatory response |
3.41×10⁻² | C5orf30/LEP |
|
|
hsa-miR-302d-3p | GO:0046890 | Regulation of lipid
biosynthetic process |
3.41×10⁻² |
LEP/THRSP/ABCG1 |
|
|
hsa-miR-302d-3p | GO:0002534 | Cytokine production
involved in inflammatory response |
3.41×10⁻² | C5orf30/LEP |
|
| hsa-miR-485-3p | GO:0035384 | Thioester
biosynthetic process |
2.86×10⁻² | PDHX/SCD |
|
| hsa-miR-485-3p | GO:0071616 | Acyl-CoA
biosynthetic process |
2.86×10⁻² | PDHX/SCD |
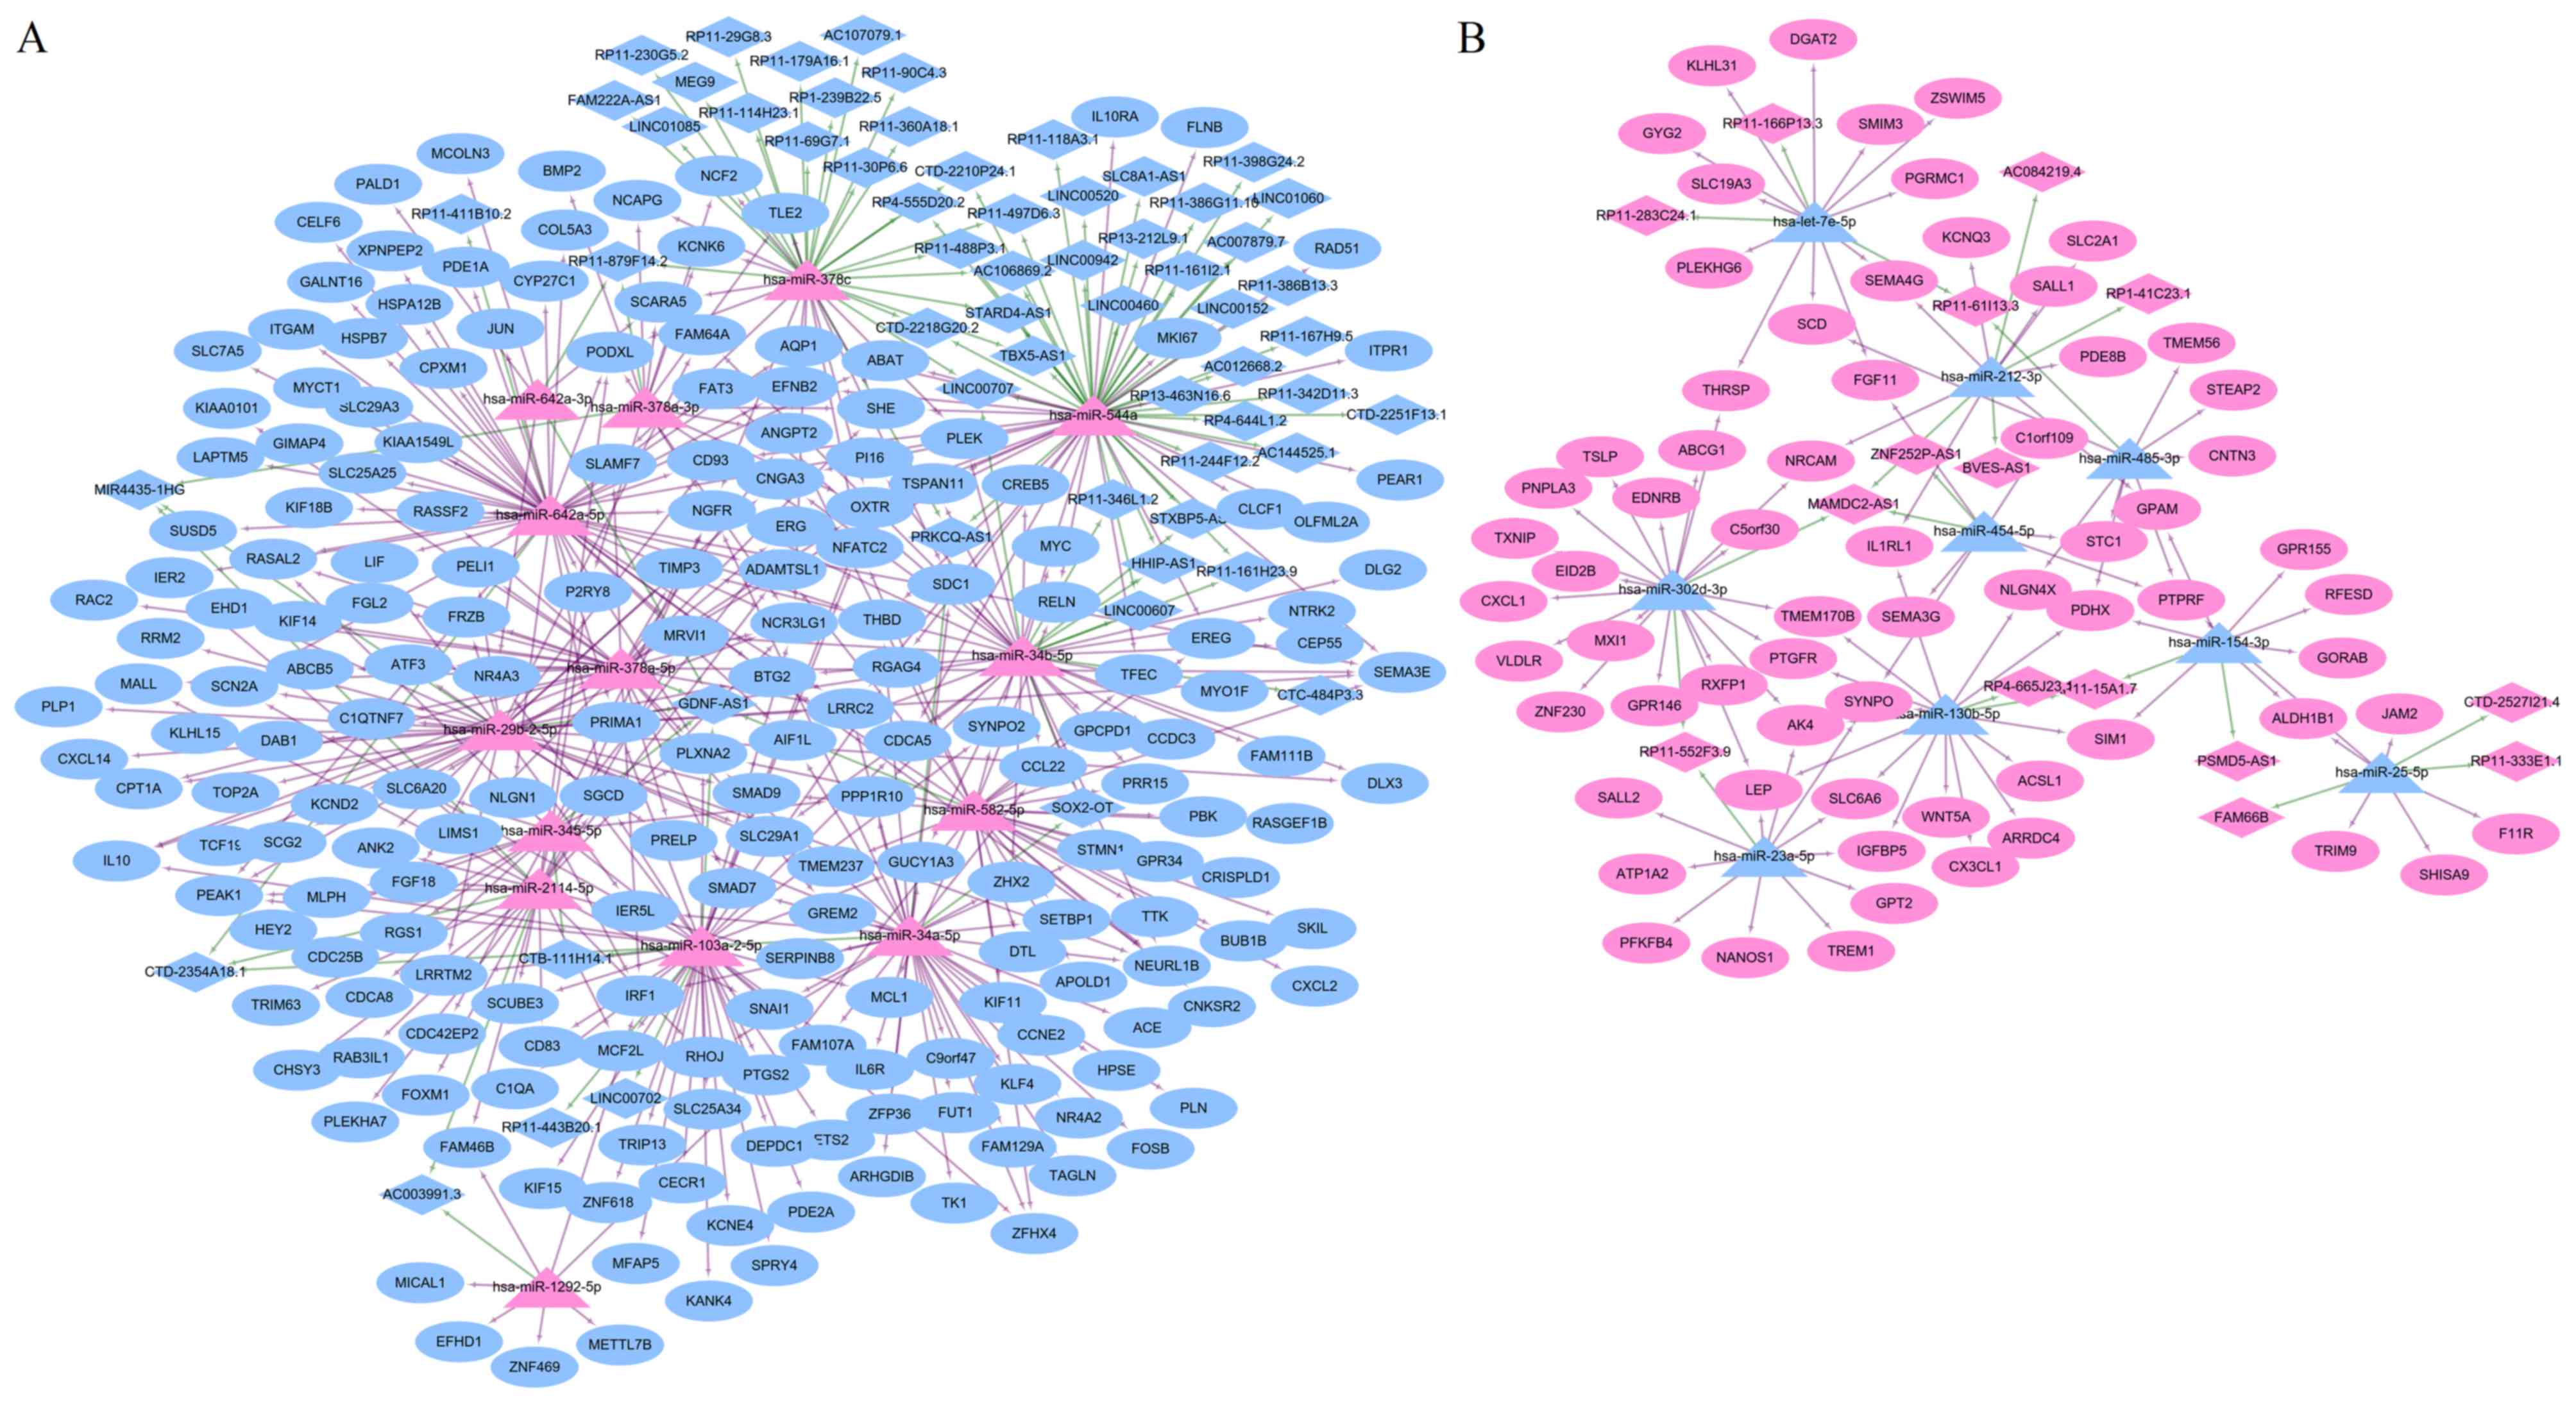
ceRNA network
Using the miRWalk and InCeDB databases, 14
upregulated DEMs were predicted to regulate 60 downregulated DELs
and nine downregulated DEMs were predicted to regulate 15
upregulated DELs. An lncRNA-miRNA-mRNA ceRNA network was
subsequently established (Fig. 6A and
B), in which 366 nodes (23 DEMs: 14 upregulated and nine
downregulated; 268 DEGs: 67 upregulated and 201 downregulated; 75
DELs: 15 upregulated and 60 downregulated) and 560 interactions
(450 DEL-DEM and 110 DEM-DEG) were present. In this ceRNA,
upregulated RP11-552F3.9 (or RP11-15A1.7) may function as a ceRNA
to respectively suppress the inhibitory effects of hsa-miR-23a-5p
and hsa-miR-302d-3p (or hsa-miR-130b-5p) on LEP, resulting in its
upregulated expression; whereas the downregulation of GDNF-AS1 may
be insufficient to prevent the inhibitory effects of
hsa-miR-378a-5p on hub gene RAC2, leading to its downregulated
expression (Fig. 6A and B).
Discussion
The present study aimed to identify crucial mRNAs,
miRNAs and lncRNAs for the adipocyte differentiation of HASCs based
on a series of bioinformatics analyses, including PPI network
construction, module analysis, miRNA-mRNA regulatory pair
prediction, ceRNA network generation and function enrichment. In
these analyses, the LEP gene was enriched and was regulated by
RP11-552F3.9 (or RP11-15A1.7)-hsa-miR-23a-5p/hsa-miR-302d-3p (or
hsa-miR-130b-5p), and involved in the inflammatory response,
indicating that the LEP-related ceRNA axis may be important for the
differentiation of adipose tissue-derived stem cells into
adipocytes.
There is evidence demonstrating that LEP is
important in adipocyte differentiation (26). Lee et al (27) observed that leptin treatment can
promote lipid droplet formation and adipocyte differentiation,
which was evaluated by the activity of glycerol-3-phosphate
dehydrogenase activity, of HASCs. Additionally, the effect of
leptin on adipocyte differentiation was found to be higher for
HASCs than BMSCs (27). Another
study indicated that, in BMSCs, leptin may accelerate osteogenic
differentiation but inhibit adipocyte differentiation (28). Similarly, leptin was shown to have
a suppressive effect on adipogenesis in dental pulp stem cells and
periodontal ligament stem cells (29). These findings suggest that leptin
may be a specific factor for regeneration of the subcutaneous fat
layer using HASCs for tissue engineering. As expected, the LEP gene
was also significantly upregulated in differentiated adipocyte
samples compared with undifferentiated HASCs in the present study.
It was predicted that the downstream of LEP may be involved in the
JAK-STAT signaling pathway to mediate the inflammatory response via
interaction with certain anti-inflammatory-related factors (IL4R,
downregulated; Table IV; Fig. 3E). This prediction appears to have
been indirectly verified by previous studies; it has been reported
that leptin may have a promoting effect on the astroglial
differentiation of stem cells through activation of the JAK-STAT
pathway, with JAK-STAT inhibitors decreasing the expression of
astrocyte marker leptin (30).
STAT6 is reported to inhibit human IL-4 promoter activity in T
cells and downregulate the gene expression of IL-4 (31). IL-4/IL4R can inhibit adipocyte
differentiation by two mechanisms: Inhibiting adipogenesis via
downregulating the expression of PPARγ and C/EBPα; and promoting
lipolysis in mature adipocytes via enhancing the activity and
translocation of hormone-sensitive lipase to decrease lipid
deposits (32). However, the
LEP-JAK-STAT-IL-4/IL4R signal pathways in the adipocyte
differentiation of HASCs requires further experimental validation.
In addition to the downstream pathways, the present study also
analyzed the upstream non-coding RNAs of LEP, including miRNAs and
lncRNAs, which were previously considered to be crucial for the
adipogenic differentiation of HASCs (13,14,33–36).
The results identified the RP11-552F3.9 (or
RP11-15A1.7)-hsa-miR-23a-5p/hsa-miR-302d-3p (or
hsa-miR-130b-5p)-LEP ceRNA axes. miR-130 has been shown to affect
adipocyte differentiation from preadipocytes, with overexpressing
miR-130 impairing adipogenesis and reducing miR-130-enhanced
adipogenesis, and its potential target may be adipogenesis-related
gene PPARγ (37). In addition, the
inhibition of miR-23a has been reported to increase the adipogenic
differentiation of BMSCs (38). In
line with these findings, the present study found that
hsa-miR-130b-5p and has-miR-23a-5p were downregulated in adipocyte
differentiated HASCs. There have been no reports on the roles of
miR-302d-3p and the above lncRNAs (RP11-552F3.9 and RP11-15A1.7)
for adipocyte differentiation, indicating they may be novel targets
identified by the present study.
RAC2 was identified as another hub gene that may be
involved in the adipocyte differentiation of HASCs by miRNA-mRNA
regulatory pair prediction and ceRNA network analysis. RAC2 was
related to cell-substrate adhesion. It is well accepted that
cell-substrate adhesion can control the fate of stem cells
(39). A previous study showed
that HASCs differentiated into adipocytes when the substrate
stiffness decreased (40). Focal
adhesion kinase (FAK) is a central protein involved in
cell-substrate adhesion by Cas-Rac-lamellipodin signaling (41). The stimulation of Rac and increase
in the activity of FAK enhanced cell tension by maintaining cell
shape and matrix adhesion (42),
whereas reduced cell stiffness and reduced adhesion strength have
been observed in FAK-deficient cells (43). The inhibition of FAK has also been
reported to lead to the elevation of adipogenic marker gene LEP and
lipid accumulation in HASCs (43).
These findings implicate the underlying anti-adipogenic activity of
FAK and RAC. In line with these findings, the present study found
that RAC2 was downregulated in adipocyte differentiated HASCs.
Furthermore, it was predicted that RAC2 may be regulated by
GDNF-AS1-hsa-miR-378a-5p. Previous evidence has shown that miR-378
is an adipogenesis-related miRNA in human adipocytes (44). The expression of miR-378a is
upregulated in the adipose tissues of high fat diet-induced obese
mice, and during the differentiation of preadipocytes (45,46).
Investigations of the mechanism have revealed that miR-378 may
induce adipogenesis by targeting mitogen-activated protein kinase 1
(45), E2F transcription factor 2
and Ras-related nuclear-binding protein 10 (46). Accordingly, it was hypothesized
that hsa-miR-378a-5p may be upregulated in adipocyte differentiated
HASCs, which was demonstrated in the present study. However,
further experiments are required to confirm the role of this miRNA
in HASC differentiation and its targeted interactions with RAC2.
There are no previous reports on the roles of GDNF-AS1 in HASC
differentiation, indicating it may also be a novel target
identified by the present study.
Hub genes CXCL10 in module 2 and EHHADH in module 6
were shown to be respectively regulated by hsa-miR-411-3p and
hsa-miR-487a, being involved in inflammatory and amino acid
metabolism pathways for HASC differentiation. As reported for LEP
above, inflammation promotes the adipocyte differentiation of
HASCs, whereas CXCL10 is a well-known pro-inflammatory chemokine
(47). Therefore, CXCL10 may be
upregulated in adipocyte differentiated HASCs, which was confirmed
in the present study. EHHADH has been reported as a downstream
target upregulated by PPAR (48).
PPAR is an important marker in stimulating adipogenesis (12). EHHADH may also be expressed at a
high level in adipocyte differentiated HASCs, which was in
consistent with the present study. These two miRNAs regulating
CXCL10 and EHHADH have not been demonstrated to be responsible for
HASC differentiation, which highlights potential directions in
future investigations.
CCNB1, JUN and PTPRC were suggested to be important
for adipocyte differentiation from HASCs according to the PPI
network analysis. With reference to previous studies, high
expression levels of CCNB1 (49)
and JUN (50) may be positively
associated with the proliferation of stem cells. Generally, the
differentiation process can be executed only following weakening of
the proliferation ability of stem cells. In the adipocyte
differentiation of HASCs, CCNB1 and JUN may be downregulated, which
was verified in the present study. PTPRC is also known as CD45, a
JAK phosphatase, which negatively regulates cytokine receptor
signaling via inhibiting the activity of STAT3 (51,52).
According to the findings of LEP above, PTPRC may be downregulated
for the adipocyte differentiation of HASCs, which was in line with
the results of the present study.
There were some limitations in the present study.
First, adipocyte differentiated cells were induced following
different culture durations in the GSE57593, GSE25715 and GSE61302
datasets, which may lead to differences in the expression levels of
the identified mRNAs, miRNAs and lncRNAs if the same samples were
used for their detection. Second, the sample size of each dataset
(GSE57593: Four undifferentiated HASCs and six adipocyte
differentiated cells; GSE25715: Four undifferentiated HASCs and
eight adipocyte differentiated cells: GSE61302: Five
undifferentiated HASCs and 10 adipocyte differentiated cells) was
small. Additional high-throughput sequencing experiments with
larger samples are required to confirm the conclusions. Third, the
present study comprised preliminary screening; however, further wet
experiments, including quantitative-polymerase chain reaction
analysis, western blotting, dual luciferase reporter assays, and
knockout or overexpression in vitro and in vivo, are
indispensable to confirm the expression levels of the identified
target genes and validate the regulatory associations between DEMs
and DELs/DEGs.
In conclusion, the present study preliminarily
identified several crucial DEGs (LEP, RAC2, CXCL10, EHHADH CCNB1,
JUN and PTPRC), DEMs (has-miR-130b-5p and has-miR-23a-5p,
has-miR-302d-3p, has-miR-378a-5p, hsa-miR-411-3p and hsa-miR-487a)
and DELs (RP11-552F3.9, RP11-15A1.7 and GDNF-AS1) for inducing the
adipogenic differentiation of HASCs. Among these, the RP11-552F3.9
(or RP11-15A1.7)-hsa-miR-302d-3p-LEP ceRNA interaction axes may be
particularly important and represents a novel mechanism for the
adipogenic differentiation of HASCs. Further in vitro and
in vivo investigations are required to confirm their roles
in breast reconstruction and augmentation.
Acknowledgements
Not applicable.
Funding
No funding was received.
Availability of data and materials
The microarray data GSE57593, GSE25715 and GSE61302
were downloaded from the GEO database in NCBI (www.ncbi.nlm.nih.gov/geo/).
Authors' contributions
ZG and YC conceived and designed the original study.
ZG conducted the bioinformatic analysis and drafted the manuscript.
YC contributed to the acquisition and interpretation of data and
revised the manuscript. Both authors read and approved the final
manuscript.
Ethics approval and consent to
participate
Not applicable.
Patient consent for publication
Not applicable.
Competing interests
The authors declare that they have no competing
interests.
References
|
1
|
Ghoncheh M, Pournamdar Z and Salehiniya H:
Incidence and mortality and epidemiology of breast cancer in the
world. Asian Pac J Cancer Prev. 17:43–46. 2016. View Article : Google Scholar : PubMed/NCBI
|
|
2
|
Szychta P, Zadrozny M, Rykala J, Banasiak
L and Witmanowski H: Autologous fat transfer to the subcutaneous
tissue in the context of breast reconstructive procedures. Postepy
Dermatol Alergol. 33:323–328. 2016. View Article : Google Scholar : PubMed/NCBI
|
|
3
|
Soares MA, Ezeamuzie OC, Ham MJ, Duckworth
AM, Rabbani PS, Saadeh PB and Ceradini DJ: Targeted protection of
donor graft vasculature using a phosphodiesterase inhibitor
increases survival and predictability of autologous fat grafts.
Plast Reconstr Surg. 135:488–499. 2015. View Article : Google Scholar : PubMed/NCBI
|
|
4
|
Kølle SF, Fischer-Nielsen A, Mathiasen AB,
Elberg JJ, Oliveri RS, Glovinski PV, Kastrup J, Kirchhoff M,
Rasmussen BS, Talman ML, et al: Enrichment of autologous fat grafts
with ex-vivo expanded adipose tissue-derived stem cells for graft
survival: A randomised placebo-controlled trial. Lancet.
382:1113–1120. 2013. View Article : Google Scholar : PubMed/NCBI
|
|
5
|
Sterodimas A, Faria JD, Nicaretta B and
Boriani F: Autologous fat transplantation versus adipose-derived
stem cell-enriched lipografts: A study. Aesthet Surg J. 31:682–693.
2011. View Article : Google Scholar : PubMed/NCBI
|
|
6
|
Tan SS, Zhi YN, Zhan W and Rozen W: Role
of adipose-derived stem cells in fat grafting and reconstructive
surgery. J Cutan Aesthet Surg. 9:152–156. 2016. View Article : Google Scholar : PubMed/NCBI
|
|
7
|
Feng H, Qiu L, Zhang T, Yu H, Ma X, Su Y,
Zheng H, Wang Y and Yi C: Heat-Shock Protein 70 Overexpression in
adipose-derived stem cells enhances fat graft survival. Ann Plast
Surg. 78:460–466. 2017. View Article : Google Scholar : PubMed/NCBI
|
|
8
|
Sun X, Zou T, Zuo C, Zhang M, Shi B, Jiang
Z, Cui H, Liao X, Li X, Tang Y, et al: IL-1α inhibits proliferation
and adipogenic differentiation of human adipose-derived mesenchymal
stem cells through NF-κB- and ERK1/2- mediated proinflammatory
cytokines. Cell Biol Int. 42:794–803. 2018. View Article : Google Scholar : PubMed/NCBI
|
|
9
|
Strong AL, Gimble JM and Bunnell BA:
Analysis of the pro- and anti-inflammatory cytokines secreted by
adult stem cells during differentiation. Stem Cells Int.
2015:4124672015. View Article : Google Scholar : PubMed/NCBI
|
|
10
|
Satish L, Krill-Burger JM, Gallo PH,
Etages SD, Liu F, Philips BJ, Ravuri S, Marra KG, Laframboise WA,
Kathju S and Rubin JP: Expression analysis of human adipose-derived
stem cells during in vitro differentiation to an adipocyte lineage.
BMC Med Genomics. 8:412015. View Article : Google Scholar : PubMed/NCBI
|
|
11
|
Kang T, Lu W, Xu W, Anderson L, Bacanamwo
M, Thompson W, Chen YE and Liu D: MicroRNA-27 (miR-27) targets
prohibitin and impairs adipocyte differentiation and mitochondrial
function in human adipose-derived stem Cells. J Biol Chem.
288:34394–34402. 2013. View Article : Google Scholar : PubMed/NCBI
|
|
12
|
Li H, Li T, Wang S, Wei J, Fan J, Li J,
Han Q, Liao L, Shao C and Zhao RC: miR-17-5p and miR-106a are
involved in the balance between osteogenic and adipogenic
differentiation of adipose-derived mesenchymal stem cells. Stem
Cell Res. 10:313–324. 2013. View Article : Google Scholar : PubMed/NCBI
|
|
13
|
Nuermaimaiti N, Liu J, Liang X, Jiao Y,
Zhang D, Liu L, Meng X and Guan Y: Effect of lncRNA HOXA11-AS1 on
adipocyte differentiation in human adipose-derived stem cells.
Biochem Biophys Res Commun. 495:1878–1884. 2018. View Article : Google Scholar : PubMed/NCBI
|
|
14
|
Huang Y, Jin C, Zheng Y, Li X, Shan Z,
Zhang Y, Jia L and Li W: Knockdown of lncRNA MIR31HG inhibits
adipocyte differentiation of human adipose-derived stem cells via
histone modification of FABP4. Sci Rep. 7:80802017. View Article : Google Scholar : PubMed/NCBI
|
|
15
|
Shang G, Wang Y, Xu Y, Zhang S, Sun X,
Guan H, Zhao X, Wang Y, Li Y and Zhao G: Long non-coding RNA
TCONS_00041960 enhances osteogenesis and inhibits adipogenesis of
rat bone marrow mesenchymal stem cell by targeting miR-204-5p and
miR-125a-3p. J Cell Physiol. 233:6041–6051. 2018. View Article : Google Scholar : PubMed/NCBI
|
|
16
|
Li M, Xie Z, Wang P, Li J, Liu W, Tang S,
Liu Z, Wu X, Wu Y and Shen H: The long noncoding RNA GAS5
negatively regulates the adipogenic differentiation of MSCs by
modulating the miR-18a/CTGF axis as a ceRNA. Cell Death Dis.
9:5542007. View Article : Google Scholar
|
|
17
|
Irizarry RA, Hobbs B, Collin F,
Beazer-Barclay YD, Antonellis KJ, Scherf U and Speed TP:
Exploration, normalization, and summaries of high density
oligonucleotide array probe level data. Biostatistics. 4:249–264.
2003. View Article : Google Scholar : PubMed/NCBI
|
|
18
|
Ritchie ME, Phipson B, Wu D, Hu Y, Law CW,
Shi W and Smyth GK: limma powers differential expression analyses
for RNA-sequencing and microarray studies. Nucleic Acids Res.
43:e472015. View Article : Google Scholar : PubMed/NCBI
|
|
19
|
Thissen D, Steinberg L and Kuang D: Quick
and easy implementation of the benjamini-hochberg procedure for
controlling the false positive rate in multiple comparisons. J Educ
Behav Stat. 27:77–83. 2002. View Article : Google Scholar
|
|
20
|
Szklarczyk D, Franceschini A, Wyder S,
Forslund K, Heller D, Huerta-Cepas J, Simonovic M, Roth A, Santos
A, Tsafou KP, et al: STRING v10: Protein-protein interaction
networks, integrated over the tree of life. Nucleic Acids Res.
43:Database Issue. D447–D452. 2015. View Article : Google Scholar : PubMed/NCBI
|
|
21
|
Kohl M, Wiese S and Warscheid B:
Cytoscape: Software for visualization and analysis of biological
networks. Methods Mol Biol. 696:291–303. 2011. View Article : Google Scholar : PubMed/NCBI
|
|
22
|
Tang Y, Li M, Wang J, Pan Y and Wu FX:
CytoNCA: A cytoscape plugin for centrality analysis and evaluation
of protein interaction networks. Biosystems. 127:67–72. 2015.
View Article : Google Scholar : PubMed/NCBI
|
|
23
|
Bader GD and Hogue CW: An automated method
for finding molecular complexes in large protein interaction
networks. BMC Bioinformatics. 4:22003. View Article : Google Scholar : PubMed/NCBI
|
|
24
|
Dweep H and Gretz N: miRWalk2. 0: A
comprehensive atlas of microRNA-target interactions. Nat Methods.
12:6972015. View Article : Google Scholar : PubMed/NCBI
|
|
25
|
Das S, Ghosal S, Sen R and Chakrabarti J:
lnCeDB: Database of human long noncoding RNA acting as competing
endogenous RNA. PLoS One. 9:e989652014. View Article : Google Scholar : PubMed/NCBI
|
|
26
|
Kleiman A, Keats EC, Chan NG and Khan ZA:
Elevated IGF2 prevents leptin induction and terminal adipocyte
differentiation in hemangioma stem cells. Exp Mol Pathol.
94:126–136. 2013. View Article : Google Scholar : PubMed/NCBI
|
|
27
|
Lee HS, Jang H, Jin OP, Choi J, Youm JH
and Hong ST: Effect of leptin on the differentiation of adipose
tissue-derived and bone marrow stromal cells into adipocytes.
Tissue Eng Regen Med. 6:1134–1138. 2009.
|
|
28
|
Thomas T, Gori F, Khosla S, Jensen MD,
Burguera B and Riggs BL: Leptin acts on human marrow stromal cells
to enhance differentiation to osteoblasts and to inhibit
differentiation to adipocytes. Endocrinology. 140:1630–1638. 1999.
View Article : Google Scholar : PubMed/NCBI
|
|
29
|
Um S, Choi JR, Lee JH, Zhang Q and Seo B:
Effect of leptin on differentiation of human dental stem cells.
Oral Dis. 17:662–669. 2011. View Article : Google Scholar : PubMed/NCBI
|
|
30
|
Wang YN, Yang M, Yu LH, Guo J, Chen N and
He L: Leptin play the key role in astroglial differentiation of
mouse neural stem cells and regulated the STAT3 signaling through
Jak-STAT3 pathway. Sichuan Da Xue Xue Bao Yi Xue Ban. 45:552–556.
2014.(In Chinese). PubMed/NCBI
|
|
31
|
Georas SN, Cumberland JE, Burke TF, Chen
R, Schindler U and Casolaro V: Stat6 inhibits human interleukin-4
promoter activity in T cells. Blood. 92:4529–4538. 1998.PubMed/NCBI
|
|
32
|
Tsao CH, Shiau MY, Chuang PH, Chang YH and
Hwang J: Interleukin-4 regulates lipid metabolism by inhibiting
adipogenesis and promoting lipolysis. J Lipid Res. 55:385–397.
2014. View Article : Google Scholar : PubMed/NCBI
|
|
33
|
Shin KK, Kim YS, Kim JY, Bae YC and Jung
JS: miR-137 controls proliferation and differentiation of human
adipose tissue stromal cells. Cell Physiol Biochem. 33:758–768.
2014. View Article : Google Scholar : PubMed/NCBI
|
|
34
|
Huang S, Wang S, Bian C, Yang Z, Zhou H,
Zeng Y, Li H, Han Q and Zhao RC: Upregulation of miR-22 promotes
osteogenic differentiation and inhibits adipogenic differentiation
of human adipose tissue-derived mesenchymal stem cells by
repressing HDAC6 protein expression. Stem Cells Dev. 21:2531–2540.
2012. View Article : Google Scholar : PubMed/NCBI
|
|
35
|
Yang Z, Bian C, Zhou H, Huang S, Wang S,
Liao L and Zhao RC: MicroRNA hsa-miR-138 inhibits adipogenic
differentiation of human adipose tissue-derived mesenchymal stem
cells through adenovirus EID-1. Stem Cells Dev. 20:259–267. 2011.
View Article : Google Scholar : PubMed/NCBI
|
|
36
|
Kim YJ, Hwang SJ, Yong CB and Jin SJ:
MiR-21 regulates adipogenic differentiation through the modulation
of TGF-β signaling in mesenchymal stem cells derived from human
adipose tissue. Stem Cells. 27:3093–3102. 2009.PubMed/NCBI
|
|
37
|
Lee EK, Mi JL, Abdelmohsen K, Kim W, Kim
MM, Srikantan S, Martindale JL, Hutchison ER, Kim HH, Marasa BS, et
al: miR-130 suppresses adipogenesis by inhibiting peroxisome
proliferator-activated receptor gamma expression. Mol Cell Biol.
31:626–638. 2011. View Article : Google Scholar : PubMed/NCBI
|
|
38
|
Guo Q, Chen Y, Guo L, Jiang T and Lin Z:
miR-23a/b regulates the balance between osteoblast and adipocyte
differentiation in bone marrow mesenchymal stem cells. Bone Res.
4:160222016. View Article : Google Scholar : PubMed/NCBI
|
|
39
|
Kang JM, Han M, Park IS, Jung Y and Kim SH
and Kim SH: Adhesion and differentiation of adipose-derived stem
cells on a substrate with immobilized fibroblast growth factor.
Acta Biomater. 8:1759–1767. 2012. View Article : Google Scholar : PubMed/NCBI
|
|
40
|
Young DA, Yu SC, Engler AJ and Christman
KL: Stimulation of adipogenesis of adult adipose-derived stem cells
using substrates that mimic the stiffness of adipose tissue.
Biomaterials. 34:8581–8588. 2013. View Article : Google Scholar : PubMed/NCBI
|
|
41
|
Bae YH, Mui KL, Hsu BY, Liu SL, Cretu A,
Razinia Z, Xu T, Puré E and Assoian RK: A FAK-Cas-Rac-lamellipodin
signaling module transduces extracellular matrix stiffness into
mechanosensitive cell cycling. Sci Signal. 7:ra572014. View Article : Google Scholar : PubMed/NCBI
|
|
42
|
Hyväri L, Ojansivu M, Juntunen M,
Kartasalo K, Miettinen S and Vanhatupa S: Focal adhesion kinase and
ROCK signaling are switch-like regulators of human adipose stem
cell differentiation towards osteogenic and adipogenic lineages.
Stem Cells Int. 2018:21906572018. View Article : Google Scholar : PubMed/NCBI
|
|
43
|
Le TN, Oscar C, Mouw JK, Sharmila C,
Hector M, Angel M, Jillian R, Keely PJ, Weaver VM and Lindsay H:
Loss of miR-203 regulates cell shape and matrix adhesion through
ROBO1/Rac/FAK in response to stiffness. J Cell Biol. 212:707–719.
2016. View Article : Google Scholar : PubMed/NCBI
|
|
44
|
Xu LL, Shi CM, Xu GF, Chen L, Zhu LL, Zhu
L, Guo XR, Xu MY and Ji CB: TNF-α, IL-6, and leptin increase the
expression of miR-378, an adipogenesis-related microRNA in human
adipocytes. Cell Biochem Biophys. 70:771–776. 2014. View Article : Google Scholar : PubMed/NCBI
|
|
45
|
Huang N, Wang J, Xie W, Lyu Q, Wu J, He J,
Qiu W, Xu N and Zhang Y: MiR-378a-3p enhances adipogenesis by
targeting mitogen-activated protein kinase 1. Biochem Biophys Res
Commun. 457:37–42. 2015. View Article : Google Scholar : PubMed/NCBI
|
|
46
|
Liu SY, Zhang YY, Gao Y, Zhang LJ, Chen
HY, Zhou Q, Chai ML, Li QY, Jiang H, Yuan B, et al: MiR-378 plays
an important role in the differentiation of bovine preadipocytes.
Cell Physiol Biochem. 36:1552–1562. 2015. View Article : Google Scholar : PubMed/NCBI
|
|
47
|
Gao B, Lin J, Jiang Z, Yang Z, Yu H, Ding
L, Yu M, Cui Q, Dunavin N, Zhang M and Li M: Upregulation of
chemokine CXCL10 enhances chronic pulmonary inflammation in tree
shrew collagen-induced arthritis. Sci Rep. 8:99932018. View Article : Google Scholar : PubMed/NCBI
|
|
48
|
Lu YF, Xu YY, Jin F, Wu Q, Shi JS and Liu
J: Icariin is a PPARα activator inducing lipid metabolic gene
expression in mice. Molecules. 19:181792014. View Article : Google Scholar : PubMed/NCBI
|
|
49
|
Fujii-Yamamoto H, Kim JM, Arai K and Masai
H: Cell cycle and developmental regulations of replication factors
in mouse embryonic stem cells. J Biol Chem. 280:12976–12987. 2005.
View Article : Google Scholar : PubMed/NCBI
|
|
50
|
Jiao X, Katiyar S, Willmarth NE, Liu M, Ma
X, Flomenberg N, Lisanti MP and Pestell RG: c-Jun induces mammary
epithelial cellular invasion and breast cancer stem cell expansion.
J Biol Chem. 285:8218–8226. 2010. View Article : Google Scholar : PubMed/NCBI
|
|
51
|
Irie-Sasaki J, Sasaki T, Matsumoto W,
Opavsky A, Cheng M, Welstead G, Griffiths E, Krawczyk C, Richardson
CD, Aitken K, et al: CD45 is a JAK phosphatase and negatively
regulates cytokine receptor signalling. Nature. 409:349–354. 2001.
View Article : Google Scholar : PubMed/NCBI
|
|
52
|
Kumar V, Cheng P, Condamine T, Mony S,
Languino L, McCaffrey J, Hockstein N, Guarino M, Masters G, Penman
E, et al: CD45 phosphatase inhibits STAT3 transcription factor
activity in myeloid cells and promotes tumor-associated macrophage
differentiation. Immunity. 44:303–315. 2016. View Article : Google Scholar : PubMed/NCBI
|