Introduction
Reverse transcription-quantitative polymerase chain
reaction (RT-qPCR) is a molecular biological method used to measure
the levels of gene expression. RT-qPCR is characterized by high
simplicity, effectiveness, specificity and sensitivity (1,2).
However, the absolute measures derived from RT-qPCR analyses may be
affected by multiple factors, including the initial loading amount
of RNA, the RNA quality and integrity, the efficiency of the
enzymes used in RT-qPCR and the discrepancy in the expression
levels of various RNAs between tissues and cells (3). To obtain reliable measurements, it is
important to use an internal control gene for normalization.
Housekeeping genes are genes involved in fundamental biological
processes and are frequently expressed at constant levels in
various cell types (4,5). Therefore, housekeeping genes are
frequently used as internal controls for the normalization of gene
expression. However, accumulating evidence has demonstrated that
the endogenous expression levels of various housekeeping genes may
be variable under certain physiological and pathological conditions
and, to the best of our knowledge, no housekeeping gene exhibits a
stable expression level under every condition (6–8).
Peripheral nerve injury is a clinical disorder that
affects 13–23 patients per 100,000 per year in developed countries
(9). Following nerve injury,
peripheral nerves undergo multiple regenerative processes including
Wallerian degeneration of the distal nerve stump, the regrowth and
regeneration of axons, and reinnervation (10). Our previous high-throughput study
identified that the expression levels of multiple housekeeping
genes were differentially expressed in injured sciatic nerve
samples and dorsal root ganglion (DRG) samples following rat
sciatic nerve injury, and suitable reference genes for RT-qPCR
normalization were selected (11–13).
In addition to peripheral nerves and neurons, target
skeletal muscles may exhibit denervation and reinnervation
following peripheral nerve injury. The denervation and
reinnervation processes are involved in the preservation of the
biological functions of innervated muscles (14,15).
Gene expression analyses are frequently used to investigate the
denervation and reinnervation processes of target muscles.
Therefore, it is important to identify suitable reference genes in
innervated muscles following nerve injury.
Therefore, in the present study, a rat sciatic nerve
crush model was employed. Subsequently, gastrocnemius muscles were
collected and the cycle quantification (Cq) values of 18S ribosomal
RNA (18S), actin β (ACTB), ankyrin repeat domain 27 (ANKRD27),
cyclophilin A (CYPA), GAPDH, hypoxanthine phosphoribosyltransferase
1 (HPRT1), mitochondrial ribosomal protein L10 (MRPL10),
phosphoglycerate kinase 1 (PGK1), RPTOR independent companion of
mammalian target of rapamycin complex 2 (RICTOR), TATA-box binding
protein (TBP), ubiquitin C (UBC), UBX domain protein 11 (UBXN11)
and tyrosine 3-monooxygenase/tryptophan 5-monooxygenase activation
protein ζ (YWHAZ) were measured. The expression level of HPRT1
exhibited the highest stability among the housekeeping genes
analyzed in the present study, whereas PGK1 exhibited the highest
variability.
Materials and methods
Animal surgery
A total of 30 female Sprague-Dawley rats (age, 2
months; weight, 180–220 g) were purchased from The Experimental
Animal Center of Nantong University (Nantong, China) and subjected
to sciatic nerve crush injury as previously described (11). Rats were anaesthetized by injecting
2 ml/kg Equithesin (Sigma-Aldrich; Merck KGaA, Darmstadt, Germany),
as previously described (12),
corresponding to 17 mg/kg sodium pentobarbital, 42 mg/kg magnesium
sulfate and 85 mg/kg trichloroacetaldehyde monohydrate) (11,16).
Anesthesia was assessed by loss of pedal reflexes. Rat left sciatic
nerves were crushed with forceps for 10 sec, three times. To
minimize the discomfort and possible painful mechanical
stimulation, the rats were housed in large cages with sawdust
bedding post-surgery and maintained in a controlled environment
under constant temperature of 25°C and relative humidity of 40–70%,
with a 12 h light/dark cycle and free access to food and water.
Rats were sacrificed 24 h, 4 days, or 1, 2, 3, 4 or 8 weeks
following surgery. Gastrocnemius muscles from the left (injured)
side and the right (uninjured) side were collected. Control rats
were anesthetized without sciatic nerve crushing (sham surgery).
All animal procedures were ethically approved by The Administration
Committee of Experimental Animals of The Jiangsu Province (Jiangsu,
China).
Compound muscle action potential
(CMAP) recording
CMAP recording was performed at 1, 2, 4 and 8 weeks
following surgery. Following anesthesia, the left sciatic nerves of
the rats were analyzed. The active and reference electrodes were
placed into the medial belly and Achilles tendon of gastrocnemius,
respectively. The stimulating electrode was placed sequentially in
the proximal and distal sciatic nerves. A 2-mA electric stimulus
was applied to the stimulating electrode to stimulate CMAP
responses. CMAP readings at the proximal and distal sides were
recorded using a portable digital MYTO electromyographic machine
(Esaote SpA, Genoa, Italy) with Galileo NT System Software (EB
Neuro SpA, Florence, Italy).
Muscle weight measurement
Gastrocnemius muscles on the left (injured) side and
the right (uninjured) side were collected and weighed in healthy
control rats and nerve-injured rats at 24 h, 4 days, or 1, 2, 3, 4
or 8 weeks following nerve crush injury. The wet weight of the
muscle on the left side was divided by the wet weight of the muscle
on the right side to calculate the ratio of injured to uninjured
muscle wet weight.
Immunohistochemistry staining and
Masson's trichrome staining
Left-side gastrocnemius muscles were collected and
fixed in 4% paraformaldehyde for 12 h at 4°C, embedded in
Tissue-Tek® optimal cutting temperature compound (Sakura
Finetek USA, Inc., Torrance, CA, USA), and cut into 25-µm thick
longitudinal sections using a cryostat microtome at −15°C (Leica
Microsystems GmbH, Wetzlar, Germany). Sections were washed with
PBS, blocked with normal goat serum (Invitrogen; Thermo Fisher
Scientific, Inc., Waltham, MA, USA) for 1 h at 37°C and incubated
with anti-neurofilament H (NEFH) antibody (1:200; cat. no.
SAB4200747; Sigma-Aldrich; Merck KGaA) overnight at 4°C. Tissue
sections were washed, incubated with secondary antibodies
conjugated with Alexa Fluor 488 (1:400; cat. no. ab150113; Abcam,
Cambridge, MA, USA) and tetramethylrhodamine-labeled α-Bungarotoxin
(1:300; cat. no. 203980; Sigma-Aldrich; Merck KGaA) for 2 h at room
temperature and observed under a fluorescence microscope at ×100
magnification (Axio Imager M2; Carl Zeiss AG, Oberkochen,
Germany).
In addition, after fixation in 4% paraformaldehyde
for 12 h at 4°C, gastrocnemius muscles were embedded in paraffin
and cut into transverse sections (6-µm thick). Tissue sections were
subjected to Masson's trichrome staining at room temperature for
about 1 h, to stain muscle fibers in red, collagen fibers in blue
and cell nuclei in black, and observed using light microscopy at
×200 magnification (Axio Imager M2; Carl Zeiss AG, Oberkochen,
Germany). Fiber cross-sectional area (CSA) was calculated using
Leica QWin version 3 Image Analysis System Software (Leica
Microsystems GmbH).
RT-qPCR
Total RNA was isolated from left-side gastrocnemius
muscles using TRIzol® Reagent (Thermo Fisher Scientific,
Inc.), purified with RNeasy spin columns (Qiagen, Inc., Valencia,
CA, USA) to remove DNA and reverse transcribed to cDNA with the
PrimeScript reagent kit, 37°C for 15 min and 85°C for 5 sec,
according to the manufacturer's protocol (Takara Biotechnology Co.,
Ltd., Dalian, China). RT-qPCR was performed using the QuantiNova
SYBR Green PCR kit (Qiagen, Inc.) and the StepOne™ real-time PCR
System (Applied Biosystems; Thermo Fisher Scientific, Inc.). An
initial denaturation of 10 min at 95°C was followed by 40 cycles of
95°C for 15 sec and 60°C for 30 sec. The Cq values for the
candidate reference genes 18S, ACTB, ANKRD27, CYPA, GAPDH, HPRT1,
MRPL10, PGK1, RICTOR, TBP, UBC, UBXN11 and YWHAZ were determined
for subsequent geNorm and NormFinder analyses. The Cq values for
the target genes F-box protein 32 (FBXO32) and tripartite motif
containing 63 (TRIM63) were additionally assessed and the
expression levels of FBXO32 and TRIM63 were calculated using the
2−ΔΔCq method (17).
The quality of the RT-qPCR analysis was confirmed by a single
melt-curve peak, representing a single amplification product.
Primer sequences (listed in Table
I) were obtained from previous publications (18–23)
or designed using Primer Express® software (v3.0.1;
Thermo Fisher Scientific, Inc.).
 | Table I.Primer sequences of candidate
housekeeping reference genes and target genes. |
Table I.
Primer sequences of candidate
housekeeping reference genes and target genes.
| A, Reference
genes |
|---|
|
|---|
| Author, year | Gene symbol | NCBI transcript
accession number | Primer sequences
(5′-3′) | Amplicon length,
nucleotides | (Refs.) |
|---|
| Martínez-Martos,
et al, 2018 | 18S | X01117.1 | Fw:
ACTCAACACGGGAAACCTCA | 114 | (16) |
|
|
|
| Rv:
AATCGCTCCACCAACTAAGA |
|
|
| Bangaru et
al, 2012 | ACTB | NM_031144.2 | Fw:
TGTCACCAACTGGGACGATA | 165 | (18) |
|
|
|
| Rv:
GGGGTGTTGAAGGTCTCAAA |
|
|
| Bonefeld et
al, 2008 | ANKRD27 | NM_001271264.1 | Fw:
CCCAGGATCCGAGAGGTGCTGTC | 95 | (19) |
|
|
|
| Rv:
CAGAGCCATATGGACTTCAGGGGG |
|
|
| Martínez-Martos,
et al, 2018 | CYPA | NM_017101.1 | Fw:
CCAAACACAAATGGTTCCCAGT | 135 | (16) |
|
|
|
|
ATTCCTGGACCCAAAACGCT |
|
|
| Bonefeld et
al, 2008 | GAPDH | NM_017008.4 | Fw:
CCACCAACTGCTTAGCCCCC | 91 | (19) |
|
|
|
| Rv:
GCAGTGATGGCATGGACTGTGG |
|
|
| Gambarotta et
al, 2014 | HPRT1 | NM_012583.2 | Fw:
CTCATGGACTGATTATGGACAGGAC | 123 | (20) |
|
|
|
| Rv:
GCAGGTCAGCAAAGAACTTATAGCC |
|
|
| Bonefeld et
al, 2008 | MRPL10 | NM_001109620.1 | Fw:
CTCCTCCCAAGCCCCCCAAG | 97 | (19) |
|
|
|
| Rv:
CAGACAGCTATCATTCGGTTGTCCC |
|
|
| Peinnequin et
al, 2004 | PGK1 | NM_053291.3 | Fw:
GCAGATTGTTTGGAACGGTCC | 113 | (21) |
|
|
|
| Rv:
TAGTGATGCAGCCCCTAGACGT |
|
|
|
| RICTOR | XM_001055633.3 | Fw:
TCCGAATACGAGGGCGGAA | 142 | a |
|
|
|
| Rv:
AGATGGCCCAGCTTTCTCATA |
|
|
| Peinnequin et
al, 2004 | TBP | NM_001004198.1 | Fw:
TAATCCCAAGCGGTTTGCTG | 111 | (21) |
|
|
|
| Rv:
TTCTTCACTCTTGGCTCCTGTG |
|
|
| Bonefeld et
al, 2008 | UBC | NM_017314.1 | Fw:
TCGTACCTTTCTCACCACAGTATCTAG | 82 | (19) |
|
|
|
| Rv:
GAAAACTAAGACACCTCCCCATCA |
|
|
| Bonefeld et
al, 2008 | UBXN11 | NM_138853.2 | Fw:
GCGAGACTGGATGAAGGCCAAG | 120 | (19) |
|
|
|
| Rv:
CCCTCCACCACCAGCTCACTC |
|
|
| Bangaru et
al, 2012 | YWHAZ | NM_013011.3 | Fw:
TTGAGCAGAAGACGGAAGGT | 136 | (18) |
|
|
|
| Rv:
GAAGCATTGGGGATCAAGAA |
|
|
|
| B, Target
genes |
|
| Autdor,
year | Gene
symbol | NCBI transcript
accession number | Primer sequences
(5′-3′) | Amplicon length,
nucleotides | (Refs.) |
|
| Martínez-Beamonte
et al, 2011 | FBXO32 | NM_133521.1 | Fw:
CCATCAGGAGAAGTGGATCTATGTT | 75 | (22) |
|
|
|
| Rv:
GCTTCCCCCAAAGTGCAGTA |
|
|
| Martínez-Beamonte
et al, 2011 | TRIM63 | NM_080903.1 | Fw:
GTGAAGTTGCCCCCTTACAA | 66 | (22) |
|
|
|
| Rv:
TGGAGATGCAATTGCTCAGT |
|
|
PCR amplification efficiency
analysis
The amplification efficiency analysis was performed
by producing serial dilutions of the DNA sample. Subsequently, the
Cq values were plotted on a logarithmic scale along with
corresponding concentrations. Using a linear regression curve
through, the slope of the trend line was calculated. Finally,
efficiency was defined using the equation:
E=−1+10(−1/slope). Typically, desired amplification
efficiencies range from 90 to 110% (https://biosistemika.com/blog/qpcr-efficiency-over-100/).
geNorm and NormFinder analysis
Cq values for candidate reference genes were
subjected to geNorm analysis (v3.4; http://genorm.cmgg.be/), a Visual Basic for plug-in
for Microsoft Excel 2007 (Microsoft Corporation, Redmond, WA, USA),
that was used to calculate the stability of the expression levels
of the reference genes. Gene expression stability (M value) was
determined on the basis of non-normalized expression levels of
internal reference genes according to a previous study (6). The normalization factor (pairwise
variation value, Vn/n+1) was calculated based on the geometric mean
of multiple reference genes (6).
The stability values of candidate reference genes were also
measured using the NormFinder analysis (v19, http://moma.dk/normfinder-software), a model-based
variance estimation approach of Microsoft Excel (Microsoft
Corporation), according to a previous study (3).
Statistical analysis
Data are presented as the mean ± standard deviation.
Each independent experiment was repeated three times. Statistical
analysis was performed using GraphPad Prism 6.0 (GraphPad Software,
Inc., La Jolla, CA, USA). The linear association between two
variables was assessed by calculating the correlation coefficient
R2, ranging from 0 to 1. Differences between rats in the
injury and normal control groups were tested using one-way analysis
of variance followed by Dunnett's multiple comparisons test.
P<0.05 was considered to indicate a statistically significant
difference.
Results
Gastrocnemius muscles exhibit
denervation and reinnervation following sciatic nerve crush
injury
To investigate muscle denervation and reinnervation,
morphological and physiological parameters of gastrocnemius muscles
were examined in normal control rats and in rats subjected to
sciatic nerve injury. Staining of the axon marker NEFH and the
motor end-plate marker α-Bungarotoxin (Fig. 1A) were detected, and the structure
of muscle fibers (Fig. 1B)
appeared to be intact. Furthermore, normal CMAP amplitude (Fig. 1C) was observed in the gastrocnemius
muscles of uninjured rats. At 1 week following sciatic nerve
injury, degenerated axon fragments were not present, and axons were
not detectable between muscle fibers (Fig. 1D), muscle fibers were atrophied
(Fig. 1E) and CMAP was not be
detected (Fig. 1F). At 2 weeks
following sciatic nerve injury, a small number of regenerated axons
were observed, and a subset of axons initiated reinnervation
(Fig. 1G). Masson's trichrome
staining results suggested the presence of muscle atrophy and a
large number of hyperplastic collagen fibers were observed
(Fig. 1H). Low CMAP amplitude was
recorded (Fig. 1I) at 2 weeks
following injury. Multiple regenerated axons and reinnervated
fibers were observed at 4 weeks following nerve injury (Fig. 1J). Additionally, muscle atrophy
(Fig. 1K) and CMAP (Fig. 1L) were partially recovered. At 8
weeks following sciatic nerve injury, the number of regenerated
axons and reinnervated fibers increased (Fig. 1M), the morphology of muscles
(Fig. 1N) and the CMAP profile
(Fig. 1O) were similar to the
control rats (Fig. 1A-C).
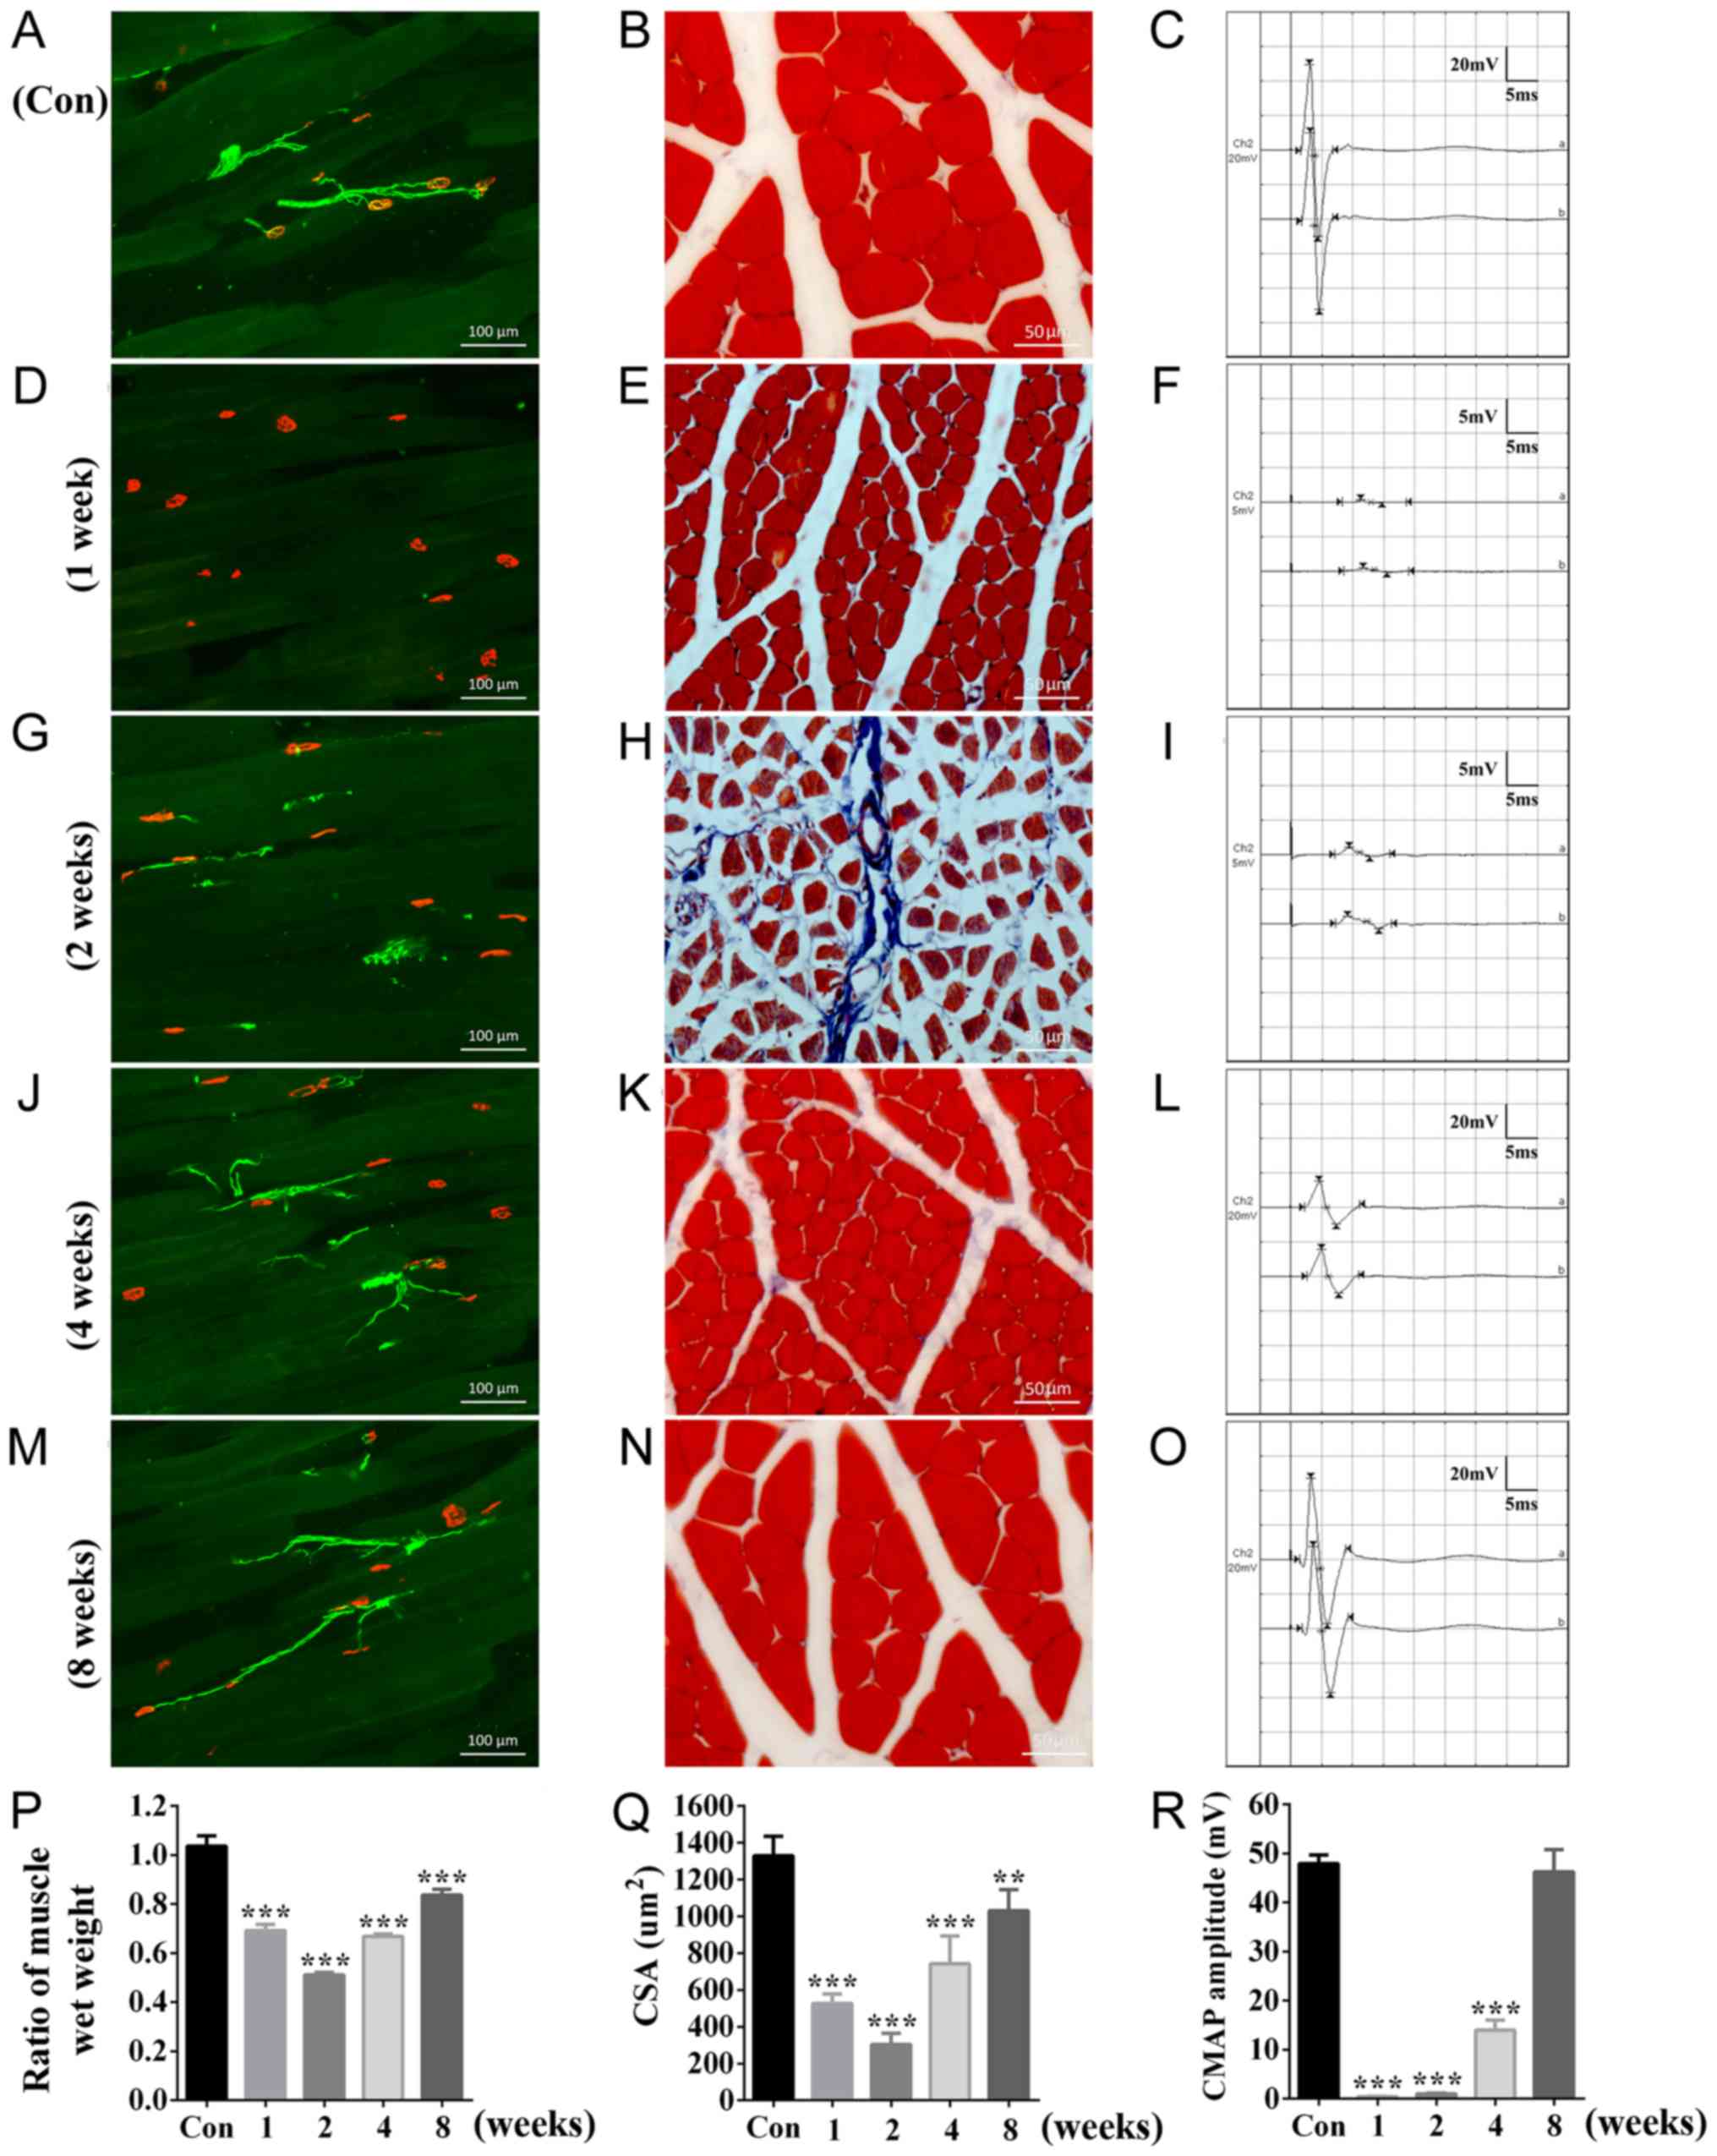 | Figure 1.Morphological and
electrophysiological alterations in rat gastrocnemius muscles
following sciatic nerve crush injury. Gastrocnemius muscles of
control rats were analyzed using (A) immunohistochemistry, (B)
Masson's trichrome staining and (C) CMAP recording. Gastrocnemius
muscles at 1 week following sciatic nerve injury were analyzed
using (D) immunohistochemistry, (E) Masson's trichrome staining and
(F) CMAP recording. Gastrocnemius muscles at 2 weeks following
sciatic nerve injury were analyzed using (G) immunohistochemistry,
(H) Masson's trichrome staining and (I) CMAP recording.
Gastrocnemius muscles at 4 week following sciatic nerve injury were
analyzed using (J) immunohistochemistry, (K) Masson's trichrome
staining and (L) CMAP recording. Gastrocnemius muscles at 8 weeks
following sciatic nerve injury were analyzed using (M)
immunohistochemistry, (N) Masson's trichrome staining and (O) CMAP
recording. Immunohistochemistry was performed using
anti-neurofilament H (green) and α-Bungarotoxin (red); scale bars,
100 µm. Tissue sections were subjected to Masson's trichrome
staining to stain muscle fibers in red, collagen fibers in blue and
cell nuclei in black; scale bar, 50 µm. (P) Ratio of injured to
uninjured muscle wet weight (n=4 in each group) measured in various
groups. (Q) CSA (n=4 in each group) in various groups. (R) CMAP
amplitude (n=4 in each group) in various groups. **P<0.01 and
***P<0.001 vs. corresponding control. CMAP, compound muscle
action potential; CSA, cross-sectional area; Con, control. |
Additionally, the ratio of injured to uninjured
muscle wet weight decreased significantly following nerve injury at
week 1 and 2, and improved at 4 and 8 weeks (Fig. 1P). CSA exhibited a similar trend
(Fig. 1Q), suggesting that the
gastrocnemius muscles underwent muscle atrophy following nerve
injury. Quantification of the CMAP results suggested that the
decreased CMAP amplitude detected at 2 weeks was increased at 4
weeks following nerve injury and was restored to normal levels at 8
weeks following injury (Fig. 1R).
Collectively, the present data suggested that the physiological
functions of muscles were gradually restored during the process of
reinnervation of target muscles.
Cq values of reference genes in
gastrocnemius muscles following sciatic nerve crush injury
Prior to the determination of the Cq values of the
reference genes, the efficiencies of the primers selected for
RT-qPCR were examined. Following a serial dilution, the
amplifications of the 13 candidate housekeeping genes exhibited
linear standard curves with slope values of ~-3.322 and a linear
correlation coefficient (R2) of ~1 (Table II). The amplification efficiencies
of the primer pairs of all housekeeping genes were calculated based
on the slope of the linear standard curves. The amplification
efficiencies of all primer pairs were between 90 and 102% (Table II).
| Table II.Amplification efficiencies of
candidate housekeeping genes and target genes. |
Table II.
Amplification efficiencies of
candidate housekeeping genes and target genes.
| A, Reference
genes |
|---|
|
|---|
| Gene symbol | Slope | R2 | Efficiency (%) |
|---|
| 18S | −3.523 | 0.9994 | 92 |
| ACTB | −3.277 | 0.9921 | 102 |
| ANKRD27 | −3.567 | 0.9976 | 91 |
| CYPA | −3.460 | 0.9974 | 95 |
| GAPDH | −3.489 | 0.9998 | 93 |
| HPRT1 | −3.505 | 0.9996 | 93 |
| MRPL10 | −3.518 | 0.9920 | 92 |
| PGK1 | −3.490 | 0.9983 | 93 |
| RICTOR | −3.507 | 0.9963 | 93 |
| TBP | −3.558 | 0.9921 | 91 |
| UBC | −3.433 | 0.9989 | 96 |
| UBXN11 | −3.373 | 0.9994 | 98 |
| YWHAZ | −3.307 | 0.9975 | 101 |
|
| B, Target
genes |
|
| Gene
symbol | Slope |
R2 | Efficiency
(%) |
|
| FBXO32 | −3.463 | 0.9977 | 94 |
| TRIM63 | −3.450 | 0.9999 | 95 |
Subsequently, RT-qPCR experiments were performed to
measure the raw Cq values of the reference genes. 18S exhibited the
lowest Cq value, indicating that the abundance of 18S ribosomal RNA
gene was the highest in rat gastrocnemius muscles. The Cq values of
GAPDH, a gene encoding an enzyme involved in glycolysis, were
decreased compared with other genes. The Cq values of UBXN11 were
increased compared with other housekeeping genes, suggesting that
its endogenous expression level was the lowest. The Cq values of
the other housekeeping genes ranged between 20 and 30 (Fig. 2). In addition, the Cq values of the
housekeeping genes in gastrocnemius muscles were assessed at
various time points following sciatic nerve injury. The Cq values
of ANKRD27, HPRT1, MRPL10, RICTOR and TBP exhibited a stable level
in normal control rats and nerve-injured rats at various time
points. By contrast, the Cq values of 18S, ACTB, CYPA, GAPDH, PGK1,
UBC, UBXN11 and YWHAZ exhibited variability among time points
(Fig. 2).
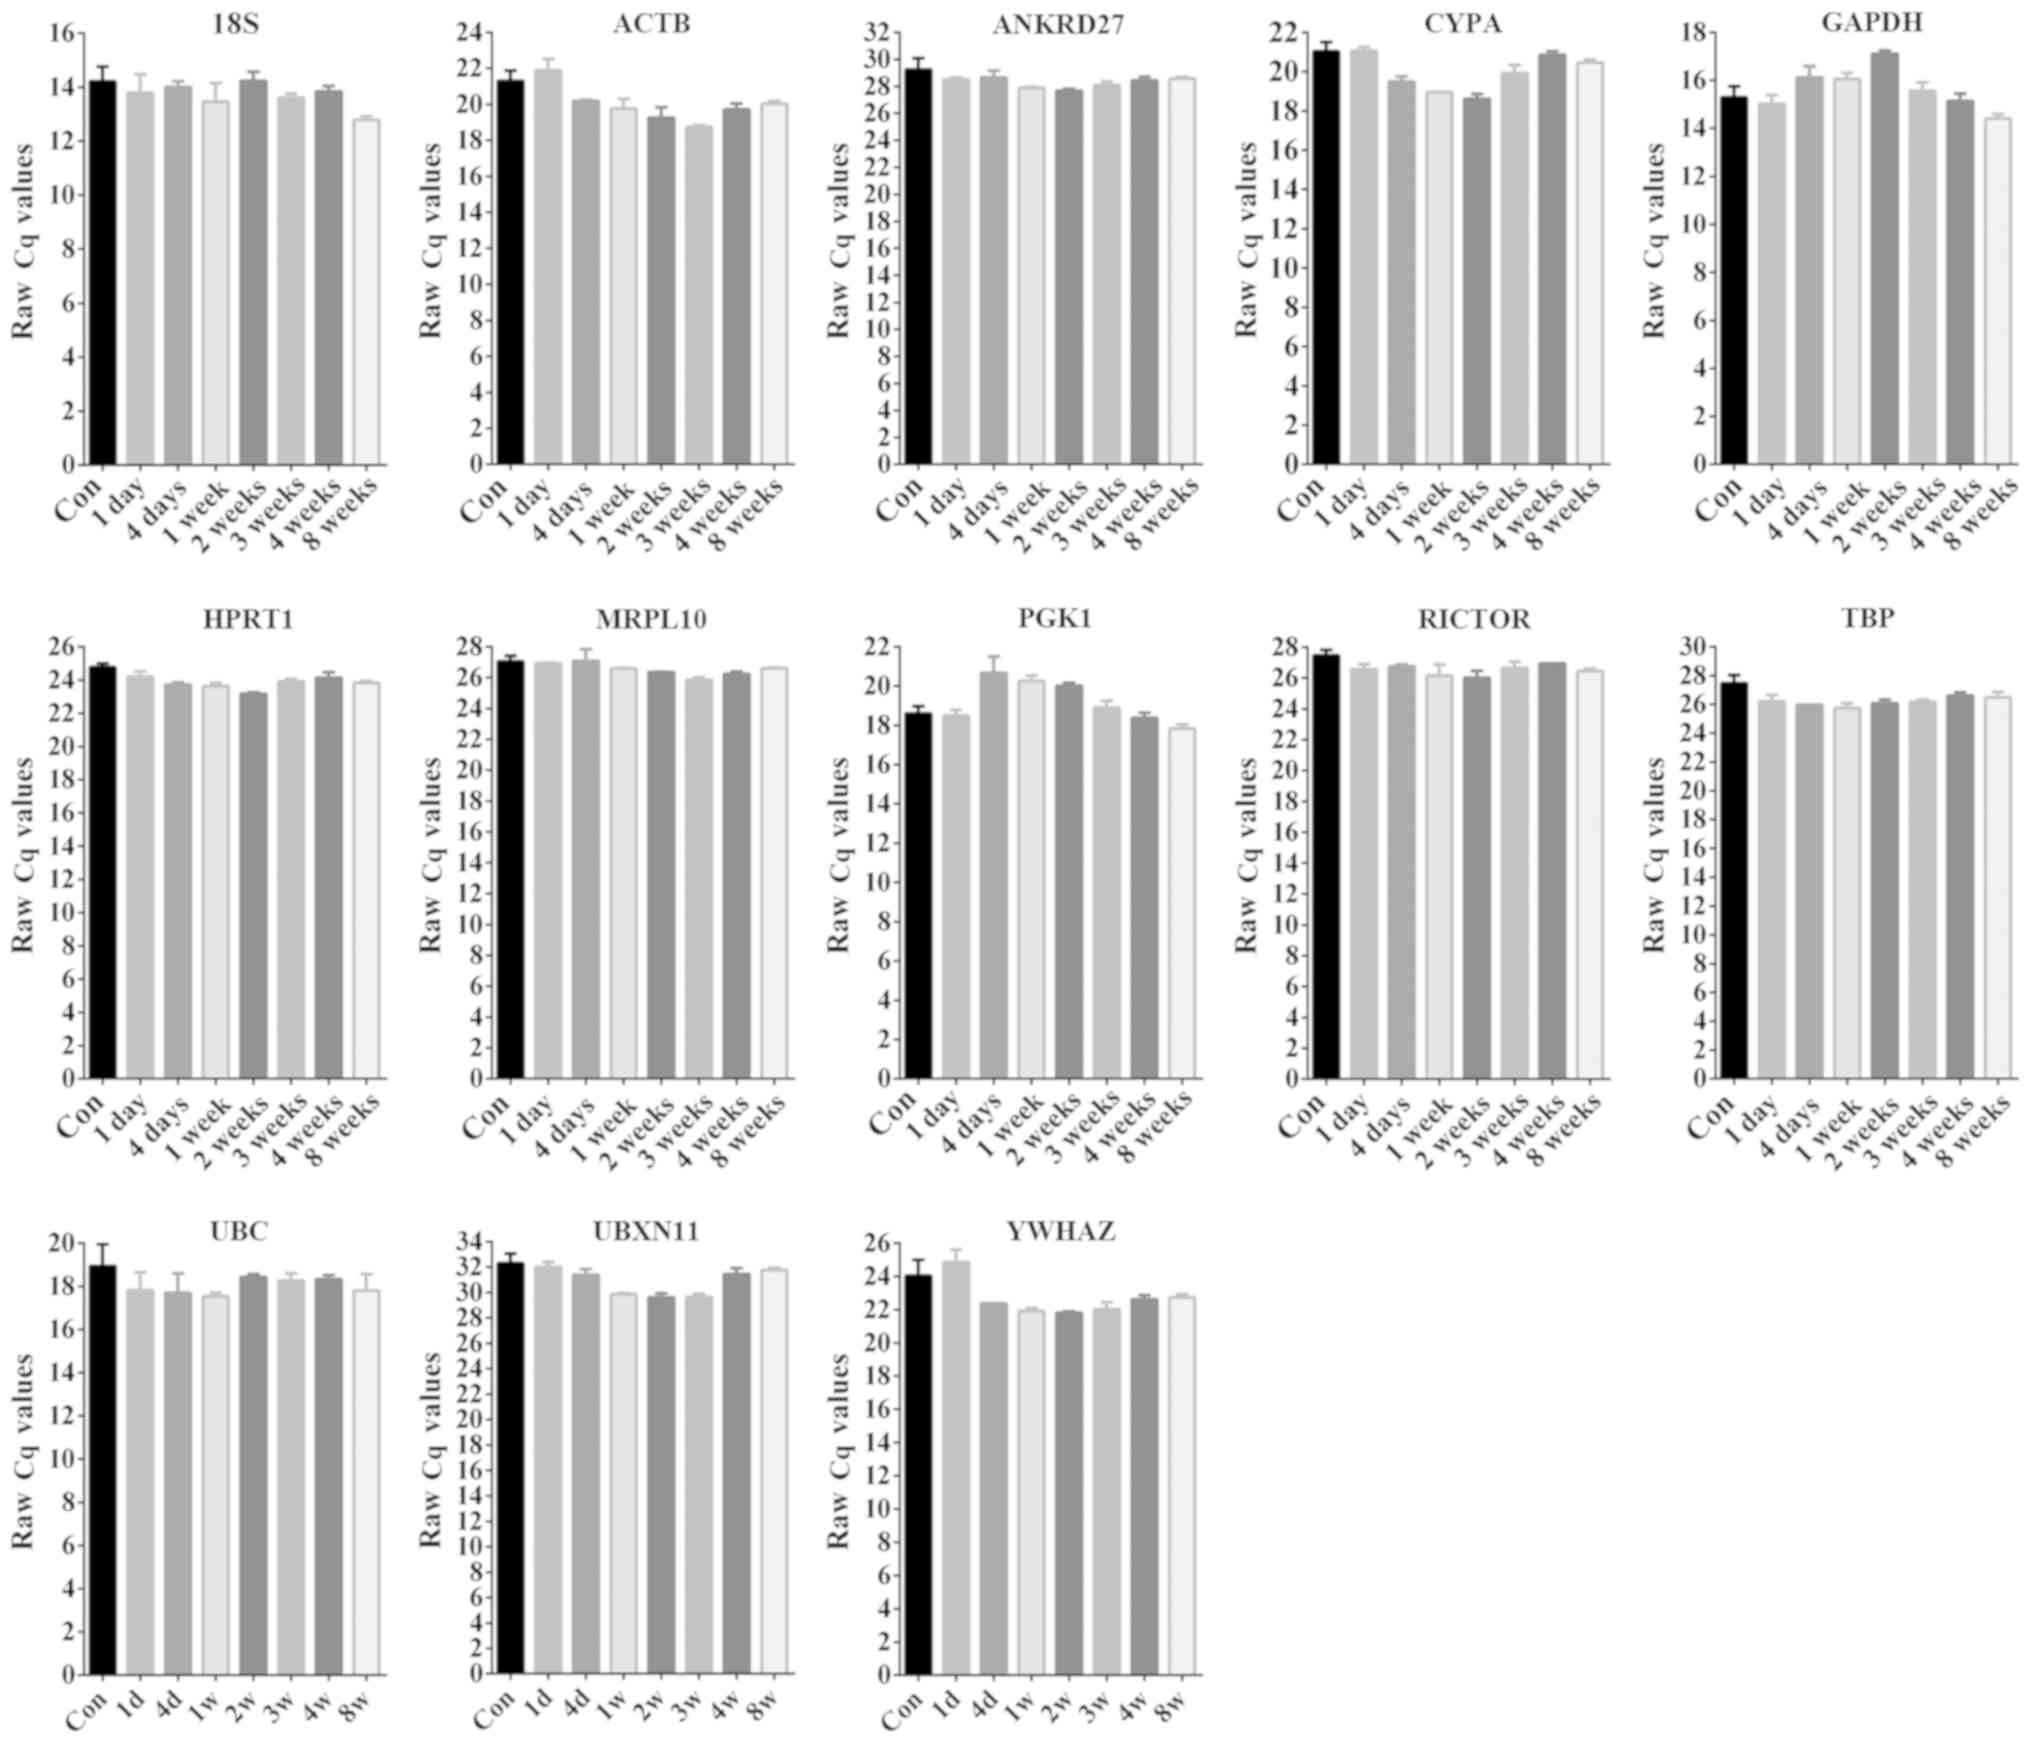 | Figure 2.Raw Cq values of candidate reference
genes in gastrocnemius muscles. The Cq values of 18S, ACTB,
ANKRD27, CYPA, GAPDH, HPRT1, MRPL10, PGK1, RICTOR, TBP, UBC, UBXN11
and YWHAZ in normal control rats and rats subjected to sciatic
nerve injury 1, 2, 4 or 8 weeks following injury were assessed by
reverse transcription-quantitative polymerase chain reaction (n=3
in each group). 18S, 18S ribosomal RNA; ANKRD27, ankyrin repeat
domain 27; CYPA, cyclophilin A; HPRT1, hypoxanthine
phosphoribosyltransferase 1; MRPL10, mitochondrial ribosomal
protein L10; PGK1, phosphoglycerate kinase 1; RICTOR, RPTOR
independent companion of mammalian target of rapamycin complex 2;
TBP, TATA-box binding protein; UBC, ubiquitin C; UBXN11, UBX domain
protein 11; YWHAZ, tyrosine 3-monooxygenase/tryptophan
5-monooxygenase activation protein ζ; ACTB, actin β. |
Reference gene HPRT1 exhibits high
stability
The stabilities of the gene expression levels of the
candidate reference genes were examined using geNorm analysis.
Average expression stability was calculated and M values were
assigned to each reference gene. The M value calculated for each
gene was inversely proportional to the stability of the expression
level of the corresponding gene. Our previous study identified that
all reference genes examined exhibited M<1.5, corresponding to
the default limit (6). The
reference genes ANKRD27 and HPRT1 exhibited decreased M values
compared with the other reference genes, suggesting that the
expression levels of these two reference genes were the most stable
(Fig. 3A). PGK1 presented the
highest M value, corresponding to the lowest stability (Fig. 3A). The normalization factor
(pairwise variation value, Vn/n+1) was calculated to
assess the optimal numbers of reference genes to use for gene
expression normalization. The pairwise variation value
V2/3 calculated was 0.103, below the default limit of
Vn/n+1=0.15 (24),
suggesting that the two reference genes ANKRD27 and HPRT1 were
sufficient to normalize gene expression levels in rat gastrocnemius
muscles (Fig. 3B).
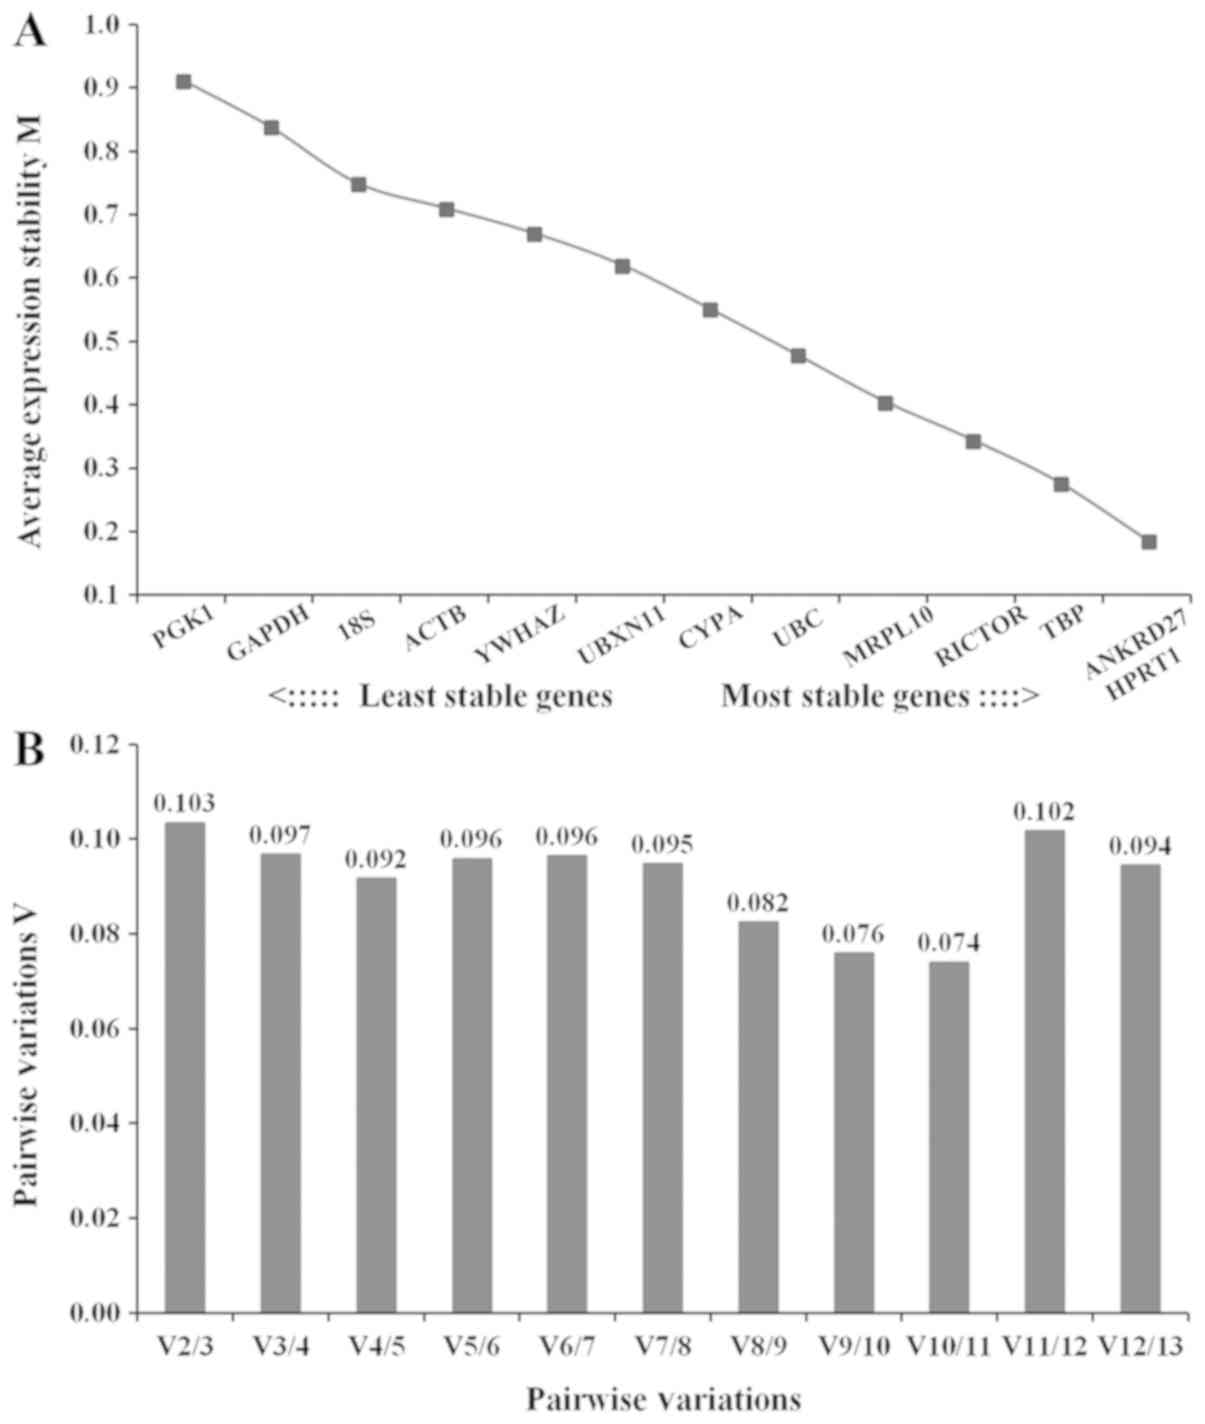 | Figure 3.Analysis of candidate reference genes
using geNorm. (A) Average expression stability of 18S, ACTB,
ANKRD27, CYPA, GAPDH, HPRT1, MRPL10, PGK1, RICTOR, TBP, UBC, UBXN11
and YWHAZ. M values are inversely proportional to the stability of
the expression levels of the corresponding genes. (B) Normalization
factor (pairwise variation value, Vn/n+1) was calculated to assess
the optimal numbers of reference genes to use for gene expression
normalization. ANKRD27, ankyrin repeat domain 27; CYPA, cyclophilin
A; HPRT1, hypoxanthine phosphoribosyltransferase 1; MRPL10,
mitochondrial ribosomal protein L10; PGK1, phosphoglycerate kinase
1; RICTOR, RPTOR independent companion of mammalian target of
rapamycin complex 2; TBP, TATA-box binding protein; UBC, ubiquitin
C; UBXN11, UBX domain protein 11; YWHAZ, tyrosine
3-monooxygenase/tryptophan 5-monooxygenase activation protein ζ;
ACTB, actin β. |
The stabilities of the expression levels of the
reference genes were further analyzed and ranked using NormFinder.
Low stability values were associated with stable expression levels.
NormFinder analysis suggested that HPRT1 was the reference gene
with the most stable expression level, followed by ANKRD27. The
expression level of PGK1 exhibited the lowest stability among the
genes examined (Fig. 4). The
NormFinder results were consistent with the geNorm results.
Collectively, the present results suggested that, in rat
gastrocnemius muscles following sciatic nerve injury, the
expression levels of HPRT1 and PGK1 exhibited the highest and the
lowest stability, respectively.
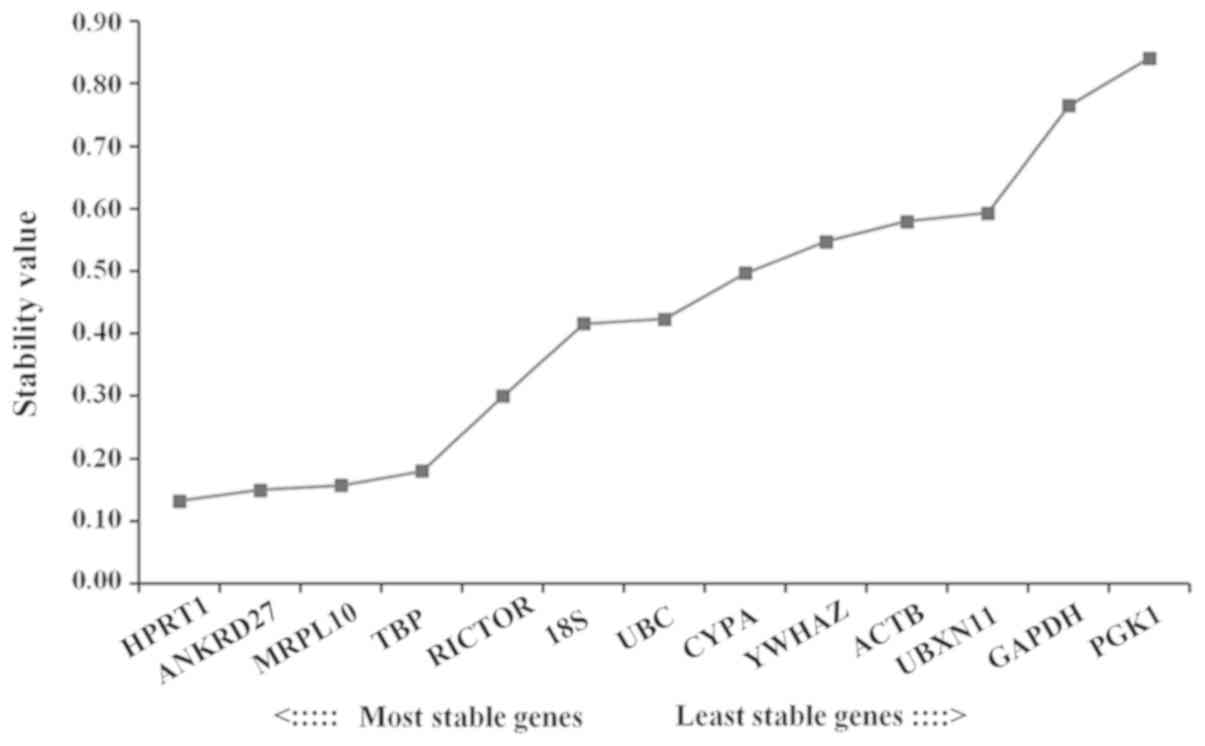 | Figure 4.Analysis of candidate reference genes
using NormFinder. Stability values of 18S, ACTB, ANKRD27, CYPA,
GAPDH, HPRT1, MRPL10, PGK1, RICTOR, TBP, UBC, UBXN11 and YWHAZ.
Stability values are inversely proportional to the stability of the
expression levels of the corresponding genes. 18S, 18S ribosomal
RNA; ANKRD27, ankyrin repeat domain 27; CYPA, cyclophilin A; HPRT1,
hypoxanthine phosphoribosyltransferase 1; MRPL10, mitochondrial
ribosomal protein L10; PGK1, phosphoglycerate kinase 1; RICTOR,
RPTOR independent companion of mammalian target of rapamycin
complex 2; TBP, TATA-box binding protein; UBC, ubiquitin C; UBXN11,
UBX domain protein 11; YWHAZ, tyrosine 3-monooxygenase/tryptophan
5-monooxygenase activation protein ζ; ACTB, actin β. |
Determination of gene expression
levels is influenced by normalization genes
The influence of distinct reference genes was
examined by determining the expression levels of FBXO32 and TRIM63,
two genes encoding skeletal muscle atrophy markers (23,25,26).
The primer pairs of FBXO32 and TRIM63 exhibited linear standard
curves with high efficiency values (94 and 95%, respectively;
Table II). HPRT1 and PGK1
exhibited the lowest and the highest stability, respectively.
Therefore, these two genes were used as internal controls to
perform RT-qPCR experiments (Fig.
5).
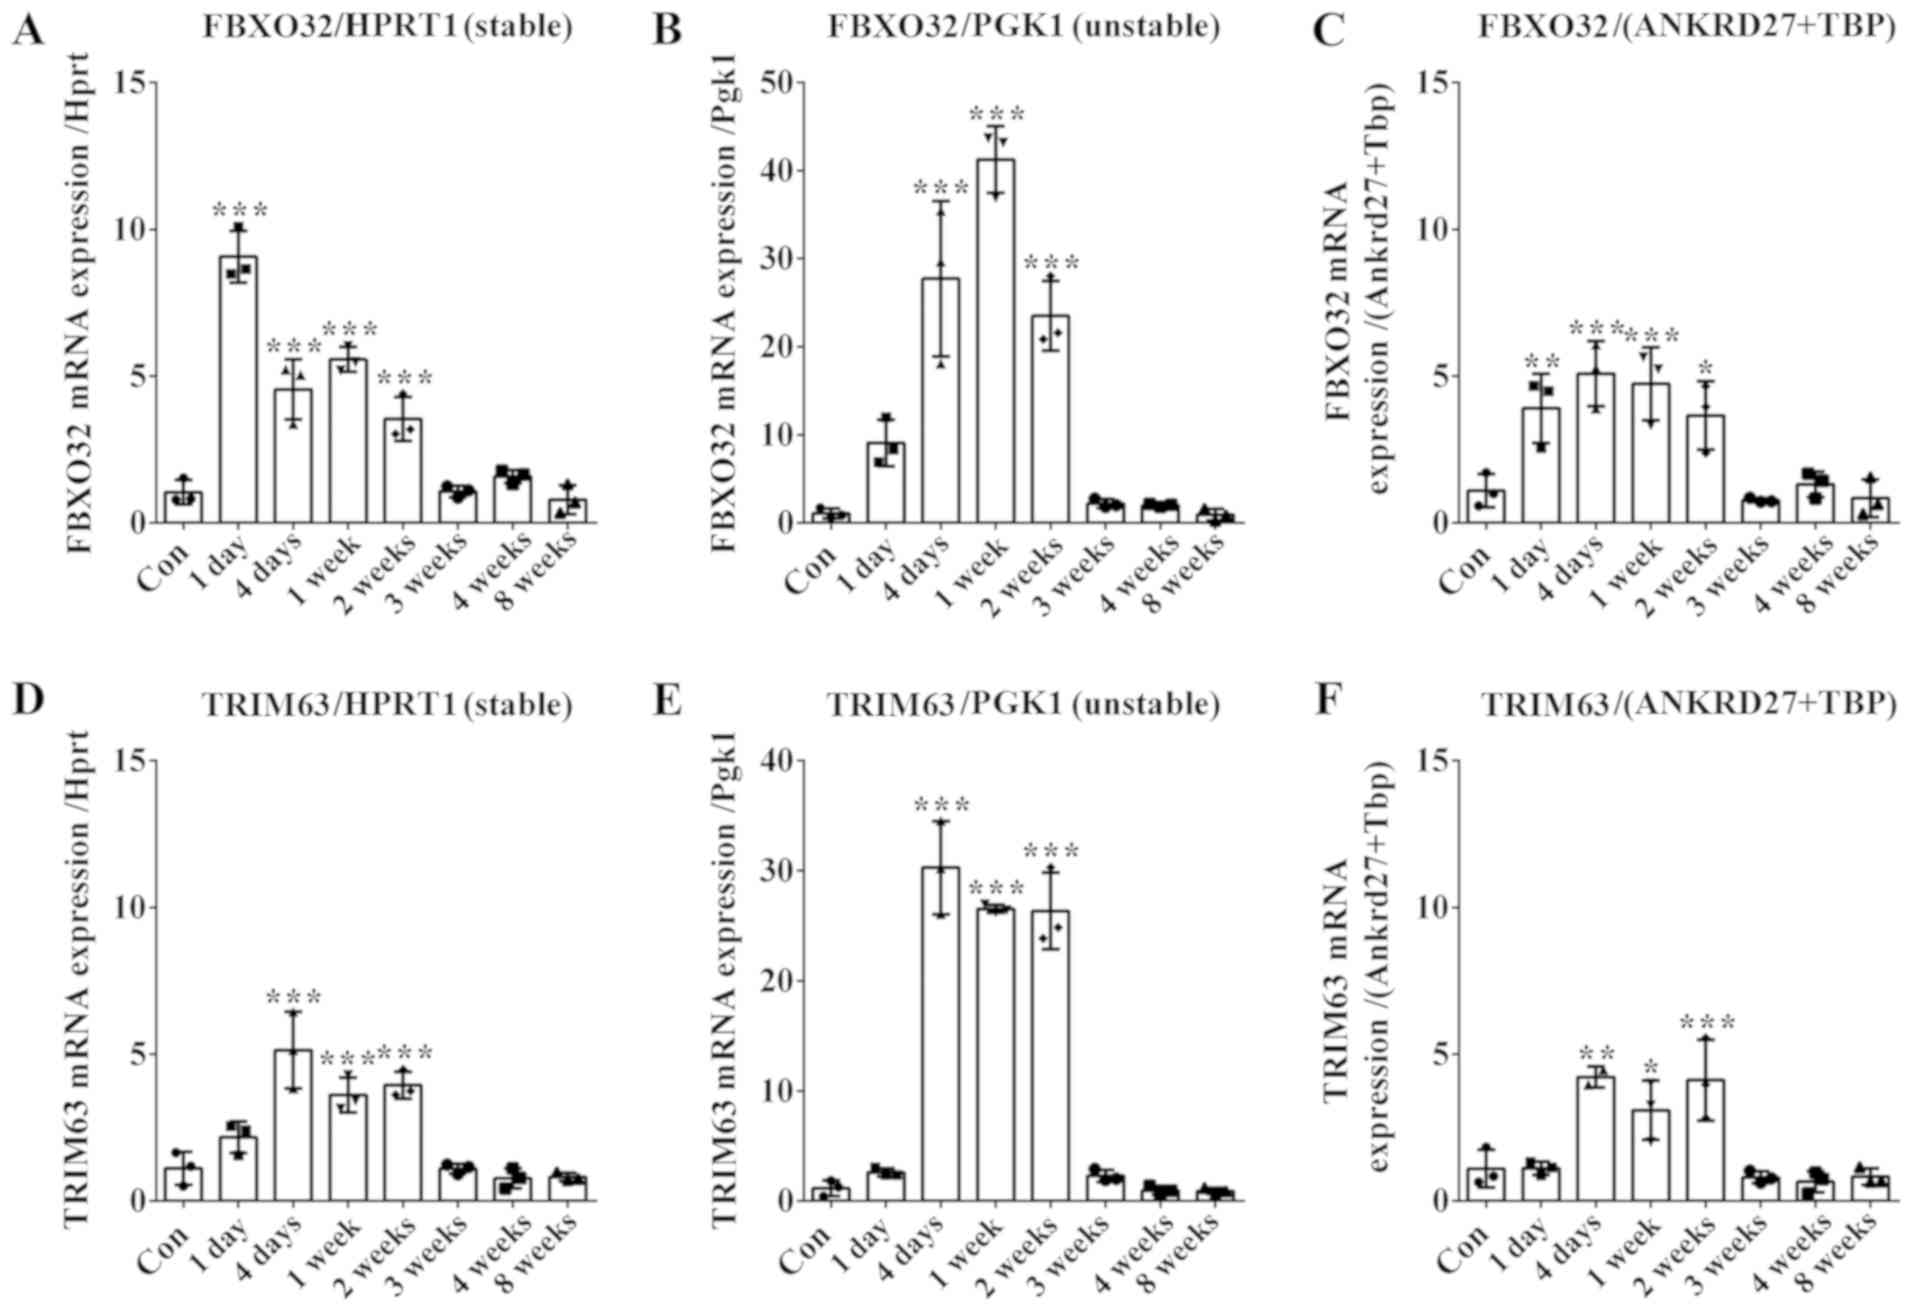 | Figure 5.Determination of mRNA expression
levels of FBXO32 and TRIM63 in gastrocnemius muscles using HPRT1,
PGK1 or ANKRD27+TBP as reference genes. mRNA expression levels of
FBXO32 were compared between normal control rats and rats subjected
to sciatic nerve injury using (A) HPRT1, (B) PGK1 or (C)
ANKRD27+TBP as the reference gene (n=3 in each group). mRNA
expression levels of TRIM63 were compared between normal control
rats and rats subjected to sciatic nerve injury using (D) HPRT1,
(E) PGK1 or (F) ANKRD27+TBP as the reference gene (n=3 in each
group). *P<0.05, **P<0.01 and ***P<0.001 vs. Con. HPRT1,
hypoxanthine phosphoribosyltransferase 1; PGK1, phosphoglycerate
kinase 1; FBXO32, F-box protein 32; TRIM63, tripartite motif
containing 63; ANKRD27, ankyrin repeat domain 27; TBP, TATA-box
binding protein; Con, normal control rats. |
Using HPRT1 as the internal control, the expression
levels of FBXO32 were observed to be significantly upregulated in
rat gastrocnemius muscles following sciatic nerve injury,
exhibiting a maximum at 1 day following injury (Fig. 5A). Similarly, using PGK1 as
internal control, the expression levels of FBXO32 were observed to
be upregulated following nerve injury. However, the highest Cq
value of FBXO32 was detected at 1 week following injury. Notably,
the fold changes of FBXO32 were identified to vary depending on the
reference gene selected (Fig.
5B).
Results from geNorm analysis suggested that two
reference genes were sufficient to normalize gene expression
levels. In addition to HPRT1, ANKRD27 and TBP were identified to
exhibit stable expression levels. Therefore, the geometric mean of
ANKRD27 and TBP was used as an internal control (Fig. 5C and F). Using ANKRD27+TBP or HPRT1
as the internal controls did not affect the detected expression
level of FBXO32, which exhibited similar fold changes at all time
points following peripheral nerve injury (Fig. 5C).
Additionally, TRIM63 exhibited similar expression
patterns at various time points following sciatic nerve injury,
regardless of the reference gene selected (Fig. 5D-F). However, similarly to FBXO32,
the calculated relative fold changes of TRIM63 varied depending on
the reference gene selected. The expression level of TRIM63 at 4
days following nerve injury increased by ~5 fold when compared with
normal control, using HPRT1 or ANKRD27+TBP as the internal control
(Fig. 5D and F). By contrast,
using PGK1 as the internal control, the detected relative
expression level of TRIM63 at 4 days following nerve injury
increased by ~30 folds when compared with the normal control
(Fig. 5E).
Discussion
The denervation and reinnervation of target skeletal
muscles is a biological process that occurs following peripheral
nerve injury (10). Muscle
denervation leads to muscle atrophy that is characterized by
reduced muscle mass, altered muscle morphology and impaired muscle
functions including decreased force production and power output
(27–29). Clinical trials have demonstrated
that reinnervation may reduce muscle atrophy and promote the
recovery of muscle function. By contrast, prolonged muscle
denervation may cause irreversible damage (30,31).
Incomplete and/or delayed peripheral nerve
reinnervation and consequent impaired muscle function remains a
major health problem. Therefore, multiple previous studies
investigated the alterations in gene expression during the process
of muscle denervation and reinnervation following peripheral nerve
injury, with the aim to identify novel therapeutic targets to treat
patients with injury-induced muscle atrophy (32–35).
Microarray analysis, a high-throughput method that allows parallel
analysis of multiple samples, was used to identify gene expression
profiles during muscle denervation and reinnervation (32,36).
The expression levels of microRNAs and their target genes were also
examined in the context of muscle reinnervation (37–39).
The accuracy of the results derived from high-throughput approaches
is frequently confirmed by RT-qPCR analysis. Therefore, the
selection of suitable internal controls is required to decrease the
inaccuracy derived by alterations in the expression levels of the
reference gene and to increase the reliability of the RT-qPCR
results.
In the present study, the morphological and
physiological parameters in the gastrocnemius muscles were
investigated in normal control rats and in rats following sciatic
nerve crush injury, and structural and functional alterations were
observed in the gastrocnemius muscles following nerve injury.
Therefore, a great number of genes, including housekeeping genes,
may be differentially expressed in gastrocnemius muscles during
these biological processes. To examine the possibility that the
expression levels of housekeeping genes may be affected, primer
pairs with high efficiency were used and the raw Cq values of 13
housekeeping genes were measured in the control and injured rats. A
subset of housekeeping genes, including 18S, ACTB, CYPA, GAPDH,
PGK1, UBC, UBXN11 and YWHAZ, exhibited variable Cq values. The
present results suggested that certain housekeeping genes may not
exhibit stable expression levels in rat gastrocnemius muscles
following sciatic nerve injury, further confirming the importance
of the identification of a suitable reference gene to study this
process.
By using geNorm and NormFinder analyses, the
stabilities of these housekeeping genes were assessed. By using
geNorm analysis, the housekeeping genes with the most stable
expression levels were selected based on their expression level
ratios (2,6), and ANKRD27 and HPRT1 were identified
to exhibit stable expression levels. By using NormFinder analysis,
the gene expression variation and the similarities among expression
profiles of the housekeeping genes were calculated (3), and the expression level of HPRT1 was
identified as the most stable among the reference genes examined.
geNorm and NormFinder results suggested that HPRT1 was the most
suitable internal reference gene, whereas PGK1 was not a reliable
internal control. RT-qPCR experiments were performed to analyze the
expression profiles of FBXO32 and TRIM63 using various reference
genes, in order to investigate whether the selection of a certain
housekeeping gene may affect the quantification results. RT-qPCR
results demonstrated that the expression patterns and fold changes
of the examined target genes varied using the stable housekeeping
gene HPRT1 or the unstable housekeeping gene PGK1 as the reference
gene. Furthermore, the standard deviation values of target genes
increased with PGK1 as the internal control. The present results
suggested that the selection of the reference gene may influence
experimental reproducibility. However, the genomic locus of HPRT1
presents pseudogenes (40), and
the quantification of HPRT1 may be affected by genomic DNA
contamination, despite treatment with DNase. Therefore, additional
housekeeping genes with stable expression levels, including ANKRD27
and TBP, may be used. In the present study, the geometric mean of
ANKRD27 and TBP was used to normalize the expression levels of
FBXO32 and TRIM63. Quantitative results suggested that FBXO32 and
TRIM63 exhibited similar temporal dynamics using HPRT1 or
ANKRD27+TBP as the internal control, suggesting that ANKRD27+TBP
may additionally be used as a suitable control.
Selection of suitable internal controls was
previously identified to be involved in the accuracy of gene
quantification. The selection of the most suitable reference gene
was identified to be cell- and tissue-specific (2,22,41,42).
Our previous study suggested that distinct reference genes may be
selected in sciatic nerve samples and DRG samples following rat
sciatic nerve crush injury (13).
In the present study, by using geNorm and NormFinder algorithms,
the stabilities of the gene expression of 13 housekeeping genes
were investigated, and HPRT1 was identified as the most stable
housekeeping gene in gastrocnemius muscles following rat sciatic
nerve crush injury. The present results suggested that the
selection of an appropriate internal control is required for
reliable gene normalization. Furthermore, the results of the
present study may provide insights that may be beneficial for
future studies aiming to analyze gene expression in innervated
muscles following peripheral nerve injury.
Acknowledgements
The authors would like to thank Dr Sheng Yi at
Nantong University (Nantong, China) for her assistance in
manuscript preparation. The authors would also like to thank
Professor Jie Liu at Nantong University (Nantong, China) for his
help in language editing.
Funding
The present study was supported by The Natural
Science Foundation of Jiangsu Province (Jiangsu, China; grant no.
BK20180951), The Natural Science Foundation of the Jiangsu Higher
Education Institutions of China (Jiangsu, China; grant no.
18KJB180022), the Natural Science Research Project Funded by The
Nantong University (Nantong, China; grant nos. 17ZY12 and 18B26)
and the Priority Academic Program Development of Jiangsu Higher
Education Institutions of China.
Availability of data and materials
The datasets used and/or analyzed during the present
study are available from the corresponding author on reasonable
request.
Authors' contributions
XW, HZ and YW conceived and designed the present
study. XW, HZ, JN and YW performed the experiments. JN, JP and HH
analyzed the data. YW provided the reagents, materials, and
analysis tools and interpreted the data. XW and YW wrote the
manuscript. All authors read and approved the final manuscript.
Ethics approval and consent to
participate
The animal procedures were ethically approved by The
Administration Committee of Experimental Animals of Jiangsu
Province (Jiangsu, China).
Patient consent for publication
Not applicable.
Competing interests
The authors declare that they have no competing
interests.
References
|
1
|
Bustin SA: Quantification of mRNA using
real-time reverse transcription PCR (RT-PCR): Trends and problems.
J Mol Endocrinol. 29:23–39. 2002. View Article : Google Scholar : PubMed/NCBI
|
|
2
|
Seol D, Choe H, Zheng H, Jang K,
Ramakrishnan PS, Lim TH and Martin JA: Selection of reference genes
for normalization of quantitative real-time PCR in organ culture of
the rat and rabbit intervertebral disc. BMC Res Notes. 4:1622011.
View Article : Google Scholar : PubMed/NCBI
|
|
3
|
Andersen CL, Jensen JL and Orntoft TF:
Normalization of real-time quantitative reverse transcription-PCR
data: A model-based variance estimation approach to identify genes
suited for normalization, applied to bladder and colon cancer data
sets. Cancer Res. 64:5245–5250. 2004. View Article : Google Scholar : PubMed/NCBI
|
|
4
|
Eisenberg E and Levanon EY: Human
housekeeping genes are compact. Trends Genet. 19:362–365. 2003.
View Article : Google Scholar : PubMed/NCBI
|
|
5
|
Zhu J, He F, Hu S and Yu J: On the nature
of human housekeeping genes. Trends Genet. 24:481–484. 2008.
View Article : Google Scholar : PubMed/NCBI
|
|
6
|
Vandesompele J, De Preter K, Pattyn F,
Poppe B, Van Roy N, De Paepe A and Speleman F: Accurate
normalization of real-time quantitative RT-PCR data by geometric
averaging of multiple internal control genes. Genome Biol.
3:RESEARCH00342002. View Article : Google Scholar : PubMed/NCBI
|
|
7
|
Thellin O, Zorzi W, Lakaye B, De Borman B,
Coumans B, Hennen G, Grisar T, Igout A and Heinen E: Housekeeping
genes as internal standards: Use and limits. J Biotechnol.
75:291–295. 1999. View Article : Google Scholar : PubMed/NCBI
|
|
8
|
Schmittgen TD and Zakrajsek BA: Effect of
experimental treatment on housekeeping gene expression: Validation
by real-time, quantitative RT-PCR. J Biochem Biophys Methods.
46:69–81. 2000. View Article : Google Scholar : PubMed/NCBI
|
|
9
|
Li R, Liu Z, Pan Y, Chen L, Zhang Z and Lu
L: Peripheral nerve injuries treatment: A systematic review. Cell
Biochem Biophys. 68:449–54. 2014. View Article : Google Scholar : PubMed/NCBI
|
|
10
|
Gu X, Ding F and Williams DF: Neural
tissue engineering options for peripheral nerve regeneration.
Biomaterials. 35:6143–6156. 2014. View Article : Google Scholar : PubMed/NCBI
|
|
11
|
Yi S, Zhang H, Gong L, Wu J, Zha G, Zhou
S, Gu X and Yu B: Deep sequencing and bioinformatic analysis of
lesioned sciatic nerves after crush injury. PLoS One.
10:e01434912015. View Article : Google Scholar : PubMed/NCBI
|
|
12
|
Gong L, Wu J, Zhou S, Wang Y, Qin J, Yu B,
Gu X and Yao C: Global analysis of transcriptome in dorsal root
ganglia following peripheral nerve injury in rats. Biochem Biophys
Res Commun. 478:206–212. 2016. View Article : Google Scholar : PubMed/NCBI
|
|
13
|
Wang Y, Shan Q, Meng Y, Pan J and Yi S:
Mrpl10 and Tbp are suitable reference genes for peripheral nerve
crush injury. Int J Mol Sci. 18:E2632017. View Article : Google Scholar : PubMed/NCBI
|
|
14
|
Lien SC, Cederna PS and Kuzon WM Jr:
Optimizing skeletal muscle reinnervation with nerve transfer. Hand
Clin. 24445–454. (vii)2008. View Article : Google Scholar : PubMed/NCBI
|
|
15
|
Irintchev A and Wernig A: Denervation and
reinnervation of muscle: Physiological effects. Eur Arch
Otorhinolaryngol. S28–S30. 1994.PubMed/NCBI
|
|
16
|
Martínez-Martos JM, Carrera-González MP,
Sánchez-Agesta R, García MJ and Ramírez-Expósito MJ: Kidney
aminopeptidase activities are related to renal damage in
experimental breast cancer. J Clin Mol Med. 1:2018. View Article : Google Scholar
|
|
17
|
Livak KJ and Schmittgen TD: Analysis of
relative gene expression data using real-time quantitative PCR and
the 2(-Delta Delta C(T)) method. Methods. 25:402–428. 2001.
View Article : Google Scholar : PubMed/NCBI
|
|
18
|
Bangaru ML, Park F, Hudmon A, McCallum BJ
and Hogan HQ: Quantification of gene expression after painful nerve
injury: Validation of optimal reference genes. J Mol Neurosci.
46:497–504. 2012. View Article : Google Scholar : PubMed/NCBI
|
|
19
|
Bonefeld BE, Elfving B and Wegener G:
Reference genes for normalization: A study of rat brain tissue.
Synapse. 62:302–309. 2008. View Article : Google Scholar : PubMed/NCBI
|
|
20
|
Gambarotta G, Ronchi G, Friard O, Galletta
P, Perroteau I and Geuna S: Identification and validation of
suitable housekeeping genes for normalizing quantitative real-time
PCR assays in injured peripheral nerves. PLoS One. 9:e1056012014.
View Article : Google Scholar : PubMed/NCBI
|
|
21
|
Peinnequin A, Mouret C, Birot O, Alonso A,
Mathieu J, Clarençon D, Agay D, Chancerelle Y and Multon E: Rat
pro-inflammatory cytokine and cytokine related mRNA quantification
by real-time polymerase chain reaction using SYBR green. BMC
Immunol. 5:32004. View Article : Google Scholar : PubMed/NCBI
|
|
22
|
Martínez-Beamonte R, Navarro MA, Larraga
A, Strunk M, Barranquero C, Acín S, Guzman MA, Iñigo P and Osada J:
Selection of reference genes for gene expression studies in rats. J
Biotechnol. 151:325–334. 2011. View Article : Google Scholar : PubMed/NCBI
|
|
23
|
Carvalho RF, Castan EP, Coelho CA, Lopes
FS, Almeida FL, Michelin A, de Souza RW, Araújo JP Jr, Cicogna AC
and Dal Pai-Silva M: Heart failure increases atrogin-1 and MuRF1
gene expression in skeletal muscle with fiber type-specific
atrophy. J Mol Histol. 41:81–87. 2010. View Article : Google Scholar : PubMed/NCBI
|
|
24
|
Rho HW, Lee BC, Choi ES, Choi IJ, Lee YS
and Goh SH: Identification of valid reference genes for gene
expression studies of human stomach cancer by reverse
transcription-qPCR. BMC Cancer. 10:2402010. View Article : Google Scholar : PubMed/NCBI
|
|
25
|
Li P, Waters RE, Redfern SI, Zhang M, Mao
L, Annex BH and Yan Z: Oxidative phenotype protects myofibers from
pathological insults induced by chronic heart failure in mice. Am J
Pathol. 170:599–608. 2007. View Article : Google Scholar : PubMed/NCBI
|
|
26
|
Latres E, Amini AR, Amini AA, Griffiths J,
Martin FJ, Wei Y, Lin HC, Yancopoulos GD and Glass DJ: Insulin-like
growth factor-1 (IGF-1) inversely regulates atrophy-induced genes
via the phosphatidylinositol 3-kinase/Akt/mammalian target of
rapamycin (PI3K/Akt/mTOR) pathway. J Biol Chem. 280:2737–2744.
2005. View Article : Google Scholar : PubMed/NCBI
|
|
27
|
Yoshimura K, Asato H, Cederna PS,
Urbanchek MG and Kuzon WM: The effect of reinnervation on force
production and power output in skeletal muscle. J Surg Res.
81:201–208. 1999. View Article : Google Scholar : PubMed/NCBI
|
|
28
|
Kamath S, Venkatanarasimha N, Walsh MA and
Hughes PM: MRI appearance of muscle denervation. Skeletal Radiol.
37:397–404. 2008. View Article : Google Scholar : PubMed/NCBI
|
|
29
|
Jaweed MM, Herbison GM and Ditunno JF:
Denervation and reinnervation of fast and slow muscles. A
histochemical study in rats. J Histochem Cytochem. 23:808–827.
1975. View Article : Google Scholar : PubMed/NCBI
|
|
30
|
Carlson BM: The Biology of long-term
denervated skeletal muscle. Eur J Transl Myol. 24:32932014.
View Article : Google Scholar : PubMed/NCBI
|
|
31
|
Willand MP, Nguyen MA, Borschel GH and
Gordon T: Electrical stimulation to promote peripheral nerve
regeneration. Neurorehabil Neural Repair. 30:490–496. 2016.
View Article : Google Scholar : PubMed/NCBI
|
|
32
|
Batt J, Bain J, Goncalves J, Michalski B,
Plant P, Fahnestock M and Woodgett J: Differential gene expression
profiling of short and long term denervated muscle. FASEB J.
20:115–117. 2006. View Article : Google Scholar : PubMed/NCBI
|
|
33
|
Nicolino S, Panetto A, Raimondo S,
Gambarotta G, Guzzini M, Fornaro M, Battiston B, Tos P, Geuna S and
Perroteau I: Denervation and reinnervation of adult skeletal muscle
modulate mRNA expression of neuregulin-1 and ErbB receptors.
Microsurgery. 29:464–472. 2009. View Article : Google Scholar : PubMed/NCBI
|
|
34
|
Sun H, Qiu J, Chen Y, Yu M, Ding F and Gu
X: Proteomic and bioinformatic analysis of differentially expressed
proteins in denervated skeletal muscle. Int J Mol Med.
33:1586–1596. 2014. View Article : Google Scholar : PubMed/NCBI
|
|
35
|
Weng J, Zhang P, Yin X and Jiang B: The
Whole transcriptome involved in denervated muscle atrophy following
peripheral nerve injury. Front Mol Neurosci. 11:692018. View Article : Google Scholar : PubMed/NCBI
|
|
36
|
Raffaello A, Laveder P, Romualdi C, Bean
C, Toniolo L, Germinario E, Megighian A, Danieli-Betto D, Reggiani
C and Lanfranchi G: Denervation in murine fast-twitch muscle:
Short-term physiological changes and temporal expression profiling.
Physiol Genomics. 25:60–74. 2006. View Article : Google Scholar : PubMed/NCBI
|
|
37
|
Hsieh CH, Jeng SF, Wu CJ, Lu TH, Yang JC,
Chen YC, Lin CJ and Rau CS: Altered expression of the microRNAS and
their potential target genes in the soleus muscle after peripheral
denervation and reinnervation in rats. J Trauma. 70:472–480. 2011.
View Article : Google Scholar : PubMed/NCBI
|
|
38
|
Jeng SF, Rau CS, Liliang PC, Wu CJ, Lu TH,
Chen YC, Lin CJ and Hsieh CH: Profiling muscle-specific microRNA
expression after peripheral denervation and reinnervation in a rat
model. J Neurotrauma. 26:2345–2353. 2009. View Article : Google Scholar : PubMed/NCBI
|
|
39
|
Li G, Li QS, Li WB, Wei J, Chang WK, Chen
Z, Qiao HY, Jia YW, Tian JH and Liang BS: MIRNA targeted signaling
pathway in the early stage of denervated fast and slow muscle
atrophy. Neural Regen Res. 11:1293–1303. 2016. View Article : Google Scholar : PubMed/NCBI
|
|
40
|
Sellner LN and Turbett GR: The presence of
a pseudogene may affect the use of HPRT as an endogenous mRNA
control in RT-PCR. Mol Cell Probes. 10:481–483. 1996. View Article : Google Scholar : PubMed/NCBI
|
|
41
|
Nelissen K, Smeets K, Mulder M, Hendriks
JJ and Ameloot M: Selection of reference genes for gene expression
studies in rat oligodendrocytes using quantitative real time PCR. J
Neurosci Methods. 187:78–83. 2010. View Article : Google Scholar : PubMed/NCBI
|
|
42
|
Solano ME, Thiele K, Kowal MK and Arck PC:
Identification of suitable reference genes in the mouse placenta.
Placenta. 39:7–15. 2016. View Article : Google Scholar : PubMed/NCBI
|


