Introduction
Colon cancer is the most common type of
gastrointestinal cancer and remains a leading cause of morbidity
and mortality worldwide (1).
Surgery remains the cornerstone of therapeutic management for
patients with early-stage colon cancer (2). At present, there are no effective
therapies available for advanced or metastatic colon cancer
(3). Recurrence occurs in 10–30%
of patients with colon carcinoma despite the prior use of radical
treatment (4,5). A detailed molecular understanding of
the pathogenesis of colon cancer is essential for the improvement
of clinical outcomes for patients and may reveal additional
clinical applications.
Prior studies have aimed to identify genetic
alterations involved in the progression of colon cancer in order to
provide more effective interventions for the disease (6–8). For
example, Wang et al (9)
demonstrated that the collagen type XI α1 chain and asporin genes
may be involved in the progression of colorectal cancer. Dekervel
et al (10) confirmed the
involvement of intratumoral hypoxia in the underlying mechanisms of
colon cancer and demonstrated the association of hypoxia-driven
gene expression with high recurrence rates in advanced colon cancer
(10). A recent study indicated
that the caudal type homeobox 2 gene may serve as a prognostic
biomarker in Stage II and Stage III colon cancer (11). Another recent investigation
revealed that overexpression of the Golgi phosphoprotein 3 gene in
human colon cancer cells may inhibit cancer cell apoptosis and
promote proliferation by activating the Wnt signaling pathway
(12). More recently, a study
demonstrated that the activity-dependent neuroprotector homeobox
gene may represent a pharmacologically inducible repressor of Wnt
signaling in colorectal cancer (13). In addition, Fagoonee et al
(14) reported that the
RNA-binding protein epithelial splicing regulatory protein 1
stimulates the growth of cancer epithelial cells and promotes the
progression of human colorectal cancer (14). However, many genes associated with
the development and progression of colon cancer require further
investigation.
Weighted gene co-expression network analysis (WGCNA)
groups were applied to functionally categorize genes into modules
based on their associations with co-expressed genes (15). Highly interconnected genes (hub
genes) in these modules may be involved in the initiation and
progression of the associated disease. Liu et al (16) used WGCNA to construct a gene
co-expression network and demonstrated that a module associated
with the hypertrophic cardiomyopathy pathway was also exhibited in
coronary artery disease samples. Liu et al (16) also reported that the
glucose-6-phosphate dehydrogenase and S100 calcium binding protein
A7 genes may represent potential targets in coronary artery disease
(16). In a further study, WGCNA
identified seven modules that are notably linked with latent and
active tuberculosis (17).
Therefore, WGCNA may be applied to analyze microarray data for
colon cancer.
In the present study, WGCNA of microarray data
obtained from colon cancer samples was performed to further
investigate the molecular mechanisms underlying colon carcinoma,
and to identify additional potentially significant genes associated
with colon cancer. A gene co-expression network was constructed and
different gene modules were selected. Functional and pathway
enrichment analyses were conducted on genes in the significant
modules. Highly connected hub genes in the most significant module
were selected, and these genes may be considered to represent
candidate biomarkers and therapeutic targets for colon cancer.
Materials and methods
Microarray data
In the present study, gene expression profile data
were downloaded from The Cancer Genome Atlas database (TCGA;
http://cancergenome.nih.gov/) (18). The database contained eight colon
adenocarcinoma (COAD) (19,20)
samples and eight normal samples (https://portal.gdc.cancer.gov), generated in multiple
studies.
Data preprocessing
The downloaded sample files were merged into a gene
expression matrix. Genes with missing expression values were
removed, and the expression values of the remaining genes were
log2 transformed. Following preprocessing, the
expression matrix with rows and columns contained 14,662 genes and
16 samples.
The downloaded sample data contained data for
samples from different batches. The batch differences were removed
by batch normalization using the ComBat procedure implemented in
the SVA R package (version 1.28.0) (21). Subsequently, the
normalize.quantiles.robust function in the preprocess Core package
(http://bioconductor.org/packages/release/bioc/html/preprocessCore)
was applied to perform unified normalization. Normalized data were
used for subsequent analyses, including screening for differences
in gene expression and network construction.
Determination of the differential
expression levels of genes
Levels of differential gene expression were
calculated using the limma R package in Bioconductor (version
3.22.7) (22) via calculation of
the log2 fold change (FC) value and the P-value of each
gene. Greater |log2FC| values of genes indicated greater
differences in the expression of these genes compared with the
normal group and the COAD group. In general, genes with
log2FC >1 and P<0.05 were considered to be
upregulated, and genes with log2FC <-1 and P<0.05
were considered to be downregulated. Furthermore, genes were
separated into three categories, according to the log2FC
value calculated with the limma R package (22). Firstly, genes for which the
difference in the expression levels between the disease group and
the control group was not significant (−0.5 <log2FC
<0.5) were excluded from the present study. The remaining genes
were separated into two categories for subsequent analysis: i)
Genes with log2FC ≥0.5; and ii) genes with
log2FC ≤-0.5.
Generation of the WGCNA network,
construction of the hierarchical clustering tree and identification
of modules
The WGCNA package (version 1.64–1) (http://www.genetics.ucla.edu/labs/horvath/CoexpressionNetwork/Rpackages/WGNA)
provides a comprehensive collection of functions for conducting
weighted correlation network analysis (23). Instead of describing the
correlation structure between thousands of genes and a sample
trait, WGCNA analysis focuses on the association between the sample
trait and a few, usually <10, modules (24). In the WGCNA algorithm, the elements
in the co-expression matrix of the genes are no longer the
correlation coefficients of the genes, but rather the weighted
value of the correlation coefficients. The criteria for the
weighted value are such that the connections between the genes
contained in each gene network can follow the scale-free law, in
which p(i) is inversely proportional to in, where I is
the node degree (connectivity) and p(i) is the probability that a
node has n links (degree i). In practical applications, the network
is made to an approximate scale-free distribution by selecting the
weighting coefficients such that log(i) and log[p(i)] are
negatively correlated, and the correlation coefficient should be at
least 0.8.
The specific construction process of WGCNA networks
includes three steps. In step one, the co-expression matrix of
genes is defined. The gene correlation matrix S=[Smn] is
constructed based on the correlation coefficient Smn=|cor (m, n)|
between the gene m and the gene n. In the second step, adjacency
functions are defined. In the WGCNA algorithm, for any gene pair,
the adjacency coefficient amn is used as a measure of
inter-gene correlation: amn=power (Smn,
β)=|Smn|β. In step three, the parameter β of
the adjacency function is determined according to the scale-free
network principle.
After satisfying the above conditions, the network
can be constructed and divided into modules. Linking modules to
known features involves two aspects. The first is the calculation
of the characteristic values of the module, followed by the
calculation of the correlation coefficient between the feature
vector of the module and the feature of interest. The second
involves grouped phenotypic data (such as disease status), for
which a P-value for each gene for differential expression between
each group (e.g. disease and normal groups) is calculated using the
t-test, and the log10(P-value) is defined as gene
significance (GS). The module significance (MS) of each module is
defined as the mean value of the GS of the genes contained in the
module. The MS values are compared. In general, if the MS value of
a module is significantly higher than that of other modules, this
module may be related to the existence of the disease.
In the present study, the WGCNA package (24) was used to construct the network and
hierarchical clustering tree.
Functional enrichment analysis of
significant genes in the identified modules
The Database for Annotation, Visualization and
Integrated Discovery (DAVID; http://david.niaid.nih.gov) can help investigators in
the functional interpretation of large lists of genes (25). In the present study, gene ontology
(GO) and Kyoto Encyclopedia of Genes and Genomes (KEGG) pathway
enrichment analyses for important genes in the identified module
were performed using the DAVID Bioinformatics Resources (25). P<0.05 was set as the criterion
for identifying overrepresented GO terms and pathways. In addition,
the connection of the genes in the selected module was visualized
using Cytoscape software (version 3.1.0) (26).
RT-qPCR validation
Total RNA was extracted from six pairs (female to
male ratio, 1:2; mean age, 71; age range, 52–83) of colon cancer
tissues and corresponding noncancerous colon tissues, which were
collected from the Department of Gastrointestinal Colorectal and
Anal Surgery, China-Japan Union Hospital of Jilin University
(Changchun, China) using TRIzol® reagent (Invitrogen;
Thermo Fisher Scientific, Inc., Waltham, MA, USA), according to the
manufacturer's instructions. All participants underwent no other
treatment before resection. All tissues were collected between
January and April 2018. Harvested tissues were immediately frozen
in liquid nitrogen and stored at −80°C prior to RNA extraction. The
study was approved by the institutional ethical committee of
China-Japan Union Hospital of Jilin University and informed consent
was obtained from every patient. The quality and quantity of RNA
samples were evaluated using an Infinite M100 PRO microplate reader
(Tecan Group, Ltd., Mannedorf, Switzerland). RNA was reverse
transcribed to cDNA using a PrimeScript™ RT Master Mix (Takara
Biotechnology Co., Ltd., Dalian, China). All cDNA was amplified
using the following primer sets: GAPDH forward,
5′-TGACAACTTTGGTATCGTGGAAGG-3′ and reverse,
5′-AGGCAGGGATGATGTTCTGGAGAG-3′); carbamoyl-phosphate synthetase 2,
aspartate transcarbamylase, and dihydroorotase (CAD) forward,
5′-CCATGCACTAGACAGCCAAGA-3′ and reverse,
5′-CGGCTCAGTGTGGATACGAC-3′; transmembrane protein 147 (TMEM147)
forward, 5′-ACACGCTATGATCTGTACCACA-3′ and reverse,
5′-CAGAGGTGGACGAAGGTCTC-3′; and σ-non-opioid intracellular receptor
1 (SIGMAR1) forward, 5′-CGAAGAGATAGCGCAGTTGG-3′ and reverse,
5′-TCCACGATCAGACGAGAGAAG-3′. GAPDH was used as a reference gene for
normalization. Power SYBR-Green PCR Master (Thermo Fisher
Scientific, Inc.) was used for qPCR, according to the
manufacturer's instructions. Each reaction was performed in a final
volume of 20 µl, containing 8 µl of cDNA, 1 µl of each primer and
10 µl 2X SYBR Premix EX Taq (Thermo Fisher Scientific, Inc.).
RT-qPCR was performed on a Viia7 Real-Time PCR System (Applied
Biosystems; Thermo Fisher Scientific, Inc.) using the following
thermocycling conditions: Denaturation at 50°C for 3 min and 95°C
for 3 min; followed by 40 cycles of 95°C for 10 sec and 60°C for 30
sec. Gene expression levels were quantified using the
2−ΔΔCq method.
Statistical analysis
All data are presented as the mean ± standard error
of the mean and were analyzed using SPSS 22.0 software (SPSS, Inc.,
Chicago, IL, USA). Differences between colon cancer samples and
control samples were determined using the Student's t-test. All
experiments were repeated three times. P<0.05 was considered to
indicate a statistically significant difference.
Results
Data preprocessing and differential
expression analysis
Following limma analysis, 6,134 genes that were not
significantly different between the COAD samples and controls were
removed, and 8,528 genes were retained. The 8,528 genes included
4,388 upregulated genes with log2FC ≥0.5 in group A and
4,140 downregulated genes with log2FC ≤-0.5 in group B.
These genes were used for the subsequent analyses.
WGCNA network construction and
analysis
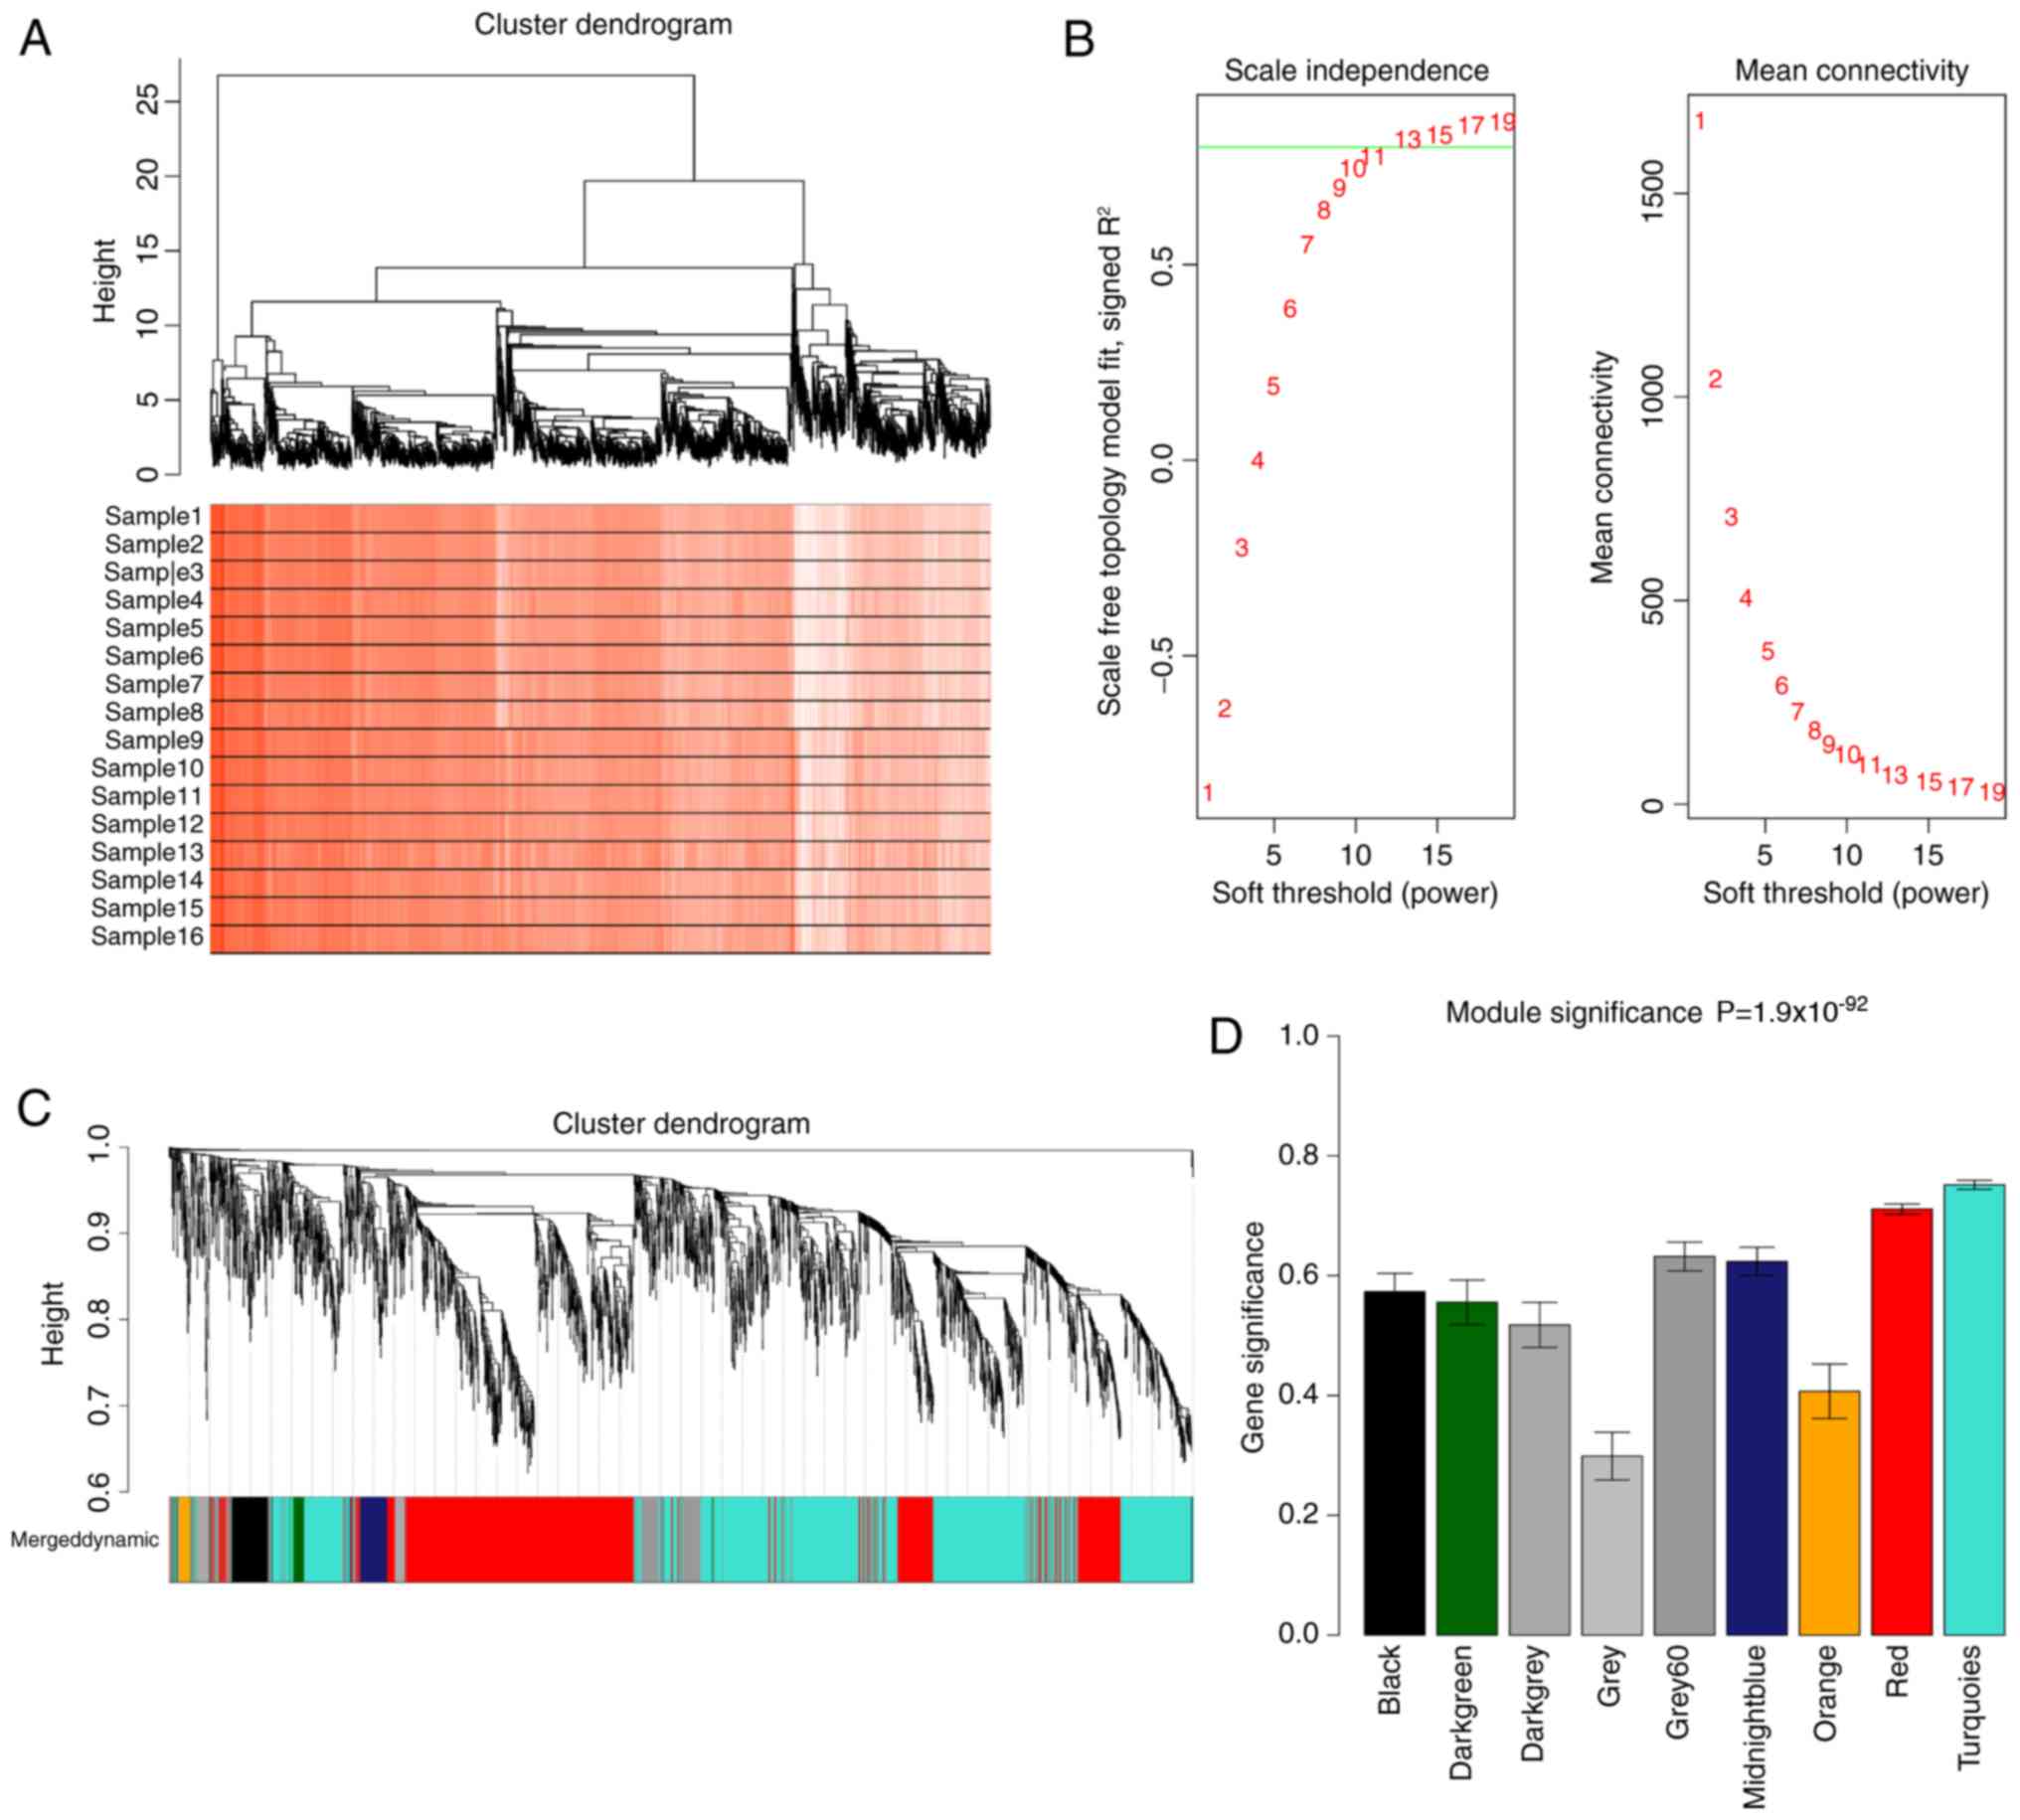
The WGCNA package was used to perform gene cluster
analysis on the genes (log2FC ≥0.5) (Fig. 1A). In a cluster dendrogram, height
is a measure of dissimilarity according to the topological overlap
matrix (23). By selecting
different height cutoff values, the gene outliers were screened out
and the number of genes was controlled. The genes within the first
branch of the hierarchical cluster tree (Fig. 1A) were considered a research target
for the follow-up analysis.
WGCNA requires the network to follow the scale-free
distribution. As shown in the left panel of Fig. 1B, when β=13, the network satisfied
the scale-free characteristic for the first time, and the vertical
axis value exceeded 0.8 (the location of the green line in the
figure), which is a prerequisite for building a WGCNA network. The
figure on the right of Fig. 1B
depicts the average connectivity of the network.
After determining whether the network obeyed the
scale-free distribution, the hierarchical clustering tree was
constructed and the gene modules were identified. As shown in
Fig. 1C, branches of the
hierarchical cluster tree defined nine modules with assigned
colors. A total of two methods were used to examine the association
between each module and colon cancer. The first was the MS value.
The gene significance of the genes in each module was calculated.
The MS was defined as the mean value of GS. A higher MS value for a
module indicated that module had a stronger correlation with the
disease. The second method was an MS correlation analysis (27). As shown in Fig. 1D and Table I, the turquoise module displayed
the strongest correlation with the disease.
 | Table I.Gene module eigenvalue and phenotype
correlation coefficient. |
Table I.
Gene module eigenvalue and phenotype
correlation coefficient.
|
| Module |
|---|
|
|
|
|---|
| Values | Grey60 | Orange | Dark green | Turquoise | Midnight blue | Red | Black | Dark grey | Grey |
|---|
| MS | 0.77 | 0.5 | 0.64 | 0.94 | 0.73 | 0.87 | 0.72 | 0.64 | 0.39 |
| P-value | 0.000524102 | 0.04953478 | 0.007928664 |
6.72×10⁻⁸ | 0.001383585 |
1.28×10⁻⁵ | 0.001848782 | 0.008201793 | 0.1337047 |
Functional enrichment analysis of
genes in the turquoise module
KEGG pathway enrichment analysis was conducted for
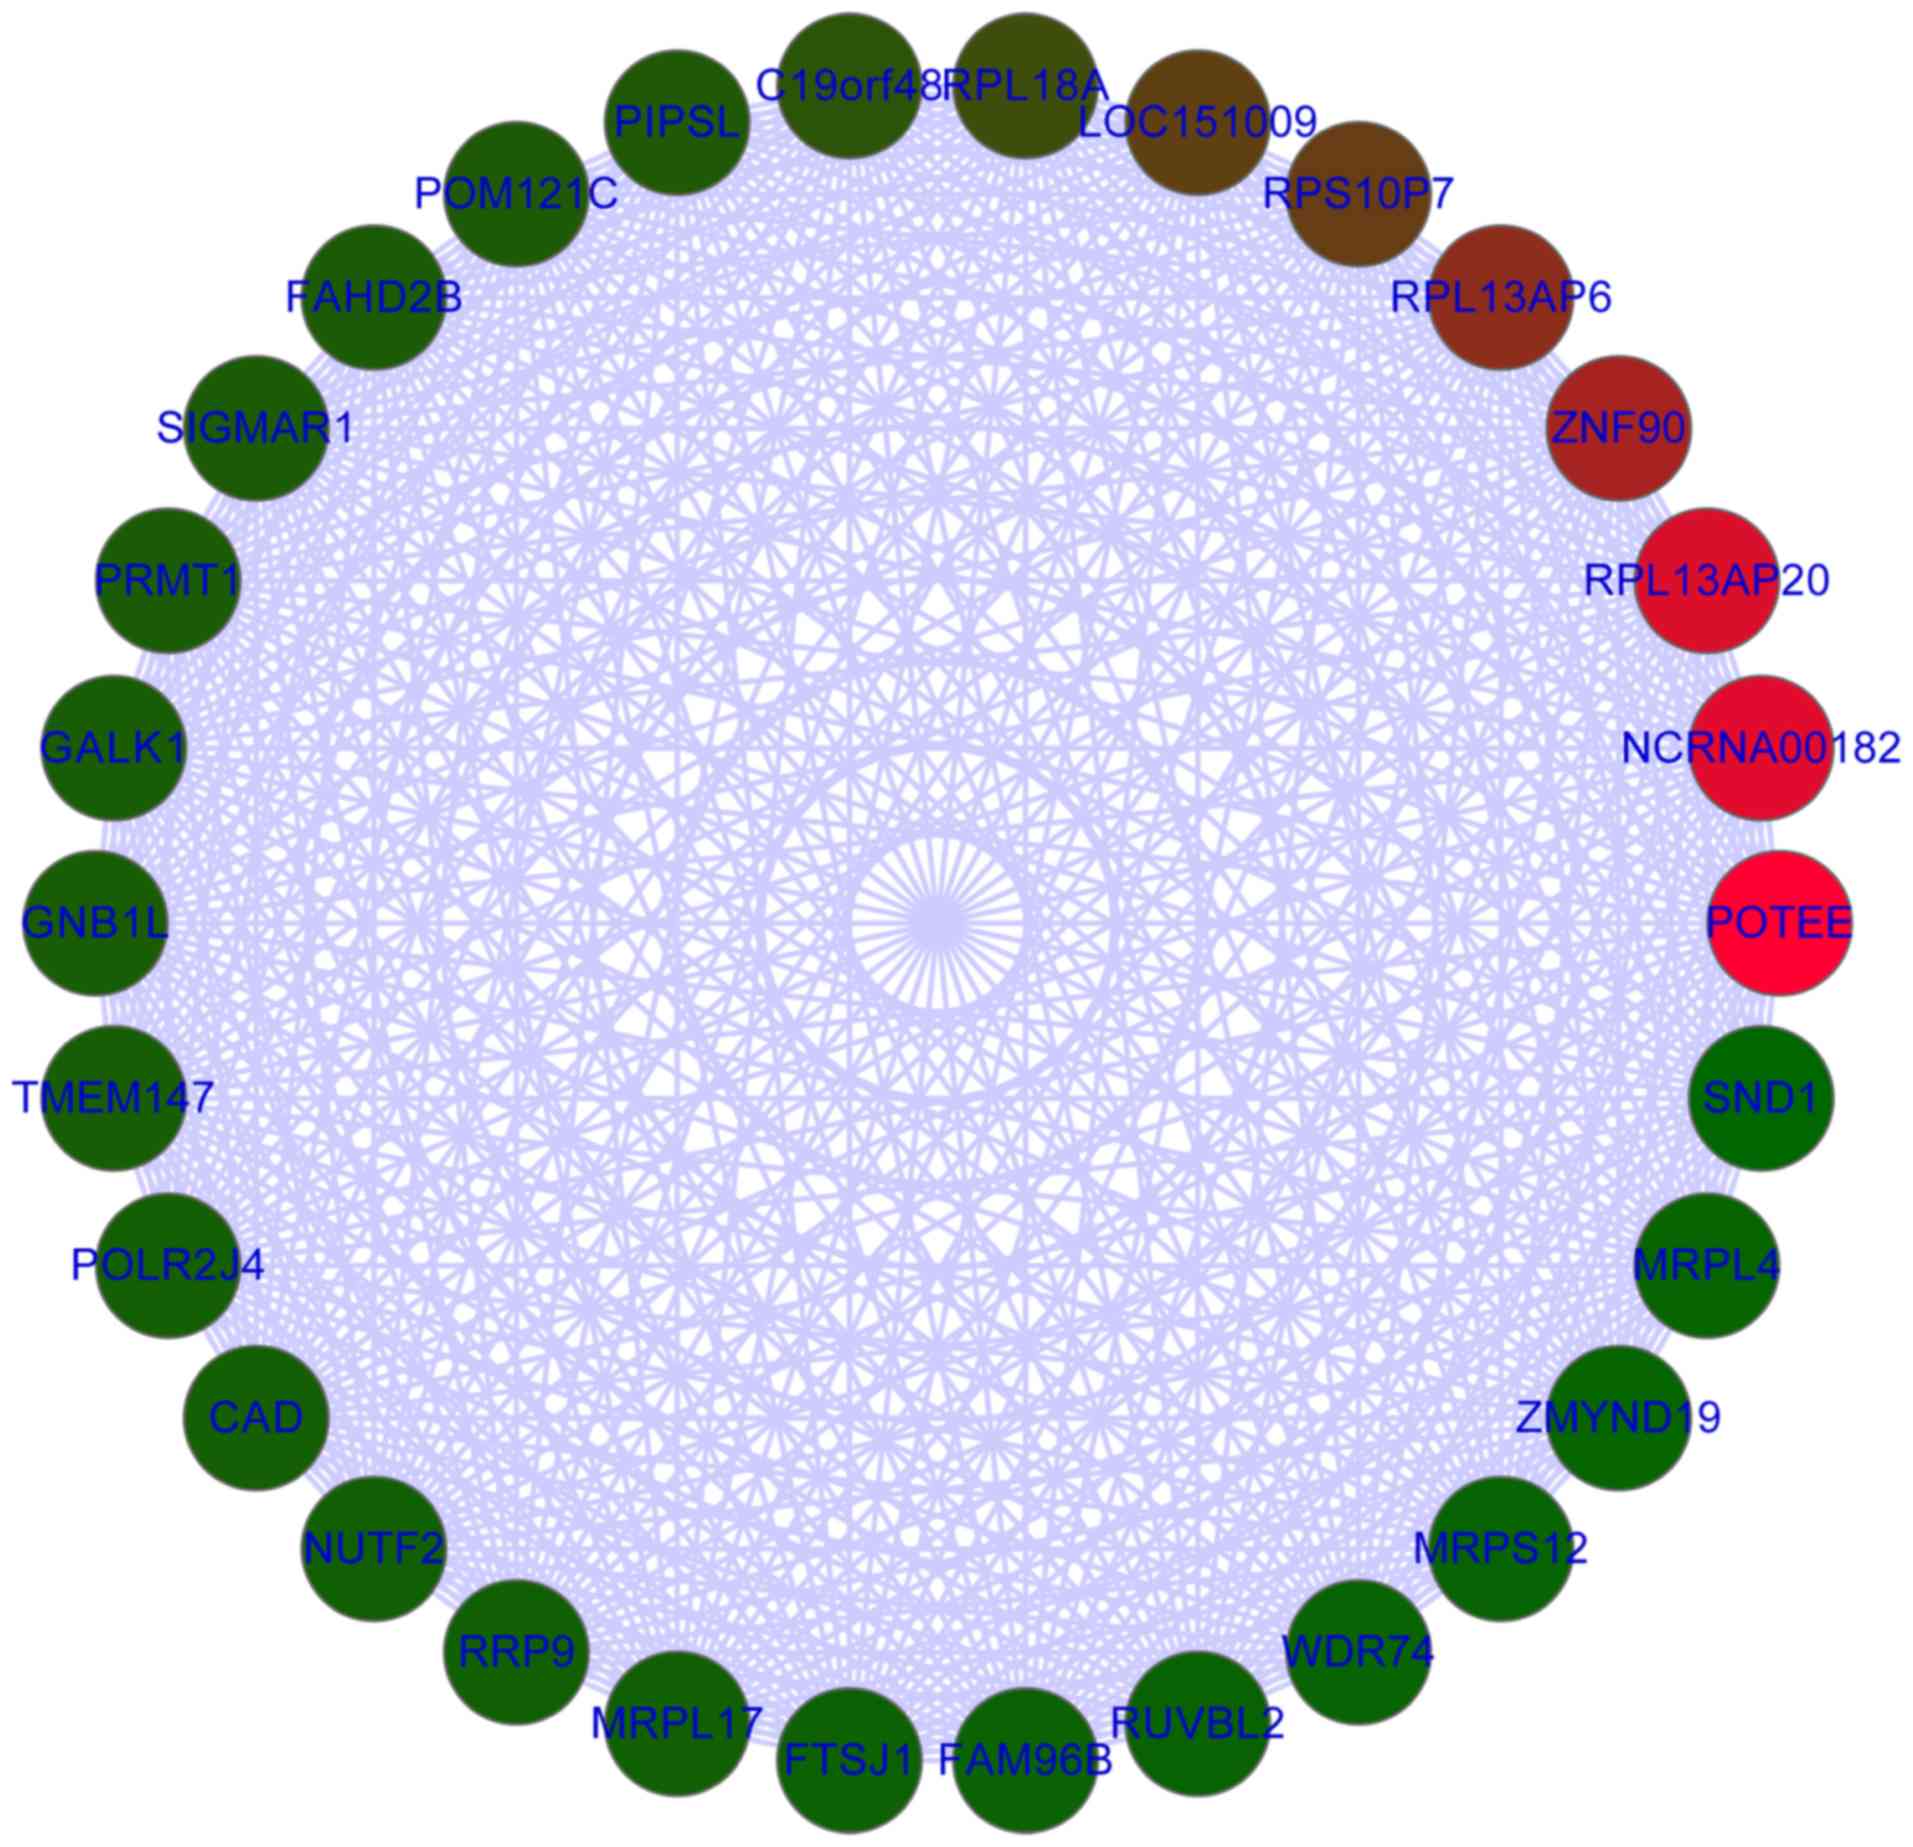
the genes in the turquoise module (Table II). Genes in this module were
mainly related to ‘RNA polymerase’ and ‘purine metabolism’. The top
30 genes with high connectivity were selected from the turquoise
module for GO functional annotation. These genes were mainly
enriched in the biological processes ‘translation’ and ‘gene
expression’, in the cellular component ‘ribonucleoprotein complex’
and in the molecular function ‘structural constituent of ribosome’
(Table III). The associations of
these 30 genes are presented in Fig.
2. The top 30 genes were all upregulated with log2FC
>1, including POTE ankyrin domain family member E, SIGMAR1,
protein arginine methyltransferase 1, galactokinase 1, TMEM147 and
CAD.
| Table II.KEGG pathway enrichment analysis for
genes in the turquoise module. |
Table II.
KEGG pathway enrichment analysis for
genes in the turquoise module.
| KEGG ID | Description | P-value | Count |
|---|
| hsa03020 | RNA polymerase |
4.70×10⁻⁸ | 13 |
| hsa00230 | Purine
metabolism |
8.27×10⁻⁶ | 29 |
| hsa00240 | Pyrimidine
metabolism | 0.000117076 | 19 |
| hsa03010 | Ribosome | 0.000136386 | 18 |
| hsa03008 | Ribosome biogenesis
in eukaryotes | 0.000284171 | 16 |
| hsa00030 | Pentose phosphate
pathway | 0.00060088 | 8 |
| hsa01100 | Metabolic
pathways | 0.000680717 | 112 |
| hsa03013 | RNA transport | 0.000911011 | 23 |
| hsa00100 | Steroid
biosynthesis | 0.002054999 | 6 |
| hsa03040 | Spliceosome | 0.007030765 | 18 |
| Table III.GO analysis of the top 30 genes with
higher connectivity. |
Table III.
GO analysis of the top 30 genes with
higher connectivity.
| Category | Term | Count | P-value |
|---|
| GOTERM_BP_ALL |
GO:0006412-translation | 6 |
4.58×10⁻⁵ |
| GOTERM_BP_ALL | GO:0010467-gene
expression | 11 | 0.001482883 |
| GOTERM_BP_ALL | GO:0044267-cellular
protein metabolic process | 9 | 0.005342118 |
| GOTERM_BP_ALL |
GO:0009058-biosynthetic process | 11 | 0.005548833 |
| GOTERM_BP_ALL |
GO:0008152-metabolic process | 16 | 0.009967762 |
| GOTERM_CC_FAT |
GO:0030529-ribonucleoprotein complex | 8 |
3.58×10⁻⁶ |
| GOTERM_CC_FAT |
GO:0005840-ribosome | 6 |
9.21×10⁻⁶ |
| GOTERM_CC_FAT |
GO:0033279-ribosomal subunit | 4 |
7.17×10⁻⁴ |
| GOTERM_CC_FAT | GO:0005635-nuclear
envelope | 3 | 0.033087058 |
| GOTERM_MF_FAT |
GO:0003735-structural constituent of
ribosome | 5 |
4.36×10⁻⁵ |
| GOTERM_MF_FAT |
GO:0005198-structural molecule
activity | 5 | 0.006405258 |
WGCNA analysis was also performed for genes in group
B with log2FC ≤-0.5. However, the analysis did not meet
the condition of constructing a scale-free network and it was not
possible to identify significant gene modules for group B.
RT-qPCR validation of identified
genes
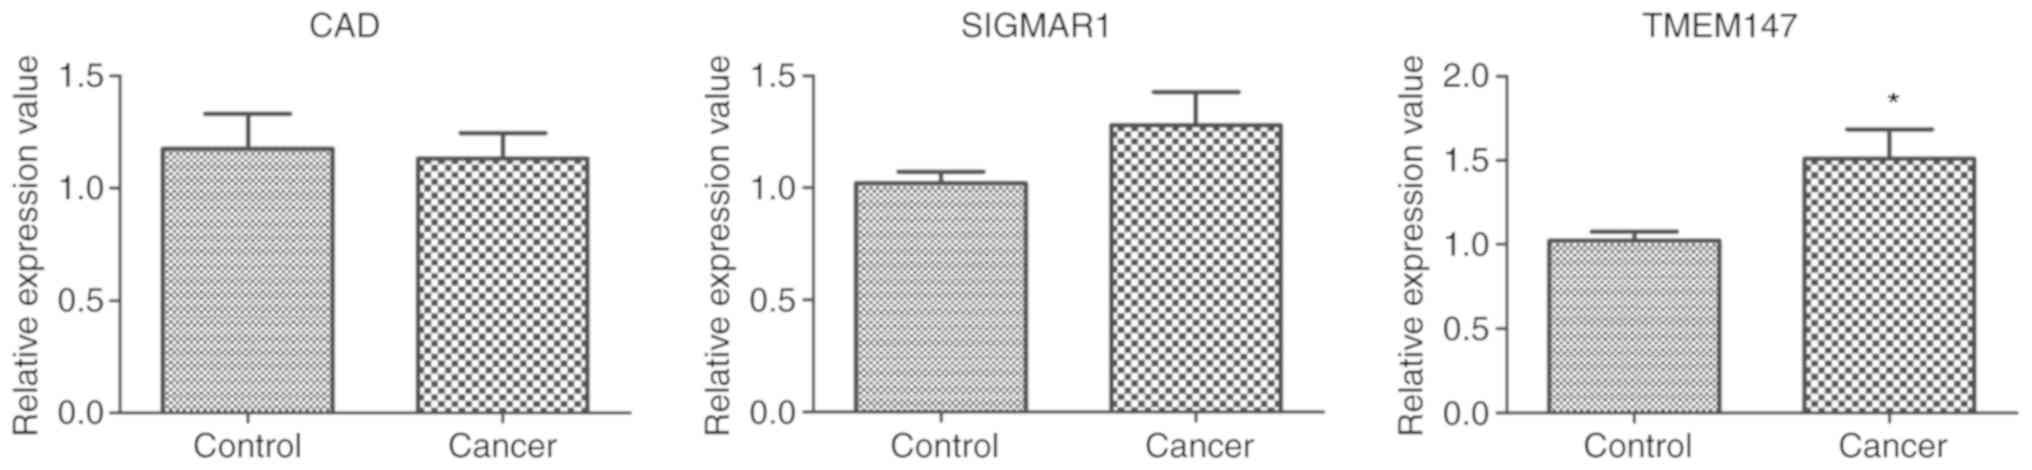
To validate the gene expression changes identified
by the aforementioned bioinformatics analysis, RT-qPCR was used to
evaluate a number of potentially critical genes in color cancer,
including CAD, TMEM147 and SIGMAR1, which exhibited a high degree
in the constructed network. As shown in Fig. 3, the expression of TMEM147 was
significantly higher in the colon cancer tissues than in the
control tissues. However, no significant differences in the
expression of CAD and SIGMAR1 were evident between colon cancer
tissues and control tissues, perhaps reflecting the small sample
size.
Discussion
In the present study, nine modules associated with
COAD were identified. Of these, the turquoise module exhibited the
strongest correlation with the disease. Genes in this module were
associated with ‘RNA polymerase’ and ‘purine metabolism’. In
addition, the top 30 hub genes with a higher degree in the
turquoise module, which included SIGMAR1, TMEM147 and CAD, were
predominantly enriched in the biological processes ‘translation’
and ‘gene expression’.
Cancer involves marked changes to the transcription
factors associated with RNA polymerases I and III (28). Recently, Bellido et al
(29) determined that there is an
association between germline mutations in a subunit of the RNA
polymerase III transcription complex and a predisposition to
colorectal cancer. In addition, purine metabolizing enzymes have
been revealed to exhibit increased activities to attenuate
accelerated purine metabolism occurring in cancerous tissues
(30). Purine antimetabolites are
an important class of drugs in the treatment of cancer (31). In the present study, genes in the
significant modules were predominantly involved in ‘RNA polymerase’
and ‘purine metabolism’, and therefore are important to the
pathogenesis of colon cancer.
SIGMAR1 encodes a receptor protein that has been
suggested to have an important role in the cellular functions of
various tissues associated with the immune, endocrine and nervous
systems (32,33). An association between SIGMAR1 and
colon cancer has been demonstrated in numerous studies (34,35).
SIGMAR1 may induce the invasive abilities of cancer cells by
regulating cellular electrical activity in response to
extracellular stimulation (36).
Recently, Gueguinou et al (34) observed that increased SIGMAR1
expression induces breast and colorectal cancer cell migration by
regulating calcium homeostasis. In addition, SIGMAR1 was revealed
to be significantly enriched in the turquoise module, which
exhibited the highest connection with colon cancer. In conclusion,
it was hypothesized that SIGMAR1 may have an important role in the
regulation of colon cancer cell migration and invasion. However,
further studies using a larger number of samples are required to
confirm this finding.
TMEM147 is a member of the transmembrane protein
family, which has important roles in various physiological
processes in disease, including migration, adhesion and signal
transduction regulation (37).
TMEM147 stimulates cell proliferation via negative modulation of M3
muscarinic receptor expression in H508 human colon cancer cells
(38). In the present study,
TMEM147 was upregulated and additionally identified as a hub gene
in the most significant module associated with colon cancer.
Furthermore, the expression level of TMEM147 in colon cancer was
investigated using RT-qPCR. Thus, it is conceivable that TMEM147
serves an important role in the development and progression of
colon cancer. Additional studies are required to assess the role of
TMEM147 in colon cancer.
Pathway enrichment analysis of the turquoise module
suggested that genes in the turquoise module were related to the
purine metabolic pathway. CAD is associated with the enzymatic
activities of the first three enzymes in pyrimidine biosynthesis:
Carbamoyl phosphate synthetase, aspartate transcarbamoylase, and
dihydroorotase (39). The
multifunctional CAD protein can control gene expression in both the
nucleus and cytoplasm (40).
Additionally, regulation of pyrimidine pathways is disrupted in
malignancies (41). Purine and
pyrimidine antimetabolites remain an important class of drugs for
the treatment of cancer (42). In
the present study, CAD was a hub gene in the significant module
associated with colon cancer. The results support the potentially
significant role of CAD in the pathogenesis of colon cancer. This
possibility is currently being assessed.
Nevertheless, the present study had some
limitations. Firstly, relatively few samples were included for the
bioinformatics analysis, which may have affected the accuracy of
the WGCNA analysis. More gene datasets should be used for
cross-validation. Secondly, CAD and SIGMAR1 did not exhibit
significant differences between the colon cancer tissues and
control tissues, which may be affected by the small sample size.
However, the roles of CAD and SIGMAR1 merit future experimental
verification in studies with more samples. Thirdly, the top 30 hub
genes with a high degree in the turquoise module were illustrated
in the present study; only three of these were selected as the
primary targets, and the other genes also merit further
investigation.
In conclusion, nine specific modules were identified
in COAD samples, of which the turquoise module displayed the
highest correlation with the disease. Genes associated with ‘RNA
polymerase’ and ‘purine metabolism’ may be significantly involved
in the pathogenesis of colon cancer. TMEM147 may play an important
role in the development and progression of colon cancer.
Experimental verification with a larger number of samples is
required to verify the results. Additionally, the roles of CAD and
SIGMAR1 warrant future experimental verification in studies with
more samples. The increased understanding of the role of genetic
alterations will provide novel insights into the mechanisms of
colon cancer, and may be critical for the development of a future
therapeutic intervention for colon cancer.
Acknowledgements
Not applicable.
Funding
The present study was partly supported by the
Technology Research and Development Program of Jilin Province
(grant nos. 2013C014-2 and 2014Y083), and the Science and
Technology Development Program (grant no. 20140204028XY).
Availability of data and materials
The datasets used and/or analyzed during the current
study are available from the corresponding author on reasonable
request.
Authors' contributions
YF and ZC were responsible for the conception and
design of the research, and drafting the manuscript. YL performed
the data acquisition. LL performed the data analysis and
interpretation. XW and YF participated in the design of the study
and performed the statistical analysis. All authors have read and
approved the manuscript.
Ethics approval and consent to
participate
All procedures were approved by the institutional
ethical committee of China-Japan Union Hospital of Jilin
University. All patients provided informed consent before the
study.
Patient consent for publication
Informed consent was obtained.
Competing interests
The authors declare that they have no competing
interests.
References
|
1
|
Torre LA, Bray F, Siegel RL, Ferlay J,
Lortet-Tieulent J and Jemal A: Global cancer statistics, 2012. CA
Cancer J Clin. 65:87–108. 2015. View Article : Google Scholar : PubMed/NCBI
|
|
2
|
Bertelsen CA, Neuenschwander AU, Jansen
JE, Wilhelmsen M, Kirkegaard-Klitbo A, Tenma JR, Bols B, Ingeholm
P, Rasmussen LA, Jepsen LV, et al: Disease-free survival after
complete mesocolic excision compared with conventional colon cancer
surgery: A retrospective, population-based study. Lancet Oncol.
16:161–168. 2015. View Article : Google Scholar : PubMed/NCBI
|
|
3
|
Tauriello DV, Calon A, Lonardo E and
Batlle E: Determinants of metastatic competency in colorectal
cancer. Mol Oncol. 11:97–119. 2017. View Article : Google Scholar : PubMed/NCBI
|
|
4
|
Kantara C, O'connell MR, Luthra G, Gajjar
A, Sarkar S, Ullrich RL and Singh P: Methods for detecting
circulating cancer stem cells (CCSCs) as a novel approach for
diagnosis of colon cancer relapse/metastasis. Lab Invest.
95:100–112. 2015. View Article : Google Scholar : PubMed/NCBI
|
|
5
|
Tie J, Wang Y, Tomasetti C, Li L, Springer
S, Kinde I, Silliman N, Tacey M, Wong HL, Christie M, et al:
Circulating tumor DNA analysis detects minimal residual disease and
predicts recurrence in patients with stage II colon cancer. Sci
Transl Med. 8:346ra922016. View Article : Google Scholar : PubMed/NCBI
|
|
6
|
Gröne J, Weber B, Staub E, Heinze M,
Klaman I, Pilarsky C, Hermann K, Castanos-Velez E, Röpcke S, Mann
B, et al: Differential expression of genes encoding tight junction
proteins in colorectal cancer: Frequent dysregulation of claudin-1,
−8 and −12. Int J Colorectal Dis. 22:651–659. 2007. View Article : Google Scholar : PubMed/NCBI
|
|
7
|
Solé X, Crous-Bou M, Cordero D, Olivares
D, Guinó E, Sanz-Pamplona R, Rodriguez-Moranta F, Sanjuan X, de Oca
J, Salazar R and Moreno V: Discovery and validation of new
potential biomarkers for early detection of colon cancer. PLoS One.
9:e1067482014. View Article : Google Scholar : PubMed/NCBI
|
|
8
|
Bhat A, Pope J, Smith J, Ahmad R, Chen X,
Washington M, Beauchamp R, Singh A and Dhawan P: Claudin-7
expression induces mesenchymal to epithelial transformation (MET)
to inhibit colon tumorigenesis. Oncogene. 34:4570–4580. 2015.
View Article : Google Scholar : PubMed/NCBI
|
|
9
|
Wang J, Yu H, Ye L, Jin L, Yu M and Lv Y:
Integrated regulatory mechanisms of miRNAs and targeted genes
involved in colorectal cancer. Int J Clin Exp Pathol. 8:517–529.
2015.PubMed/NCBI
|
|
10
|
Dekervel J, Hompes D, van Malenstein H,
Popovic D, Sagaert X, De Moor B, Van Cutsem E, D'hoore A, Verslype
C and van Pelt J: Hypoxia-driven gene expression is an independent
prognostic factor in stage II and III colon cancer patients. Clin
Cancer Res. 20:2159–2168. 2014. View Article : Google Scholar : PubMed/NCBI
|
|
11
|
Dalerba P, Sahoo D, Paik S, Guo X, Yothers
G, Song N, Wilcox-Fogel N, Forgó E, Rajendran PS, Miranda SP, et
al: CDX2 as a prognostic biomarker in stage II and stage III colon
cancer. N Engl J Med. 374:211–222. 2016. View Article : Google Scholar : PubMed/NCBI
|
|
12
|
Qiu CZ, Wang MZ, Yu WS, Guo YT, Wang CX
and Yang XF: Correlation of GOLPH3 gene with Wnt signaling pathway
in human colon cancer cells. J Cancer. 7:928–934. 2016. View Article : Google Scholar : PubMed/NCBI
|
|
13
|
Blaj C, Bringmann A, Schmidt EM, Urbischek
M, Lamprecht S, Fröhlich T, Arnold GJ, Krebs S, Blum H, Hermeking
H, et al: ADNP is a therapeutically inducible repressor of WNT
signaling in colorectal cancer. Clin Cancer Res. 23:2769–2780.
2017. View Article : Google Scholar : PubMed/NCBI
|
|
14
|
Fagoonee S, Picco G, Orso F, Arrigoni A,
Longo DL, Forni M, Scarfò I, Cassenti A, Piva R, Cassoni P, et al:
The RNA-binding protein ESRP1 promotes human colorectal cancer
progression. Oncotarget. 8:10007–10024. 2017. View Article : Google Scholar : PubMed/NCBI
|
|
15
|
Gao B, Shao Q, Choudhry H, Marcus V, Dong
K, Ragoussis J and Gao ZH: Weighted gene co-expression network
analysis of colorectal cancer liver metastasis genome sequencing
data and screening of anti-metastasis drugs. Int J Oncol.
49:1108–1118. 2016. View Article : Google Scholar : PubMed/NCBI
|
|
16
|
Liu J, Jing L and Tu X: Weighted gene
co-expression network analysis identifies specific modules and hub
genes related to coronary artery disease. BMC Cardiovasc Disord.
16:542016. View Article : Google Scholar : PubMed/NCBI
|
|
17
|
Jha M, Malhotra AG, Singh S and Pandey KM:
Gene co-expression network analysis reveals common system-level
properties of genes involved in tuberculosis across independent
gene expression studies. Netw Model Anal Health Inform Bioinforma.
5:242016. View Article : Google Scholar
|
|
18
|
Tomczak K, Czerwinska P and Wiznerowicz M:
The cancer genome atlas (TCGA): An immeasurable source of
knowledge. Contemp Oncol (Pozn). 19:A68–A77. 2015.PubMed/NCBI
|
|
19
|
Sun D, Chen J, Liu L, Zhao G, Dong P, Wu
B, Wang J and Dong L: Establishment of a 12-gene expression
signature to predict colon cancer prognosis. PeerJ. 6:e49422018.
View Article : Google Scholar : PubMed/NCBI
|
|
20
|
Chen XY, Zhang J, Hou LD, Zhang R, Chen W,
Fan HN, Huang YX, Liu H and Zhu JS: Upregulation of PD-L1 predicts
poor prognosis and is associated with miR-191-5p dysregulation in
colon adenocarcinoma. Int J Immunopathol Pharmacol.
32:20587384187903182018. View Article : Google Scholar : PubMed/NCBI
|
|
21
|
Johnson WE, Li C and Rabinovic A:
Adjusting batch effects in microarray expression data using
empirical Bayes methods. Biostatistics. 8:118–127. 2007. View Article : Google Scholar : PubMed/NCBI
|
|
22
|
Ritchie ME, Phipson B, Wu D, Hu Y, Law CW,
Shi W and Smyth GK: limma powers differential expression analyses
for RNA-sequencing and microarray studies. Nucleic Acids Res.
43:e472015. View Article : Google Scholar : PubMed/NCBI
|
|
23
|
Langfelder P and Horvath S: WGCNA: An R
package for weighted correlation network analysis. BMC
Bioinformatics. 9:5592008. View Article : Google Scholar : PubMed/NCBI
|
|
24
|
Horvath S and Dong J: Geometric
interpretation of gene coexpression network analysis. PLoS Comput
Biol. 4:e10001172008. View Article : Google Scholar : PubMed/NCBI
|
|
25
|
Huang DW, Sherman BT, Tan Q, Kir J, Liu D,
Bryant D, Guo Y, Stephens R, Baseler MW, Lane HC and Lempicki RA:
DAVID bioinformatics resources: Expanded annotation database and
novel algorithms to better extract biology from large gene lists.
Nucleic Acids Res. 35:W169–W175. 2007. View Article : Google Scholar : PubMed/NCBI
|
|
26
|
Kohl M, Wiese S and Warscheid B:
Cytoscape: Software for visualization and analysis of biological
networks. Methods Mol Biol. 696:291–303. 2011. View Article : Google Scholar : PubMed/NCBI
|
|
27
|
Ma C, Lv Q, Teng S, Yu Y, Niu K and Yi C:
Identifying key genes in rheumatoid arthritis by weighted gene
co-expression network analysis. Int J Rheum Dis. 20:971–979. 2017.
View Article : Google Scholar : PubMed/NCBI
|
|
28
|
White RJ: RNA polymerase III transcription
and cancer. Oncogene. 23:3208–3216. 2004. View Article : Google Scholar : PubMed/NCBI
|
|
29
|
Bellido F, Sowada N, Mur P, Lázaro C, Pons
T, Valdés-Mas R, Pineda M, Aiza G, Iglesias S, Soto JL, et al:
Association between germline mutations in BRF1, a subunit of the
RNA polymerase III transcription complex, and hereditary colorectal
cancer. Gastroenterology. 154:181–194. 2018. View Article : Google Scholar : PubMed/NCBI
|
|
30
|
Ozturk HS, Karaayvaz M, Kacmaz M, Kavutcu
M, Akgül H and Durak I: Activities of the enzymes participating in
purine and free-radical metabolism in cancerous human colorectal
tissues. Cancer Biochem Biophys. 16:157–168. 1998.PubMed/NCBI
|
|
31
|
Parker WB: Enzymology of purine and
pyrimidine antimetabolites used in the treatment of cancer. Chem
Rev. 109:2880–2893. 2009. View Article : Google Scholar : PubMed/NCBI
|
|
32
|
Belzil VV, Daoud H, Camu W, Strong MJ,
Dion PA and Rouleau GA: Genetic analysis of SIGMAR1 as a cause of
familial ALS with dementia. Eur J Hum Genet. 21:237–239. 2013.
View Article : Google Scholar : PubMed/NCBI
|
|
33
|
Bernard-Marissal N, Médard JJ, Azzedine H
and Chrast R: Dysfunction in endoplasmic reticulum-mitochondria
crosstalk underlies SIGMAR1 loss of function mediated motor neuron
degeneration. Brain. 138:875–890. 2015. View Article : Google Scholar : PubMed/NCBI
|
|
34
|
Gueguinou M, Crottès D, Chantôme A,
Rapetti-Mauss R, Potier-Cartereau M, Clarysse L, Girault A, Fourbon
Y, Jézéquel P, Guérin-Charbonnel C, et al: The SigmaR1 chaperone
drives breast and colorectal cancer cell migration by tuning
SK3-dependent Ca2+ homeostasis. Oncogene. 36:3640–3647.
2017. View Article : Google Scholar : PubMed/NCBI
|
|
35
|
Sun B, Kawahara M, Ehata S and Nagamune T:
AAG8 promotes carcinogenesis by activating STAT3. Cell Signal.
26:1863–1869. 2014. View Article : Google Scholar : PubMed/NCBI
|
|
36
|
Crottès D, Rapetti-Mauss R, Alcaraz-Perez
F, Tichet M, Gariano G, Martial S, Guizouarn H, Pellissier B,
Loubat A, Popa A, et al: SigmaR1 regulates membrane electrical
activity in response to extracellular matrix stimulation to drive
cancer cell invasiveness. Cancer Res. 76:607–618. 2016. View Article : Google Scholar : PubMed/NCBI
|
|
37
|
Yu F, Ng SS, Chow BK, Sze J, Lu G, Poon
WS, Kung HF and Lin MC: Knockdown of interferon-induced
transmembrane protein 1 (IFITM1) inhibits proliferation, migration,
and invasion of glioma cells. J Neurooncol. 103:187–195. 2011.
View Article : Google Scholar : PubMed/NCBI
|
|
38
|
Rosemond E, Rossi M, McMillin SM,
Scarselli M, Donaldson JG and Wess J: Regulation of M3
muscarinic receptor expression and function by transmembrane
protein 147. Mol Pharmacol. 79:251–261. 2011. View Article : Google Scholar : PubMed/NCBI
|
|
39
|
Khan S, Abdelrahim M, Samudio I and Safe
S: Estrogen receptor/Sp1 complexes are required for induction of
cad gene expression by 17beta-estradiol in breast cancer cells.
Endocrinology. 144:2325–2335. 2003. View Article : Google Scholar : PubMed/NCBI
|
|
40
|
Wilkinson MF and Shyu AB: Multifunctional
regulatory proteins that control gene expression in both the
nucleus and the cytoplasm. Bioessays. 23:775–787. 2001. View Article : Google Scholar : PubMed/NCBI
|
|
41
|
Löffler M, Fairbanks LD, Zameitat E,
Marinaki AM and Simmonds HA: Pyrimidine pathways in health and
disease. Trends Mol Med. 11:430–437. 2005. View Article : Google Scholar : PubMed/NCBI
|
|
42
|
Evans ME, Jones DP and Ziegler TR:
Glutamine inhibits cytokine-induced apoptosis in human colonic
epithelial cells via the pyrimidine pathway. Am J Physiol
Gastrointest Liver Physiol. 289:G388–G396. 2005. View Article : Google Scholar : PubMed/NCBI
|