Introduction
Under normal conditions, lactotransferrin (LTF) may
be detected in human blood, mucosal secretions, gastrointestinal
fluids, urine and, primarily, in milk and colostrum (1). LTF is a member of the transferrin family
that has roles in the innate immune response and is involved in
anti-inflammatory, anti-tumor and anti-microbial activity (2–9). The
LTF gene is polymorphic, and several common alleles occur in
the general population (3,7–9).
Alterations in the LTF gene in cells are associated with an
increased incidence of cancer (10).
Our previous study found that NPC patients had lower rate of the
‘A-G-G-T’ haplotype (composed of rs1126477, rs1126478, rs2073495
and rs9110) compared with cancer-free controls. The population with
the ‘A-G-G-T’ haplotype had a 0.322-fold risk of having
nasopharyngeal carcinoma (NPC). Thus, this haplotype is a
protective factor (3).
NPC has a distinctive ethnic and geographical
distribution, exhibiting a prevalence among the southern Chinese
population with an incidence rate 25-fold higher than the majority
of other countries (11). The
predominant etiological factors that contribute to the development
of NPC comprise infection with Epstein-Barr virus, exposure to
chemical carcinogens or radiation, functional or structural
mutation of oncogenes and tumor suppressor genes, and chromosomal
aberrations (2–6). Some evidence regarding the molecular
bases of NPC has been reported; however, it remains to be fully
clarified. Thus, it is urgent to elucidate the possible role and
mechanism of LTF in NPC.
In multiple myeloma, Stella et al (12) observed that heterozygous carriers of
the glutathione S-transferase P1 gene had reduced expression
compared to those with the homozygous wild type genotype.
Velliyagounder et al (13)
found that a Lys/Arg polymorphism (rs1126478) at position 29 in the
N-terminal region of human LTF produced functional differences, and
that this difference may contribute to the pathogenesis of
localized juvenile periodontitis. Similarly, control individuals
who were G carriers at rs1126478 had significantly lower fasting
triglyceride concentrations and significantly higher high-density
lipoprotein cholesterol concentrations than AA homozygotes
(14). This evidence suggests that
polymorphism of genes may be associated with the expression of
other genes.
In the current study, to identify the molecules
associated with polymorphisms of LTF, the protein and
microRNA (miRNA) profiles of NPC and non-tumor nasopharyngeal
epithelium tissues with/without the ‘A-G-G-T’ haplotype were
constructed.
Materials and methods
Patient samples
A total of 40 participants were recruited between
April and December 2013 at the Cancer Hospital of Hunan Province in
Changsha (China). Written informed consent was obtained from
individual patients, and experimental protocols were approved by
the Institutional Review Board of the Cancer Hospital of Hunan
Province. Patients had histologically-confirmed epithelial NPC
(n=20) or chronic inflammation of the nasopharyngeal mucosa (n=20),
and were living in Hunan Province within one year of diagnosis. All
subjects enrolled in the study were Chinese. There was no
significant difference in distribution of gender and age between
NPC patients and those with non-tumorous nasopharyngeal epithelium
(Table I). Biopsy tissue samples of
NPC and chronic inflammation of nasopharyngeal mucosa were
collected, in addition to peripheral blood samples, and each biopsy
sample was divided into two sections: One was submitted for routine
histological diagnosis, and the remaining section was flash-frozen
and stored at −80°C in liquid nitrogen.
 | Table I.Characteristics of patients with
nasopharyngeal carcinoma and chronic inflammation of nasopharyngeal
mucosa. |
Table I.
Characteristics of patients with
nasopharyngeal carcinoma and chronic inflammation of nasopharyngeal
mucosa.
| Sample ID | WHO histological
diagnosis | ‘A-G-G-T’
haplotypea | TNMb | Grade | Gender | Age (years) |
|---|
| N1 | Chronic
inflammation | With | – | – | Female | 45 |
| N2 | Chronic
inflammation | With | – | – | Female | 39 |
| N3 | Chronic
inflammation | Without | – | – | Male | 60 |
| N4 | Chronic
inflammation | With | – | – | Female | 64 |
| N5 | Chronic
inflammation | Without | – | – | Male | 55 |
| N6 | Chronic
inflammation | Without | – | – | Female | 38 |
| N7 | Chronic
inflammation | Without | – | – | Male | 57 |
| N8 | Chronic
inflammation | With | – | – | Female | 69 |
| N9 | Chronic
inflammation | Without | – | – | Male | 47 |
| N10 | Chronic
inflammation | With | – | – | Male | 48 |
| N11 | Chronic
inflammation | With | – | – | Female | 54 |
| N12 | Chronic
inflammation | With | – | – | Male | 62 |
| N13 | Chronic
inflammation | With | – | – | Female | 63 |
| N14 | Chronic
inflammation | Without | – | – | Male | 39 |
| N15 | Chronic
inflammation | With | – | – | Female | 45 |
| N16 | Chronic
inflammation | Without | – | – | Male | 52 |
| N17 | Chronic
inflammation | Without | – | – | Female | 57 |
| N18 | Chronic
inflammation | Without | – | – | Male | 61 |
| N19 | Chronic
inflammation | With | – | – | Male | 48 |
| N20 | Chronic
inflammation | Without | – | – | Female | 44 |
| T01 | WHO II | Without | T1N0M0 | III | Male | 62 |
| T02 | WHO II | Without | T2N1M0 | II | Female | 41 |
| T03 | WHO II | Without | T4N2M0 | III | Male | 49 |
| T04 | WHO II | With | T4N2M0 | I | Female | 51 |
| T05 | WHO II | With | T4N0M0 | II | Male | 63 |
| T06 | WHO II | Without | T1N0M0 | I | Female | 44 |
| T07 | WHO II | With | T1N3M0 | II | Male | 39 |
| T08 | WHO II | Without | T2N1M0 | I | Female | 57 |
| T09 | WHO II | With | T1N1M0 | IV | Male | 66 |
| T10 | WHO II | With | T1N1M0 | II | Male | 53 |
| T11 | WHO II | Without | T1N0M0 | IV | Female | 48 |
| T12 | WHO II | With | T4N0M0 | III | Male | 50 |
| T13 | WHO II | Without | T1N1M0 | IV | Female | 37 |
| T14 | WHO II | Without | T1N3M0 | II | Male | 59 |
| T15 | WHO II | With | T4N2M0 | III | Male | 67 |
| T16 | WHO II | With | T1N2M0 | I | Female | 46 |
| T17 | WHO II | Without | T1N0M0 | IV | Male | 43 |
| T18 | WHO II | With | T1N0M0 | IV | Male | 58 |
| T19 | WHO II | Without | T2N2M0 | I | Female | 52 |
| T20 | WHO II | With | T3N1M0 | IV | Male | 41 |
Blood collection and genotyping
An extra vial of blood was drawn from the
participants during their scheduled medical visit. DNA was
extracted from 10–15 ml fresh peripheral blood using a BloodGen
Maxi Kit (Takara Biotechnology Co., Ltd., Dalian, China). Genomic
DNA concentrations were adjusted to 50 ng/µl prior to genotyping.
Samples were bar-coded to ensure accurate and reliable sample
processing and storage.
Four SNPs (rs1126477, rs1126478, rs2073495 and
rs9110) of the LTF gene are located in chromosome 3. These
SNPs are located between positions 46480801 and 46501268 on the
chromosome and each can result in a change in its associated amino
acid residue. Genotyping of 20 genomic samples was performed at BGI
Asia (Shenzhen, China) using MassARRAY technology according to a
standard protocol (http://www.genomics.cn) (3,15).
Protein extraction and digestion
The tissue samples of NPC and chronic inflammation
of nasopharyngeal mucosa were lysed using a protein extraction
buffer consisting of 50 mM Tris (pH 7.4), 150 mM NaCl, 1% Triton
X-100, 1% sodium deoxycholate, 0.1% sodium dodecyl sulfate (SDS),
sodium orthovanadate, sodium fluoride, ethylenediaminetetraacetic
acid (EDTA) and leupeptin, supplemented with 1X Halt Protease
Inhibitor Cocktail (CWBiotech, Beijing, China) and 1X Halt
Phosphatase Inhibitor Cocktail (Shanghai Biological BestBio Bebo,
Shanghai, China). The protein concentration was estimated using a
Pierce™ bicinchoninic acid (BCA) assay (Thermo Fisher Scientific,
Inc., Carlsbad, CA, USA). Then, 50 µg of each protein preparation
was loaded on a 10% SDS-polyacrylamide gel electrophoresis (PAGE)
gel. SDS-PAGE was run at 80 V for 40 min, followed by 120 V for 90
min. Protein bands were visualized using Coomassie brilliant blue
G-250 (Sigma-Aldrich, St. Louis, MO, USA) and subsequently excised.
The protein spots were de-stained reduced and alkylated. Next,
trypsin (1.25 µg; 1:20 enzyme/substrate ratio) was added to each
band and in-gel digestion was performed at 37°C overnight (~16 h).
The generated peptides were extracted by sonication (15 min, ice
cooling) of the gel pieces in ~20 µl of 50% acetonitrile (ACN;
Merck Millipore, Darmstadt, Germany) in 0.1% formic acid (FA;
Sigma-Aldrich, St. Louis, MO, USA) twice. Following extraction from
the gel pieces, peptides were concentrated to dryness by
centrifugation in SPD1010 SpeedVac (Themo Fisher Scientific, Inc.)
and re-dissolved with 2% ACN in 0.1% FA prior to liquid
chromatography-tandem mass spectrometry (LC-MS/MS) analysis
(16–18).
LC-MS/MS analysis of peptides
LC-MS/MS analyses were performed on an Ultimate™
3000 RSLCnano system online coupled to an LTQ Orbitrap Velos Pro
mass spectrometer (both Thermo Fisher Scientific, Inc., Bremen,
Germany). Peptides were diluted with 0.1% FA and, for each
analysis, 30 µl of sample was injected. Following injection,
peptides were pre-concentrated with 0.1% FA and 3% ACN on a trap
column (µ-Precolumn C18 PepMap 100; 300 µm × 5 mm, 5 µm, 100 Å;
Thermo Fisher Scientific, Inc.) at a flow rate of 300 nl/min for 5
min. Subsequently, the analyte was transferred to the analytical
column (Acclaim® PepMap RSLC; 75 µm × 15 cm, nano Viper,
C18; 2 µm, 100 Å; Thermo Fisher Scientific, Inc.) and separated
using a 120 min gradient from 5 to 40% solvent B at a flow rate of
300 nl/min (solvent A, 0.1% FA; solvent B, 0.08% FA, 80% ACN). The
mass spectrometer was operated in a data-dependent mode. The
general MS parameters were as follows: Spray voltage, 2.0 kV;
capillary temperature, 275°C. For data-dependent MS/MS analyses,
the software XCalibur (Thermo Fisher Scientific, Inc.) was used.
Full scan MS spectra were acquired at a mass resolution of 60,000
(mass range, 350–2,000 m/z) in the Orbitrap analyzer. For
label-free analyses, tandem mass spectra of the ten most abundant
peaks were acquired in the linear ion trap by peptide fragmentation
using collision-induced dissociation. Normalized collision energy
was set to 35% and an isolation width of 2 m/z was selected
(16–18).
Protein identification and
quantification
Protein identification was performed with Proteome
Discoverer 1.4 software (Themo Fisher Scientific, Inc.). Briefly,
Thermo raw-files were imported and searched against the
UniProtKB/Swiss-Prot database (release 2014_10; http://www.uniprot.org/). For database searches, mass
tolerances were set to 10 ppm and 0.8 Da for precursor and fragment
ions, respectively. Taxonomy was restricted to human, and one
enzymatic miscleavage was allowed. For label-free analyses,
modifications of cysteine (carbamidomethyl, static) and methionine
(oxidation, variable) were considered. Confidence of peptide
identifications was estimated using the percolator function,
implemented in Proteome Discoverer. Instead of determining the
peptide confidence based on a single metric-like Mascot ion score,
the percolator was used as it discriminates correct from incorrect
peptide spectrum matches based on multiple orthogonal score
criteria, leading to accurate and sensitive peptide
identifications. Peptide identifications with false discovery rates
≤1% (q-value ≤0.01) were discarded.
Western blot analysis
Proteins from biopsy samples were prepared with
lysis buffer [1% Nonidet P-40; 50 mM Tris-HCl, pH 7.5; 50 mM NaF; 2
mM EDTA; 10% glycerol; plus complete protease inhibitor mixture
(Roche Diagnostics, Indianapolis, USA) with NaCl adjusted to 400
mM]. The protein concentrations were determined using a Pierce™ BCA
protein assay. Extracts containing 50 µg of proteins were separated
on 10% SDS-PAGE gels and electroblotted onto Hyclone™
nitrocellulose membranes (GE Healthcare Life Sciences, Logan, UT,
USA). The membranes were blocked using Tris-buffered saline/Tween
20 (25 mM Tris-HCl; 150 mM NaCl, pH 7.5; 0.05% Tween 20) containing
5% non-fat milk, followed by overnight incubation at 4°C with
primary antibodies against the N-terminus of human c-Jun N-terminal
kinase 2 [JNK2; rabbit polyclonal immunoglobulin (Ig)G; dilution,
1:500; catalogue number sc-827; Santa Cruz Biotechnology, Inc.,
Santa Cruz, Dallas, TX, USA] and against full-length human GAPDH
(mouse monoclonal IgG1; dilution, 1:3,000; catalogue number
sc-365062; Santa Cruz Biotechnology, Inc.). Following three washes,
goat anti-rabbit IgG horseradish peroxidase-conjugated secondary
antibody (dilution, 1:5,000; catalogue number sc-2030; Santa Cruz
Biotechnology, Inc.) were added, and incubated for 1 h. The signals
were visualized using an enhanced chemiluminescence detection
system (Universal Hood II; Bio-Rad Laboratories, Inc., Hercules,
CA, USA) with Image Lab™ software version 2.0 (Bio-Rad
Laboratories, Inc.).
miRNA microarray assay
Microarray assays of NPC tissues and non-tumor
nasopharyngeal epithelium tissues miRNAs were outsourced to
Shanghai OE Biotech Co., Ltd. (Shanghai, China). To enrich global
miRNA, total RNA extract was purified using Ambion®
mirVana™ miRNA Isolation Kit (Thermo Fisher Scientific, Inc.,
Carlsbad, CA, USA), and then labeled and hybridized. Briefly, 100
ng of miRNA was labeled using the Agilent miRNA Complete Labeling
and Hybridization Kit (Agilent Technologies, Inc., Santa Clara, CA,
USA) according to the manufacturer's instructions. The labeled RNA
was hybridized to the Agilent human miRNA microarray, which
contains probes for 1,205 human miRNAs and 144 human viral miRNAs
from the Sanger database (version 16.0) according to the
manufacturer's instructions. Arrays were scanned with the
Affymetrix GeneChip® Scanner 3000 (Agilent Technologies,
Inc.), and the raw data were normalized and analyzed by GeneSpring
GX software version 7.3 (Agilent Technologies, Inc.). The
GeneSpring software generated an average value for each miRNA from
the repeated probes. Microarray assay was performed in triplicates,
utilizing three independent sets of RNA preparations. miRNA signal
intensities were log2 transformed, and analyzed for
differentially expressed miRNAs by using the Significance Analysis
of Microarrays (version 3.01), and the P-values of the
t-test were calculated. Differentially detected miRNA
signals with ≥1.5 fold-change and P<0.05 were considered
statistically significant. Differentially expressed miRNAs detected
in the triplicate experiments were selected for further
analysis.
Validation of differential miRNAs
To validate the reliability of microarray data,
reverse transcription (RT)-quantitative polymerase chain reaction
(qPCR) was performed to detect the levels of hsa-miR-1256,
hsa-miR-659 and hsa-miR-298 in NPC and non-tumor nasopharyngeal
epithelium tissues with and without the ‘A-G-G-T’ haplotype. For
miRNA RT-qPCR, 2 µg of total RNA was extracted from NPC and
non-tumor nasopharyngeal epithelium tissues with TRIzol reagent
(Qiagen GmbH, Hilden, Germany), and reverse transcribed into cDNA
with an RT kit according to the manufacturer's instructions
(Promega Corporation, Madison, WI, USA), using miRNA specific
primers (hsa-miR-1256, hsa-miR-659 and hsa-miR-298; Bulge-Loop™
miRNA qPCR primers), which were synthesized by Guangzhou RiboBio
Co., Ltd. (Guangzhou, China). The RT products were amplified by
qPCR in a CFX Connect Real-Time PCR Detection System (Bio-Rad
Laboratories, Inc.) using the miScript SYBR Green PCR kit (Qiagen
GmbH) according to the manufacturer's instructions. The cycling
conditions were as follows: 95°C for 10 min, followed by 40 cycles
of 95°C for 15 sec and 60°C for 1 min. U6 was used as the internal
control. The relative expression was calculated based on the
comparative quantification cycle method (19) using Bio-Rad CFK manager software
version 2.0 (Bio-Rad Laboratories, Inc.). The experiments were
repeated three times.
Statistical analysis
Distribution of age/gender was compared across cases
by status using χ2 tests. Haplotyper (http://www.people.fas.harvard.edu/~junliu/Haplo/click.html)
software was used for haplotype inference (20–22).
Differences in quantitative variables between groups were analyzed
by the Student's t-test using SPSS version 13.0 (SPSS, Inc.,
Chicago, IL, USA). P<0.05 was considered to indicate
statistically significant differences.
Results
Identification of differentially
expressed proteins in NPC tissues between those with and without
the ‘A-G-G-T’ haplotype
To identify the differentially expressed proteins in
NPC tissues between those with and without the ‘A-G-G-T’ haplotype,
the protein profiles of NPC tissues were constructed using LTQ
Orbitrap technology. This revealed 176 proteins that were only
present in NPC tissues with the ‘A-G-G-T’ haplotype, and 154
proteins that only appeared in NPC tissues without the ‘A-G-G-T’
haplotype. According to the frequency of unique peptides, SAP
domain-containing ribonucleoprotein was the highest in NPC tissues
with the ‘A-G-G-T’ haplotype, followed by transducin-like enhancer
of split 2, and 2,4-dienoyl CoA reductase 1 mitochondrial. Ring
finger protein 44 was the highest in NPC tissues without the
‘A-G-G-T’ haplotype, and the second was JNK2. Full details of the
top 20 proteins in NPC tissues with/without the ‘A-G-G-T’ haplotype
are presented in Table II.
| Table II.Differentially expressed genes in NPC
tissues between those with and those without the ‘A-G-G-T’
haplotype. |
Table II.
Differentially expressed genes in NPC
tissues between those with and those without the ‘A-G-G-T’
haplotype.
|
| NPC tissues with
‘A-G-G-T’ haplotype | NPC tissues without
‘A-G-G-T’ haplotype |
|---|
|
|
|
|
|---|
| Rank | Genea | Unique
peptidesb |
Coveragec (%) | Protein
scored | Genea | Unique
peptidesb |
Coveragec (%) | Protein
scored |
|---|
| 1 | SARNP | 20 | 60.18 | 201.61 | RNF44 | 27 | 42.47 | 187.91 |
| 2 | TLE2 | 19 | 59.17 | 270.20 | JNK2 | 27 | 42.24 | 182.95 |
| 3 | DECR1 | 17 | 49.40 | 175.15 | GNPDA1 | 22 | 33.22 | 156.63 |
| 4 | RNF207 | 16 | 26.03 | 159.53 | WARS2 | 19 | 41.31 | 130.17 |
| 5 | EXOSC2 | 16 | 46.82 |
90.21 | PACSIN2 | 18 | 32.57 | 123.24 |
| 6 | IGSF22 | 15 | 52.50 | 182.41 | PGK1 | 16 | 27.93 | 122.51 |
| 7 | PMFBP1 | 14 | 45.16 | 158.00 | MITD1 | 16 | 47.62 | 108.82 |
| 8 | PSMG2 | 14 | 34.12 | 186.88 | MTX2 | 16 | 48.98 |
91.49 |
| 9 | ZNF469 | 14 | 47.57 | 138.74 | DPM1 | 15 | 25.80 |
78.52 |
| 10 | UCK2 | 14 | 43.85 |
69.90 | MTCH2 | 14 | 24.75 |
74.95 |
| 11 | EXOSC3 | 13 | 51.69 |
75.30 | DERA | 13 | 54.35 |
70.71 |
| 12 | STK36 | 13 | 45.51 |
65.20 | SUGT1 | 13 | 39.45 |
66.02 |
| 13 | PNPO | 12 | 50.16 | 120.21 | RFC5 | 11 | 52.43 |
64.83 |
| 14 | CALCOCO1 | 12 | 46.42 | 100.79 | SYNE1 | 11 | 35.27 |
63.10 |
| 15 | SYPL1 | 12 | 62.67 |
89.77 | GSR | 10 | 36.84 |
61.74 |
| 16 | MAPK8IP3 | 12 | 54.73 |
69.40 | ZNF106 | 10 | 57.72 |
61.35 |
| 17 | ATP8A1 | 12 | 55.36 | 110.40 | SCO1 | 10 | 38.00 |
59.86 |
| 18 | EEF1D | 12 | 56.22 | 158.47 | PSMA4 | 10 | 42.16 |
55.18 |
| 19 | UTP11L | 12 | 47.73 | 122.66 | GNB1 | 10 | 23.99 |
54.65 |
| 20 | CAPRIN1 | 12 | 44.49 |
91.04 | CIP29 | 10 | 23.73 |
52.38 |
Identification of differentially
expressed proteins in non-tumor nasopharyngeal epithelium tissues
between those with and without the ‘A-G-G-T’ haplotype
To explore the different proteins in non-tumor
nasopharyngeal epithelium tissues according to the presence of the
‘A-G-G-T’ haplotype, the protein profiles of non-tumor
nasopharyngeal epithelium tissues were constructed as described.
This identified 162 proteins that were only present in non-tumor
nasopharyngeal epithelium tissues with the ‘A-G-G-T’ haplotype, and
180 proteins that only appeared in non-tumor nasopharyngeal
epithelium tissues without the ‘A-G-G-T’ haplotype. According to
the frequency of unique peptides, pre-mRNA processing factor 4B was
the highest in non-tumor nasopharyngeal epithelium tissue with the
‘A-G-G-T’ haplotype, followed by proteasome (prosome, macropain)
activator subunit 2 (PA28 β), WD repeat domain 61, and enoyl-CoA
delta isomerase 1. Heterogeneous nuclear ribonucleoprotein A/B was
the highest in non-tumor nasopharyngeal epithelium tissue without
the ‘A-G-G-T’ haplotype. The JNK2 protein was also in the list of
the top 20 different proteins in tissues without the ‘A-G-G-T’
haplotype. Full details of the top 20 proteins in non-tumor
nasopharyngeal epithelium tissues with/without the ‘A-G-G-T’
haplotype are presented in Table
III. Notably, JNK2 protein was present in NPC tissue and
non-tumor nasopharyngeal epithelium tissues without the ‘A-G-G-T’
haplotype.
| Table III.Differentially expressed genes in
non-tumor nasopharyngeal epithelium tissues between those with and
those without the ‘A-G-G-T’ haplotype. |
Table III.
Differentially expressed genes in
non-tumor nasopharyngeal epithelium tissues between those with and
those without the ‘A-G-G-T’ haplotype.
|
| Non-tumor
nasopharyngeal epithelium tissues with ‘A-G-G-T’ haplotype | Non-tumor
nasopharyngeal epithelium tissues without ‘A-G-G-T’ haplotype |
|---|
|
|
|
|
|---|
| Rank | Genea | Unique
peptidesb |
Coveragec (%) | Protein
scored | Genea | Unique
peptidesb |
Coveragec (%) | Protein
scored |
|---|
| 1 | PRPF4B | 19 | 59.29 | 135.21 | HNRNPAB | 32 | 56.05 | 147.23 |
| 2 | PSME2 | 19 | 54.44 | 78.39 | RALYL | 25 | 48.49 | 81.92 |
| 3 | WDR61 | 16 | 37.95 | 60.94 | FAM49B | 22 | 42.81 | 70.34 |
| 4 | ECI1 | 12 | 42.81 | 64.96 | GNB2 | 22 | 37.01 | 68.36 |
| 5 | FLNB | 11 | 22.95 | 43.52 | MLEC | 21 | 52.37 | 76.00 |
| 6 | SNRPA | 11 | 58.23 | 61.73 | AK2 | 21 | 16.10 | 64.23 |
| 7 | PSMA7 | 9 | 34.03 | 56.65 | NIT2 | 20 | 40.07 | 53.41 |
| 8 | NUDT21 | 8 | 15.96 | 62.85 | PNP | 19 | 19.72 | 62.36 |
| 9 | EIF3J | 7 | 41.91 | 51.31 | TTLL5 | 17 | 49.00 | 77.06 |
| 10 | PSMG1 | 6 | 51.79 | 51.16 | HNRNPC | 15 | 37.57 | 49.18 |
| 11 | PNP | 6 | 24.07 | 60.41 | EFHD2 | 15 | 44.64 | 58.63 |
| 12 | HPRT1 | 6 | 39.70 | 45.02 | JNK2 | 14 | 40.18 | 47.68 |
| 13 | ANXA4 | 5 | 43.44 | 44.42 | SNRPB2 | 13 | 20.34 | 66.65 |
| 14 | PRPS1L1 | 5 | 37.15 | 41.81 | PSMA4 | 13 | 55.56 | 45.61 |
| 15 | HSPH1 | 5 | 36.07 | 40.28 | HIBADH | 13 | 28.03 | 54.89 |
| 16 | FUBP1 | 5 | 36.59 | 37.52 | TSN | 12 | 48.63 | 53.78 |
| 17 | ATP5C1 | 4 | 42.97 | 46.49 | CTSD | 12 | 36.29 | 42.85 |
| 18 | SUCLG1 | 4 | 37.65 | 35.93 | ATP1B3 | 12 | 38.16 | 62.46 |
| 19 | YWHAH | 4 | 31.50 | 55.79 | PSME3 | 11 | 37.55 | 51.43 |
| 20 | HSD17B10 | 4 | 35.92 | 44.11 | PSMD8 | 11 | 41.91 | 41.26 |
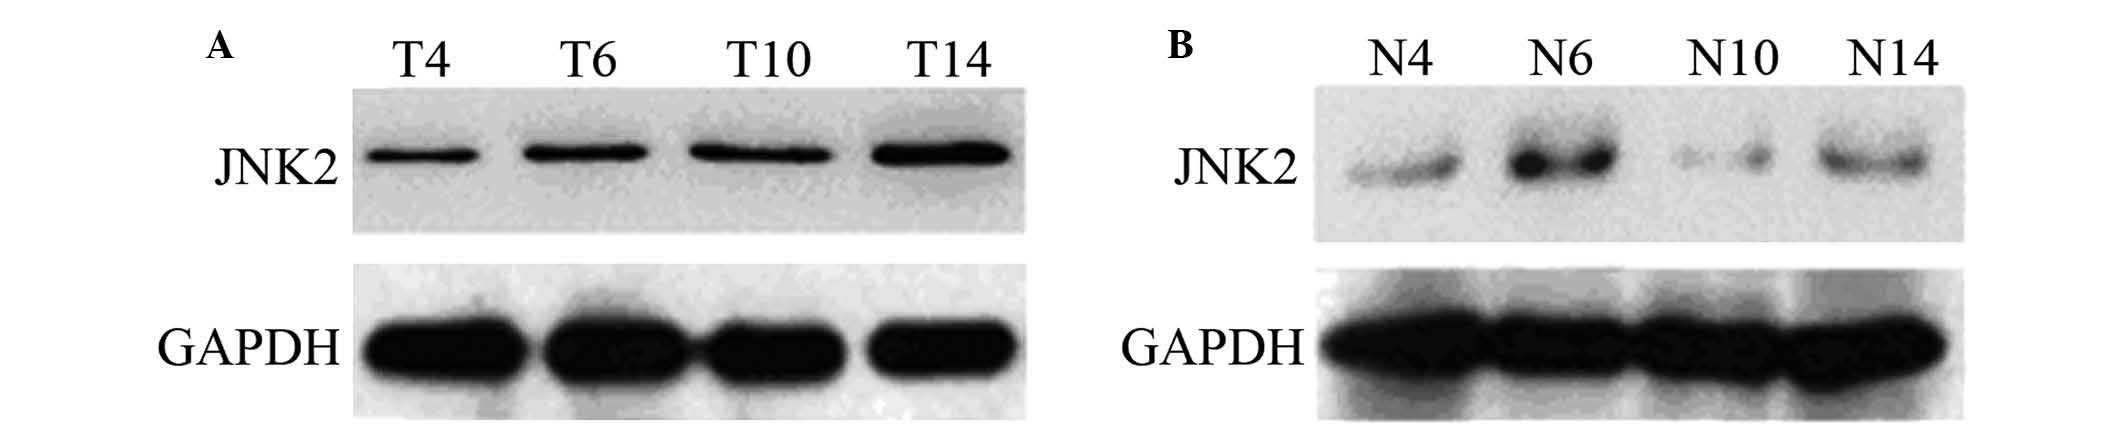
Validation of JNK2 protein by western
blotting
Through LTQ Orbitrap technology, JNK2 protein was
found to be present in NPC tissue and non-tumor nasopharyngeal
epithelium tissues without the ‘A-G-G-T’ haplotype. This suggested
that the expression levels of JNK2 may be associated with
polymorphic LTF haplotypes in human NPC. To verify whether
JNK2 was upregulated in NPC tissue and non-tumor nasopharyngeal
epithelium tissues without the ‘A-G-G-T’ haplotype, the expression
level of JNK2 was assessed in 4 NPC samples and 4 non-tumor
nasopharyngeal epithelium samples by western blotting. Whether in
the NPC tissues or non-tumor nasopharyngeal epithelium tissues,
JNK2 was higher in tissues without the ‘A-G-G-T’ haplotype than
with the ‘A-G-G-T’ haplotype. However, the overall expression level
of JNK2 was lower in non-tumor nasopharyngeal epithelium tissues
than NPC tissues (Fig. 1). This
confirmed the reliability of the results obtained by LTQ Orbitrap
technology, and confirmed that JNK2 was higher in tissues without
the ‘A-G-G-T’ haplotype than with the ‘A-G-G-T’ haplotype.
miRNAs differentially expressed in NPC
tissues between those with and without the ‘A-G-G-T’ haplotype
miRNA microarray analysis was conducted to
investigate the differentially expressed miRNA profiles of NPC
tissues with/without the ‘A-G-G-T’ haplotype. This analysis
identified 104 miRNAs that had lower expression in NPC tissue with
the ‘A-G-G-T’ haplotype and 83 miRNAs that had higher expression in
NPC tissue with the ‘A-G-G-T’ haplotype. According to the fold
change, hsa-miR-720 had the highest downregulated fold change in
NPC tissue with the ‘A-G-G-T’ haplotype, followed by hsa-miR-218
and hsa-miR-1274b (Table IV).
However, hsa-miR-17 had the highest upregulated fold change in NPC
tissue without the ‘A-G-G-T’ haplotype, followed by hsa-miR-29b and
hsa-miR-1256. Details of the top 20 miRNAs are presented in
Table IV.
| Table IV.MicroRNAs differentially expressed in
NPC tissues between those with and those without the ‘A-G-G-T’
haplotype. |
Table IV.
MicroRNAs differentially expressed in
NPC tissues between those with and those without the ‘A-G-G-T’
haplotype.
|
| Downregulated
microRNAa | Upregulated
microRNAa |
|---|
|
|
|
|
|---|
| Rank | Systematic
name | Fold change | Systematic
name | Fold change |
|---|
| 1 | hsa-miR-720 | 36.09 | hsa-miR-17 | 34.09 |
| 2 | hsa-miR-218 | 28.19 | hsa-miR-29b | 32.56 |
| 3 | hsa-miR-1274b | 28.05 | hsa-miR-1256 | 30.26 |
| 4 | hsa-miR-205 | 25.20 | hsa-miR-23a | 29.44 |
| 5 | hsa-miR-221 | 22.22 | hsa-miR-21 | 25.53 |
| 6 | hsa-miR-2276 | 21.15 | hsa-miR-20a | 24.54 |
| 7 |
hsa-miR-2355-5p | 20.69 | hsa-miR-103 | 24.14 |
| 8 | hsa-miR-19b | 20.44 | hsa-miR-15b | 23.95 |
| 9 | hsa-miR-20a | 19.76 | hsa-miR-22 | 22.47 |
| 10 | hsa-miR-16 | 18.06 | hsa-miR-27a | 21.74 |
| 11 | hsa-miR-24 | 18.05 | hsa-miR-100 | 20.63 |
| 12 | hsa-miR-2909 | 17.24 | hsa-miR-27b | 19.25 |
| 13 | hsa-miR-205 | 17.24 | hsa-miR-200b | 18.12 |
| 14 | hsa-miR-1260 | 16.59 | hsa-miR-659 | 16.89 |
| 15 | hsa-miR-296-5p | 15.66 | hsa-miR-494 | 16.39 |
| 16 | hsa-miR-4286 | 15.49 | hsa-miR-29a | 16.29 |
| 17 | hsa-miR-1260b | 13.84 | hsa-miR-31 | 14.53 |
| 18 | hsa-miR-24 | 13.49 | hsa-miR-141 | 13.23 |
| 19 | hsa-miR-200c | 13.16 | hsa-miR-19a | 13.08 |
| 20 | hsa-miR-4284 | 12.80 | hsa-miR-320d | 13.04 |
The top 20 miRNAs that were dysregulated in NPC were
further analyzed to predict their target genes; hsa-miR-1256 and
hsa-miR-659, which were downregulated in NPC tissues without the
‘A-G-G-T’ haplotype, are potentially targeted to the JNK2
gene.
miRNAs differentially expressed in
non-tumor nasopharyngeal epithelium tissues between those with and
without the ‘A-G-G-T’ haplotype
miRNA microarray analysis of non-tumor
nasopharyngeal epithelium tissues with/without the ‘A-G-G-T’
haplotype was conducted. This revealed that, in non-tumor
nasopharyngeal epithelium tissue with the ‘A-G-G-T’ haplotype, 79
miRNAs had lower expression and 137 miRNAs had higher expression.
According to the fold change, hsa-miR-18a-5p had the highest fold
downregulation in non-tumor nasopharyngeal epithelium tissues with
the ‘A-G-G-T’ haplotype, followed by hsa-miR-29b-3p and
hsa-miR-1249. However, hsa-miR-652-3p had the highest fold
upregulation in non-tumor nasopharyngeal epithelium tissue without
the ‘A-G-G-T’ haplotype, followed by hsa-miR-664-3p,
hsa-miR-24-1-5p and hsa-miR-298. Details of the top 20 miRNAs are
presented in Table V.
| Table V.MicroRNAs differentially expressed in
non-tumor nasopharyngeal epithelium tissues between those with and
those without the ‘A-G-G-T’ haplotype. |
Table V.
MicroRNAs differentially expressed in
non-tumor nasopharyngeal epithelium tissues between those with and
those without the ‘A-G-G-T’ haplotype.
|
| Downregulated
microRNAa | Upregulated
microRNAa |
|---|
|
|
|
|
|---|
| Rank | Systematic
name | Fold change | Systematic
name | Fold change |
|---|
| 1 | hsa-miR-18a-5p | 72.94 | hsa-miR-652-3p | 69.10 |
| 2 | hsa-miR-29b-3p | 50.51 | hsa-miR-664-3p | 58.78 |
| 3 | hsa-miR-1249 | 40.58 |
hsa-miR-24-1-5p | 58.10 |
| 4 | hsa-miR-27a | 39.70 | hsa-miR-298 | 48.01 |
| 5 | hsa-miR-185-5p | 36.31 | hsa-miR-3646 | 47.66 |
| 6 | hsa-miR-28-5p | 36.26 | hsa-miR-223 | 37.53 |
| 7 | hsa-miR-3907 | 36.03 | hsa-miR-3125 | 37.24 |
| 8 | hsa-miR-483-3p | 35.38 | hsa-miR-660-5p | 37.23 |
| 9 | hsa-miR-1288 | 34.73 | hsa-miR-128 | 36.88 |
| 10 |
hsa-miR-16-2-3p | 31.73 | hsa-miR-744-5p | 34.01 |
| 11 | hsa-miR-877-3p | 25.88 | hsa-miR-582-5p | 30.05 |
| 12 |
hsa-miR-19b-1-5p | 25.07 | hsa-miR-26a | 28.69 |
| 13 | hsa-miR-27b | 24.83 | hsa-miR-1470 | 28.59 |
| 14 | hsa-miR-132-3p | 24.78 | hsa-miR-140-5p | 28.41 |
| 15 | hsa-miR-542-5p | 23.61 |
hsa-miR-374b-5p | 28.34 |
| 16 | hsa-miR-2861 | 23.16 | hsa-miR-3197 | 23.33 |
| 17 | hsa-miR-296-5p | 22.51 | hsa-miR-23b | 22.53 |
| 18 | hsa-miR-3907 | 22.22 | hsa-miR-192-5p | 22.47 |
| 19 | hsa-miR-362-5p | 28.72 | hsa-miR-99a-5p | 22.47 |
| 20 | hsa-miR-505-3p | 28.24 | hsa-miR-205-3p | 22.40 |
The top 20 miRNAs dysregulated in non-tumor
nasopharyngeal epithelium tissue were further analyzed to predict
their target genes, and this revealed that hsa-miR-298 was
downregulated in non-tumor nasopharyngeal epithelium tissue without
the ‘A-G-G-T’ haplotype and is potentially targeted to the
JNK2 gene.
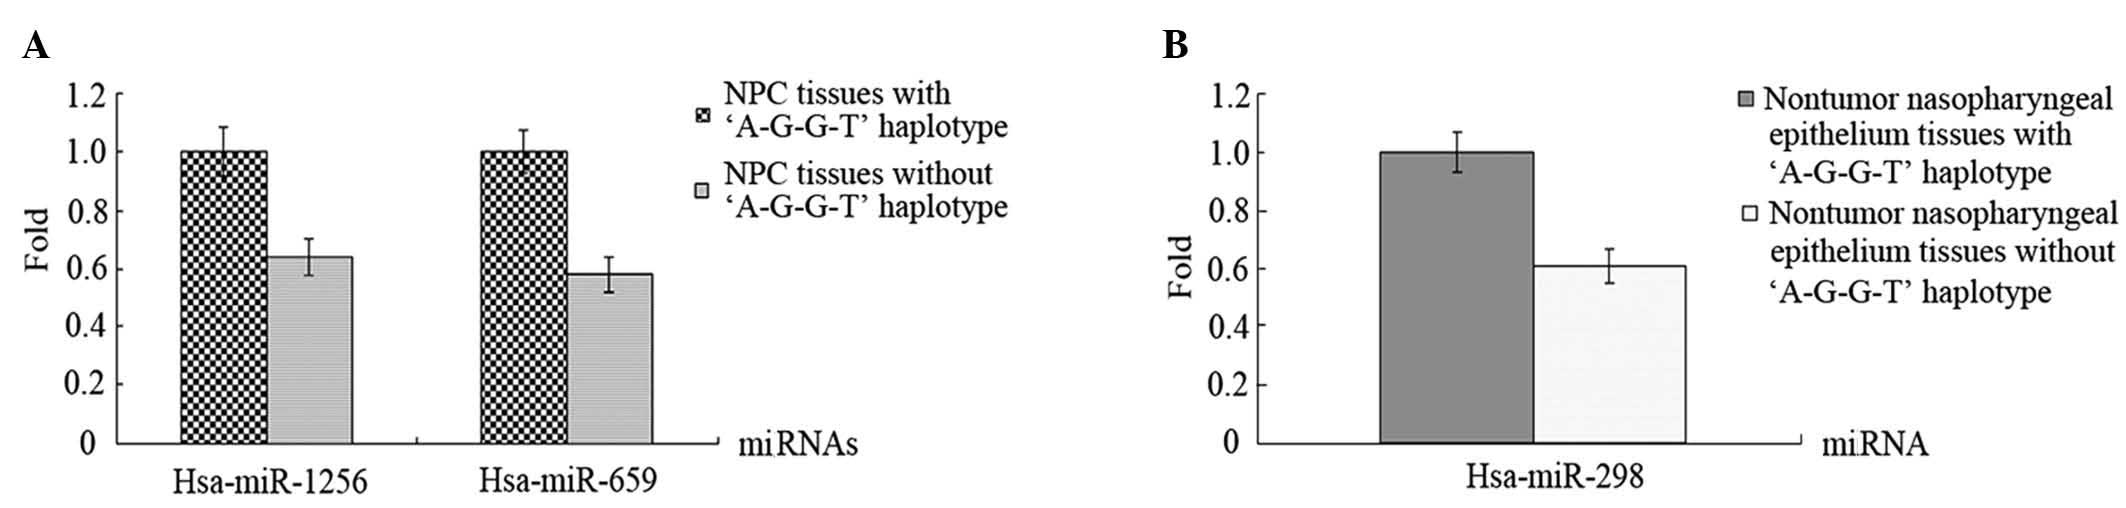
Validation of hsa-miR-1256,
hsa-miR-659 and hsa-miR-298
The results of the differential protein profiles
indicated that the expression levels of JNK2 may be associated with
polymorphic LTF haplotypes in human NPC. The results of
miRNA microarray analyses revealed that hsa-miR-1256, hsa-miR-659
and hsa-miR-298, which are potentially targeted to the JNK2
gene, were downregulated in NPC/non-tumor nasopharyngeal epithelium
tissues without the ‘A-G-G-T’ haplotype (Fig. 2). Thus, these miRNAs (hsa-miR-1256,
hsa-miR-659, and hsa-miR-298) were selected for RT-qPCR evaluation
in 12 NPC tissues and 12 non-tumor nasopharyngeal epithelium
tissues. The results revealed that hsa-miR-1256 and hsa-miR-659
were downregulated in NPC tissues without the ‘A-G-G-T’ haplotype
compared with tissues with the ‘A-G-G-T’ haplotype; the fold
changes were 0.64 (P=0.027) and 0.58 (P=0.031), respectively.
Hsa-miR-298 was 0.61-fold downregulated in non-tumor nasopharyngeal
epithelium tissues without the ‘A-G-G-T’ haplotype relative to
tissues with the ‘A-G-G-T’ haplotype (P=0.019).
Discussion
LTF protein is a ubiquitous and abundant component
of human exocrine secretions. As a member of the transferrin
family, LTF is an iron-binding glycoprotein, and has been
demonstrated to have multiple physiological functions. LTF is also
present in specific granules of neutrophils (23–28). Its
functions include roles in the immune response and the regulation
of bone metabolism. LTF also sequesters essential iron to inhibit
bacterial growth, as well as exhibiting non-iron-dependent
antibacterial, antitumor, antiviral, antifungal, anti-inflammatory
and immunoregulatory activities (23–28).
In the current study, JNK2 protein was determined to
be upregulated in NPC tissues and non-tumor nasopharyngeal
epithelium tissues without the ‘A-G-G-T’ haplotype. This suggested
that the expression levels of JNK2 may be associated with
polymorphic LTF haplotypes in human NPC. Western blot
analyses confirmed the reliability of the results obtained by LTQ
Orbitrap technology, and verified that JNK2 was higher in the
NPC/non-tumor nasopharyngeal epithelium tissues without the
‘A-G-G-T’ haplotype than with the ‘A-G-G-T’ haplotype. Huang et
al (29) reported that NAG7
promoted human NPC invasion and had a potential role in promoting
NPC invasion via the regulation of estrogen receptor α and the
H-Ras/p-c-Raf and JNK2/activator protein 1/matrix metalloproteinase
1 signaling pathways. Raciti et al (30) reported that JNK2 prevented the
accumulation of the acidic compartment in U937 cells undergoing
autophagic flux and contributed to the survival of stressed cells
(30). JNK1/2 deficiency has also
been shown to increase branching morphogenesis and lead to defects
in the clearance of lumenal epithelial cells. In the context of
breast cancer development, deficiencies in JNK1/2 led to a
significant increase in tumor formation (31). Radovich et al (32) reported that haplotypes in the vascular
endothelial growth factor (VEGF) gene affected its gene expression.
Furthermore, our previous study demonstrated that LTF inhibited the
levels of c-Jun, c-Fos and JNK2 expression in NPC cell lines
(4). Collectively, this evidence
indicates that JNK2 may serve an important role in malignancy and
that LTF may affect the expression of JNK2.
miRNAs (miRNAs) are a class of small non-coding RNAs
that are non-randomly distributed in the genome, and alterations in
the expression of these molecules have been reported in multiple
types of cancer, including NPC (33–35). The
present study aimed to investigate whether the miRNAs that
potentially target JNK2 have altered expression in
NPC/non-tumor nasopharyngeal epithelium tissues without the
‘A-G-G-T’ haplotype. miRNA microarray analyses of NPC/non-tumor
nasopharyngeal epithelium tissues with/without the ‘A-G-G-T’
haplotype were performed. The results revealed that hsa-miR-1256
and hsa-miR-659, which potentially target the JNK2 gene,
were downregulated in NPC tissues without the ‘A-G-G-T’ haplotype
relative to those with the ‘A-G-G-T’ haplotype, with fold changes
of 0.64 and 0.58, respectively. Hsa-miR-298, another miRNA
potentially targeting JNK2, was 0.61-fold downregulated in
non-tumor nasopharyngeal epithelium tissues without the ‘A-G-G-T’
haplotype relative to those with the ‘A-G-G-T’ haplotype. Werk
et al (36) found a
differential suppression of ATP-binding cassette C2 by miR-379 was
caused by haplotype-dependent differences in mRNA secondary
structures, resulting in changes in mRNA target accessibility or
mRNA stability. A study by Koelsch et al (37) supported the notion that variants
within the methyl CpG binding protein 2 gene could alter DNA
methylation in other genetic loci, including the human leukocyte
antigen and interferon-regulated genes. Li et al (38) found that isoflavone could increase the
levels of miR-29a and miR-1256 and decrease expression of
tripartite motif-containing 68 and phosphoglycerate kinase 1, which
was mechanistically linked with inhibition of prostate cancer cell
growth and invasion. The result of the study by Bao et al
(39) suggested that miR-298 directly
modulated multidrug resistance protein 1 (P-glycoprotein)
expression and was associated with the chemoresistant mechanisms of
metastatic human breast cancer.
In the present study, JNK2 protein was confirmed to
be upregulated in NPC and non-tumor nasopharyngeal epithelium
tissues without the ‘A-G-G-T’ haplotype by western blotting. In
addition, hsa-miR-1256, hsa-miR-659 and hsa-miR-298 were predicted
to be targets of the JNK2 gene, and the data confirmed that
hsa-miR-1256 and hsa-miR-659 were downregulated in NPC tissues
without the ‘A-G-G-T’ haplotype, compared with tissues with the
‘A-G-G-T’ haplotype, while hsa-miR-298 was 0.61-fold downregulated
in non-tumor nasopharyngeal epithelium tissues without the
‘A-G-G-T’ haplotype, compared with tissues with the ‘A-G-G-T’
haplotype. Furthermore, the current miRNA analysis results also
confirmed that JNK2 protein was upregulated in NPC and non-tumor
nasopharyngeal epithelium tissues without the ‘A-G-G-T’
haplotype.
In conclusion, the present study demonstrated that
the expression levels of JNK2 are associated with polymorphic
LTF haplotypes in human NPC. However, further studies are
required to investigate the mechanism of the association between
LTF polymorphisms and expression level of JNK2 in normal
nasopharyngeal epithelial tissues, and the pathological
implications in the development of NPC.
Acknowledgements
This work was supported by National Natural Science
Foundation of China (nos. 81272975, 81172302 and 81402270); the Key
Project of Hunan Provincial Natural Science Foundation (no.
12JJ2044); the Project of Hunan Provincial Natural Science
Foundation (no. 12JJ3121); Project of Hunan Provincial Development
and Reform Commission; the Planned Science and Technology Project
of Hunan Province (nos. 2010FJ3088, 2012FJ2014); and the Open-End
Fund for the Valuable and Precision Instruments of Central South
University.
Glossary
Abbreviations
Abbreviations:
|
NPC
|
nasopharyngeal carcinoma
|
|
LTF
|
lactotransferrin
|
|
JNK2
|
c-Jun N-terminal kinase 2
|
|
GADPH
|
glyceraldehyde-3-phosphate
dehydrogenase
|
References
|
1
|
Tuccari G and Barresi G: Lactoferrin in
human tumours: Immunohistochemical investigations during more than
25 years. Biometals. 24:775–84. 2011. View Article : Google Scholar : PubMed/NCBI
|
|
2
|
Deng M, Zhang W, Tang H, Ye Q, Liao Q,
Zhou Y, Wu M, Xiong W, Zheng Y, Guo X, et al: Lactotransferrin acts
as a tumor suppressor in nasopharyngeal carcinoma by repressing AKT
through multiple mechanisms. Oncogene. 32:4273–4283. 2013.
View Article : Google Scholar : PubMed/NCBI
|
|
3
|
Zhou Y, Wang W, Zheng D, Peng S, Xiong W,
Ma J, Zeng Z, Wu M, Zhou M, Xiang J, et al: Risk of nasopharyngeal
carcinoma associated with polymorphic lactotransferrin haplotypes.
Med Oncol. 29:1452–1462. 2012. View Article : Google Scholar
|
|
4
|
Zhou Y, Zeng Z, Zhang W, Xiong W, Wu M,
Tan Y, Yi W, Xiao L, Li X, Huang C, et al: Lactotransferrin: A
candidate tumor suppressor-deficient expression in human
nasopharyngeal carcinoma and inhibition of NPC cell proliferation
by modulating the mitogen-activated protein kinase pathway. Int J
Cancer. 123:2065–2072. 2008. View Article : Google Scholar : PubMed/NCBI
|
|
5
|
Zhou Y, Zeng Z, Zhang W, Xiong W, Li X,
Zhang B, Yi W, Xiao L, Wu M, Shen S, et al: Identification of
candidate molecular markers of nasopharyngeal carcinoma by
microarray analysis of subtracted cDNA libraries constructed by
suppression subtractive hybridization. Eur J Cancer Prev.
17:561–571. 2008. View Article : Google Scholar : PubMed/NCBI
|
|
6
|
Ye Q, Zheng Y, Fan S, Qin Z, Li N, Tang A,
Ai F, Zhang X, Bian Y, Dang W, et al: Lactoferrin deficiency
promotes colitis-associated colorectal dysplasia in mice. PLoS One.
9:e1032982014. View Article : Google Scholar : PubMed/NCBI
|
|
7
|
Teng CT and Gladwell W: Single nucleotide
polymorphisms (SNPs) in human lactoferrin gene. Biochem Cell Biol.
84:381–384. 2006. View
Article : Google Scholar : PubMed/NCBI
|
|
8
|
Azevedo LF, Pecharki GD, Brancher JA,
Cordeiro CA Jr, Medeiros KG, Antunes AA, Arruda ES, Werneck RI, de
Azevedo LR, Mazur RF, et al: Analysis of the association between
lactotransferrin (LTF) gene polymorphism and dental caries. J Appl
Oral Sci. 18:166–170. 2010. View Article : Google Scholar : PubMed/NCBI
|
|
9
|
Bahar B, O'Halloran F, Callanan MJ,
McParland S, Giblin L and Sweeney T: Bovine lactoferrin (LTF) gene
promoter haplotypes have different basal transcriptional
activities. Anim Genet. 42:270–279. 2011. View Article : Google Scholar : PubMed/NCBI
|
|
10
|
Zhang Y, Lima CF and Rodrigues LR:
Anticancer effects of lactoferrin: Underlying mechanisms and future
trends in cancer therapy. Nutr Rev. 72:763–773. 2014. View Article : Google Scholar : PubMed/NCBI
|
|
11
|
Yu MC and Yuan JM: Epidemiology of
nasopharyngeal carcinoma. Semin Cancer Biol. 12:421–429. 2002.
View Article : Google Scholar : PubMed/NCBI
|
|
12
|
Stella F, Weich N, Panero J, Fantl DB,
Schutz N, Fundia AF and Slavutsky I: Glutathione S-transferase P1
mRNA expression in plasma cell disorders and its correlation with
polymorphic variants and clinical outcome. Cancer Epidemiol.
37:671–674. 2013. View Article : Google Scholar : PubMed/NCBI
|
|
13
|
Velliyagounder K, Kaplan JB, Furgang D,
Legarda D, Diamond G, Parkin RE and Fine DH: One of two human
lactoferrin variants exhibits increased antibacterial and
transcriptional activation activities and is associated with
localized juvenile periodontitis. Infect Immun. 71:6141–6147. 2003.
View Article : Google Scholar : PubMed/NCBI
|
|
14
|
Moreno-Navarrete JM, Ortega FJ, Bassols J,
Castro A, Ricart W and Fernández-Real JM: Association of
circulating lactoferrin concentration and 2 nonsynonymous LTF gene
polymorphisms with dyslipidemia in men depends on glucose-tolerance
status. Clin Chem. 54:301–309. 2008. View Article : Google Scholar : PubMed/NCBI
|
|
15
|
Cao L, Zhou Y, Li X and Yi H: The
relationship of haplotype in lactotransferrin and its expression
levels in Chinese Han ovarian cancer. Acta Biochim Biophys Sin
(Shanghai). 43:884–890. 2011. View Article : Google Scholar : PubMed/NCBI
|
|
16
|
Heo S, Spoerk S, Birner-Gruenberger R and
Lubec G: Gel-based mass spectrometric analysis of hippocampal
transmembrane proteins using high resolution LTQ Orbitrap Velos
Pro. Proteomics. 14:2084–2088. 2014. View Article : Google Scholar : PubMed/NCBI
|
|
17
|
Haddad T and Kümmerer K: Characterization
of photo-transformation products of the antibiotic drug
Ciprofloxacin with liquid chromatography-tandem mass spectrometry
in combination with accurate mass determination using an LTQ
Orbitrap. Chemosphere. 115:40–46. 2014. View Article : Google Scholar : PubMed/NCBI
|
|
18
|
Zhang JY, Wang F, Zhang H, Lu JQ and Qiao
YJ: Rapid identification of polymethoxylated flavonoids in
traditional Chinese medicines with a practical strategy of stepwise
mass defect filtering coupled to diagnostic product ions analysis
based on a hybrid LTQ Orbitrap mass spectrometer. Phytochem Anal.
25:405–414. 2014. View
Article : Google Scholar : PubMed/NCBI
|
|
19
|
Livak KJ and Schmittgen TD: Analysis of
relative gene expression data using real-time quantitative PCR and
the 2(−Delta Delta C(T)) Method. Methods. 25:402–408. 2001.
View Article : Google Scholar : PubMed/NCBI
|
|
20
|
Barrett JC, Fry B, Maller J and Daly MJ:
Haploview: Analysis and visualization of LD and haplotype maps.
Bioinformatics. 21:263–265. 2005. View Article : Google Scholar : PubMed/NCBI
|
|
21
|
Shi YY and He L: SHEsis, a powerful
software platform for analyses of linkage disequilibrium, haplotype
construction and genetic association at polymorphism loci. Cell
Res. 15:97–98. 2005. View Article : Google Scholar : PubMed/NCBI
|
|
22
|
Niu T: Algorithms for inferring
haplotypes. Genet Epidemiol. 27:334–347. 2004. View Article : Google Scholar : PubMed/NCBI
|
|
23
|
Alexander DB, Iigo M, Yamauchi K, Suzui M
and Tsuda H: Lactoferrin: An alternative view of its role in human
biological fluids. Biochem Cell Biol. 90:279–306. 2012. View Article : Google Scholar : PubMed/NCBI
|
|
24
|
Nadolska B, Frączek M, Krȩcicki T, Koȩieba
M and Zimecki M: Lactoferrin inhibits the growth of nasal polyp
fibroblasts. Pharmacol Rep. 62:1139–1147. 2010. View Article : Google Scholar : PubMed/NCBI
|
|
25
|
Manzoni P, Mostert M and Stronati M:
Lactoferrin for prevention of neonatal infections. Curr Opin Infect
Dis. 24:177–182. 2011. View Article : Google Scholar : PubMed/NCBI
|
|
26
|
Gibbons JA, Kanwar RK and Kanwar JR:
Lactoferrin and cancer in different cancer models. Front Biosci
(Schol Ed). 3:1080–10888. 2011. View
Article : Google Scholar : PubMed/NCBI
|
|
27
|
Wang J, Li Q, Ou Y, Han Z, Li K, Wang P
and Zhou S: Inhibition of tumor growth by recombinant adenovirus
containing human lactoferrin through inducing tumor cell apoptosis
in mice bearing EMT6 breast cancer. Arch Pharm Res. 34:987–995.
2011. View Article : Google Scholar : PubMed/NCBI
|
|
28
|
Yen CC, Shen CJ, Hsu WH, Chang YH, Lin HT,
Chen HL and Chen CM: Lactoferrin: An iron-binding antimicrobial
protein against Escherichia coli infection. Biometals. 24:585–594.
2011. View Article : Google Scholar : PubMed/NCBI
|
|
29
|
Huang C, Wu M, Tang Y, Li X, Ouyang J,
Xiao L, Li D and Li G: NAG7 promotes human nasopharyngeal carcinoma
invasion through inhibition of estrogen receptor alpha and
up-regulation of JNK2/AP-1/MMP1 pathways. J Cell Physiol.
221:394–401. 2009. View Article : Google Scholar : PubMed/NCBI
|
|
30
|
Raciti M, Lotti LV, Valia S, Pulcinelli FM
and Di Renzo L: JNK2 is activated during ER stress and promotes
cell survival. Cell Death Dis. 3:e4292012. View Article : Google Scholar : PubMed/NCBI
|
|
31
|
Cellurale C, Girnius N, Jiang F,
Cavanagh-Kyros J, Lu S, Garlick DS, Mercurio AM and Davis RJ: Role
of JNK in mammary gland development and breast cancer. Cancer Res.
72:472–481. 2012. View Article : Google Scholar : PubMed/NCBI
|
|
32
|
Radovich M, Hancock BA, Kassem N, Mi D,
Skaar TC and Schneider BP: Resequencing of the vascular endothelial
growth factor promoter reveals haplotype structure and functional
diversity. Angiogenesis. 13:211–218. 2010. View Article : Google Scholar : PubMed/NCBI
|
|
33
|
Bruce JP and Liu FF: MicroRNAs in
nasopharyngeal carcinoma. Chin J Cancer. 33:539–544. 2014.
View Article : Google Scholar : PubMed/NCBI
|
|
34
|
Li HP, Huang HY, Lai YR, Huang JX, Chang
KP, Hsueh C and Chang YS: Silencing of miRNA-148a by
hypermethylation activates the integrin-mediated signaling pathway
in nasopharyngeal carcinoma. Oncotarget. 5:7610–7624. 2014.
View Article : Google Scholar : PubMed/NCBI
|
|
35
|
Ma L, Deng X, Wu M, Zhang G and Huang J:
Down-regulation of miRNA-204 by LMP-1 enhances CDC42 activity and
facilitates invasion of EBV-associated nasopharyngeal carcinoma
cells. FEBS Lett. 588:1562–1570. 2014. View Article : Google Scholar : PubMed/NCBI
|
|
36
|
Werk AN, Bruckmueller H, Haenisch S and
Cascorbi I: Genetic variants may play an important role in
mRNA-miRNA interaction: Evidence for haplotype-dependent
downregulation of ABCC2 (MRP2) by miRNA-379. Pharmacogenet
Genomics. 24:283–291. 2014. View Article : Google Scholar : PubMed/NCBI
|
|
37
|
Koelsch KA, Webb R, Jeffries M, Dozmorov
MG, Frank MB, Guthridge JM, James JA, Wren JD and Sawalha AH:
Functional characterization of the MECP2/IRAK1 lupus risk haplotype
in human T cells and a human MECP2 transgenic mouse. J Autoimmun.
41:168–174. 2013. View Article : Google Scholar : PubMed/NCBI
|
|
38
|
Li Y, Kong D, Ahmad A, Bao B, Dyson G and
Sarkar FH: Epigenetic deregulation of miR-29a and miR-1256 by
isoflavone contributes to the inhibition of prostate cancer cell
growth and invasion. Epigenetics. 7:940–949. 2012. View Article : Google Scholar : PubMed/NCBI
|
|
39
|
Bao L, Hazari S, Mehra S, Kaushal D, Moroz
K and Dash S: Increased expression of P-glycoprotein and
doxorubicin chemoresistance of metastatic breast cancer is
regulated by miR-298. Am J Pathol. 180:2490–2503. 2012. View Article : Google Scholar : PubMed/NCBI
|