Introduction
Globally, the incidence of gastric cancer (GC) ranks
fourth in males and fifth in females worldwide; however, GC is the
second leading cause of cancer-associated mortality globally
(1). The developing world accounts
for 70% of GC-associated mortalities worldwide, with China
accounting for ~40% of this (1).
Infection with Helicobacter pylori, a microbial species that
specifically colonizes the gastric epithelium, is the most
well-known risk factor for developing GC, conferring an increased
risk of ~75% (2). Surgical
intervention using endoscopy is a typical approach in the treatment
of patients with early GC, achieving improved long-term outcomes
(3). Postoperative adjuvant
chemoradiation combined with several molecularly targeted drugs,
including anti-vascular endothelial growth factor receptor 2
monoclonal antibodies and epidermal growth factor receptor
1/receptor tyrosine-protein kinase erbB-2 inhibitors, is able to
prolong relapse-free survival in patients with advanced GC
(4). In order to overcome the
limitations of GC therapy, determination of the drivers that
contribute to GC tumorigenesis and malignancy is required.
The DNA-binding protein inhibitor ID (ID) subfamily,
first cloned in 1900, belongs to the helix-loop-helix (HLH) class V
family of transcription factors and contains four members in
vertebrates; ID1, ID2, ID3 and ID4 (5,6). The
ubiquitous HLH class V family contains transcription factors that
regulate cell fate, differentiation and proliferation, and are
characterized by a highly conserved HLH domain adjacent to the E
box DNA-binding region (7). The E box
is present in the majority of HLH proteins and facilitates binding
to DNA, except in the ID subfamily. ID proteins function
predominantly as negative regulators of basic HLH (bHLH)
transcription factors by forming ID-bHLH heterodimers (6). ID-bHLH heterodimers are unable to bind
to DNA as they lack a DNA-binding region, leading to the subsequent
inhibition of bHLH-mediated transcription (8).
ID1 is primarily expressed in embryonic stem cells
(ESCs) and progenitor cells, and is downregulated in mature
differentiated cells; however, ID1 expression is reactivated in
numerous cancer cells (9). Although
ID1 possesses opposing oncogenic and tumor suppressive functions,
increased ID1 protein expression has been identified in the
majority of tumor types, including bladder, breast, colorectal,
esophageal and gastric (10–13). Aberrant ID1 protein expression in
cancer is typically induced by oncoproteins, including Myc
proto-oncogene protein (Myc), Ras GTPases, proto-oncogene
tyrosine-protein kinase Src, neurogenic locus notch homolog
proteins and growth factor signals, such as epidermal growth factor
(EGF) (14–17). ID1 protein expression is typically
repressed by tumor suppressor proteins, including forkhead box
protein O3 and cellular tumor antigen p53 (p53) (18,19). ID1
serves critical roles in cell proliferation,
epithelial-to-mesenchymal transition (EMT) and chemoresistance in
various types of cancer (20).
ID1 is known to be an inhibitor of cellular
differentiation and serves an essential role in the maintenance of
ESC self-renewal and pluripotency (21). In an ID1−/− murine model,
hematopoietic whole bone marrow cells exhibited a decreased ability
to self-renewal compared with a wild-type control (22). Similarly, another study demonstrated
that self-renewal was increased in murine cortical neural stem
cells following overexpression of ID1 (23). In colon cancer stem cells (CSCs),
increased levels of ID1 are necessary for the acquisition of the
CSC phenotype (24). Consistent with
these findings, glioma cells expressing increased levels of ID1
exhibited increased self-renewal compared with glioma cells
expressing decreased levels of ID1 (25). However, the role of ID1 in GC cell
self-renewal and CSC-likeness remains to be elucidated. As ID1
serves an essential role in somatic stem cell self-renewal, the
present study aimed to investigate the role of ID1 in GC
tumorigenesis and CSC-likeness.
In the present study, ID1 was successfully knocked
down in MGC-803, MKN-28 and SGC-7901 cells using small interfering
(si) RNA, which led to impaired proliferation, migration and cell
cycle progression in GC cells. ID1 knockdown was demonstrated to
suppress GC cell self-renewal and CSC-like properties through the
downregulation of Nanog and Oct-4, which established an association
between the expression of ID1 and CSC-related transcription factors
Nanog and octamer-binding protein 4 (Oct-4) in GC cells. In
addition, it was demonstrated that ID1 depletion induces
sensitivity to cisplatin (DDP) in GC cells, thus providing a novel
therapeutic target for the treatment of GC.
Materials and methods
Cell culture and reagents
The GC cell lines, MKN-28, MGC-803 and SGC-7901 were
purchased from the Laboratory Animal Center of Sun Yat-sen
University Cell Bank (Guangzhou, China). MKN-28 is derived from
MKN-74 (http://cellbank.nibiohn.go.jp/~cellbank/en/search_res_det.cgi?ID=340).
Cells were grown in RPMI-1640 medium (Gibco; Thermo Fisher
Scientific, Inc., Waltham, MA, USA) supplemented with 10% fetal
bovine serum (FBS; cat. no. 04-001-1A; Biological Industries,
Beit-Haemek, Israel) at 37°C in a humidified atmosphere containing
5% CO2. The primary antibodies used in western blot
analysis were as follows: Mouse anti-ID1 (1:1,000; cat. no.
ab168256; Abcam, Cambridge, UK); mouse anti-Nanog (1:500; cat. no.
sc-376915; Santa Cruz Biotechnology, Inc., Dallas, TX, USA); mouse
anti-octamer-binding protein 4 (1:1,000; cat. no. 611203; BD
Biosciences, San Jose, CA, USA); rabbit anti-cyclin D1 (1:1,000;
cat. no. 2261-1; Epitomics, Burlingame, CA, USA); mouse
anti-transcription factor SOX2 (Sox2; 1:500; cat. no. 561469; BD
Biosciences); mouse anti-β-actin (1:1,000; cat. no. sc-47778; Santa
Cruz Biotechnology, Inc., CA, USA); and mouse anti-GAPDH (1:3,000;
cat. no. 60004-1-lg; Proteintech Group, Inc., Chicago, IL, USA).
Mouse (cat. no. SA00001-1) or rabbit (cat. no. SA00001-2)
immunoglobulin G horseradish peroxidase-conjugated secondary
antibodies (both 1:10,000; Proteintech Group, Inc., Chicago, IL,
USA) were obtained from the Proteintech Group, Inc. (both 1:3,000).
DDP was purchased from Sigma-Aldrich (Merck Millipore, Darmstadt,
Germany; cat. no. p4394).
siRNA transfection
ID1 knockdown was achieved by RNA interference using
siRNA in the GC cell line MGC-803. The full-length ID1 mRNA
sequence was retrieved from GenBank (NM_002165.3; www.ncbi.nlm.nih.gov/nuccore/NM_002165.3). The siRNA
sequences were designed by Takara Biotechnology Co., Ltd., (Dalian,
China) and synthesized by Invitrogen (Thermo Fisher Scientific,
Inc.). The sequences of the ID1 and negative control (NC) siRNAs
are shown in Table I. A total of 1
day prior to transfection, cells were seeded into a 6-well plate at
a confluency of between 50 and 60%. Cells in the logarithmic phase
of growth were transfected with 100 nM siRNA-ID1 or siRNA-NC in
Opti-MEM™I Reduced Serum media using Lipofectamine™2000 (both
Thermo Fisher Scientific, Inc.), according to the manufacturer's
protocol.
 | Table I.Sequences of siRNA for ID1
knockdown. |
Table I.
Sequences of siRNA for ID1
knockdown.
|
| siRNA sequence
(5′-3′) |
|---|
|
|
|
|---|
| Name | Sense | Antisense |
|---|
| si-NC | UUC UCC GAA CGU GUC
ACG UTT | ACG UGA CAC GUU CGG
AGA ATT |
| ID1–201 | CGA CAU GAA CGG CUG
UUA CTT | GUA ACA GCC GUU CAU
GUC GTT |
| ID1–252 | AGA ACC GCA AGG UGA
GCA ATT | UUG CUC ACC UUG CGG
UUC UGG |
| ID1–266 | UGA GCA AGG UGG AGA
UUC UTT | AGA AUC UCC ACC UUG
CUC ATT |
| ID1–316 | GUU GGA GCU GAA CUC
GGA ATT | UUC CGA GUU CAG CUC
CAA CTG |
Reverse transcription-polymerase chain
reaction (RT-PCR) analysis of ID1 mRNA expression
The efficacy of siRNA transfection was evaluated
using RT-PCR. A total of 48 h following transfection, total
cellular RNA was extracted using TRIzol® reagent
(Invitrogen; Thermo Fisher Scientific, Inc.), according to the
manufacturer's protocol. First-strand cDNA was subsequently
synthesized by denaturing 1 µg RNA at 65°C for 10 min with 0.1 µg
oligo-dT (Takara Biotechnology Co., Ltd.) and the denatured product
was immediately incubated in an ice bath for 5 min. The denatured
product was made up to a total volume of 25 µl with the addition of
1 µl dNTP (10 mM/base; cat. no. U1205), 100 units
RNasin® Ribonuclease inhibitor (cat. no. N2111), 10
units Moloney murine leukemia virus reverse transcriptase (cat. no.
M1701) (all Promega Corporation, Madison, WI, USA) and 0.01%
diethylpyrocarbonate (DEPC; cat. no. 472565; Sigma-Aldrich; Merck
Millipore) in H2O. The mix was incubated at 42°C for 60
min, 95°C for 5 min and then on ice for 3 min prior to being stored
at −20°C until the cDNA template was required for PCR. Primers
targeting ID1 and β-actin were designed using Premier Primer
software (version 5.0; Premier Biosoft International, Palo Alto,
CA, USA) and synthesized by Invitrogen (Thermo Fisher Scientific,
Inc.). Primer sequences are shown in Table II. PCR was performed in a total
reaction volume of 10 µl, containing 5 µl 2X Taq PCR Master Mix
(cat. no. K0171; Thermo Fisher Scientific Inc.), 0.25 µl forward
primer (10 µM), 0.25 µl reverse primer (10 µM), 0.5 µl of template
cDNA (200 ng/µl) and DEPC-treated water (cat. no. R0021; Beyotime
Institute of Biotechnology, Haimen, China). PCR thermocycling
conditions were as follows: 94°C for 5 min; 30 cycles of 94°C for
30 sec, 62°C for 30 sec and 72°C for 1 min; and 72°C for 7 min.
Agarose gel electrophoresis was performed on the final PCR products
using a 2% agarose gel containing 0.5 µg/µl ethidium bromide, and
images were captured using the Tanon-4100 Gel Imaging system (Tanon
Science and Technology Co., Ltd., Shanghai, China). The expression
of ID1 mRNA normalized to β-actin was determined using
Image-Pro® Plus software (version 5.1; Rockville, MD,
USA).
| Table II.Primers used in reverse
transcription-quantitative polymerase chain reaction analysis. |
Table II.
Primers used in reverse
transcription-quantitative polymerase chain reaction analysis.
|
| Primer sequence
(5′-3′) |
|
|---|
|
|
|
|
|---|
| Gene | Forward | Reverse | Product length
(bp) |
|---|
| ID1 |
ATCAGGGACCTTCAGTTGGAGC |
AGACCCACAGAGCACGTAATTCC | 236 |
| β-actin |
TAAAGACCTCTATGCCAACACAGT |
CACGATGGAGGGGCCGGACTCATC | 240 |
Cell viability assay and
5-ethynyl-2′-deoxyuridine (EdU) analysis
The Cell Counting Kit-8 (CCK-8; cat. no. BB-4202;
BestBio Co., Shanghai, China) assay was used to evaluate the
viability of MKN-28 and MGC-803 cells. Between 2,000 and 3,000 GC
cells/well were seeded into a 96-well plate and subsequently
transfected with siRNA-ID1 or siRNA-NC for 24, 48 and 72 h, as
described above. A total of 10 µl CCK-8 reagent was added to each
well and plates were incubated for 1 h at 37°C prior to measuring
the absorbance at 450 nm using the ELx800™ Absorbance Reader
(BioTek Instruments, Inc., Winooski, VT, USA). The Cell-Light™ EdU
Apollo®567 In Vitro Imaging kit (cat. no. C10310;
RiboBio Co., Ltd., Guangzhou, China) was used to label cells in the
S phase based on EdU labeling as previously described (25). According to the manufacturer's
protocol, siRNA-transfected cells were incubated with EdU solution
for 3 h at 37°C. Cells were subsequently washed with PBS, fixed
with 4% paraformaldehyde for 30 min, and permeated using 0.5%
Triton™ X-100. Apollo567 from the Imaging kit and DAPI
(Sigma-Aldrich; Merck Millipore) were used for EdU and nuclear
staining, respectively. Images were captured using a fluorescence
microscope (Eclipse Ti-U inverted microscope; Nikon Corporation,
Tokyo, Japan). EdU-positive cells were counted using Image Pro Plus
software (version 6.0; Media Cybernetics, Rockville, MD, USA).
Flow cytometric analysis of cell cycle
distribution and apoptosis
Following transfection with si-ID1 or si-NC, MKN-28
and MGC-803 cells (2×10⁶-5×10⁶) were
harvested using trypsin and resuspended in 300 µl PBS. The cell
suspension was subsequently incubated in 700 µl ice-cold absolute
ethanol overnight at 4°C. Cells were pelleted through
centrifugation at 13,400 × g at 4°C for 5 min, and then washed with
PBS, prior to resuspension in PBS containing 100 µg/ml RNase
inhibitor and 25 µg/ml propidium iodide (PI). The mixture was
incubated in an ice bath for 30 min prior to flow cytometric
analysis of cell cycle distribution using the BD FACSCalibur flow
cytometer (BD Biosciences, Franklin Lakes, NJ, USA). The fractions
of cells in G0/G1, S, and G2/M
phases were analyzed using FlowJo software (version 7.6.2; Tree
Star, Inc., Ashland, OR, USA).
The apoptotic rates of MKN-28 and MGC-803 cells were
analyzed using the Annexin V-fluorescein isothiocyanate (FITC)
Apoptosis Detection kit (Nanjing KeyGen Biotech Co., Ltd., Nanjing,
China), according to the manufacturers' protocol. Briefly, between
2×10⁶ and 5×10⁶ transfected cells were
harvested using trypsin, and resuspended in 500 µl binding buffer
containing 5 µl Annexin V-FITC from the Apoptosis Detection kit,
and 5 µl PI. The mix was incubated for 15 min at 4°C prior to flow
cytometric analysis using the BD FACSCalibur flow cytometer (BD
Biosciences, Franklin Lakes, NJ, USA).
Western blot analysis
A total of 48 h following siRNA transfection, MKN-28
and MGC-803 cells were harvested and lysed in 1X
radioimmunoprecipitation assay buffer (cat. no. P0013B; Beyotime
Institute of Biotechnology) containing phenylmethylsulfonyl
fluoride (cat. no. ST506; Beyotime Institute of Biotechnology) and
a phosphatase inhibitor cocktail (cat. no. CW2383; CW Biotech,
Beijing, China). Proteins (100 ng/lane) were separated on a 10%
(for protein with a mass of 40–170 kDa) or 12% (for protein with a
mass of 15–70 kDa) gel through SDS-PAGE. Proteins were subsequently
transferred onto a polyvinylidene difluoride membrane (EMD
Millipore, Billerica, MA, US) and blocked with 5% bovine serum
albumin (Beyotime Institute of Biotechnology). The membrane was
subsequently incubated overnight at 4°C with the following primary
antibodies: Anti-ID1; anti-Nanog; anti-Sox2; anti-Oct-4;
anti-cyclin D1; and anti-GAPDH. The membrane was washed 4 times by
TBS-Tween 20 buffer (6 min/wash), followed by treatment with
secondary antibodies for 1 h at room temperature. Protein bands
were visualized using the Enhanced Chemiluminescence Western Blot
kit (cat. no. P90720; EMD Millipore). Relative protein expression
analysis using Image Lab software (version 3.0.1 beta 1; Bio-Rad
Laboratories, California, USA) was normalized to GAPDH or
β-actin.
Colony formation assay
MKN-28 and MGC-803 cells were seeded into a 6-well
plate at a density of 500 cells/well and transfected with siRNA-ID1
or siRNA-NC the following day, as described above. The cells were
subsequently cultured in RPMI-1640 medium containing 10% FBS and
re-transfected every 4 days for 2 weeks. In addition, certain cell
groups were treated with 1 µg/ml DDP. Cell colonies were
subsequently fixed with methanol and stained with crystal violet
(Nanjing Jiancheng Bioengineering Institute, Nanjing, China).
Visible colonies of >50 cells were counted by eye for each
sample and colony formation rates were subsequently calculated as
follows: Number of colonies/the number of cells seeded. Colony
formation assays were performed in triplicate.
Tumor spheroid formation assay
A total of 10 h following transfection, GC cells
were trypsinized, washed with PBS and seeded into a 6-well
ultra-low attachment plate (Corning Life Sciences, Acton, MA, USA)
at a density of 1×10⁵ cells/well. Cells were cultured in
serum-free Dulbecco's modified Eagle's medium: Nutrient mixture
F-12 (Thermo Fisher Scientific, Inc.) supplemented with EGF, basic
fibroblast growth factor and B27 (all 20 ng/ml; all Gibco; Thermo
Fisher Scientific, Inc.). To study the effect of ID1 knockdown on
tumor spheroid formation, transfections were repeated on the fourth
day. Following 8 days of incubation at 37°C, images were captured
using a fluorescence microscope (Eclipse Ti-U inverted microscope).
Tumor spheroids with a diameter of >20 µm were counted using
ImageJ software (version 1.37; National Institutes of Health,
Bethesda, MD, USA). Data are presented as the number of spheroids
in 5 randomly selected fields and are the result of triplicate
experiments (26).
Cell migration assay
Cell migration assays were performed using a 24-well
Transwell® Chamber (Corning Life Sciences), according to
the manufacturer's protocol. MKN-28 and MGC-803 cells were
harvested 24 h following siRNA transfection and resuspended in
serum-free RPMI-1640 medium. Cells were seeded into the upper
chamber at a density of 200 cells/wells. RPMI-1640 medium
containing 10% FBS was added into the lower chambers and cells were
incubated at 37°C for 12 (MKN-28) and 20 (MGC-803) h. Migratory
cells were immobilized in methanol for 10 min and stained with
Giemsa (Nanjing Jiancheng Bioengineering Institute), according to
the manufacturer's protocol. Photomicrographs of 5 randomly
selected fields were captured using a Nikon Eclipse Ti-U inverted
microscope.
Statistical analysis
Data analysis was conducted using SPSS Statistics
software (version 20.0; IBM SPSS, Armonk, NY, USA). All values are
presented as the mean ± standard error of the mean. A two-tailed
Student's t-test was used to analyze differences between treatment
groups in the cell proliferation, colony formation, cell migration,
tumor spheroid formation and EdU assays. One-way analysis of
variance was performed to compare differences between multiple
groups for cell viability and apoptosis analysis. P<0.05 was
considered to indicate a statistically significant difference. All
experiments were repeated between 3 and 5 times.
Results
Evaluating the ID1 knockdown
efficiency of siRNA-ID1 in MGC-803 cells
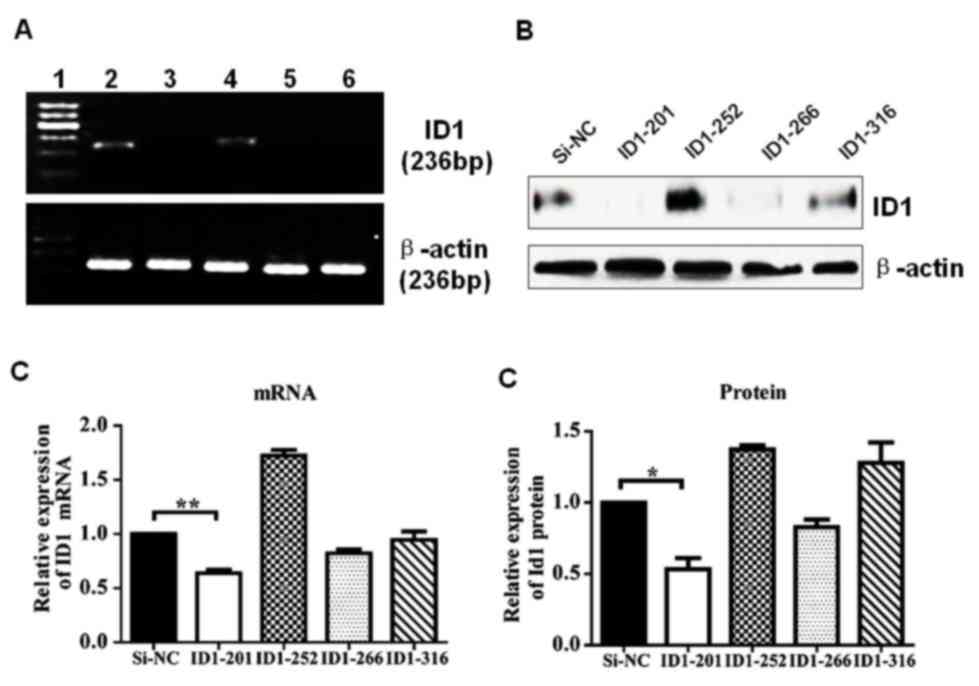
To study the effect of endogenous ID1 depletion in
GC cells, four ID1-specific siRNAs, ID1-201, ID1-252, ID1-266 and
ID1-316, were synthesized and transiently transfected into MGC-803
cells. The effect of the four siRNAs on ID1 mRNA and protein levels
was determined in order to identify the most efficient siRNA.
RT-PCR analysis was performed 48 h following transfection, as
illustrated in Fig. 1. ID1 mRNA
expression in si-ID1-transfected and si-NC-transfected cells was
determined following normalization to β-actin. The ratio of ID1 to
β-actin in the siRNA-NC-transfected group was arbitrarily set to
1.00. Relative ID1 mRNA expression was decreased by 0.65, 0.86 and
0.95 times, following transfection with ID1-201, ID1-266 and
ID1-316, respectively (Fig. 1C). By
contrast, transfection with ID1-252 resulted in an increased
relative ID1 mRNA expression of 1.73 times (Fig. 1C). These results indicate that ID-201
is the most effective siRNA, resulting in a significant decrease in
ID1 mRNA expression (P=0.008 vs. siRNA-NC; Fig. 1C). ID1 protein expression was detected
using western blotting 72 h following siRNA transfection, thus
allowing sufficient time for transcription. Transfection with
ID1-201 and ID1-266 decreased ID1 protein expression, while
transfection with ID1-252 and ID1-316 increased ID1 protein
expression (Fig. 1D). Transfection
with ID1-201 significantly decreased ID1 protein expression (47%;
P=0.027 vs. siRNA-NC; Fig. 1D).
Transfection with ID1-201 produced a 1.53- and 1.88-fold reduction
in ID1 mRNA and protein expression, respectively, and was therefore
used for further investigation.
Effect of ID1 knockdown on the
proliferation and cell cycle distribution of MGC-803 and MKN-28
cells
ID1 has been reported to increase cell proliferation
in several types of cancer, including glial, liver, colorectal and
gastric (27–29); therefore, the effect of ID1 knockdown
on proliferation and cell cycle distribution was investigated. The
MGC-803 (poorly-differentiated) and MKN-28 (well-differentiated)
gastric adenocarcinoma cell lines were used to evaluate the effect
of ID1 knockdown on the proliferation of GC cells. From 2 days
following transfection, MGC-803 and MKN-28 cells transfected with
the siRNA-NC demonstrated significantly increased proliferation
compared with the siRNA-ID1-transfected cells (MKN-28, P=0.009;
MGC-803, P=0.003; Fig. 2A). EdU
assays were used to analyze the proliferative ability of GC cells,
as shown in Fig. 2B. A total of 48 h
following transfection, siRNA-ID1-transfected MKN-28 cells
exhibited a significant reduction in S phase EdU-labeling (21 to
13%) compared with the siRNA-NC-transfected cells (P=0.028). In
addition, siRNA-ID1-transfected MGC-803 cells exhibited a
significant reduction in S phase EdU-labeling (37 to 19%) compared
with the siRNA-NC-transfected cells (P<0.001). Consistent with
published data (29), these results
indicate that siRNA-mediated ID1 knockdown inhibits GC cell
growth.
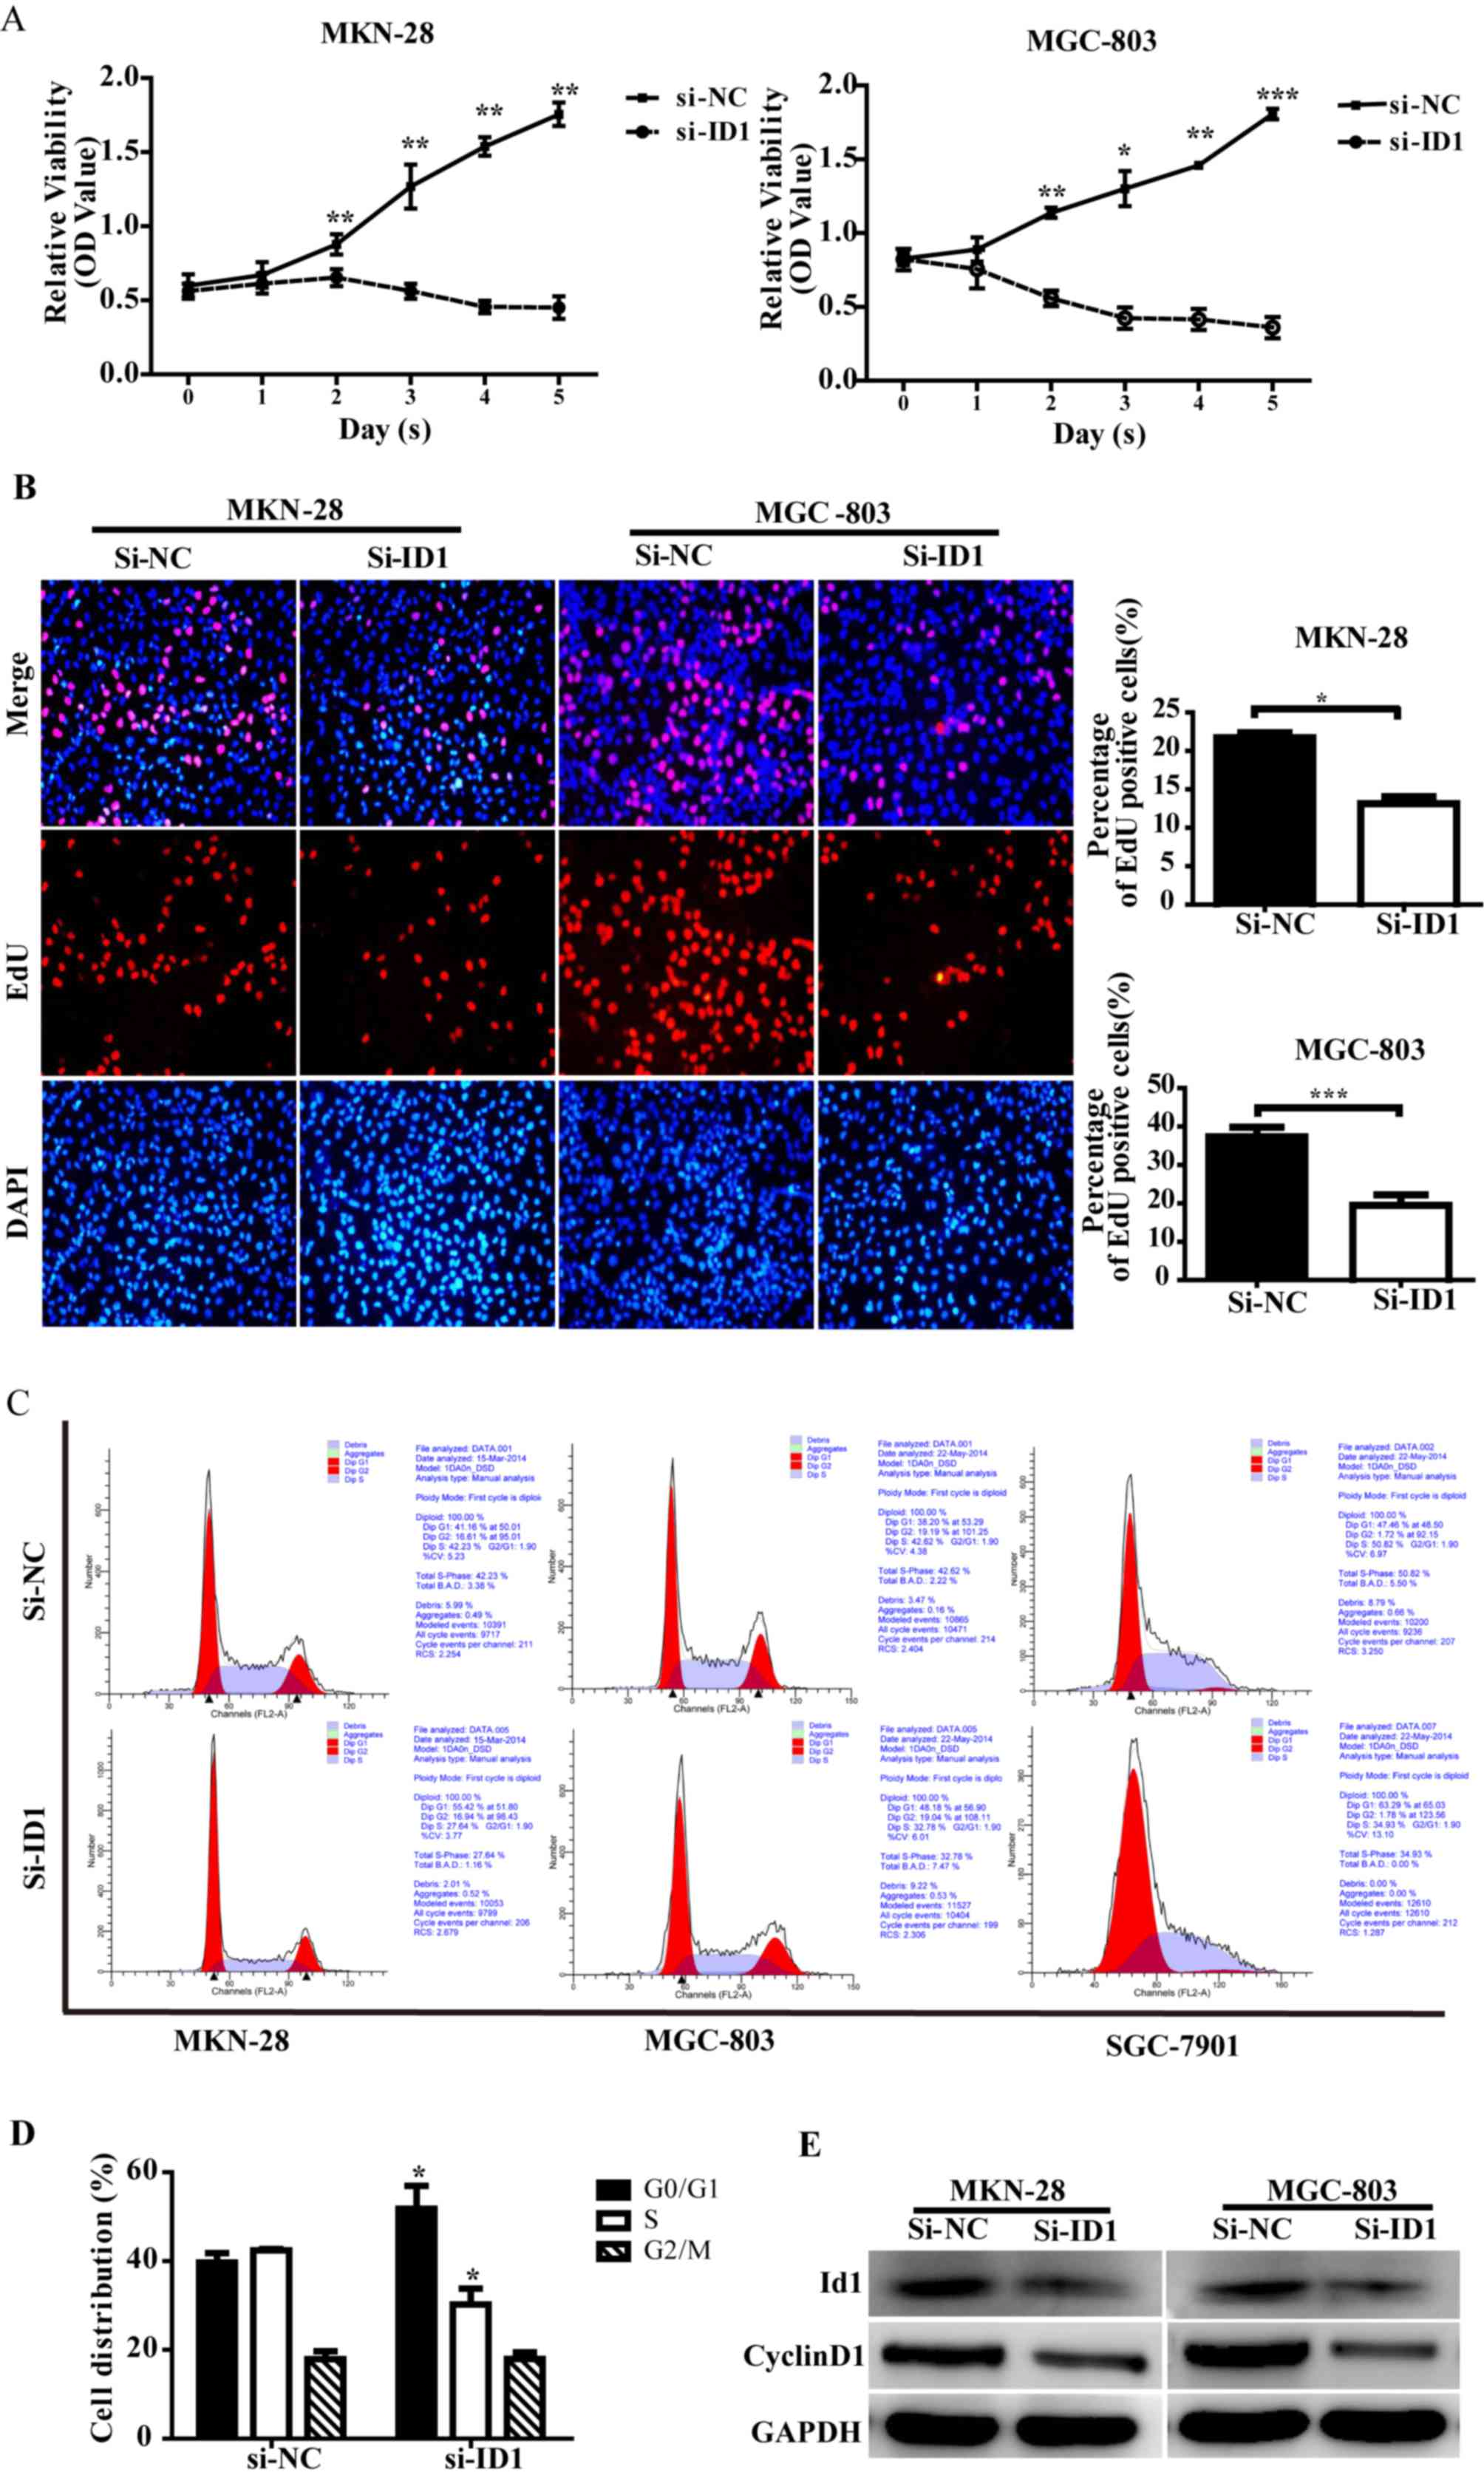 | Figure 2.Effect of ID1 knockdown on the
proliferation and cell cycle distribution of gastric cancer cells.
(A) Cell Counting Kit-8 evaluation of MKN-28 and MGC-803 cell
proliferation, 48 h following transfection. (B) EdU assay
evaluation of MKN-28 and MGC-803 cells in the S phase following
si-NC and si-ID1 transfection. (C) Flow cytometric cell cycle
analysis of MKN-28, MGC-803 and SGC-7901 cells following
transfection. (D) Quantified cell cycle distribution following
transfection. (E) Western blot analysis revealed decreased cyclin
D1 protein expression following ID1 knockdown. Values are presented
as the mean ± standard deviation of triplicate results. *P<0.05,
**P<0.01, ***P<0.001 vs. si-NC-transfected cells. ID1,
DNA-binding protein inhibitor ID-1; si-, small interfering RNA; NC,
negative control; EdU, 5-ethynyl-2′-deoxyuridine; OD, optical
density; FL, fluorescence; A, area. |
Cell cycle dysfunction serves an essential role in
the development of GC, therefore the effect of ID1 knockdown on
cell cycle distribution in the MKN-28, MGC-803 and SGC-7901 cell
lines was evaluated. As shown in Fig. 2C
and D, the proportion of cells in the
G0/G1 phases was significantly increased in
the siRNA-ID1-transfected cells compared with the
siRNA-NC-transfected cells, for all three cell lines (P=0.017). By
contrast, the mean proportion of all three cell types in the S
phase was significantly decreased in the siRNA-D1-transfected cells
compared with the siRNA-NC-transfected cells (P=0.018; Fig. 2D). These results demonstrate that ID1
knockdown in GC cells results in G1 cell cycle arrest.
Cyclin D1 is known to be the primary cyclin that couples to
cyclin-dependent kinases 4/6 and drives G1 to S phase
cell cycle progression (30),
therefore cyclin D1 protein expression was evaluated using western
blotting. A decrease in cyclin D1 protein expression was observed
in the ID1 knockdown cells (Fig. 2E).
These results indicate that ID1 knockdown attenuates aberrant cell
proliferation and leads to G1 cell cycle arrest,
suggesting a role in GC cell growth and cell cycle progression.
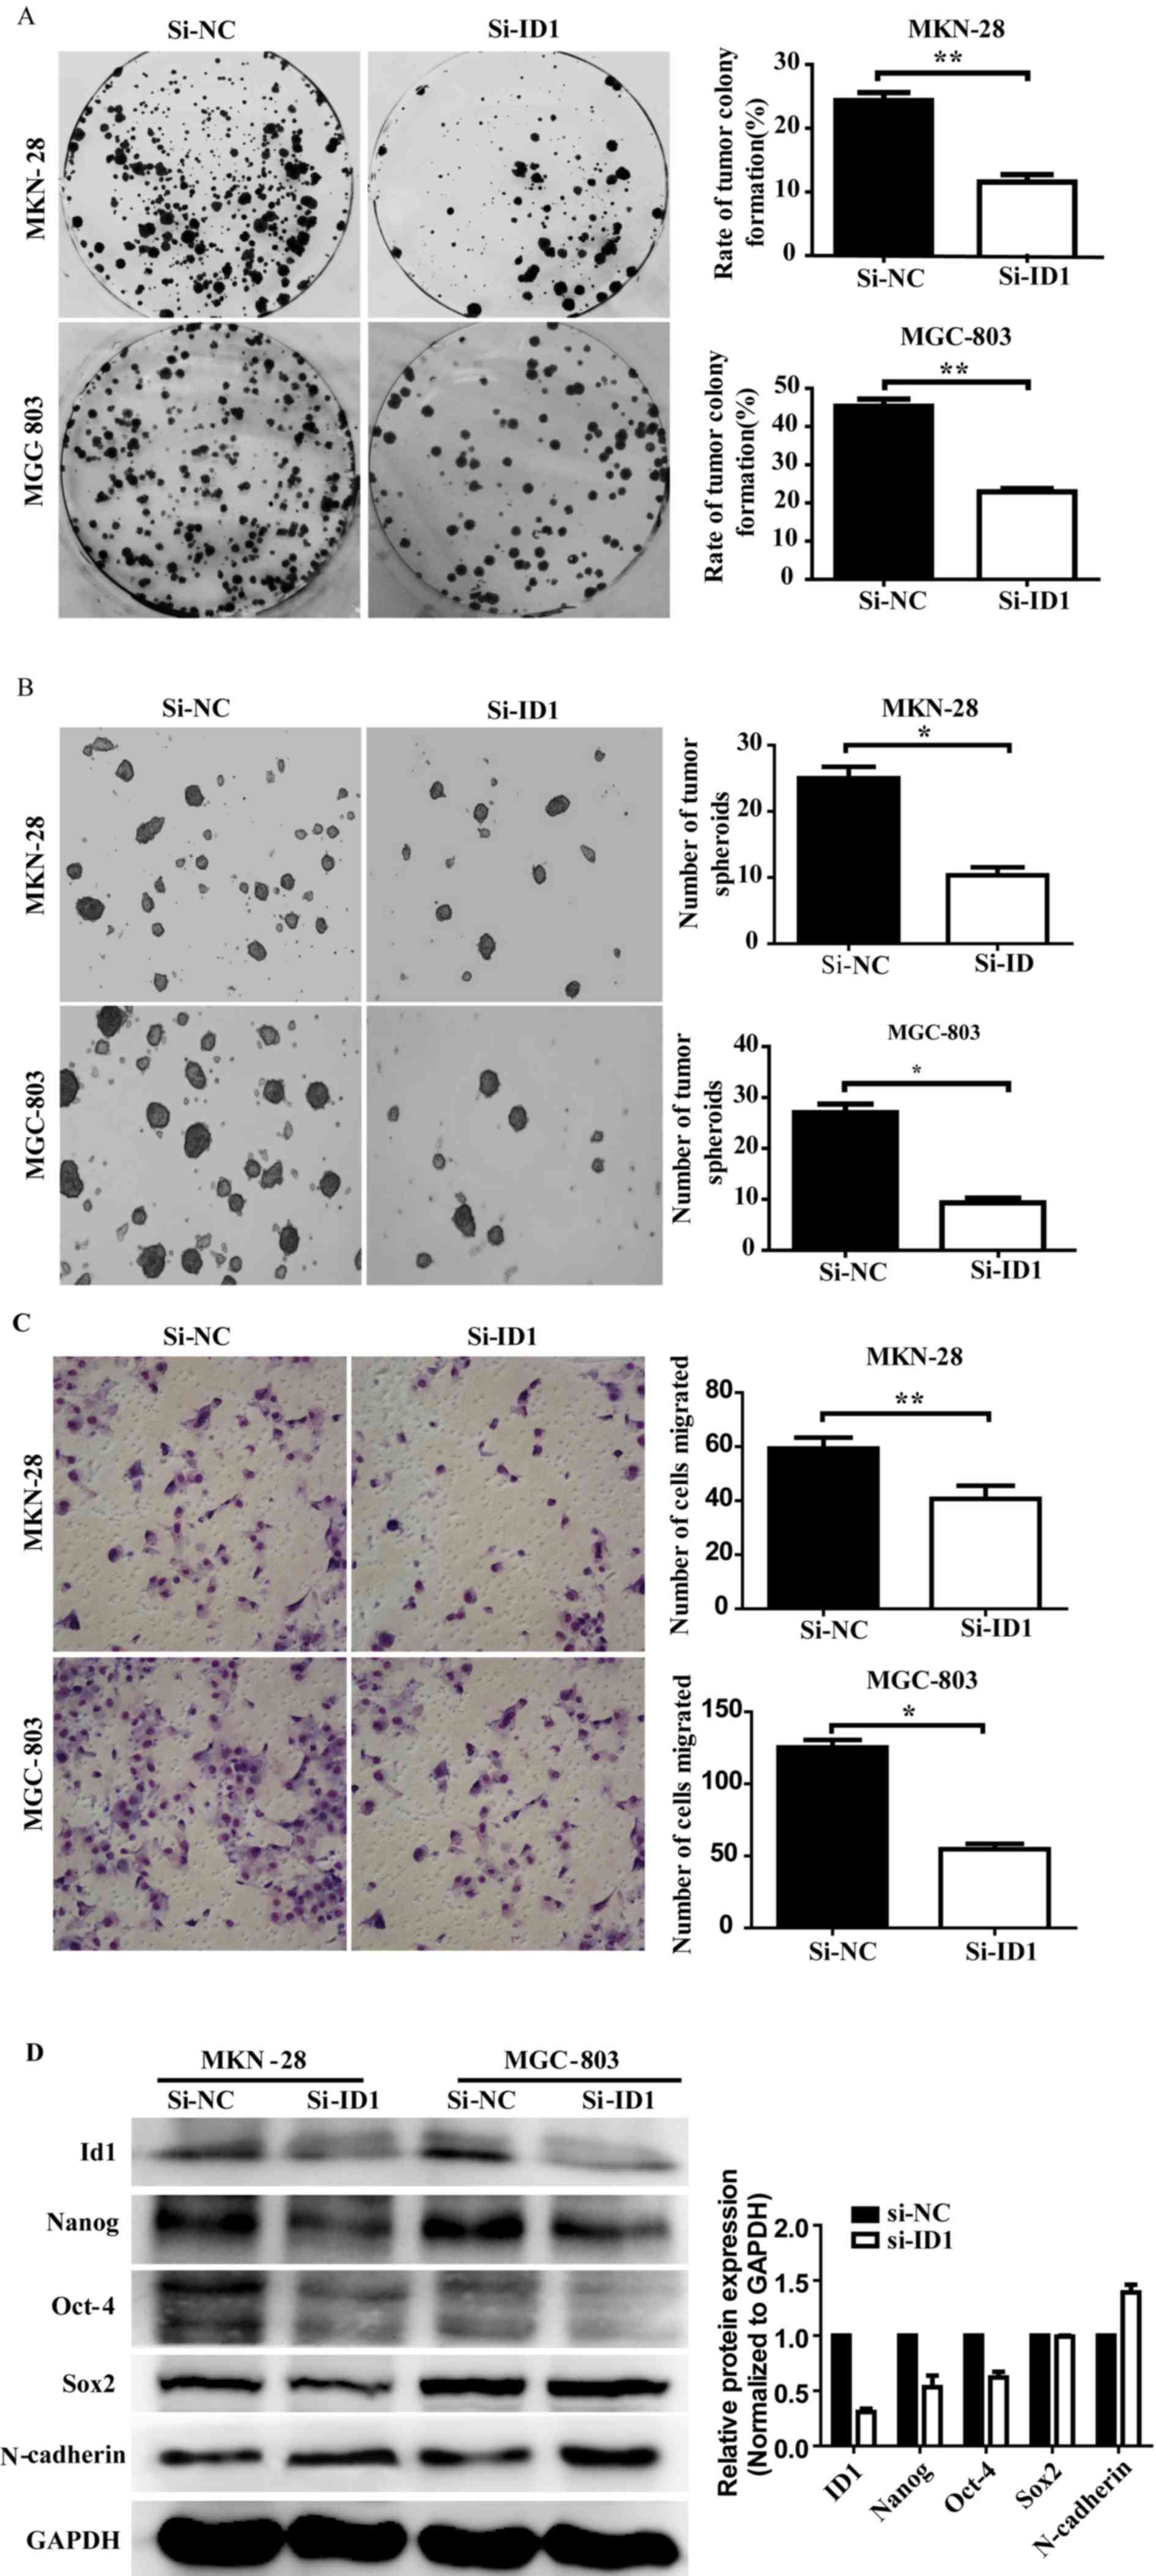
ID1 knockdown leads to reduced CSC
self-renewal in GC
CSCs form a rare cell population within cancer
tissue, and exhibit self-renewal, differentiation potential and
tumorigenic capacity (31). Nanog,
Oct-4, Sox2 and Krueppel-like factor 4 (KLF4) are key factors in
stem cell reprogramming, and their interactions are involved in the
maintenance of stem cell pluripotency and self-renewal. As ID1 is a
known inhibitor of differentiation, the effect of ID1 knockdown on
the stem cell like-properties of GC was examined. Colony formation
is a distinct ability of CSCs in malignant tumors; therefore colony
formation was analyzed in MGC-803 and MKN-28 cell lines following
siRNA transfection. As shown in Fig.
3A, colony formation rates following ID1 knockdown were
significantly reduced in MKN-28 (28 to 11%) and MGC-803 (45 to 23%)
cells compared with the control cells (MKN-28, P=0.005; MGC-803,
P=0.001). These results demonstrate that ID1 knockdown leads to a
significant reduction in the ability of GC cells to form
colonies.
Tumor spheroid formation assays were used to
evaluate the self-renewal ability of CSCs in vitro. MGC-803
and MKN-28 cells were transfected with siRNA-ID1 or siRNA-NC on
days 1 and 4, respectively. Following an 8-day incubation, the
total number of tumor spheroids with a diameter of >20 µm were
counted. As shown in Fig. 3B, ID1
knockdown in MKN-28 and MGC-803 cells significantly decreased the
number of tumor spheroids (2.70- and 3.33-fold decrease,
respectively) compared with the siRNA-NC-transfected cells (MKN-28,
P=0.021; MGC-803, P=0.037).
ID1 knockdown attenuates
CSC-associated EMT properties
CSCs exhibit EMT, which enables metastasis and
invasion (32). The results of the
cell migration assays performed on siRNA-ID1- and
siRNA-NC-transfected cells are shown in Fig. 3C. Significantly decreased migration
was observed in the ID1 knockdown MKN-28 (P=0.002) and MGC-803
(P=0.015) cells compared with the siRNA-NC-transfected cells.
N-cadherin protein expression is a key marker of EMT (33). Western blotting demonstrated decreased
N-cadherin protein expression in ID1 knockdown cells compared with
siRNA-NC-transfected cells (Fig. 3D;
left panel), quantification of the mean gray value from MKN-28 and
MGC-803 demonstrated the same results (Fig. 3D; right panel). These results
indicated that ID1 knockdown inhibits the migratory ability of GC
cells.
ID1 knockdown leads to decreased Nanog
and Oct-4 protein expression
The effect of ID1 knockdown on CSC-associated
proteins in MGC-803 and MKN-28 cells was analyzed using western
blotting 72 h following siRNA transfection. As shown in Fig. 3D, Nanog and Oct-4 protein expression
was decreased in ID1 knockdown cells compared with
siRNA-NC-transfected cells. Sox2 protein expression remained
unchanged following transfection. These results indicate that ID1
regulates CSC-like properties by targeting Nanog and Oct-4.
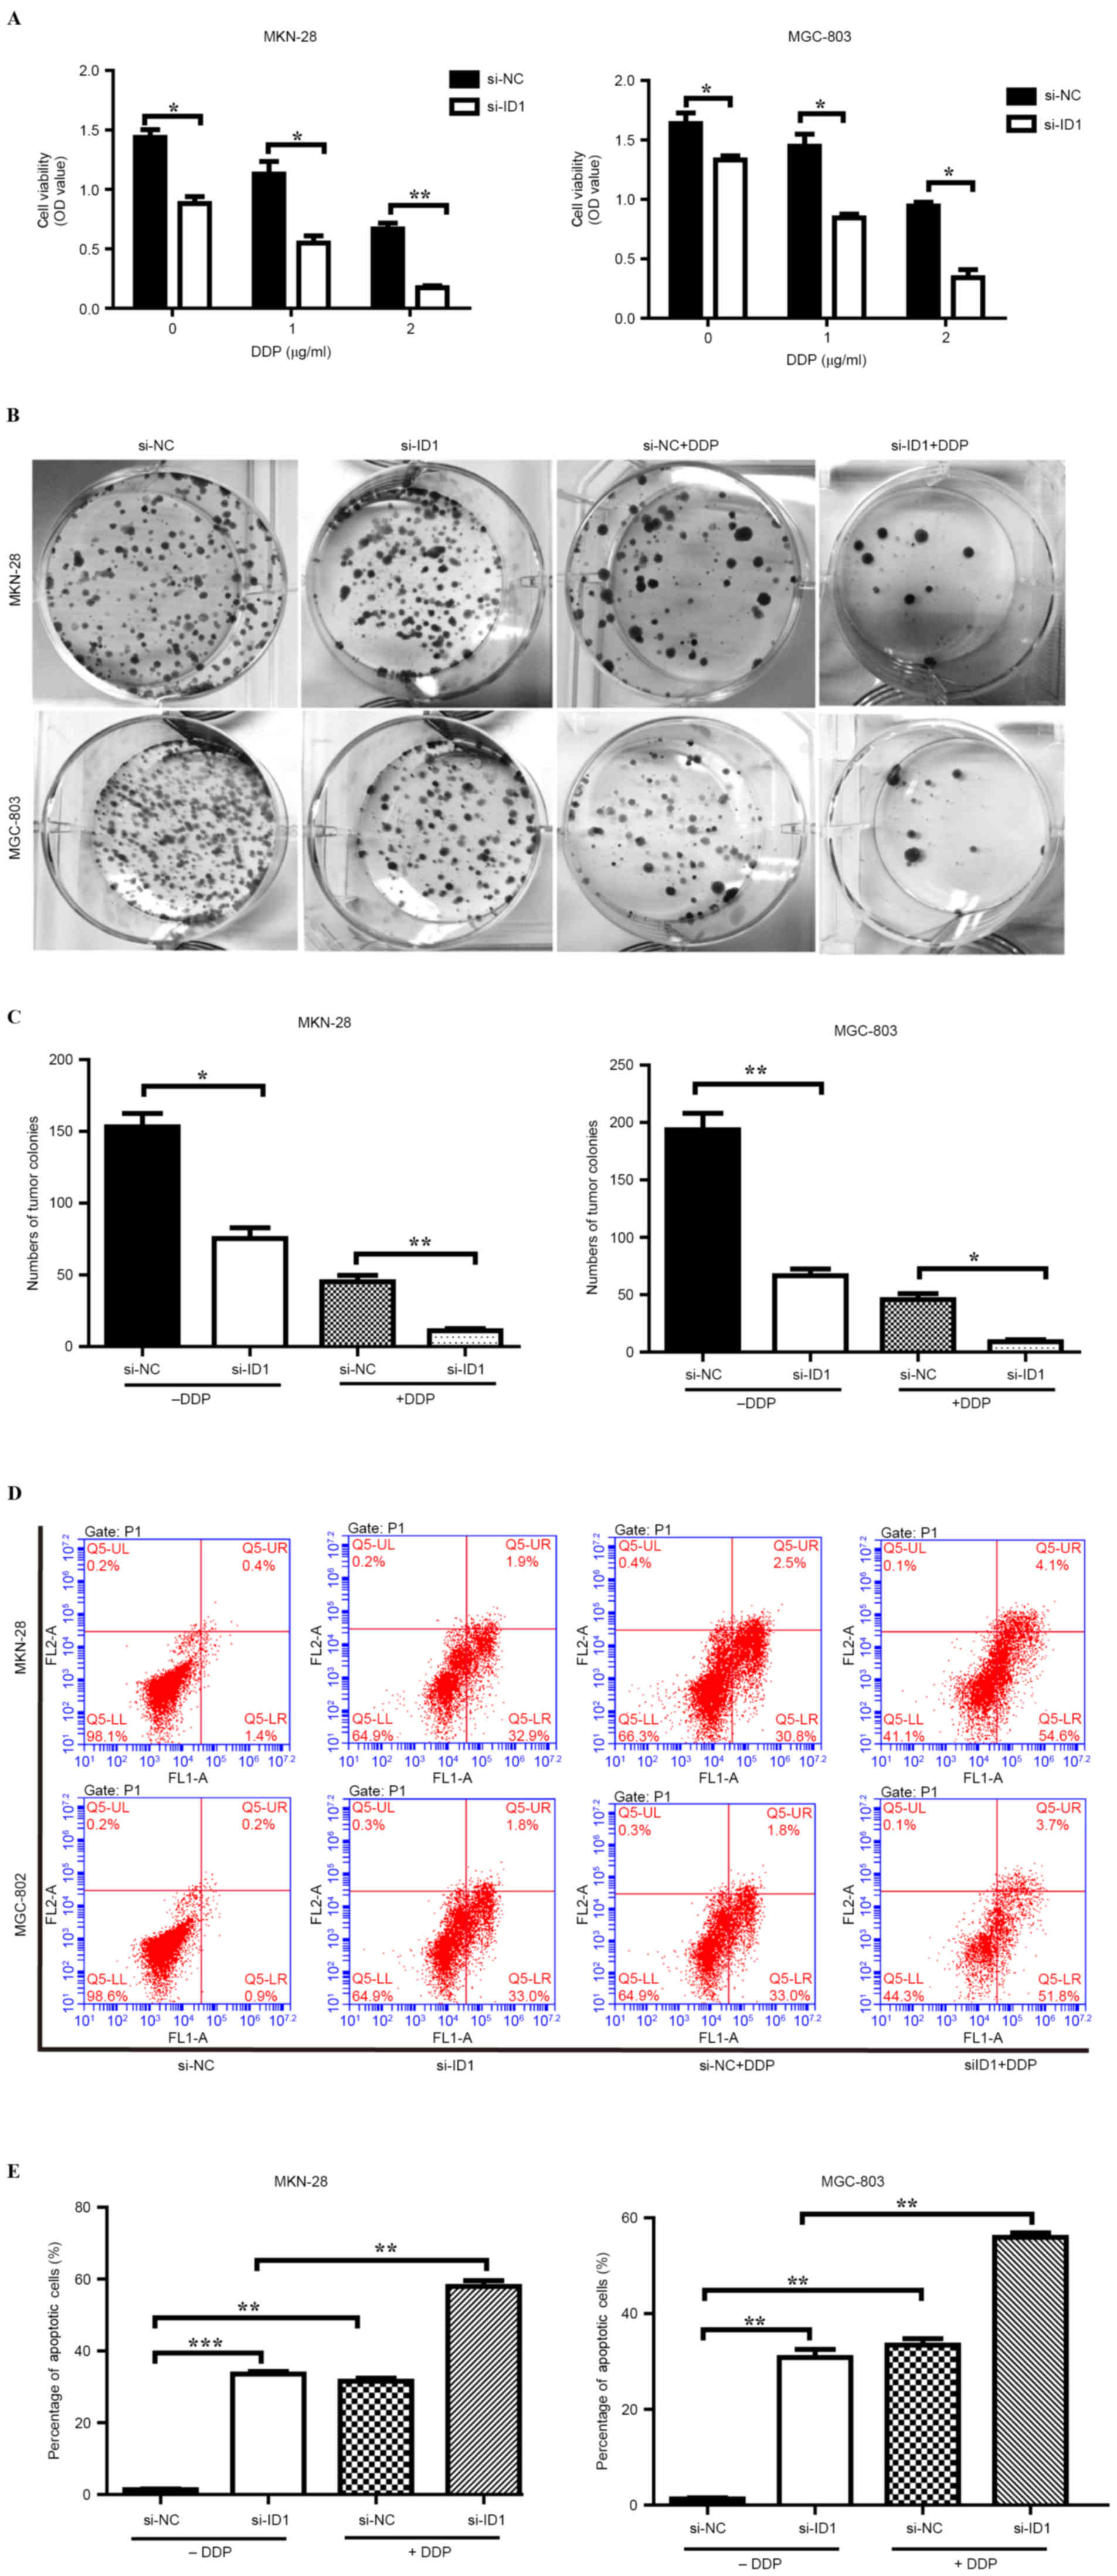
ID1 knockdown reduces GC cell
resistance to DDP
Previous studies have confirmed the role of ID1 in
the development of resistance to chemotherapy in non-small cell
lung cancer cells (21). In addition,
ID1 has been demonstrated to contribute to radioresistance in
glioblastoma through inhibition of DNA repair pathways (34). The effect of ID1 knockdown on
resistance to DDP in the GC cell lines MKN-28 and MGC-803 was
examined. Following siRNA transfection, MKN-28 and MGC-803 cells
were treated with 1 and 2 µg/ml DDP. siRNA-ID1-transfected MKN-28
cell viability decreased markedly following treatment with 1 (62%
decrease; P<0.05) and 2 (75% decrease; P<0.001) µg/ml DDP
compared with the siRNA-NC-transfected cells (Fig. 4A). Similarly, treatment with 1 and 2
µg/ml DDP decreased MKN-28 cell viability compared with the
untreated cells (Fig. 4A).
siRNA-ID1-transfected MGC-803 cell viability decreased markedly
following treatment with 1 (44% decrease; P<0.05) and 2 (49%
decrease; P<0.05) µg/ml DDP compared with the
siRNA-NC-transfected cells (Fig. 4A).
In addition, treatment with 1 and 2 µg/ml DDP decreased MGC-803
cell viability compared with the untreated cells (Fig. 4A).
Colony formation assays were performed to further
evaluate the effect of ID1 knockdown on GC cell sensitivity to DDP.
As shown in Fig. 4B and C, MKN-28
colony formation was markedly decreased in the ID1 knockdown cells
compared with the siRNA-NC-transfected cells following treatment
with 1 µg/ml DDP (P<0.01). In addition, colony formation was
decreased in the DDP treatment groups compared with the untreated
groups. Similarly, MGC-803 colony formation was markedly decreased
in the ID1 knockdown cells compared with the siRNA-NC-transfected
cells, following treatment with 1 µg/ml DDP (P<0.05).
Furthermore, colony formation was decreased in the DDP treatment
groups compared with the untreated groups.
DDP-induced apoptosis in GC cells is
enhanced by ID1 knockdown
To further investigate the role of ID1 in DDP
resistance, the effect of ID1 knockdown and treatment with DDP on
apoptosis was analyzed. As shown in Fig.
4D and E, the percentage of apoptotic MKN-28 (P<0.001) and
MGC-803 (P<0.01) cells was markedly increased following ID1
knockdown compared with the siRNA-NC-transfected cells. In
addition, the percentage of apoptotic MKN-28 and MGC-803 cells was
markedly increased following combined ID1 knockdown and treatment
with DDP compared with ID1 knockdown alone (both P<0.01;
Fig. 4E). These results indicate that
ID1 knockdown reduces DDP resistance in MKN-28 and MGC-803 cells
through the promotion of apoptosis.
Discussion
Numerous studies have highlighted the complex role
served by members of the ID subfamily in mammalian cell fate
determination (21,27,28,34). IDs
are involved in numerous biological processes, including the
inhibition of differentiation, and the maintenance of self-renewal
and multipotency in stem cells (22,23). IDs
have therefore been implicated in the coordination of cell
proliferation and cell cycle progression (9). The present study utilized 4 siRNAs
targeting ID1 and validated their ID1 knockdown efficiency at the
mRNA and protein level. ID1 knockdown was demonstrated to be
sufficient to inhibit the CSC-like properties of the GC cell lines
MKN-28 and MGC-803, including self-renewal, colony formation and
EMT. In addition, the expression of two key CSC-associated factors,
Nanog and Oct-4, was demonstrated to be reduced in
siRNA-ID1-transfected cells. Furthermore, ID1 expression was
demonstrated to serve a role in cell proliferation and cell cycle
progression, which is consistent with the results of these studies.
Moreover, ID1 knockdown was demonstrated to decrease DDP resistance
in GC cells, suggesting it is a potential therapeutic target for
more effective tumor therapy.
Loss of ID1 expression has been demonstrated to
decrease self-renewal and differentiation in mouse ESCs through the
downregulation of Nanog (35). In the
present study, ID1 was demonstrated to serve a role in gastric CSC
maintenance of self-renewal and colony formation. In addition, ID1
was demonstrated to decrease the expression of Nanog and Oct-4,
thus an association between ID1 and CSC-associated factors has been
established. Nanog, a homeodomain protein, was first discovered
while screening for self-renewal factors that were able to sustain
ESCs lacking the leukemia inhibitory factor signaling pathway
(36). As one of the key regulators
of the stemness signaling network, which includes Oct-4, Sox2, KLF4
and Myc, Nanog maintains a balance between pluripotency and
differentiation (37–39). The expression of Nanog was
demonstrated to effect the regulation mouse ESC differentiation,
whereby, the downregulation of Nanog results in the differentiation
of ESC's into endoderm (40). Nanong
is also involved in several tumor development processes, including
cellular proliferation, cell cycle progression, apoptosis,
metastasis and malignant transformation (41,42).
Cross-talk between Nanog and signal transducer and activator of
transcription 3, p53 and phosphatase and tensin homolog, account
for its role in tumorigenesis (43–45). The
association established between ID1 and Nanog in the present study
improves the understanding on how the stem cell-like properties of
cancer are regulated.
ID1 was reported to induce EMT by promoting
transforming growth factor beta-1 expression (29). In the present study ID1 was
demonstrated to increase EMT by positively regulating N-cadherin
expression, a marker of EMT. This result was confirmed by the
reduced migration potential of GC cells following ID1 knockdown.
Previous studies have demonstrated that ID1 inhibits GC cell growth
through the protein kinase B signaling pathway (46), or by stimulating the expression of
cell cycle-associated proteins, including p16, p21, p27 and cyclin
D1 (47). In the present study, ID1
knockdown was demonstrated to decrease proliferation and cell cycle
progression in MGC-803 and MKN-28 cells.
GC therapy does not typically prevent recurrence,
metastasis or the development of multidrug resistance (MDR)
(48). The molecular mechanisms
underlying MDR involve a series of pathological changes, typically
in CSCs. DDP is an important drug used in GC chemotherapy, which
functions by inducing DNA damage and mitochondrial-mediated
apoptosis (49) Overcoming DDP
resistance remains an important challenge in cancer therapy,
despite combination therapeutic strategies being developed to
combat DDP resistance (50). In the
present study, ID1 knockdown in MKN-28 and MGC-803 GC cells was
demonstrated to increase DDP sensitivity. These results indicate
that ID1 is a novel therapeutic target for the treatment of GC.
However, further investigations into the underlying molecular
mechanisms of these effects of ID1 are warranted.
In conclusion, the results of the present study
establish an association between ID1 and Nanog in the regulation of
CSC-likeness in GC cells. Furthermore, ID1 knockdown was
demonstrated to significantly increase GC cell chemosensitivity to
DDP, which indicates that it is a novel therapeutic target for the
treatment of GC. However, the underlying molecular mechanisms
through which ID1 regulates Nanog-mediated CSC-likeness remain to
be elucidated.
Glossary
Abbreviations
Abbreviations:
|
GC
|
gastric cancer
|
|
HLH
|
helix-loop-helix
|
|
CSC
|
cancer stem cell
|
|
DDP
|
cisplatin
|
|
ESC
|
embryonic stem cell
|
|
EMT
|
epithelial-to-mesenchymal
transition
|
References
|
1
|
Jemal A, Bray F, Center MM, Ferlay J, Ward
E and Forman D: Global cancer statistics. CA Cancer J Clin.
61:69–90. 2011. View Article : Google Scholar : PubMed/NCBI
|
|
2
|
Brawner KM, Morrow CD and Smith PD:
Gastric microbiome and gastric cancer. Cancer J. 20:211–216. 2014.
View Article : Google Scholar : PubMed/NCBI
|
|
3
|
Chiu PW, Teoh AY, To KF, Wong SK, Liu SY,
Lam CC, Yung MY, Chan FK, Lau JY and Ng EK: Endoscopic submucosal
dissection (ESD) compared with gastrectomy for treatment of early
gastric neoplasia: A retrospective cohort study. Surg Endosc.
26:3584–3591. 2012. View Article : Google Scholar : PubMed/NCBI
|
|
4
|
Kamat AM: Commentary on ‘Phase II trial of
cetuximab with or without paclitaxel in patients with advanced
urothelial tract carcinoma.’ Wong YN, Litwin S, Vaughn D, Cohen S,
Plimack ER, Lee J, Song W, Dabrow M, Brody M, Tuttle H, Hudes G,
University of Pennsylvania, Philadelphia, PA: J Clin Oncol
2012;30(28):3545-51 [Epub 2012 Aug 27]. Urol Oncol. 31:7192013.
View Article : Google Scholar : PubMed/NCBI
|
|
5
|
Siegel R, Ma J, Zou Z and Jemal A: Cancer
statistics, 2014. CA Cancer J Clin. 64:9–29. 2014. View Article : Google Scholar : PubMed/NCBI
|
|
6
|
Perk J, Iavarone A and Benezra R: Id
family of helix-loop-helix proteins in cancer. Nat Rev Cancer.
5:603–614. 2005. View
Article : Google Scholar : PubMed/NCBI
|
|
7
|
Benezra R, Davis RL, Lockshon D, Turner DL
and Weintraub H: The protein Id: A negative regulator of
helix-loop-helix DNA binding proteins. Cell. 61:49–59. 1990.
View Article : Google Scholar : PubMed/NCBI
|
|
8
|
Yates PR, Atherton GT, Deed RW, Norton JD
and Sharrocks AD: Id helix-loop-helix proteins inhibit
nucleoprotein complex formation by the TCF ETS-domain transcription
factors. EMBO J. 18:968–976. 1999. View Article : Google Scholar : PubMed/NCBI
|
|
9
|
Ling MT, Wang X, Zhang X and Wong YC: The
multiple roles of Id-1 in cancer progression. Differentiation.
74:481–487. 2006. View Article : Google Scholar : PubMed/NCBI
|
|
10
|
Ding Y, Wang G, Ling MT, Wong YC, Li X, Na
Y, Zhang X, Chua CW, Wang X and Xin D: Significance of Id-1
up-regulation and its association with EGFR in bladder cancer cell
invasion. Int J Oncol. 28:847–854. 2006.PubMed/NCBI
|
|
11
|
Wilson JW, Deed RW, Inoue T, Balzi M,
Becciolini A, Faraoni P, Potten CS and Norton JD: Expression of Id
helix-loop-helix proteins in colorectal adenocarcinoma correlates
with p53 expression and mitotic index. Cancer Res. 61:8803–8810.
2001.PubMed/NCBI
|
|
12
|
Luo KJ, Wen J, Xie X, Fu JH, Luo RZ, Wu QL
and Hu Y: Prognostic relevance of Id-1 expression in patients with
resectable esophageal squamous cell carcinoma. Ann Thorac Surg.
93:1682–1688. 2012. View Article : Google Scholar : PubMed/NCBI
|
|
13
|
Yang HY, Liu HL, Liu GY, Zhu H, Meng QW,
Qu LD, Liu LX and Jiang HC: Expression and prognostic values of
Id-1 and Id-3 in gastric adenocarcinoma. J Surg Res. 167:258–266.
2011. View Article : Google Scholar : PubMed/NCBI
|
|
14
|
Gautschi O, Tepper CG, Purnell PR, Izumiya
Y, Evans CP, Green TP, Desprez PY, Lara PN, Gandara DR, Mack PC and
Kung HJ: Regulation of Id1 expression by SRC: Implications for
targeting of the bone morphogenetic protein pathway in cancer.
Cancer Res. 68:2250–2258. 2008. View Article : Google Scholar : PubMed/NCBI
|
|
15
|
Lasorella A, Boldrini R, Dominici C,
Donfrancesco A, Yokota Y, Inserra A and Iavarone A: Id2 is critical
for cellular proliferation and is the oncogenic effector of N-myc
in human neuroblastoma. Cancer Res. 62:301–306. 2002.PubMed/NCBI
|
|
16
|
Reynaud-Deonauth S, Zhang H, Afouda A,
Taillefert S, Beatus P, Kloc M, Etkin LD, Fischer-Lougheed J and
Spohr G: Notch signaling is involved in the regulation of Id3 gene
transcription during Xenopus embryogenesis. Differentiation.
69:198–208. 2002. View Article : Google Scholar : PubMed/NCBI
|
|
17
|
Tam WF, Gu TL, Chen J, Lee BH, Bullinger
L, Fröhling S, Wang A, Monti S, Golub TR and Gilliland DG: Id1 is a
common downstream target of oncogenic tyrosine kinases in leukemic
cells. Blood. 112:1981–1992. 2008. View Article : Google Scholar : PubMed/NCBI
|
|
18
|
Birkenkamp KU, Essafi A, van der Vos KE,
da Costa M, Hui RC, Holstege F, Koenderman L, Lam EW and Coffer PJ:
FOXO3a induces differentiation of Bcr-Abl-transformed cells through
transcriptional down-regulation of Id1. J Biol Chem. 282:2211–2220.
2007. View Article : Google Scholar : PubMed/NCBI
|
|
19
|
Paolella BR, Havrda MC, Mantani A, Wray
CM, Zhang Z and Israel MA: p53 directly represses Id2 to inhibit
the proliferation of neural progenitor cells. Stem Cells.
29:1090–1101. 2011. View
Article : Google Scholar : PubMed/NCBI
|
|
20
|
Ponz-Sarvisé M, Nguewa PA, Pajares MJ,
Agorreta J, Lozano MD, Redrado M, Pio R, Behrens C, Wistuba II,
García-Franco CE, et al: Inhibitor of differentiation-1 as a novel
prognostic factor in NSCLC patients with adenocarcinoma histology
and its potential contribution to therapy resistance. Clin Cancer
Res. 17:4155–4166. 2011. View Article : Google Scholar : PubMed/NCBI
|
|
21
|
Hollnagel A, Oehlmann V, Heymer J, Rüther
U and Nordheim A: Id genes are direct targets of bone morphogenetic
protein induction in embryonic stem cells. J Biol Chem.
274:19838–19845. 1999. View Article : Google Scholar : PubMed/NCBI
|
|
22
|
O'Brien CA, Kreso A, Ryan P, Hermans KG,
Gibson L, Wang Y, Tsatsanis A, Gallinger S and Dick JE: ID1 and ID3
regulate the self-renewal capacity of human colon cancer-initiating
cells through p21. Cancer Cell. 21:777–792. 2012. View Article : Google Scholar : PubMed/NCBI
|
|
23
|
Nam HS and Benezra R: High levels of Id1
expression define B1 type adult neural stem cells. Cell Stem Cell.
5:515–526. 2009. View Article : Google Scholar : PubMed/NCBI
|
|
24
|
Barrett LE, Granot Z, Coker C, Iavarone A,
Hambardzumyan D, Holland EC, Nam HS and Benezra R: Self-renewal
does not predict tumor growth potential in mouse models of
high-grade glioma. Cancer Cell. 21:11–24. 2012. View Article : Google Scholar : PubMed/NCBI
|
|
25
|
Salic A and Mitchison TJ: A chemical
method for fast and sensitive detection of DNA synthesis in vivo.
Proc Natl Acad Sci USA. 105:2415–2420. 2008. View Article : Google Scholar : PubMed/NCBI
|
|
26
|
Yin M, Li X, Tan S, Zhou HJ, Ji W, Bellone
S, Xu X, Zhang H, Santin AD, Lou G and Min W: Tumor-associated
macrophages drive spheroid formation during early transcoelomic
metastasis of ovarian cancer. J Clin Invest. 126:4157–4173. 2016.
View Article : Google Scholar : PubMed/NCBI
|
|
27
|
Guo P, Lan J, Ge J, Mao Q and Qiu Y: ID1
regulates U87 human cell proliferation and invasion. Oncol Lett.
6:921–926. 2013.PubMed/NCBI
|
|
28
|
Lai X, Liao J, Lin W, Huang C, Li J, Lin
J, Chen Q and Ye Y: Inhibitor of DNA-binding protein 1 knockdown
arrests the growth of colorectal cancer cells and suppresses
hepatic metastasis in vivo. Oncol Rep. 32:79–88. 2014.PubMed/NCBI
|
|
29
|
Damdinsuren B, Nagano H, Kondo M, Natsag
J, Hanada H, Nakamura M, Wada H, Kato H, Marubashi S, Miyamoto A,
et al: TGF-beta1-induced cell growth arrest and partial
differentiation is related to the suppression of Id1 in human
hepatoma cells. Oncol Rep. 15:401–408. 2006.PubMed/NCBI
|
|
30
|
Musgrove EA, Caldon CE, Barraclough J,
Stone A and Sutherland RL: Cyclin D as a therapeutic target in
cancer. Nat Rev Cancer. 11:558–572. 2011. View Article : Google Scholar : PubMed/NCBI
|
|
31
|
Reya T, Morrison SJ, Clarke MF and
Weissman IL: Stem cells, cancer, and cancer stem cells. Nature.
414:105–111. 2001. View Article : Google Scholar : PubMed/NCBI
|
|
32
|
Ahmad A, Aboukameel A, Kong D, Wang Z,
Sethi S, Chen W, Sarkar FH and Raz A: Phosphoglucose
isomerase/autocrine motility factor mediates epithelial-mesenchymal
transition regulated by miR-200 in breast cancer cells. Cancer Res.
71:3400–3409. 2011. View Article : Google Scholar : PubMed/NCBI
|
|
33
|
Wells A, Yates C and Shepard CR:
E-cadherin as an indicator of mesenchymal to epithelial reverting
transitions during the metastatic seeding of disseminated
carcinomas. Clin Exp Metastasis. 25:621–628. 2008. View Article : Google Scholar : PubMed/NCBI
|
|
34
|
Guo Q, Guo P, Mao Q, Lan J, Lin Y, Jiang J
and Qiu Y: ID1 affects the efficacy of radiotherapy in glioblastoma
through inhibition of DNA repair pathways. Med Oncol. 30:3252013.
View Article : Google Scholar : PubMed/NCBI
|
|
35
|
Romero-Lanman EE, Pavlovic S, Amlani B,
Chin Y and Benezra R: Id1 maintains embryonic stem cell
self-renewal by up-regulation of Nanog and repression of Brachyury
expression. Stem Cells Dev. 21:384–393. 2012. View Article : Google Scholar : PubMed/NCBI
|
|
36
|
Chambers I, Colby D, Robertson M, Nichols
J, Lee S, Tweedie S and Smith A: Functional expression cloning of
Nanog, a pluripotency sustaining factor in embryonic stem cells.
Cell. 113:643–655. 2003. View Article : Google Scholar : PubMed/NCBI
|
|
37
|
Ivanova N, Dobrin R, Lu R, Kotenko I,
Levorse J, DeCoste C, Schafer X, Lun Y and Lemischka IR: Dissecting
self-renewal in stem cells with RNA interference. Nature.
442:533–538. 2006. View Article : Google Scholar : PubMed/NCBI
|
|
38
|
Boyer LA, Lee TI, Cole MF, Johnstone SE,
Levine SS, Zucker JP, Guenther MG, Kumar RM, Murray HL, Jenner RG,
et al: Core transcriptional regulatory circuitry in human embryonic
stem cells. Cell. 122:947–956. 2005. View Article : Google Scholar : PubMed/NCBI
|
|
39
|
Liu L, Wei X, Ling J, Wu L and Xiao Y:
Expression pattern of Oct-4, Sox2 and c-Myc in the primary culture
of human dental pulp derived cells. J Endod. 37:466–472. 2011.
View Article : Google Scholar : PubMed/NCBI
|
|
40
|
Mitsui K, Tokuzawa Y, Itoh H, Segawa K,
Murakami M, Takahashi K, Maruyama M, Maeda M and Yamanaka S: The
homeoprotein Nanog is required for maintenance of pluripotency in
mouse epiblast and ES cells. Cell. 113:631–642. 2003. View Article : Google Scholar : PubMed/NCBI
|
|
41
|
Piestun D, Kochupurakkal BS, Jacob-Hirsch
J, Zeligson S, Koudritsky M, Domany E, Amariglio N, Rechavi G and
Givol D: Nanog transforms NIH3T3 cells and targets cell-type
restricted genes. Biochem Biophys Res Commun. 343:279–285. 2006.
View Article : Google Scholar : PubMed/NCBI
|
|
42
|
Lin YL, Han ZB, Xiong FY, Tian LY, Wu XJ,
Xue SW, Zhou YR, Deng JX and Chen HX: Malignant transformation of
293 cells induced by ectopic expression of human Nanog. Mol Cell
Biochem. 351:109–116. 2011. View Article : Google Scholar : PubMed/NCBI
|
|
43
|
Lindgren AG, Natsuhara K, Tian E, Vincent
JJ, Li X, Jiao J, Wu H, Banerjee U and Clark AT: Loss of Pten
causes tumor initiation following differentiation of murine
pluripotent stem cells due to failed repression of Nanog. PLoS One.
6:e164782011. View Article : Google Scholar : PubMed/NCBI
|
|
44
|
Bourillot PY, Aksoy I, Schreiber V, Wianny
F, Schulz H, Hummel O, Hubner N and Savatier P: Novel STAT3 target
genes exert distinct roles in the inhibition of mesoderm and
endoderm differentiation in cooperation with Nanog. Stem Cells.
27:1760–1771. 2009. View Article : Google Scholar : PubMed/NCBI
|
|
45
|
Golubovskaya VM: FAK and Nanog cross talk
with p53 in cancer stem cells. Anticancer Agents Med Chem.
13:576–580. 2013. View Article : Google Scholar : PubMed/NCBI
|
|
46
|
Yang G, Zhang Y, Xiong J, Wu J, Yang C,
Huang H and Zhu Z: Downregulation of Id1 by small interfering RNA
in gastric cancer inhibits cell growth via the Akt pathway. Mol Med
Rep. 5:1075–1079. 2012.PubMed/NCBI
|
|
47
|
Ciarrocchi A, Jankovic V, Shaked Y, Nolan
DJ, Mittal V, Kerbel RS, Nimer SD and Benezra R: Id1 restrains p21
expression to control endothelial progenitor cell formation. PLoS
One. 2:e13382007. View Article : Google Scholar : PubMed/NCBI
|
|
48
|
Zhang D and Fan D: Multidrug resistance in
gastric cancer: Recent research advances and ongoing therapeutic
challenges. Expert Rev Anticancer Ther. 7:1369–1378. 2007.
View Article : Google Scholar : PubMed/NCBI
|
|
49
|
Jamieson ER and Lippard SJ: Structure,
recognition, and processing of cisplatin-DNA adducts. Chem Rev.
99:2467–2498. 1999. View Article : Google Scholar : PubMed/NCBI
|
|
50
|
Galluzzi L, Senovilla L, Vitale I, Michels
J, Martins I, Kepp O, Castedo M and Kroemer G: Molecular mechanisms
of cisplatin resistance. Oncogene. 31:1869–1883. 2012. View Article : Google Scholar : PubMed/NCBI
|