Introduction
Currently, hepatocellular carcinoma (HCC) is the
sixth most prevalent malignancy (1)
and the second leading cause of cancer-associated mortality
worldwide (2). Notably, ~50% of new
cases globally were in China in 2012 (3). Despite evidence that the utilization of
chemotherapeutic drugs has improved the clinical outcome of
patients with HCC (4,5), the effects have been limited owing to
drug resistance and toxicity. Thus, investigation of novel
non-toxic therapeutic drugs with the ability to prevent HCC growth
is urgently required.
Milk thistle extract is non-toxic and has been
applied to protect against liver damage in clinical settings, as
well as experimental models, for >2,000 years (6). Silymarin (SM), a complex mixture of
flavonoids, is extracted from the seeds of the milk thistle
(Silybum marianum). Notably, SM has been used as a
complementary and alternative treatment for patients with cancer
(7,8).
Nevertheless, the molecular mechanisms of anti-HCC-associated
effects of SM remain poorly understood.
Network biology has been demonstrated to be a
powerful tool for analyzing complex molecular networks that exert
important functions in the development and progression of disease
(9,10). Previously, studies have applied
dynamic changes in molecular networks to predict disease outcomes
(11,12). Since transcriptome information is the
most abundant form of omics data, co-expression networks have been
employed in the majority of studies (13–15).
However, a limitation of these previous studies was that networks
were built using only co-expression data; this decreases the
statistical power to screen pathways that are abnormal in diseased
conditions (16). Selecting groups of
genes that demonstrate coherent differential activities between
healthy and diseased conditions is a more powerful approach. These
gene groups directly capture the affected pathways. Thus, it is
useful to identify coherent differentially expressed gene modules
with common members, yet varied connectivity in differential
co-expression networks (DCNs) (11).
The present study utilized a novel module-search
algorithm method to screen for potential signatures and to
investigate the molecular mechanisms underlying anti-HCC associated
effects following SM treatment. First, gene expression data from
SM-treated HCC and control samples, generated by Lovelace et
al (17), were downloaded from
the European Molecular Biology Laboratory-European Bioinformatics
Institute (EMBL-EBI) database (www.ebi.ac.uk). Subsequently, the construction of DCN
was implemented if two connected genes exhibited associated
expression patterns across conditions and if the expression levels
of these two genes were markedly different between the SM-treated
HCC and control condition. Following that, the DCN was analyzed to
identify modules through three major steps: i) Seed gene selection;
ii) module search by seed expansion and entropy minimization; and
iii) module refinement. The statistical significance of modules was
then computed to select the differential modules (DMs); core
modules were detected using the attract method (18), followed by pathway enrichment analysis
for core modules. Finally, validation tests were implemented to
verify the results. The present study aimed to contribute to the
understanding of potential action mechanisms associated with SM
inhibition of HCC growth.
Materials and methods
Microarray data
The gene expression profile dataset E-GEOD-50994,
generated by Lovelace et al (17), was downloaded from the EMBL-EBI
database (www.ebi.ac.uk/), based on the A-AFFY-141
platform of the Affymetrix Human Gene 1.0 ST Array (HuGene-1_0-st).
Gene expression data of E-GEOD-50994, containing 10 human
SM-treated HCC samples and 14 human dimethyl sulfoxide-treated HCC
control group samples, were obtained and the probes were mapped to
the gene symbols. A total of 12,227 genes were identified.
Protein-protein interaction network
(PPIN)
The PPIN ensemble (the network constructed by all
PPI interactions) containing 787,896 interactions and 16,730 genes
was obtained from the String database (string.embl.de; accessed June, 2016). Subsequently,
the 12,227 genes identified from the aforementioned microarray data
were mapped to the PPIN and a novel PPIN was created.
DCN construction
DCN construction comprised two steps. First, a
binary co-expression network was constructed prior to assignment of
edge weight based on differential gene expression between the
SM-treated-HCC and control groups. To construct the binary gene
co-expression network, edges were selected according to the
absolute value of the Pearson's correlation coefficient (PCC) of
the expression profiles of two genes. Briefly, after obtaining gene
expression values between the SM-treated-HCC and control groups,
the PCC of the interactions of a novel PPIN in different conditions
were computed (SM-treated HCC and control samples), determined as
A1 and A2. Similarly, the absolute value of the difference of PCC
between two groups, marked as δ-values, was also computed. In an
attempt to eliminate indirect correlation due to a third gene, the
utilization of the first order partial PCC was implemented, as
previously described (19). Only
edges with correlations greater than the pre-defined threshold
δ-values were chosen. In the current study, the δ-value was set at
0.9, such that the maximal number of genes was connected in the DCN
to be constructed.
Subsequently, edge weights were assigned in the
binary co-expression network based on the P-value of differential
gene expression in SM-treated HCC and control conditions. In the
present study, a one-sided Student's t-test was applied to identify
differential gene expression for microarray data. The weight
wi, j on edge (i, j) in the DCN was defined
as follows:
wi,j={(logpi+logpj)1/2(2*0,max1∈V|logP1|)1/2,ifcor(i,j)≥δ,ifcor(i,j)<δ,
where pi and pj were
respective P-values of differential expression for genei
and genej. V denoted the number of nodes in the DCN, and
cor(i,j) represented the absolute value of PCC between
genei and genej based on their expression
profiles. Under the weighting scheme, genes that were co-expressed
and demonstrated marked differential expression were assigned
higher weights.
Identification of modules in DCN
Module search is used to screen gene modules with
common members but varied connectivity across multiple molecular
interaction networks (11). The
identification of modules comprises three stages: i) Seed
prioritization; ii) module identification by seed expansion; and
iii) entropy minimization and refinement of candidate modules.
Seed prioritization
Seed prioritization sorted genes in the DCN using
the topological measurement (degree) analysis. In brief, for DCN,
Gk=(V, Ek) (1≤k≤M) with an adjacency matrix
Ak=(aijk)nxn, a function was
constructed to compute the importance of vertex i as follows:
g(i)=∑j∈nk(i) A'ijkg(j), where Gk
refers to DCN, aijk denoted the weight on the edge(i,j),
wi,j, in network Gk, V refers to the count of nodes in
the DCN Gk, g(i) stands for the importance of vertex i in the DCN,
Nk(i) was the set of neighbors of gene i in
Gk; Akrepresented the degree normalized
weighted adjacency matrix that was calculated as
A'k=D−1/2 Ak D1/2 where
D was the diagonal matrix.
For each gene, DCN rank was acquired, marked as
g=[g(1), …,
g(M)], then a z-score was computed for each rank
g(l). Subsequently, the rank was obtained for that gene
in the DCN by averaging the z-scores. The top 1% of genes was
extracted as the seed genes.
Module search
Module search repeatedly included genes whose
addition caused the maximum decrease in the graph entropy-based
objective function until there was no decrease in the objective
function. For a given seed gene v ε V, V was treated as a module
C={v}. For each vertex, u, in its neighborhood in the DCN, N(v) was
defined as N(v)=UiNi(v), where
Ni(v) was the neighbor set in Gi as the
candidate for module C. For each u ε N(v), the entropy decrease was
computed between the novel module C'=CU{v} and C, that was to say,
ΔH (C', C)=H(C)-H(C'). If ΔH (C', C) was >0; this meant the
addition of vertex u improved the connectivity of the module C. The
vertex u whose addition maximizes ΔH was added to module C. If
there were more than one vertex contained at each stage, one was
randomly selected. The expansion stage stopped when no additional
vertex could further decrease the entropy of the evolving
module.
Refinement of candidate modules
In the refinement stage, the modules with node sizes
<5 were removed. Jaccard index (11), the ratio of intersection over union
for two sets, was utilized to merge the overlapping modules. In the
present study, a Jaccard index not <0.5 was used.
Statistical significance of
modules
The statistical significance of modules was computed
on the basis of the null score distribution of modules produced by
randomized networks. In the present study, the networks with the
same size of interactions in DCN that were extracted from the novel
PPIN were determined as randomized networks. Each network was
completely randomized 100 times through degree-preserved edge
shuffling. In an attempt to obtain the null distribution of module
scores, a module search was performed on the randomized networks.
Next, the empirical P-value of a module was computed as the
probability of the module having a smaller score by chance based on
the following formula: P=∑(count (HR)> count
(HDCN))/count (HR), Where the count
(HR) was the number of modules generated by randomized
networks, count (HDCN) denoted the number of modules
produced by DCN.
After obtaining P-values, the false discovery rate
(FDR) was used to adjust the P-values, which was computed using the
Benjamini & Hochberg method (20). In the present study, FDR≤0.05 was
regarded as significant. To select activated core modules whose
expression distinguished control and SM-treated HCC samples, the
attract method (18) was used.
Modules with a FDR≤0.05 were considered as core modules.
Pathway enrichment analysis for genes
of core modules
Kyoto Encyclopedia of Genes and Genomes (KEGG) is a
reference knowledge database for comprehending biological processes
through pathway aligning to map genes to reference pathways to
deduce cell behaviors (21). In the
present study, to understand the biological functions of core
modules further, the Database for Annotation, Visualization and
Integrated Discovery (DAVID; https://david.ncifcrf.gov/home.jsp) (22) was utilized to perform pathway
enrichment analysis for the genes in core modules to identify
significant pathways. Significant pathways were extracted when the
FDR was set as 0.01.
Validation test of effects of SM on key
genes
Patient subjects
In total, 40 patients with HCC and 20 healthy
volunteers were enrolled in the present study. Among these 40
patients, 20 subjects were treated with SM, whereas the remaining
20 cases were not. Furthermore, 20 healthy volunteers were included
as the normal control group. No significant differences were
observed in sex, age, case history or regional distribution. Among
these 40 patients, there were 23 females and 17 males. The average
age was 48.34±5.14 years (range, 42–56 years). All participates
were recruited between May 2014 and May 2015 in The Red Flag
Hospital (Mudanjiang, China). The experimental protocol was
approved by the Human Research Ethics Committee and the
Confidentiality of Health Information Committee of The Red Flag
Hospital. Written informed consent was obtained from all
participants. HCC tissues were obtained from the SM-treated and
untreated HCC groups, and liver tissues was obtained from the
normal control samples to conduct the subsequent experiments.
RT-PCR analysis
A TRIzol RNA extraction kit (cat. no. 15596-026;
Invitrogen; Thermo Fisher Scientific, Inc., Waltham, MA, USA) to
extract total RNA from the HCC tissues. Next, SuperScript II RNase
H reverse transcriptase (Invitrogen; Thermo Fisher Scientific,
Inc.) was used to synthesize cDNA. The cDNAs were sub-packaged and
stored at −20°C. Subsequently, synthesized cDNAs were utilized as
templates for PCR amplification and β-actin was used as an internal
control gene to check the consistency of RT. The sequences of
primers of selected genes for PCR amplification are listed in
Table I. PCR amplification was
conducted by means of the following experimental protocol: 10 µl
10X PCR buffer (Eurogentec Ltd., Seraign, Belgium), 1 µl TaqDNA
polymerase (Eurogentec Ltd.; 5 U/µl), 3 µl upstream primers, 3 µl
downstream primers and 8 µl dNTPs. Table
II presented the amplification thermocycling conditions. PCR
products were run on a 1.5% agarose gel at 100 mV for 30 min,
stained with ethidium bromide (5 µl/100 ml), visualized using a UV
transilluminator, and analyzed using Quantity One software (v.4.2,
Bio-Rad Laboratories, Hercules, CA, USA). The experiment was
repeated three times and plotted as the mean ± standard
deviation.
 | Table I.Sequence of primers of the selected
genes. |
Table I.
Sequence of primers of the selected
genes.
| Gene | Primer sequence,
5′-3′ |
|---|
| TOPBP1 |
|
|
Forward |
GAACTTGCCCCCTAGTGGTGAACTCTTACT |
|
Reverse |
ATCACGGAAGCCACGTCCTCTCGGCGTCAA |
| CDCA3 |
|
|
Forward |
GAATTCGGTTGAGATGGGCTCAGCCAA |
|
Reverse |
TCTAGAGCCCTGGGTGACTGCATTGCT |
| NUSAP1 |
|
|
Forward |
AAACTTACAAACAACCCCATCTCC |
|
Reverse |
GTTTCTTCGGTTGCTCTTCCTTT |
| β-actin |
|
|
Forward |
CTCCATCCTGGCCTCGCTGT |
|
Reverse |
GCTGTCACCTTCACCGTTCC |
| Table II.Polymerase chain reaction
amplification conditions. |
Table II.
Polymerase chain reaction
amplification conditions.
| Gene | Response
conditions |
|---|
| TOPBP1 | Pre-degeneration at
95°C for 2 min, degeneration at 94°C for 30 sec, annealing at 58°C
for 30 sec, extension at 72°C for 30 sec for 40 cycles and
extension at 72°C for 10 min. |
| CDCA3 | Pre-degeneration at
95°C for 2 min, degeneration at 94°C for 1 min, annealing at 62°C
for 30 sec, extension at 68°C for 1 min for 45 cycles and extension
at 72°C for 7 min. |
| NUSAP1 | Pre-degeneration at
95°C for 5 min, degeneration at 95°C for 20 sec, annealing at 56°C
for 30 sec, extension at 72°C for 30 sec for 40 cycles and
extension at 72°C for 7 min. |
| β-actin | Pre-degeneration at
94°C for 3 min, degeneration at 94°C for 60 sec, annealing at 56°C
for 30 sec, extension at 72°C for 60 sec for 40 cycles and
extension at 72°C for 7 min. |
Statistical analysis
Feature Extraction software (version 10.7; Agilent
Technologies, Inc., Santa Clara, CA, USA) was used to analyze the
statistical significance of the microarray results. The original
data were normalized based on the Quantile Normalization Algorithm
(Agilent Technologies, Inc.). Quantile normalization was conducted
using function ‘normalize.quantiles’ from an R package (23). PCC was used to calculate the edge
weight. One-sided Student's t-test was applied to identify
differential gene expression for microarray data between two
groups. One-way analysis of variance, followed by
Student-Newman-Keuls post hoc test, was used to assess the changes
of the key genes in verification test across more than two
conditions. The FDR was calculated to correct the raw P-values. The
threshold value applied to designate core module was FDR≤0.05, and
the cut-off criteria for significant pathways was FDR<0.01.
P<0.05 was considered to indicate a statistically significant
difference. In the present study, SPSS version 18.0 (SPSS, Inc.,
Chicago, IL, USA) was used for statistical analysis.
Results
Overview of the module-search
algorithm for screening shared co-expression modules in DCN
In an attempt to measure the dynamics of pathway
connectivity, a novel method, module-search algorithm, was utilized
to identify shared sub-networks in the DCN. These sub-networks were
modules that comprised the same set of genes yet potentially
different connectivity among the gene members. By means of this
algorithm, the dynamic changes in module connectivity were
quantified. Coupled with network topological measurements, the
prior probabilities were utilized to sort and select seed genes.
Module identification problems were transformed into minimum
entropy problems by adding a graph-entropy-based objective function
to the modules. Empirical P-values of candidate modules were
determined through randomized networks.
Construction of DCN
The genes from the microarray data were aligned to
the ensemble PPIN, a novel PPIN including 10,859 genes and 351,047
interactions was obtained. To construct a gene co-expression
network, edges were selected according to the absolute value of PCC
of the expression profiles of two genes. With δ>0.9, a total of
3,395 edges and 1,876 nodes were selected to construct the DCN.
Identification of modules in DCN
On the basis of the z-score distribution of 1,876
nodes in DCN, 18 genes possessed a top 1% z-score value and were
selectively termed as seed genes (Table
III). Among these 18 seed genes, the z-score values of 4 genes
were >270, for example: Geminin, DNA replication inhibitor
(z-score, 329.58); non-SMC condensin I complex, subunit G (z-score,
290.38); kinesin family member 11 (z-score, 284.85); and cyclin B1
(z-score, 272.13). Subsequently, a module search was performed by
taking the 18 seed genes as initial genes, according to entropy
decrease, to identify candidate modules. Following the removal of
modules with <5 nodes, the modules were merged based on a
Jaccard index ≥0.5, and 12 modules (modules 1–12) were
identified.
| Table III.Seed genes and the distribution of
z-scores. |
Table III.
Seed genes and the distribution of
z-scores.
| Row | Gene | Z-score |
|---|
| 1 | GMNN | 329.58 |
| 2 | NCAPG | 290.38 |
| 3 | KIF11 | 284.85 |
| 4 | CCNB1 | 272.13 |
| 5 | NCAPH | 234.93 |
| 6 | NUSAP1 | 227.92 |
| 7 | DLGAP5 | 226.55 |
| 8 | ECT2 | 214.57 |
| 9 | NUP107 | 208.83 |
| 10 | NDC80 | 201.93 |
| 11 | ANLN | 201.44 |
| 12 | KIF20A | 189.95 |
| 13 | TOPBP1 | 187.53 |
| 14 | GINS1 | 182.10 |
| 15 | CDCA3 | 180.81 |
| 16 |
ARHGAP11A | 169.74 |
| 17 | ASPM | 167.06 |
| 18 | KIF2C | 166.63 |
Identification of DMs
On the basis of the FDR distribution, it was
revealed that the FDR values of the aforementioned 12 modules were
<0.05, indicating significance. Using gene expression data from
SM-treated-HCC and control samples, the core modules whose
differential expression distinguished between the treated and
control samples were isolated using the attract method. On the
basis of the criteria, 4 core modules were observed including
module 11 (FDR, 6.96×10⁻⁵), module 5 (FDR,
1.01×10⁻³), module 6 (FDR, 1.13×10⁻²) and
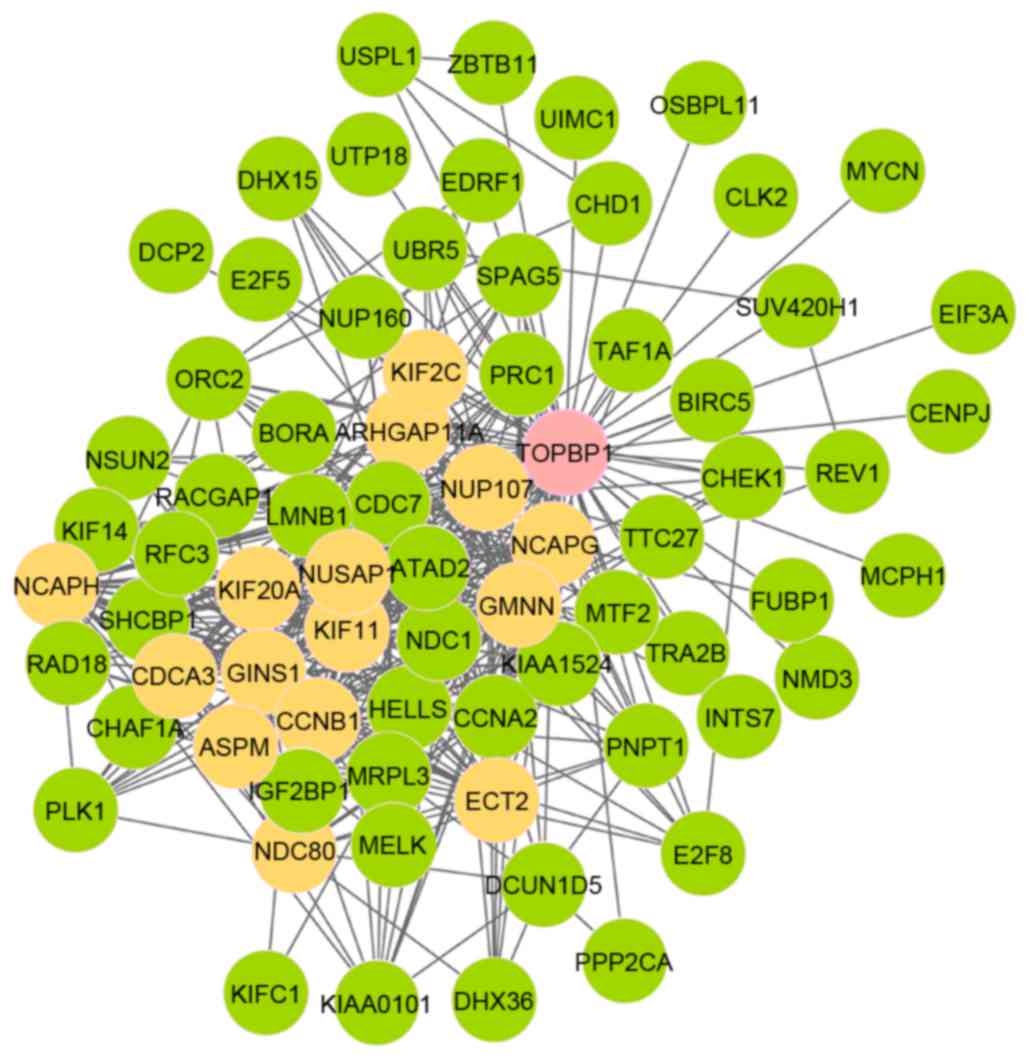
module 12 (FDR, 1.13×10⁻²), as presented in Table IV. Among these, there were 73 nodes
and 420 edges in module 11 (Fig. 1).
Furthermore, out of the 73 nodes, 16 genes were seed genes and the
initial gene was DNA topoisomerase 2-binding protein 1
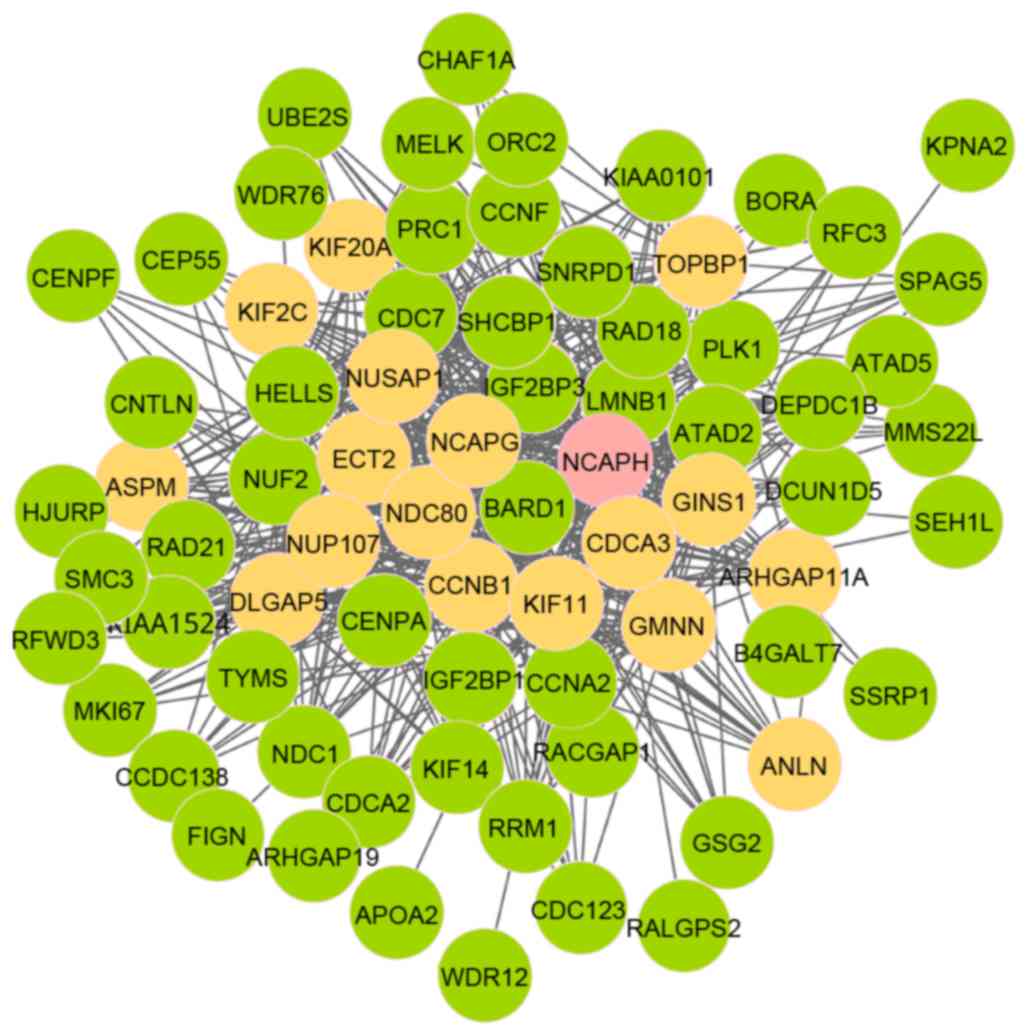
(TOPBP1). As presented in Fig.
2, there were 74 nodes and 553 edges in module 5, involving 18
seed genes. Notably, the initial seed gene was non-SMC condensing I
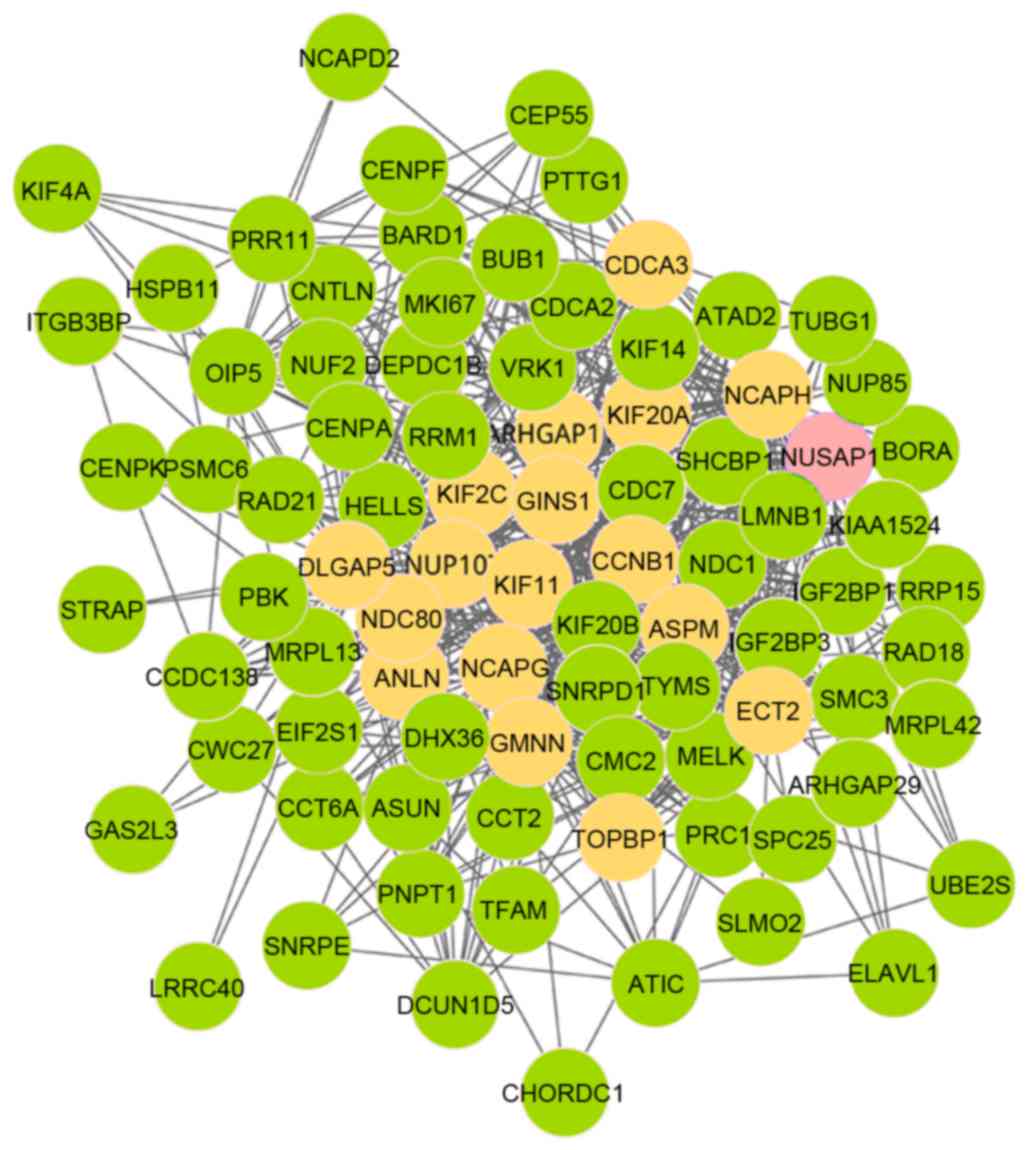
complex, subunit H (NCAPH). Fig.
3 demonstrates that there were 86 nodes and 634 edges in module
6, which was also involved in 18 seed genes. In addition, nucleolar
and spindle-associated protein 1 (NUSAP1) was the initial
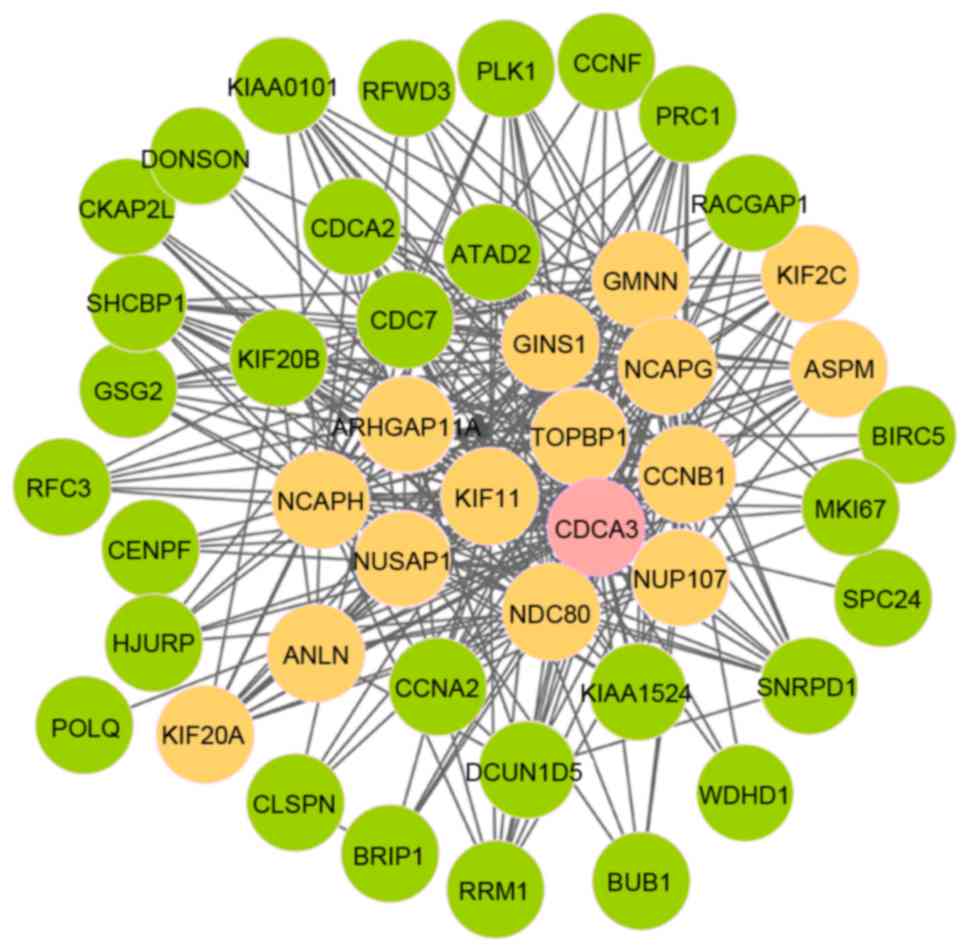
seed gene. As presented in Fig. 4,
module 12 comprised 46 nodes and 315 edges; furthermore, there were
16 seed genes and cell division cycle associated 3 (CDCA3)
was the initial seed gene.
| Table IV.Core modules and initial seed
genes. |
Table IV.
Core modules and initial seed
genes.
| Module | FDR | Initial seed
genes |
|---|
| 11 |
6.96×10⁻⁵ | TOPBP1 |
| 5 | 1.01×10⁻³ | NCAPH |
| 6 |
1.13×10⁻² | NUSAP1 |
| 12 | 1.13×10⁻² | CDCA3 |
Pathway enrichment analysis for genes
in the core modules
Using DAVID and KEGG, pathway enrichment analysis of
genes in the core modules was conducted. When the threshold
criteria of FDR<0.05 was applied, two pathways for module 12
were identified (cell cycle and progesterone-mediated oocyte
maturation). Module 11 was primarily enriched in two biological
process terms; cell cycle and RNA transport. Module 5 was only
involved in one pathway (cell cycle). Module 6 was involved in two
pathways, including cell cycle and RNA transport. Notably, the cell
cycle pathway was simultaneously enriched by all core modules.
Specific information is presented in Table V.
| Table V.Significant pathways for core modules
based on FDR<0.05. |
Table V.
Significant pathways for core modules
based on FDR<0.05.
| Module | Category | Term | FDR |
|---|
| 11 | KEGG_PATHWAY | Cell cycle |
1.56×10⁻⁴ |
|
|
| RNA transport | 4.63×10⁻² |
| 5 | KEGG_PATHWAY | Cell cycle |
4.02×10⁻⁴ |
| 6 | KEGG_PATHWAY | Cell cycle | 3.95×10⁻² |
|
|
| RNA transport |
2.66×10⁻² |
| 12 | KEGG_PATHWAY | Cell cycle | 4.57×10⁻⁴ |
|
|
|
Progesterone-mediated oocyte
maturation |
2.54×10⁻³ |
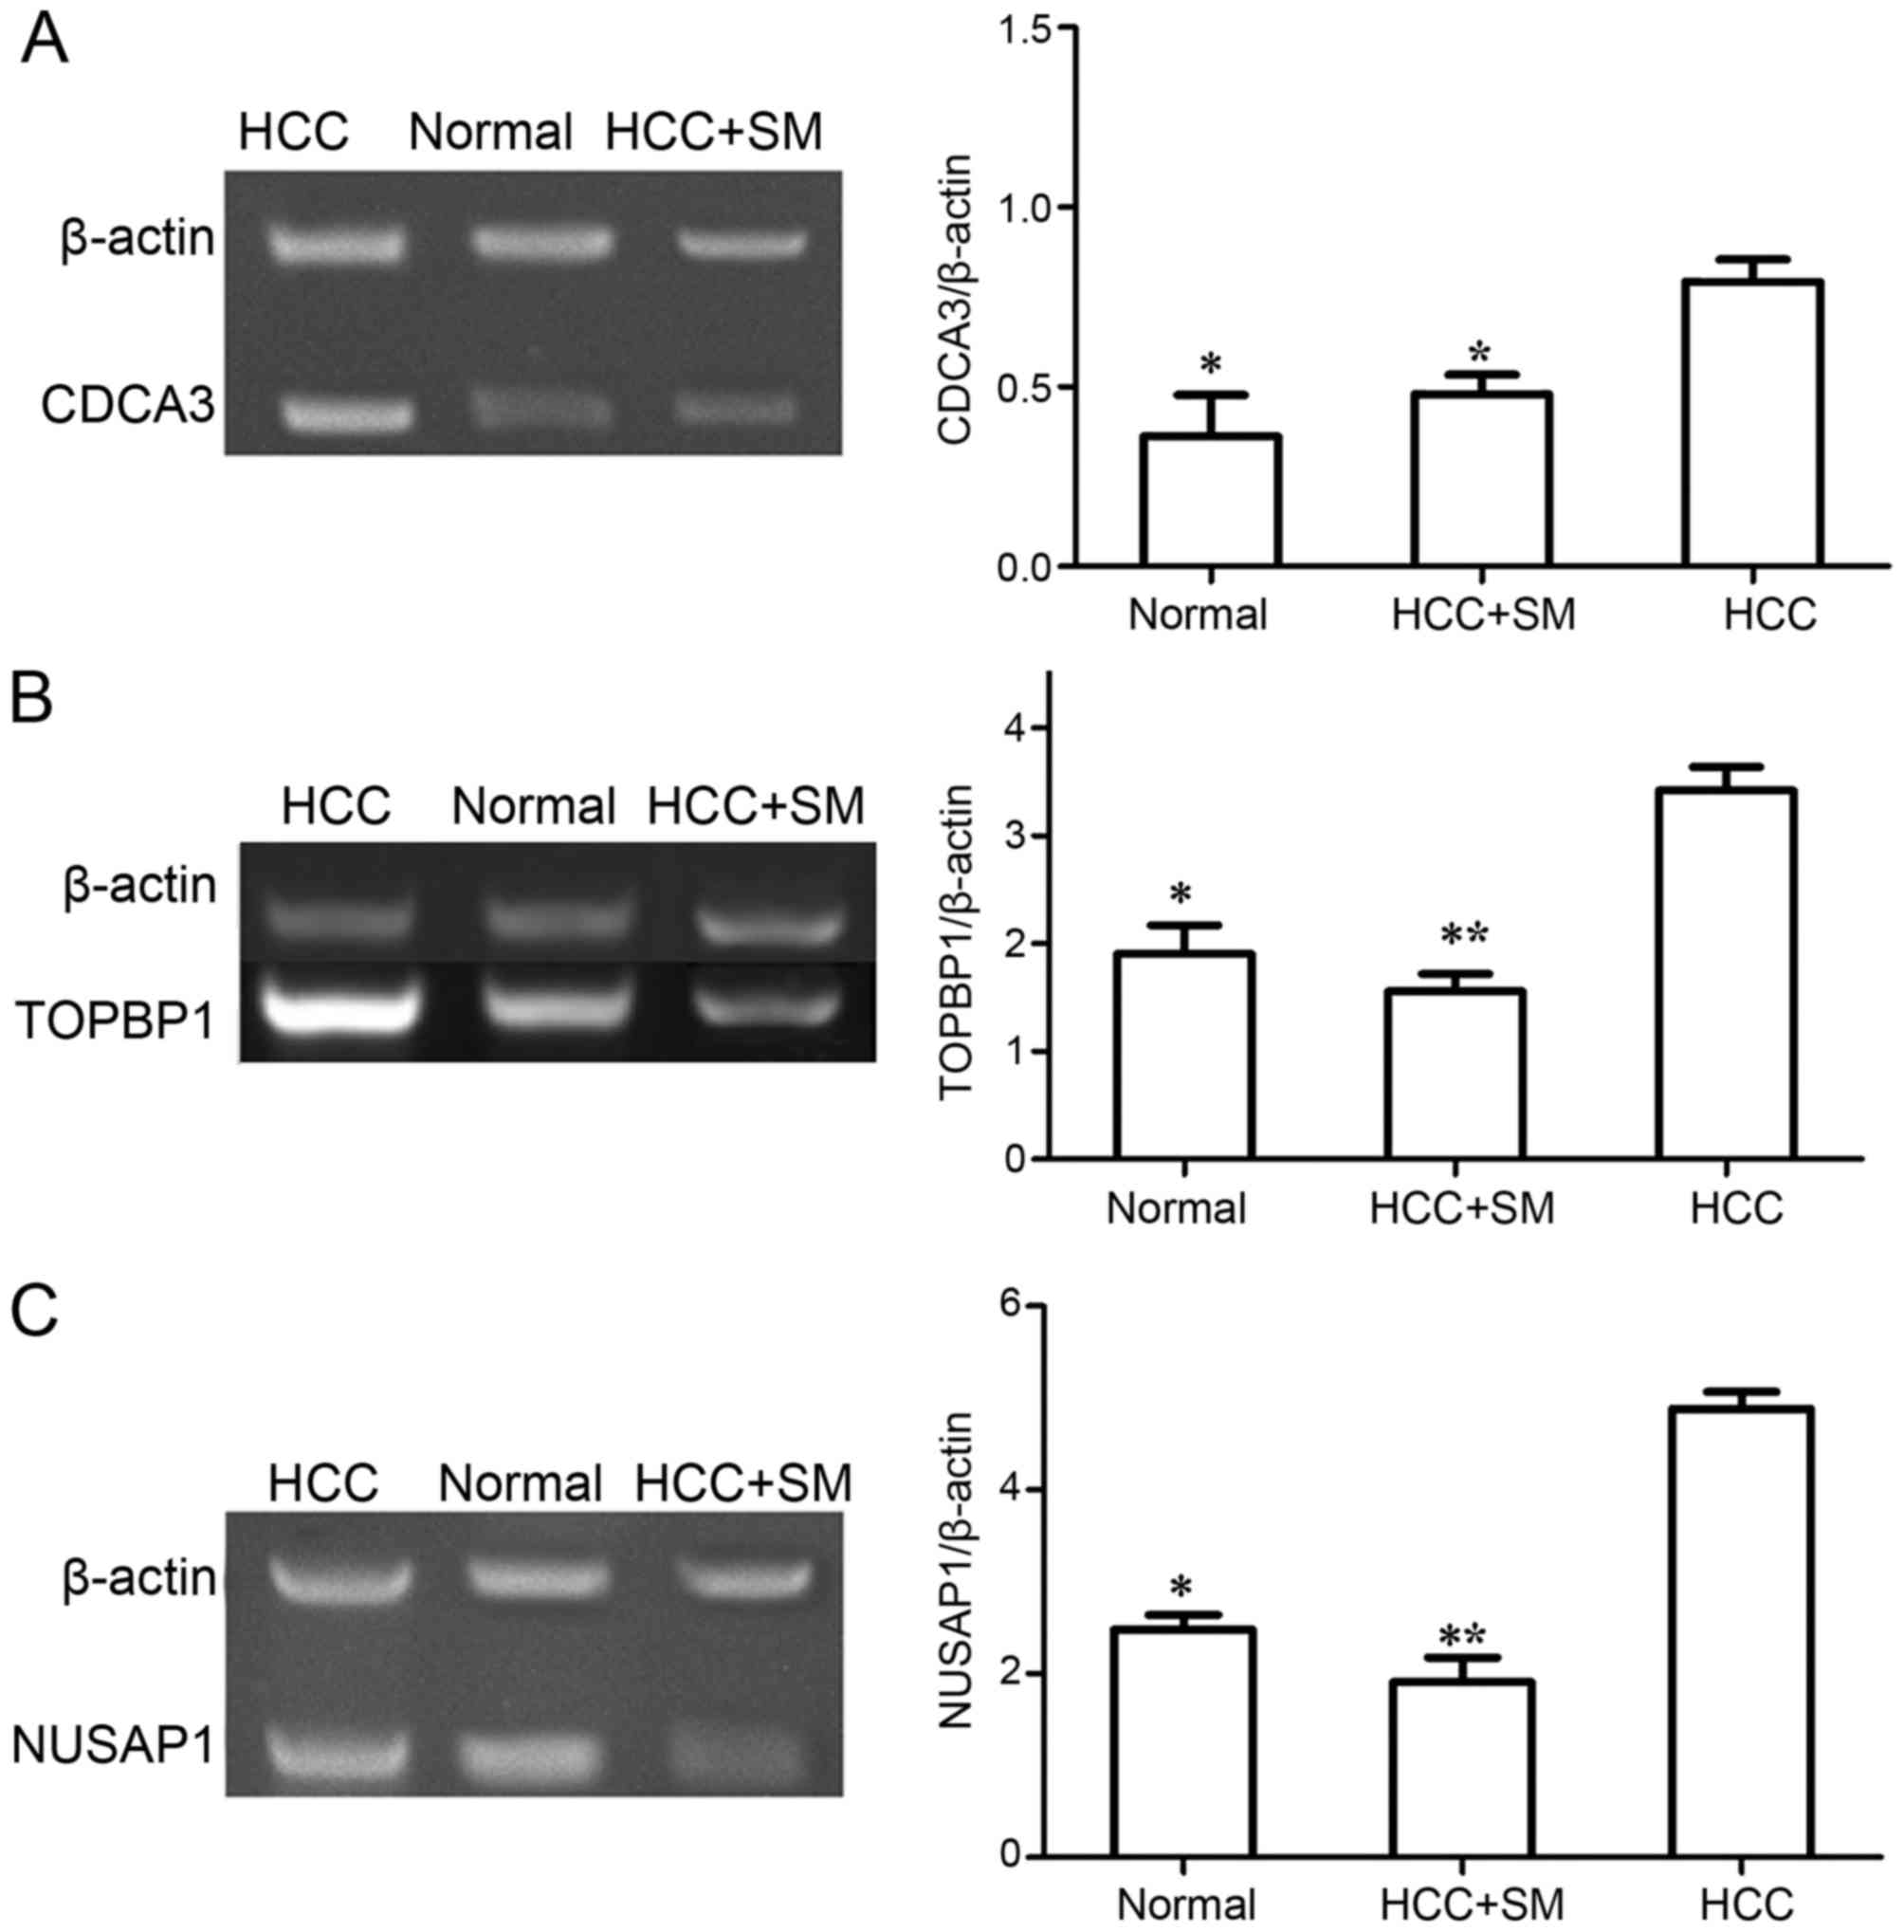
Validation test
In the present study, PCR was employed to verify the
mRNA expression levels of key genes (TOPBP1, CDCA3
and NUSAP1) identified from bioinformatic analysis. The
relative expression level of these genes examined by PCR is
presented in Fig. 5. The expression
level of TOPBP1, CDCA3 and NUSAP1 were
significantly increased in the non-treated HCC group compared with
that in normal group (P<0.05). Furthermore, following SM
treatment in HCC samples, the expression levels of CDCA3
(P<0.05), TOPBP1 (P<0.001) and NUSAP1
(P<0.001) were significantly decreased compared with untreated
HCC. Furthermore, although the expression level of TOPBP1
and NUSAP1 in SM-treated HCC group was decreased compared to
that in normal group, no statistical difference was observed
(P>0.05). In addition, there was no difference in the expression
level of CDCA3 between the normal and SM-treated HCC group
(P>0.05), despite CDCA3 being increased in the SM-treated
HCC group compared with that in normal.
Discussion
The utilization of SM has previously been
recommended for the treatment of liver conditions, including
toxin-induced liver damage, and as a supportive treatment for
chronic inflammatory liver conditions (24). Nevertheless, the underlying molecular
mechanisms of SM on HCC remain not fully understood. In the present
study, novel gene modules for investigating the mechanisms of
anti-HCC effects of SM were analyzed using the module-search
algorithm. The results of the present study demonstrated that a
total of 12 DMs were selected. Among these DMs, modules 11, 5, 6
and 12 were core modules with initial seed genes TOPBP1,
NCAPH, NUSAP1 and CDCA3, respectively.
Notably, it was revealed that the cell cycle pathway was
simultaneously enriched by all core modules. Furthermore, the
expression verification of TOPBP1, NUSAP1 and
CDCA3 using RT-PCR identified that SM was able to inhibit
the progression of HCC by decreasing the expression of these key
genes.
TOPBP1, which interacts with topoisomerase IIβ, has
been demonstrated to be necessary for mitotic progression (25). Evidence has demonstrated that TOPBP1
co-localizes with breast cancer type 1 susceptibility protein at
dysregulated replication forks and exerts important functions in
the DNA damage response and DNA replication (26). Generally, DNA damage response disrupts
the cell cycle by triggering checkpoint mechanisms; the inability
to control a normal DNA damage response results in genomic
instability is a hallmark of the majority of different types of
cancer (27,28). Notably, a previous study demonstrated
that SM is able to decrease DNA damage in skin cancer (29). In light of these aforementioned
studies, it may be inferred that the inhibitory effect of SM on HCC
development, by regulating TOPBP1, highlights the potential
use of SM in controlling the DNA damage response in HCC.
NUSAP1, a significant mitotic regulator, is crucial
for numerous cellular events during mitosis including spindle
assembly and cytokinesis (30).
Furthermore, the deregulation of mitosis is a common
characterization of the majority of different types of cancer
(31,32). In previous studies, NUSAP1 has
been demonstrated to be upregulated in several malignant types of
cancer, including breast cancer (33)
and HCC (34). Notably, deletion of
NUSAP1 has been revealed to arrest the cell cycle in
G2-M phase (30). A
previous study demonstrated that SM treatment markedly reduced the
formation of the mitotic spindle in fumonisin B1-induced
hepatotoxicity (35). Therefore, it
was speculated that the anti-HCC effects of SM may downregulate
NUSAP1 to further induce cell-cycle arrest.
Cancer is characterized by uncontrolled cellular
proliferation caused by the dysregulation of the cell cycle
(36). CDCA3, a component of
Skp1-cullin-F-box, is a regulator of mitosis (37). Notably, kinesin family member 18B and
CDCA3 have been demonstrated to exert crucial functions in HCC by
inducing cell cycle progression (38). Deep et al (39) suggested that SM suppresses cellular
proliferation and induces G1 and G2-M phase
cell cycle arrest in human prostate cancer. Furthermore, another
study demonstrated that SM promotes cell cycle arrest in ovarian
cancer (40). Hence, the suppression
effects of SM on HCC progression may be attributed to the induction
of cell cycle arrest, partially via regulating the expression of
CDCA3.
On the basis of the PCR results, it was identified
that the expression levels of TOPBP1, CDCA3 and
NUSAP1 were significantly increased in untreated HCC
compared with that in the normal group. Furthermore, following SM
treatment in HCC samples, the level of CDCA3, TOPBP1 and
NUSAP1 was significantly decreased compared with that in the
untreated HCC group. These results further demonstrated that
patients with HCC may benefit from SM treatment based on the
expression of these key genes.
Although several significant gene modules were
obtained in the present study, certain limitations must be taken
into consideration. First, the sample size was limited.
Additionally, the study implemented bioinformatic analysis based on
published datasets and the results were validated using the samples
obtained in the present study; however, no microarray or
next-generation sequencing (NGS) analysis was performed on this
this data. Therefore, further investigation is required to
investigate the molecular mechanisms underlying the anti-HCC
effects of SM based on microarray or NGS analysis of the primary
data acquired in the present study.
In summary, the results of the present study may
provide a theoretical basis of the underlying molecular mechanisms
involved in anti-HCC effect of SM treatment. TOPBP1,
NUSAP1 and CDCA3 of the core modules may serve
important functions in the suppression of HCC by SM. The
aforementioned results may assist in the understanding of molecular
mechanism of HCC development.
References
|
1
|
Romaguera D, Vergnaud AC, Peeters PH, van
Gils CH, Chan DS, Ferrari P, Romieu I, Jenab M, Slimani N,
Clavel-Chapelon F, et al: Is concordance with world cancer research
fund/American institute for cancer research guidelines for cancer
prevention related to subsequent risk of cancer? Results from the
EPIC study. Am J Clin Nutr. 96:150–163. 2012. View Article : Google Scholar : PubMed/NCBI
|
|
2
|
Ferlay J, Soerjomataram I, Dikshit R, Eser
S, Mathers C, Rebelo M, Parkin DM, Forman D and Bray F: Cancer
incidence and mortality worldwide: sources, methods and major
patterns in GLOBOCAN 2012. Int J Cancer. 136:E359–E386. 2015.
View Article : Google Scholar : PubMed/NCBI
|
|
3
|
Wang YC, Wei LJ, Liu JT, Li SX and Wang
QS: Comparison of cancer incidence between China and the USA.
Cancer Biol Med. 9:128–132. 2012.PubMed/NCBI
|
|
4
|
Khan M, Li T, Ahmad Khan MK, Rasul A,
Nawaz F, Sun M, Zheng Y and Ma T: Alantolactone induces apoptosis
in HepG2 cells through GSH depletion, inhibition of STAT3
activation, and mitochondrial dysfunction. Biomed Res Int.
2013:7198582013. View Article : Google Scholar : PubMed/NCBI
|
|
5
|
Kojima S, Okuno M, Matsushima-Nishiwaki R,
Friedman SL and Moriwaki H: Acyclic retinoid in the chemoprevention
of hepatocellular carcinoma (Review). Int J Oncol. 24:797–805.
2004.PubMed/NCBI
|
|
6
|
Deep G, Gangar SC, Rajamanickam S, Raina
K, Gu M, Agarwal C, Oberlies NH and Agarwal R: Angiopreventive
efficacy of pure flavonolignans from milk thistle extract against
prostate cancer: Targeting VEGF-VEGFR signaling. PLoS One.
7:e346302012. View Article : Google Scholar : PubMed/NCBI
|
|
7
|
Yurtcu E, Kasapoğlu E and Şahin Fİ:
Protective effects of β-carotene and silymarin on human
lymphocytes. Turk J Biol. 36:47–52. 2012.
|
|
8
|
Ramasamy K and Agarwal R: Multitargeted
therapy of cancer by silymarin. Cancer Lett. 269:352–362. 2008.
View Article : Google Scholar : PubMed/NCBI
|
|
9
|
He D, Liu ZP, Honda M, Kaneko S and Chen
L: Coexpression network analysis in chronic hepatitis B and C
hepatic lesions reveals distinct patterns of disease progression to
hepatocellular carcinoma. J Mol Cell Biol. 4:140–152. 2012.
View Article : Google Scholar : PubMed/NCBI
|
|
10
|
Liu ZP, Wang Y, Zhang XS and Chen L:
Network-based analysis of complex diseases. IET Syst Biol. 6:22–33.
2012. View Article : Google Scholar : PubMed/NCBI
|
|
11
|
Ma X, Gao L and Tan K: Modeling disease
progression using dynamics of pathway connectivity. Bioinformatics.
30:2343–2350. 2014. View Article : Google Scholar : PubMed/NCBI
|
|
12
|
Ma S, Calhoun VD, Phlypo R and Adalı T:
Dynamic changes of spatial functional network connectivity in
healthy individuals and schizophrenia patients using independent
vector analysis. Neuroimage. 90:196–206. 2014. View Article : Google Scholar : PubMed/NCBI
|
|
13
|
Ruan J, Dean AK and Zhang W: A general
co-expression network-based approach to gene expression analysis:
Comparison and applications. BMC Syst Biol. 4:82010. View Article : Google Scholar : PubMed/NCBI
|
|
14
|
Mao L, Van Hemert JL, Dash S and Dickerson
JA: Arabidopsis gene co-expression network and its functional
modules. BMC Bioinformatics. 10:3462009. View Article : Google Scholar : PubMed/NCBI
|
|
15
|
Yang Y, Han L, Yuan Y, Li J, Hei N and
Liang H: Gene co-expression network analysis reveals common
system-level properties of prognostic genes across cancer types.
Nat Commun. 5:32312014.PubMed/NCBI
|
|
16
|
Ma X, Gao L, Karamanlidis G, Gao P, Lee
CF, Garcia-Menendez L, Tian R and Tan K: Revealing pathway dynamics
in heart diseases by analyzing multiple differential networks. PLoS
Comput Biol. 11:e10043322015. View Article : Google Scholar : PubMed/NCBI
|
|
17
|
Lovelace ES, Wagoner J, MacDonald J,
Bammler T, Bruckner J, Brownell J, Beyer RP, Zink EM, Kim YM, Kyle
JE, et al: Silymarin suppresses cellular inflammation by inducing
reparative stress signaling. J Nat Prod. 78:1990–2000. 2015.
View Article : Google Scholar : PubMed/NCBI
|
|
18
|
Mar JC, Matigian NA, Quackenbush J and
Wells CA: Attract: A method for identifying core pathways that
define cellular phenotypes. PLoS One. 6:e254452011. View Article : Google Scholar : PubMed/NCBI
|
|
19
|
Watson-Haigh NS, Kadarmideen HN and
Reverter A: PCIT: An R package for weighted gene co-expression
networks based on partial correlation and information theory
approaches. Bioinformatics. 26:411–413. 2010. View Article : Google Scholar : PubMed/NCBI
|
|
20
|
Benjamini Y, Drai D, Elmer G, Kafkafi N
and Golani I: Controlling the false discovery rate in behavior
genetics research. Behav Brain Res. 125:279–284. 2001. View Article : Google Scholar : PubMed/NCBI
|
|
21
|
Kanehisa M, Araki M, Goto S, Hattori M,
Hirakawa M, Itoh M, Katayama T, Kawashima S, Okuda S, Tokimatsu T
and Yamanishi Y: KEGG for linking genomes to life and the
environment. Nucleic Acids Res. 36(Database issue): D480–D484.
2008.PubMed/NCBI
|
|
22
|
Huang da W, Sherman BT and Lempicki RA:
Systematic and integrative analysis of large gene lists using DAVID
bioinformatics resources. Nat Protoc. 4:44–57. 2009. View Article : Google Scholar : PubMed/NCBI
|
|
23
|
Bolstad BM, Irizarry RA, Astrand M and
Speed TP: A comparison of normalization methods for high density
oligonucleotide array data based on variance and bias.
Bioinformatics. 19:185–193. 2003. View Article : Google Scholar : PubMed/NCBI
|
|
24
|
Post-White J, Ladas EJ and Kelly KM:
Advances in the use of milk thistle (Silybum marianum). Integr
Cancer Ther. 6:104–109. 2007. View Article : Google Scholar : PubMed/NCBI
|
|
25
|
Bang SW, Ko MJ, Kang S, Kim GS, Kang D,
Lee J and Hwang DS: Human TopBP1 localization to the mitotic
centrosome mediates mitotic progression. Exp Cell Res.
317:994–1004. 2011. View Article : Google Scholar : PubMed/NCBI
|
|
26
|
Lee Y, Katyal S, Downing SM, Zhao J,
Russell HR and Mckinnon PJ: Neurogenesis requires TopBP1 to prevent
catastrophic replicative DNA damage in early progenitors. Nat
Neurosci. 15:819–826. 2012. View Article : Google Scholar : PubMed/NCBI
|
|
27
|
Negrini S, Gorgoulis VG and Halazonetis
TD: Genomic instability-an evolving hallmark of cancer. Nat Rev Mol
Cell Biol. 11:220–228. 2010. View Article : Google Scholar : PubMed/NCBI
|
|
28
|
Hanahan D and Weinberg RA: Hallmarks of
cancer: The next generation. Cell. 144:646–674. 2011. View Article : Google Scholar : PubMed/NCBI
|
|
29
|
Katiyar SK, Mantena SK and Meeran SM:
Silymarin protects epidermal keratinocytes from ultraviolet
radiation-induced apoptosis and DNA damage by nucleotide excision
repair mechanism. PLoS One. 6:e214102011. View Article : Google Scholar : PubMed/NCBI
|
|
30
|
Iyer J, Moghe S, Furukawa M and Tsai MY:
What's Nu (SAP) in mitosis and cancer? Cell Signal. 23:991–998.
2011. View Article : Google Scholar : PubMed/NCBI
|
|
31
|
Lu J, Tan M, Huang W C, Li P, Guo H, Tseng
LM, Su XH, Yang WT, Treekitkarnmongkol W, Andreeff M, et al:
Mitotic deregulation by survivin in ErbB2-overexpressing breast
cancer cells contributes to Taxol resistance. Clin Cancer Res.
15:1326–1334. 2009. View Article : Google Scholar : PubMed/NCBI
|
|
32
|
Mita AC, Mita MM, Nawrocki ST and Giles
FJ: Survivin: Key regulator of mitosis and apoptosis and novel
target for cancer therapeutics. Clin Cancer Res. 14:5000–5005.
2008. View Article : Google Scholar : PubMed/NCBI
|
|
33
|
Chen DT, Nasir A, Culhane A, Venkataramu
C, Fulp W, Rubio R, Wang T, Agrawal D, McCarthy SM, Gruidl M, et
al: Proliferative genes dominate malignancy-risk gene signature in
histologically-normal breast tissue. Breast Cancer Res Treat.
119:335–346. 2010. View Article : Google Scholar : PubMed/NCBI
|
|
34
|
Satow R, Shitashige M, Kanai Y, Takeshita
F, Ojima H, Jigami T, Honda K, Kosuge T, Ochiya T, Hirohashi S and
Yamada T: Combined functional genome survey of therapeutic targets
for hepatocellular carcinoma. Clin Cancer Res. 16:2518–2528. 2010.
View Article : Google Scholar : PubMed/NCBI
|
|
35
|
Sozmen M, Devrim AK, Tunca R, Bayezit M,
Dag S and Essiz D: Protective effects of silymarin on fumonisin
B1-induced hepatotoxicity in mice. J Vet Sci. 15:51–60.
2014. View Article : Google Scholar : PubMed/NCBI
|
|
36
|
Urrego D, Tomczak AP, Zahed F, Stuhmer W
and Pardo LA: Potassium channels in cell cycle and cell
proliferation. Philos Trans R Soc Lond B Biol Sci.
369:201300942014. View Article : Google Scholar : PubMed/NCBI
|
|
37
|
Smith A, Simanski S, Fallahi M and Ayad
NG: Redundant ubiquitin ligase activities regulate wee1 degradation
and mitotic entry. Cell Cycle. 6:2795–2799. 2007. View Article : Google Scholar : PubMed/NCBI
|
|
38
|
Itzel T, Scholz P, Maass T, et al:
Translating bioinformatics in oncology: Guilt-by-profiling analysis
and identification of KIF18B and CDCA3 as novel driver genes in
carcinogenesis. Bioinformatics. 31:216–224. 2015. View Article : Google Scholar : PubMed/NCBI
|
|
39
|
Deep G, Singh R, Agarwal C, Kroll D and
Agarwal R: Silymarin and silibinin cause G1 and G2-M cell cycle
arrest via distinct circuitries in human prostate cancer PC3 cells:
A comparison of flavanone silibinin with flavanolignan mixture
silymarin. Oncogene. 25:1053–1069. 2006. View Article : Google Scholar : PubMed/NCBI
|
|
40
|
Fan L, Ma Y, Liu Y, Zheng D and Huang G:
Silymarin induces cell cycle arrest and apoptosis in ovarian cancer
cells. Eur J Pharmacol. 743:79–88. 2014. View Article : Google Scholar : PubMed/NCBI
|