Introduction
The highest rates of cancer-related mortality are
associated with breast, prostate and lung cancer, as reported by
the World Health Organization (1),
the World Cancer Report (2) and
Cancer facts and figures (3) A
plethora of cancer microarray and RNA sequencing (RNA-Seq) studies
are publicly available in databases, including the Gene Expression
Omnibus (GEO) (4), Array Express
(5) and The Cancer Genome Atlas
(TCGA; http://cancergenome.nih.gov/).
Recently, simultaneous analysis and comparison of the results from
microarray and RNA-Seq data has been explored (6–8). These
studies have indicated that RNA-Seq has more benefits compared with
microarray platforms, including broader dynamic range and increased
specificity and sensitivity, however using the samples belonging to
the same biological conditions from both the platforms produces
highly correlated gene expression profiles. However, microarrays
remain a popular choice amongst researchers when conducting
transcriptional profiling experiments, because RNA-Seq technology
is novel, more expensive, and requires extensive and complex data
storage and analysis. When analysis is conducted on both platforms,
strongly concordant and highly correlated results are obtained
(6,7).
The present study focused on microarray analysis, but additionally
performed analysis on RNA-Seq data, so as to validate the
significance of the results obtained. Several studies in recent
years have reported meta-analysis of such data, where the analyses
are performed on integrated samples from multiple microarray
datasets (9–13). The majority of the articles focusing
on meta-analysis use the following strategies: assembling published
differential expressed gene (DEG) lists from experimental studies
and then articulating the consistently reported DEGs (14–16); or
integrating multiple datasets from different microarray platforms
and then executing statistical tests to discover consistently
expressed DEGs (9–13). However, inconsistencies in the results
are observed due to technical limitations, such as variance in
expression measurements and differences in laboratory protocols for
different microarray platforms. One major inconsistency reported in
meta-signature studies is the overrepresentation of genes common to
various platforms, and the underrepresentation of genes which are
not common to different platforms (11). In addition, meta-analysis that uses
previously published DEG lists when raw data are unavailable, has
the limitation that it is difficult to assign a confidence for
combined P-values and fold change measurements for each gene
(14).
With a purview to improve the understanding of
cancer pathogenesis, and based on the methods from the published
literature, the present study applied differential gene expression
analysis individually to six microarray datasets and one RNA-Seq
dataset, representing three different cancer types, breast, lung,
and prostate. The aim of the present study was to discover a common
set of genes, which may demonstrate a significant expression
pattern across these three cancer types. A common subset of DEGs
was then explored by comparing the gene lists obtained from
microarray and RNA-Seq analysis results. The resulting gene set was
further analyzed by Gene Ontology (GO) functional annotations using
GENECODIS (17), DAVID (18), Cancer Genetics Web (19), OMIM (20) and number of literature citations using
TARGETgene (21). Furtemore, a
meta-analysis of the combined samples was performed to identify the
heterogeneity in expression of the obtained DEGs in all the six
microarray datasets analyzed. This helped in observing the change
in expression of the DEGs under different cancer conditions. It is
an important implication that some genes always exhibit a
consistent expression change, irrespective of the cancer type,
whereas some genes exhibit inconsistency in expression change. This
may aid oncologists in understanding the behavior of genes in
cancer in terms of their heterogeneous expression.
Materials and methods
Outline of data and preprocessing
Six cancer microarray datasets and one RNA-Seq
dataset were downloaded from the GEO database (www.ncbi.nlm.nih.gov/geo) (22–28). The
information extracted from each identified study is illustrated in
Table I. The microarray analysis was
restricted to datasets derived from two platforms, Affymetrix
HGU-133A (GPL96) and Affymetrix HGU-133APlus2 (GPL570), which
characterize probe sets with unique genes for Homo-Sapiens. The
RNA-Seq dataset, GSE62944, comprises data from 24 cancer types from
The Cancer Genome Atlas, and it is already processed using Rsubread
R package and featureCounts() function in order to summarize the
gene level expression values as integer numbers. In the present
study, integer-based read counts were extracted for only the three
cancer types of interest (breast, prostate and lung) out of the
data matrix for 24 cancer types. The total number of samples
analyzed was 454 (311 tumor samples/143 normal samples) and 2,333
(2,120 tumor samples/213 normal samples) for the microarray and
RNA-Seq datasets, respectively. To ensure unregulated, unbiased,
and consistent screening of the expression values from the
different microarray datasets, the raw CEL files of the experiments
were used. The Robust Multichip Average (RMA) technique, which
performs quantile normalization, was the expression normalization
technique used in the present study (29). This technique was applied to all
individual raw microarray datasets in order to minimize
inconsistencies due to normalization. This method of normalization
was selected due to its good differential change detection, stable
variance on log scale and reduced production of false positives. A
comparison between different normalization methods has reported
that RMA outperformed other methods in terms of specificity and
sensitivity when dealing with fold change criteria in the detection
of differential expression (30). The
box plots of the RMA normalized intensity were plotted (data not
shown), demonstrating that measurements of data were closely
aligned towards a central mean, and were thus comparable.
 | Table I.Characteristics of the individual
datasets used in the present study. |
Table I.
Characteristics of the individual
datasets used in the present study.
| Type of
dataset | Type of cancer | Dataset
identification number | Platform | Number of
probes/genes | Number of samples
(tumor/normal) |
|---|
| Microarray | Breast | GSE45827 | GPL570 | 54,675 | 174 (163/11) |
| gene
expression |
| GSE48984 | GPL96 | 22,283 | 22 (13/9) |
|
| Lung | GSE19804 | GPL570 | 54,675 | 120 (60/60) |
|
|
| GSE10072 | GPL96 | 22,283 | 107 (57/50) |
|
| Prostate | GSE55945 | GPL570 | 54,675 | 19 (12/7) |
|
|
| GSE26910 | GPL570 | 54,675 | 12 (6/6) |
| RNA-Seq | Breast | GSE62944 | GPL9052 | 23,368 | 1,230
(1,118/112) |
| gene
expression | Lung squamous cell
carcinoma |
|
|
| 551 (501/50) |
|
| Prostate
adenocarcinoma |
|
|
| 552 (501/51) |
Identification of potentially
significant target genes
The Bioconductor Linear Model for Microarray
Analysis (LIMMA) package was used (31) to calculate the differential expression
of each gene in the microarray and RNA-Seq datasets included in the
present study. LIMMA remains highly recommended for such analyses
(32). In a previous study comparing
eight microarray analysis methods [Welch's t-test, analysis of
variance (ANOVA), Wilcoxon's test, significance analysis of
microarrays (SAM), Randomized Variance Model (RVM), LIMMA, variance
mixture (VarMixt) and structural model for variances (SMVar)],
LIMMA performed the best in terms of statistical power,
false-positive rate, execution time and ease of use (33). In LIMMA, fitting of a linear model to
the expression data for each probe is performed and the
coefficients obtained describe the design matrix. Instead of simple
t-statistics, it provides results for moderated t-statistic,
moderated F-statistic, and B-statistic (which demonstrates the
log-odds of differential expression), by applying the Empirical
Bayes method and shrinking the standard errors towards a common
value. Hence, LIMMA produces stable and reproducible results even
with a small number of arrays. It also has the advantages of fast
computation, simultaneous error rate control across multiple
contrasts and genes, and effective prioritizing of results by
applying a particular cutoff for fold change. For analysis of
RNA-seq data, LIMMA with voom was used (34). The fitting of the mean-variance
association into the differential expression analysis as a
modification of limma's empirical Bayes procedure, and then
converting it into a precision weight for each individual
normalized observation is termed as limma-trend and voom. The
performance of this method is best even when the sequencing depths
are different for each RNA-sample.
Functional annotation of DEGs
In an effort to infer the biological functions and
signals involving the DEGs, GO enrichment analysis was performed.
The online tool GENECODIS (http://genecodis.cnb.csic.es) was used for this
purpose (17), which also provides
pathway enrichment analysis based on the Kyoto Encyclopedia of
Genes and Genomes (KEGG) database. The DAVID functional annotation
tool was used for expounding the results of annotation (18).
Literature citations for the DEGs
To confirm that the list of DEGs obtained in the
present study is associated with cancer, the National Center for
Biotechnology Information (NCBI; www.ncbi.nlm.nih.gov) literature was searched to
identify published reports relating these genes to cancer. The
TARGETgene tool was used for this purpose (21). This tool identifies probable
therapeutic targets in cancer by constructing a whole genome
network using integration of heterogeneous data at the genomic and
proteomic level. Upon the construction of the gene network,
TARGETgene evaluates network-based parameters to detect potential
therapeutic targets and displays the number of literature citations
in all and individual cancer types for each gene, as reported in
the NCBI database.
Meta-analysis of expression
heterogeneity of DEGs
Meta-analysis can refer to either the analysis of
collectively published lists of DEGs, or the integration of diverse
microarray datasets to perform a novel combined differential
expression analysis. The meta-analysis performed in the present
study investigated the diversity in expression of DEGs in six
microarray datasets, collectively, with the aim to discover whether
they display inconsistent expression changes in multiple studies,
or whether they display consistent changes in all the analyzed
studies. This is termed as heterogeneous or non-heterogonous
behavior, respectively. This statistical heterogeneity implies
genuine significant difference in between study variations, rather
than within study variance which may be because of chance alone. Q
and I2 statistic tests remain the most widely used measures
of heterogeneity for which computation modules are available in
standard statistical software for meta-analysis, such as Stata and
R (35). I2 statistic is
preferred among all measures of heterogeneity as it is a sample
size and scale-invariant measure and has finite upper bounds and
precise confidence intervals (36).
For each gene obtained in the DEG list, analysis of heterogeneity
was performed across cancer types using the meta package in R
(37). A confidence interval of 95%
was selected with the degree of freedom 5. The metacont
function estimates the heterogeneity statistic score I2,
along with the values, Q, df, and P-value. The seven
suggested steps by Ramasamy et al (38), in conducting the meta-analysis of
microarray datasets, were followed.
Results
Extracting significant gene markers
relative to breast, lung and prostate cancer
The LIMMA R package was used to elucidate potential
gene targets by adjusting the P-values using Benjamini-Hochberg
correction. Genes were termed significantly differentially
expressed if the adjusted P-value was <0.05 and the fold change
was >2. DEGs for each microarray dataset of lung, breast and
prostate cancer, were obtained individually, with results
illustrated in Table II. Since
datasets belonged to two platforms, GPL570 and GPL96, the number of
probes was not equal in all datasets. Probes in GPL96 are a subset
of probes in GPL570. Therefore, while combining the DEGs within the
same cancer type, a union (merging) of the two individual lists of
DEGs was performed, to get a single list of DEGs. The main aim of
the present study was to find a common subset of DEGs across the
three cancer types. Hence, an intersection of the DEG lists was
performed to find members of the joint subset of genes across the
three cancer types. Up to this stage of the analysis, mapping of
probe IDs with the corresponding gene symbols was not performed.
Therefore, the number of DEGs represented the unique probe IDs. In
total, 75 differentially expressed probe IDs were discovered in
common between the three cancer types. Following the removal of
probes with no available annotation and the removal of repeated
gene symbols, a list of 62 unique gene symbols was obtained as a
result of the microarray data analysis.
| Table II.Differential expression analysis
results for each microarray dataset. |
Table II.
Differential expression analysis
results for each microarray dataset.
| Cancer | Breast | Lung | Prostate |
|---|
| GEO dataset | GSE45827 | GSE48984 | GSE19804 | GSE10072 | GSE26910 | GSE55945 |
| Platform | GPL570 | GPL96 | GPL570 | GPL96 | GPL570 | GPL570 |
| Number of
probes | 54,675 | 22,283 | 54,675 | 22,283 | 5,4675 | 5,4675 |
| Number of
samples | 174 | 22 | 120 | 107 | 12 | 19 |
| Number of | 7,006 | 3,513 | 2,026 | 829 | 77 | 539 |
| differentially | Union of the
two | Union of the
two | Union of the
two |
| expressed
genes | 9,248 | 2,215 | 603 |
A similar analysis was performed on the RNA-Seq data
for the three individual cancer types. An integer-based raw gene
count data matrix of breast, lung and prostate cancer samples was
used with LIMMA and voom to explore the DEGs (34). The voom method estimates the mean
variance relationship of the log counts, generates a precision
weight for each observation and enters these into the LIMMA
empirical Bayes analysis pipeline. Using this method, 1,290 genes
were obtained in common across the three cancer types.
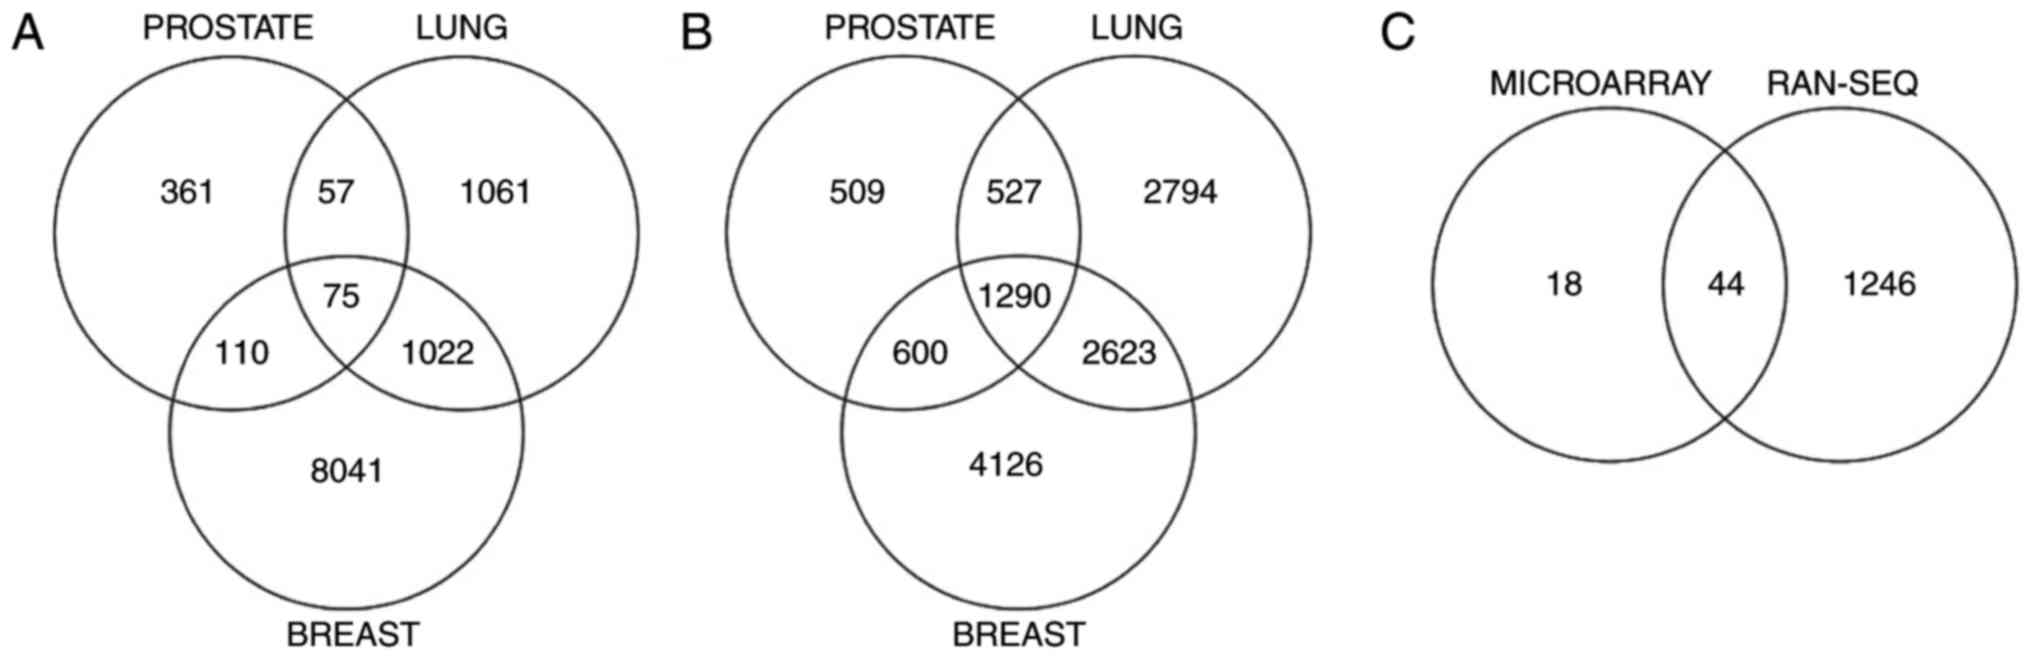
To confirm the consistency of the results obtained,
genes appearing in both the microarray and RNA-Seq analysis results
were identified. Following removal of all the duplicate gene
symbols, a list of 44 genes was generated. The overlap of DEGs
across the three cancers obtained from microarray analysis, from
RNA-Seq analysis and from the combined microarray and RNA-Seq
analysis is illustrated in Fig. 1A-C
respectively. The complete list of the genes identified by the
combined microarray and RNA-Seq analysis, along with links to their
description from the cancer genetics web (19) and OMIM database (20), is depicted in Table III.
| Table III.Gene symbols of the common
differentially expressed genes in breast, lung and prostate
cancer. |
Table III.
Gene symbols of the common
differentially expressed genes in breast, lung and prostate
cancer.
Determination of functional
annotation
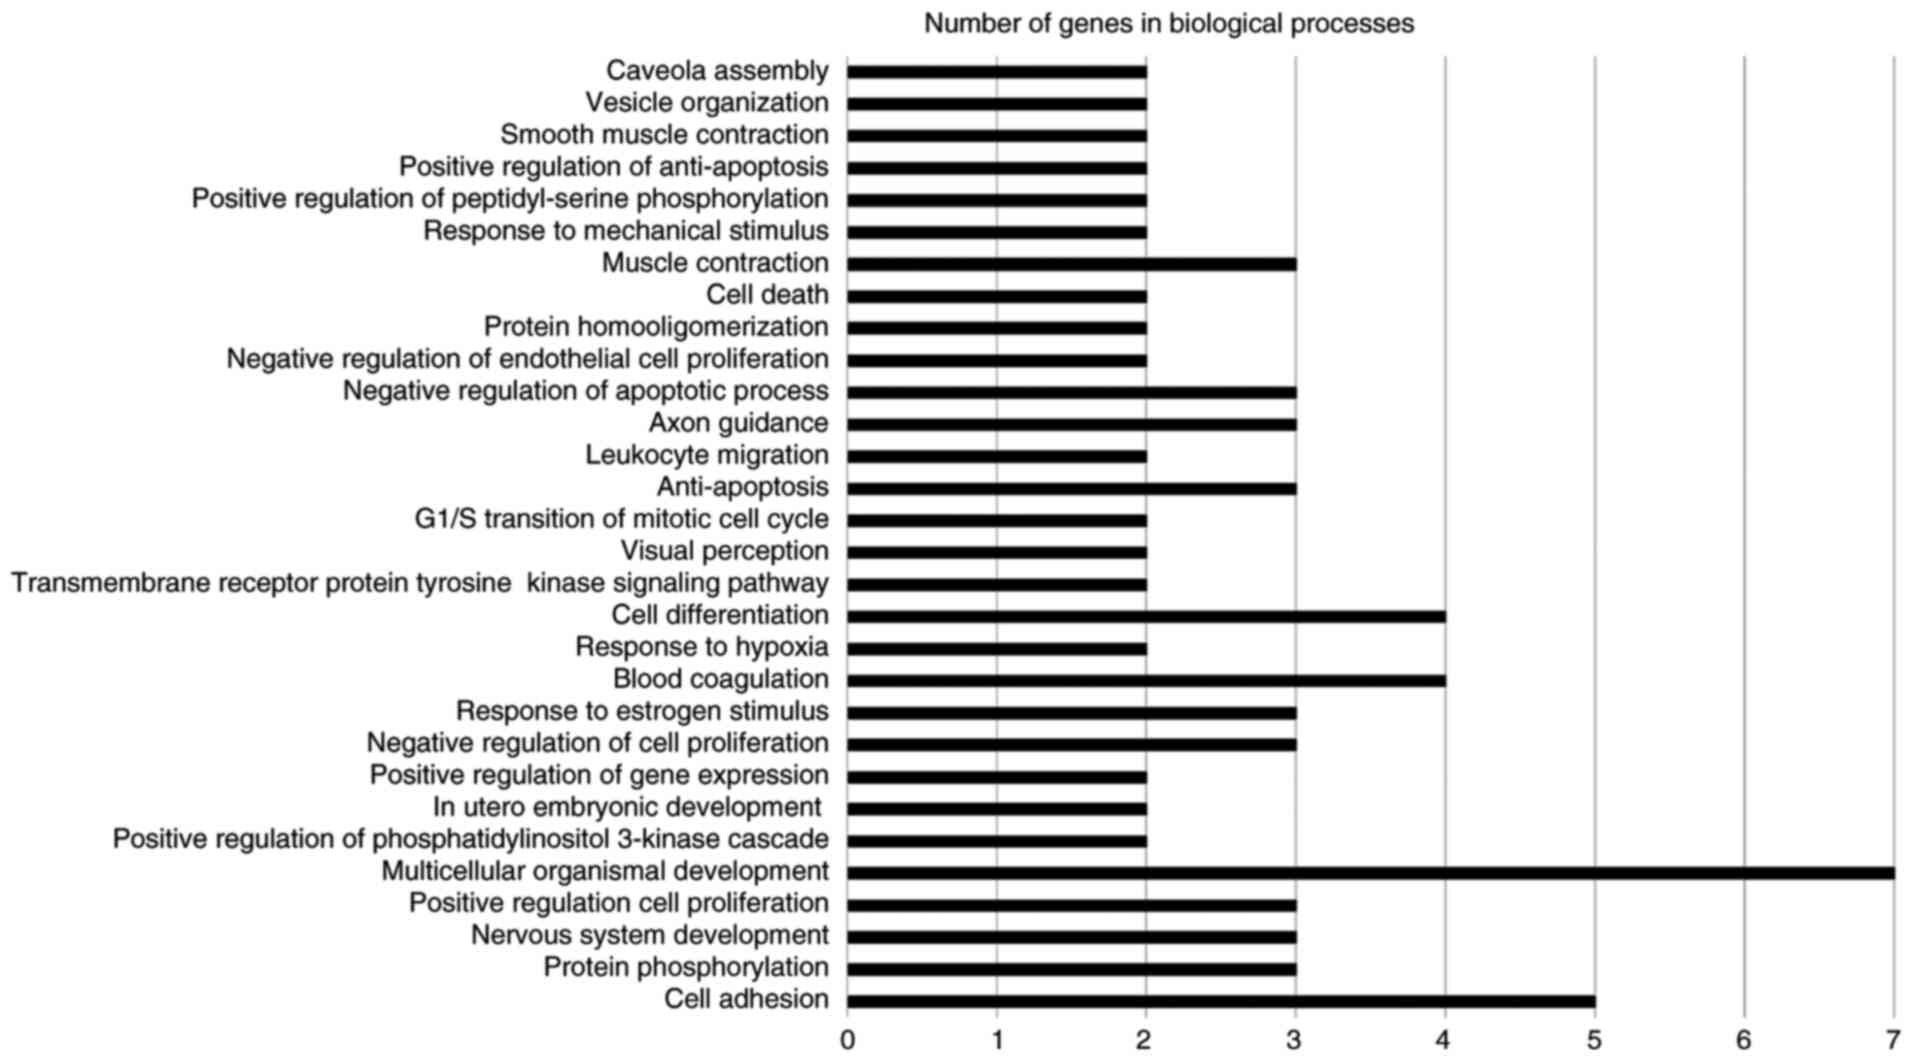
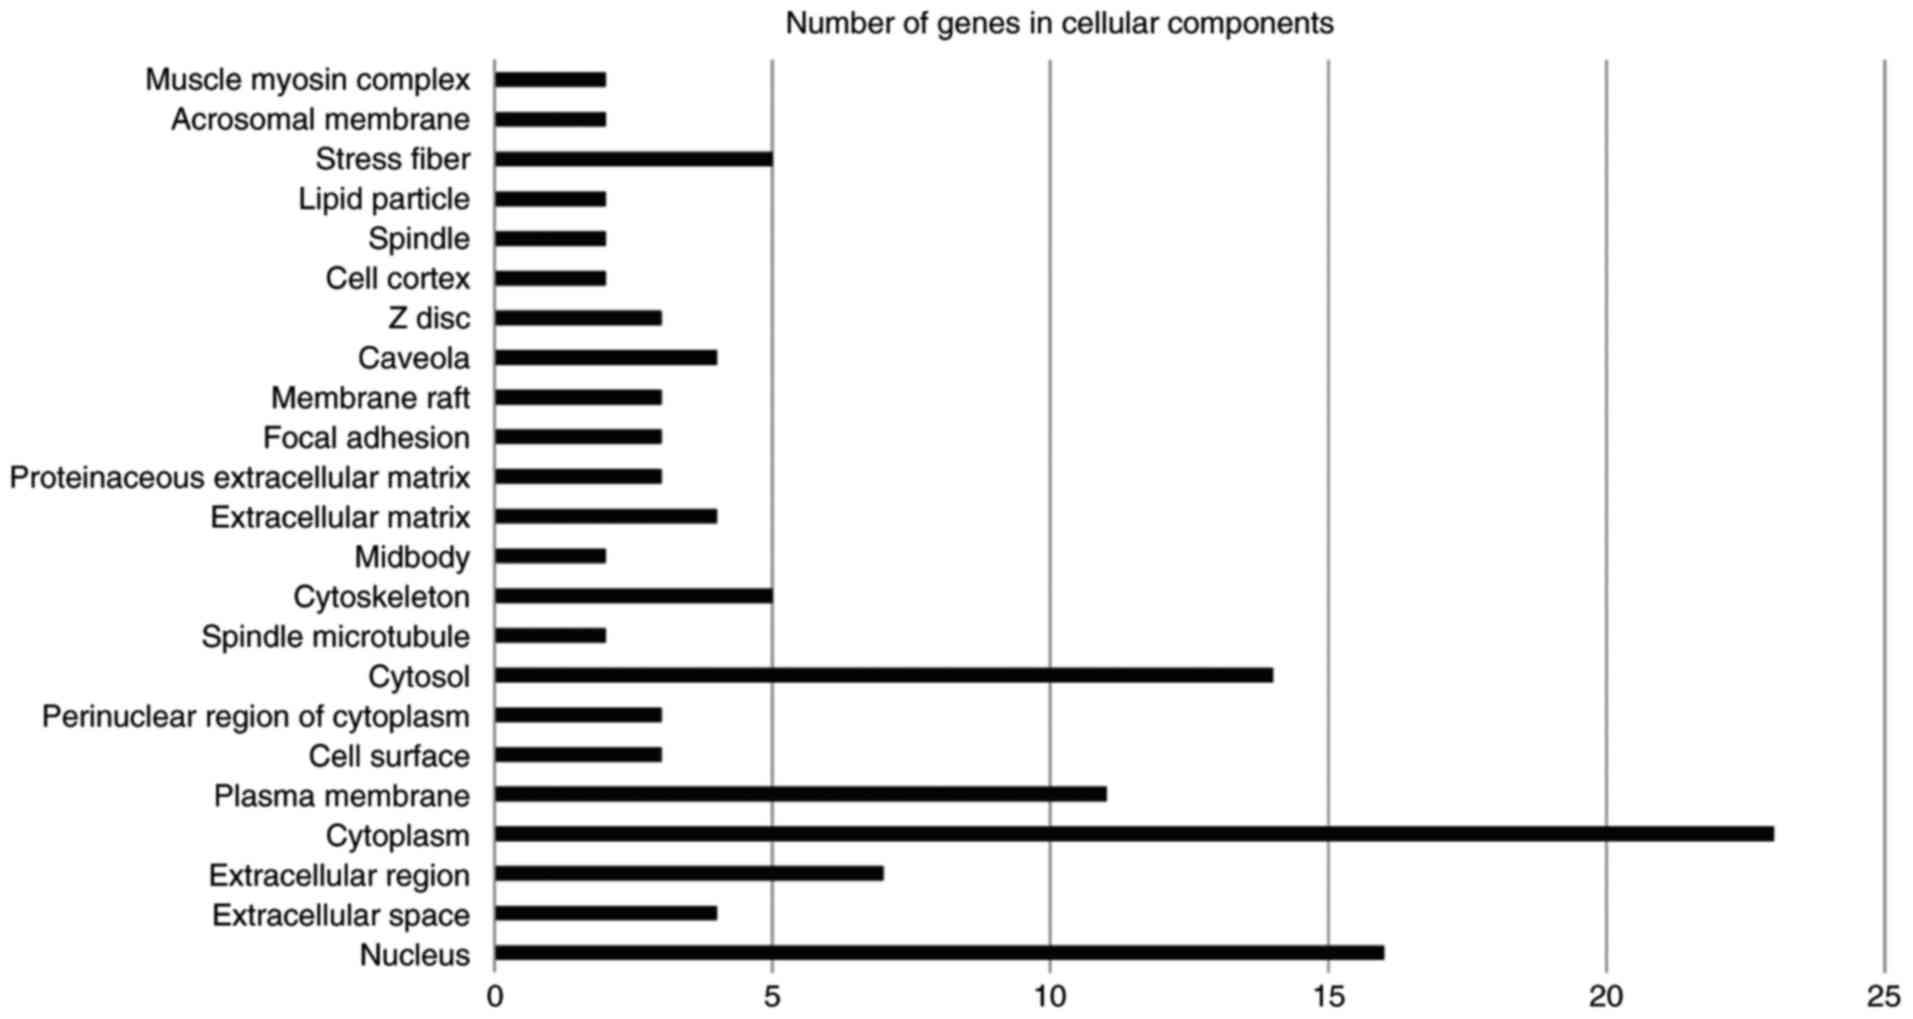
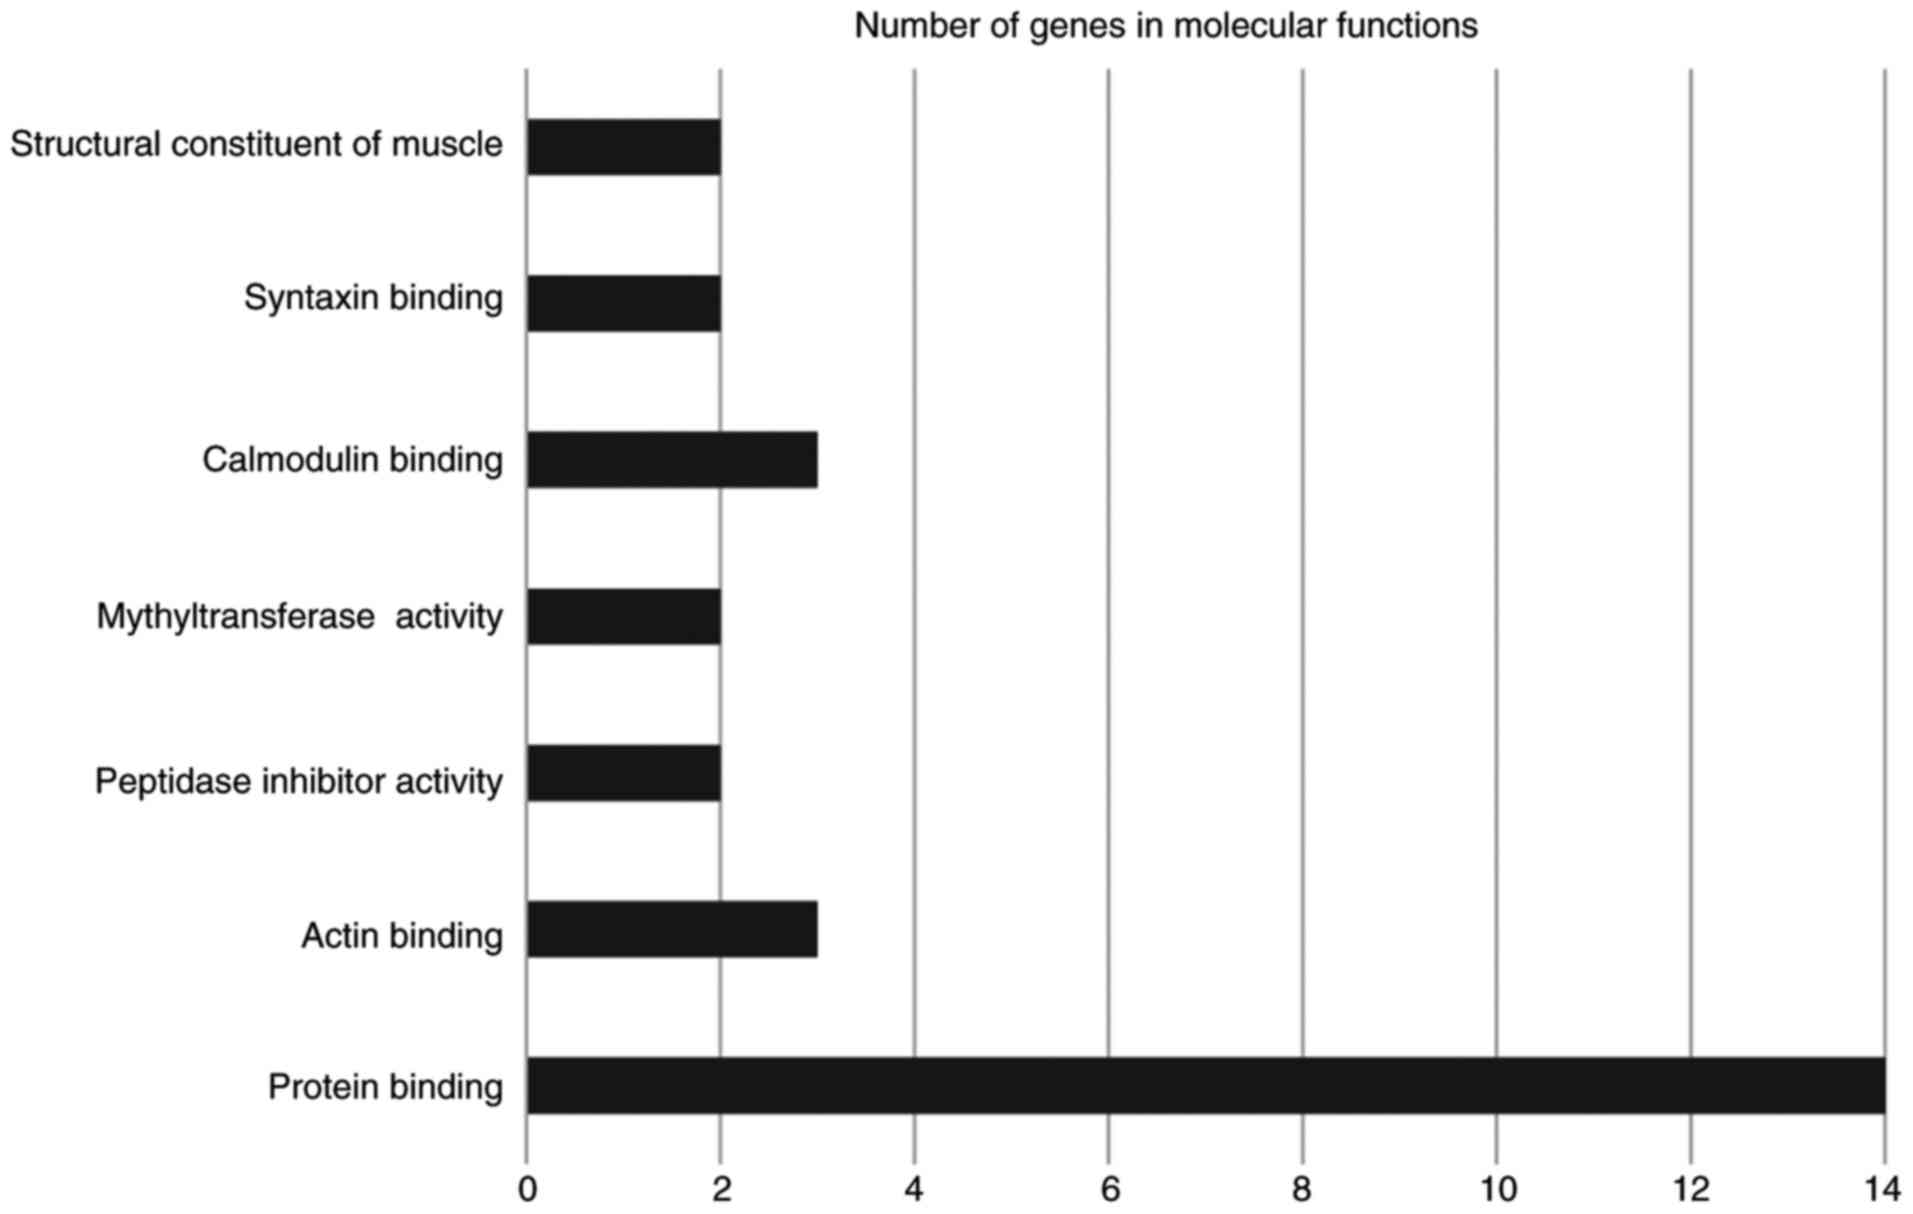
The GENECODIS web software tool was used for
functional annotation, which displays biological processes,
molecular functions and cellular components that may be
significantly enriched in a given gene list (17). The software also lists the KEGG
pathways that may be significantly enriched in the gene list. The
significance threshold of P<0.05 was selected. The results are
illustrated in Figs. 2–4. The terms involving two or more genes were
retained in the graphs. The significantly enriched biological
processes were multicellular organismal development, cell adhesion,
axon guidance, cell differentiation, blood coagulation, muscle
contraction, cell death, negative regulation of apoptotic process
and anti-apoptosis (Fig. 2). The
significantly enriched molecular functions included protein, actin,
calmodulin and syntaxin binding (Fig.
3). The significantly enriched cellular components were the
nucleus, cytoplasm, plasma membrane, cytosol, caveola, stress
fiber, focal adhesion, extracellular matrix, extracellular region
and cystoskeleton (Fig. 4). Enriched
KEGG pathways are listed in Table
IV. The detailed GO enrichment was also obtained by use of the
DAVID functional annotation tool (data not shown) (18). Several functional predictions were
provided by DAVID, including the presence of BIRC5 in cell survival
pathway, TIMP3 in p53 signaling pathway, CAV1 in integrin signaling
pathway, and CFD in alternative complement pathway given by
BIOCARTA. COG (Clusters of Orthologous Group) Ontology predicted
KIF4A involved in cell division and chromosome partitioning, and
MYL9 involved in signal transduction mechanisms/cytoskeleton/cell
division and chromosome. Significantly enriched biological
processes were sensory perception, angiogenesis, cell cycle
checkpoint, nuclear division, cytokinesis, apoptosis, cell death,
and cell adhesion. Cellular components included extracellular
region, cytosol, cell surface, cytoskeleton, nucleolus, cell
fraction. Enriched KEGG pathways included pathways in cancer,
transcriptional misregulation in cancer, focal adhesion, vascular
smooth muscle contraction, MAPK signaling pathway, and the
neurotrophin signaling pathway. In summary, the results from the
function annotation analysis demonstrate a significant association
of the discovered DEGs with cancer pathogenesis.
| Table IV.Enriched KEGG pathways in
differentially expressed genes as predicted by GENECODIS
analysis. |
Table IV.
Enriched KEGG pathways in
differentially expressed genes as predicted by GENECODIS
analysis.
| KEGG pathway | Class | Number of
genes | P-value
(adjusted) | Gene symbols |
|---|
| Regulation of actin
cytoskeleton | Cellular processes;
cell motility | 3 | 0.016092 | MYLK, IQGAP3,
MYL9 |
| Vascular smooth
muscle contraction | Organismal systems;
circulatory system | 3 | 0.005475 | MYLK, MYH11,
MYL9 |
| Focal adhesion | Cellular
processes | 4 | 0.003144 | CAV2, MYLK, CAV1,
MYL9 |
| Tight junction | Cellular
processes | 2 | 0.039699 | MYH11, MYL9 |
| Bacterial invasion
of epithelial cells | Human diseases;
infectious diseases | 2 | 0.016007 | CAV2, CAV1 |
| Tryptophan
metabolism | Metabolism; amino
acid metabolism | 2 | 0.01113 | INMT, AOX1 |
| Viral
myocarditis | Human diseases;
Cardiovascular diseases | 2 | 0.015622 | CAV1, MYH11 |
Listing the literature citations
To explore the cancer-specific citations for these
genes, and in particular the distribution of number of relevant
citations in individual and/or all cancer types addressed in the
present study, the TARGETgene tool was used (21). The results demonstrated a high ranking
in literature from NCBI for the candidate key genes. These rankings
are reported in Table V. Notably, the
maximum number of citations in all cancers for these genes ranged
from 1–326, with no gene having zero number of citations,
suggesting that the key genes are relevant to cancer. When number
of citations in individual cancers was considered, several genes
had no relevant citations. For example, NTRK2 has zero NCBI
citation in prostate cancer, whereas several studies report a role
for this gene in prostate cancer (39,40).
Similarly, ID4 has been reported to have a role in lung cancer
(41). A summary of the roles of
these key genes in cancer is provided by cancer-genetics web
database (19) and OMIM database
(20) and listed in Table III.
| Table V.TARGETgene results for differentially
expressed gene ranking and their number of citations in all and
individual cancer types. |
Table V.
TARGETgene results for differentially
expressed gene ranking and their number of citations in all and
individual cancer types.
| Rank | Gene symbol | Citation numbers
for all cancers | Citation numbers
for breast cancer | Citation numbers
for prostate cancer | Citation numbers
for lung cancer |
|---|
| 1 | MYLK | 4 | 3 | 1 | 0 |
| 2 | NTRK2 | 23 | 0 | 0 | 5 |
| 3 | CAV1 | 137 | 46 | 24 | 22 |
| 4 | MCAM | 22 | 3 | 6 | 1 |
| 5 | ANGPT1 | 35 | 3 | 0 | 3 |
| 6 | CAV2 | 24 | 6 | 4 | 2 |
| 7 | BIRC5 | 326 | 47 | 18 | 46 |
| 8 | EFEMP1 | 4 | 1 | 0 | 2 |
| 9 | EZH2 | 68 | 37 | 33 | 6 |
| 10 | HSPB8 | 14 | 3 | 1 | 2 |
| 11 | ERG | 35 | 0 | 67 | 2 |
| 12 | MYH11 | 16 | 1 | 1 | 0 |
| 13 | TIMP3 | 34 | 9 | 3 | 2 |
| 14 | MYL9 | 1 | 1 | 0 | 0 |
| 15 | SDPR | 2 | 0 | 0 | 0 |
| 16 | PGM5 | 1 | 0 | 0 | 0 |
| 17 | CLU | 48 | 11 | 18 | 8 |
| 18 | FHL1 | 5 | 1 | 1 | 0 |
| 19 | FXYD6 | 4 | 0 | 0 | 0 |
| 20 | KIF4A | 8 | 0 | 1 | 0 |
| 21 | KCNAB1 | 2 | 0 | 0 | 0 |
| 22 | GPM6A | 3 | 0 | 0 | 1 |
| 23 | CFD | 1 | 0 | 0 | 0 |
| 24 | FAM107A | 9 | 0 | 0 | 1 |
| 25 | PTRF | 3 | 1 | 1 | 0 |
| 26 | DPT | 3 | 0 | 0 | 0 |
| 27 | ID4 | 21 | 4 | 0 | 0 |
| 28 | FERMT2 | 4 | 1 | 0 | 2 |
| 29 | MAMDC2 | 4 | 0 | 0 | 0 |
| 30 | CCDC69 | 2 | 0 | 0 | 0 |
| 31 | IQGAP3 | 1 | 0 | 0 | 0 |
| 32 | PCDH9 | 3 | 1 | 0 | 0 |
| 33 | SYNPO2 | 7 | 0 | 3 | 0 |
| 34 | STIL | 21 | 0 | 0 | 1 |
| 35 | GLDN | 2 | 0 | 0 | 0 |
| 36 | CCDC85A | 1 | 0 | 0 | 0 |
| 37 | GPM6B | 4 | 0 | 0 | 0 |
| 38 | ITIH5 | 5 | 4 | 1 | 1 |
| 39 | AOX1 | 3 | 0 | 0 | 0 |
| 40 | NUSAP1 | 2 | 0 | 0 | 0 |
| 41 | ACSS3 | 1 | 0 | 0 | 0 |
| 42 | TCEAL2 | 1 | 0 | 0 | 0 |
| 43 | INMT | 3 | 0 | 0 | 1 |
Meta-analysis of the common set of
DEGs
The I2 statistic describes the %
of variation across studies that is due to heterogeneity with a
confidence interval constructed using the iterative Chi-squared
distribution method. The I2 statistic ensures
that better consistency measure between the trials would be
obtained in meta-analysis (35). The
calculation of I2 is obtained from
I2=100×(Q−df)/Q, where Q denotes the
Cochran's heterogeneity statistic and df denotes degree of
freedom. The I2 value lies between 0 and 100%,
with all negative values set to zero. The grading of heterogeneity
based on I2 value is categorized at 25, 50 and
75% as low, moderate and high heterogeneity respectively. For each
DEG, heterogeneity analysis was performed using the meta package in
R (37), by extracting RMA normalized
values from the six microarray datasets. However, these values
could not be retrieved for all the 44 genes, as some probes were
not present in data derived from the GPL96 platform. Therefore,
heterogeneity analysis was performed only for those DEGs for which
the probe ID measurements were available in all six datasets. The
results of this analysis are listed in Table VI. In this analysis, the P-value does
not adequately describe the extent of heterogeneity in the results
of the trials, whereas the I2 value does. Low
I2 values indicate little variability between
studies, with I2=0 meaning no heterogeneity. This
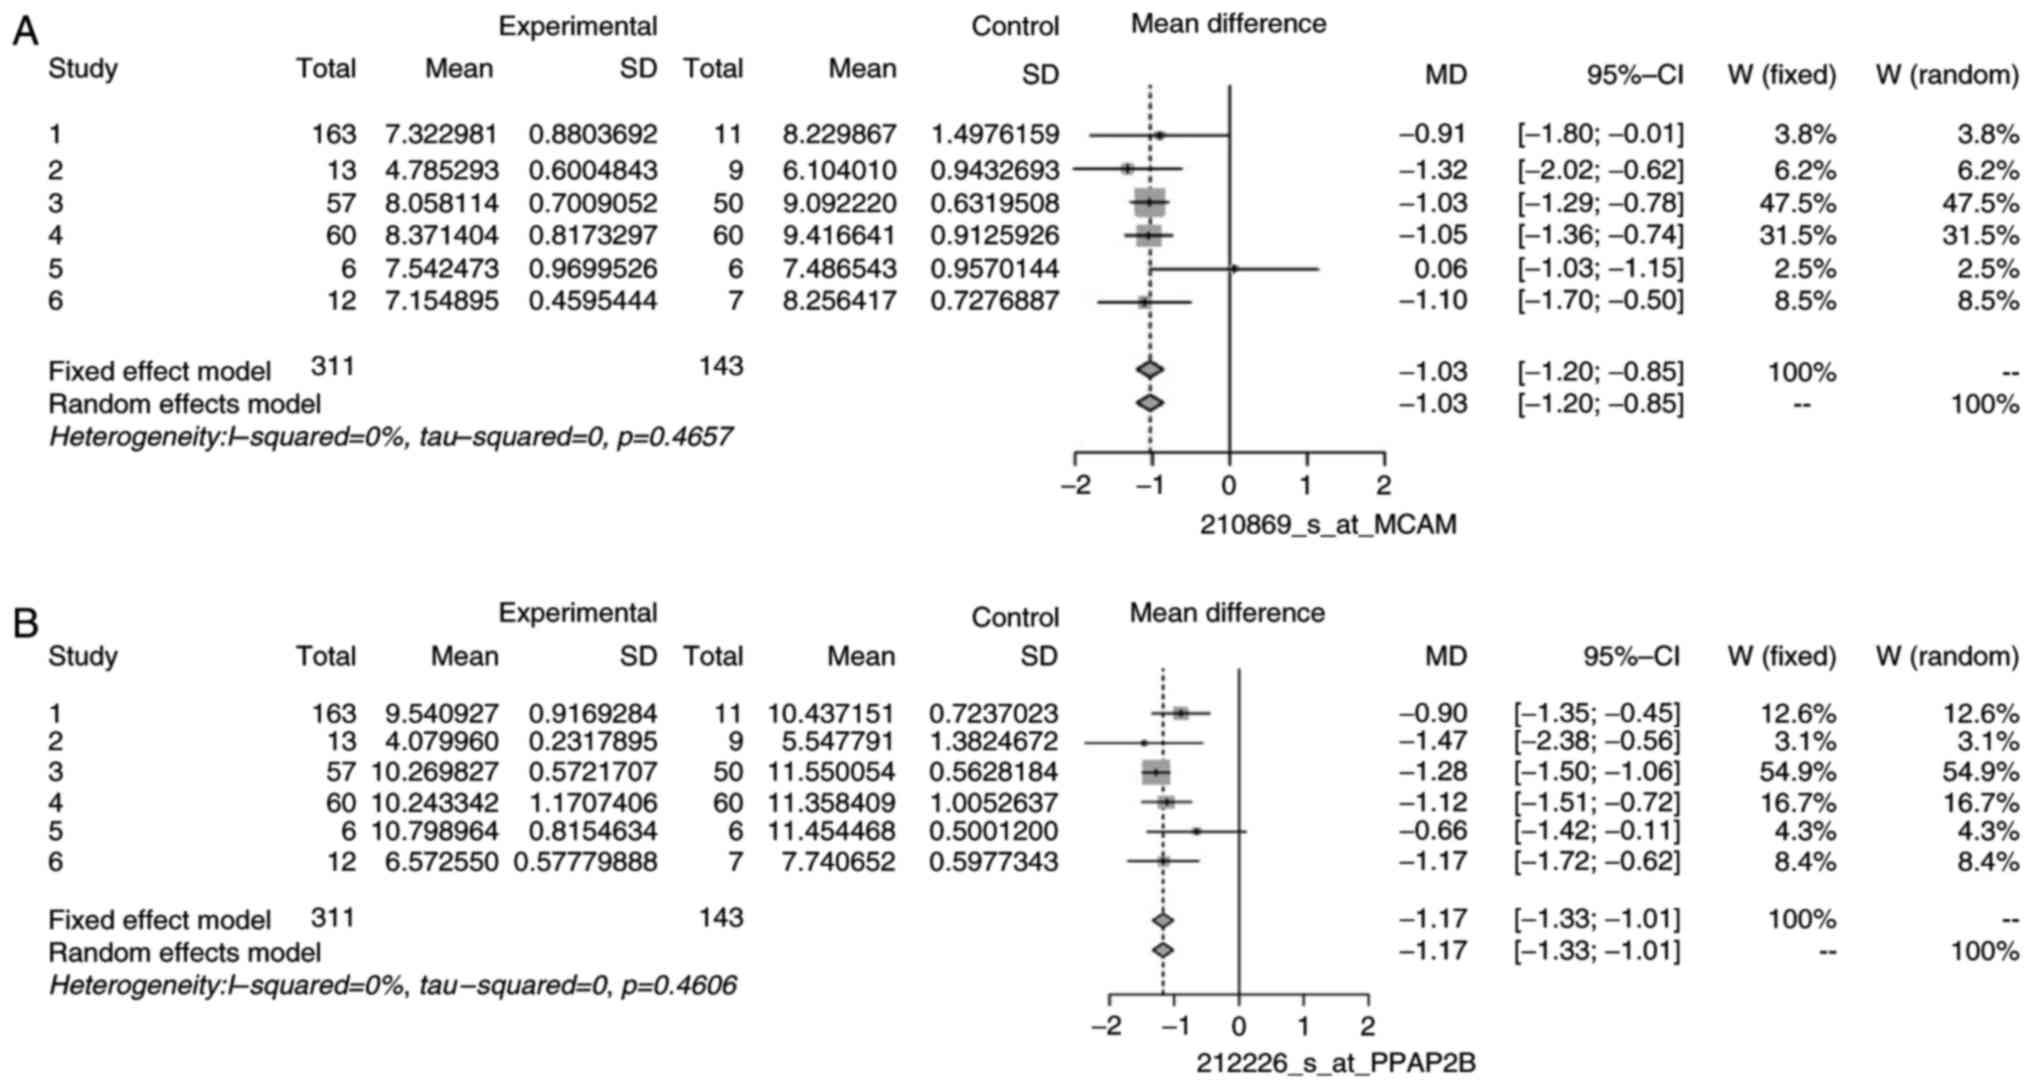
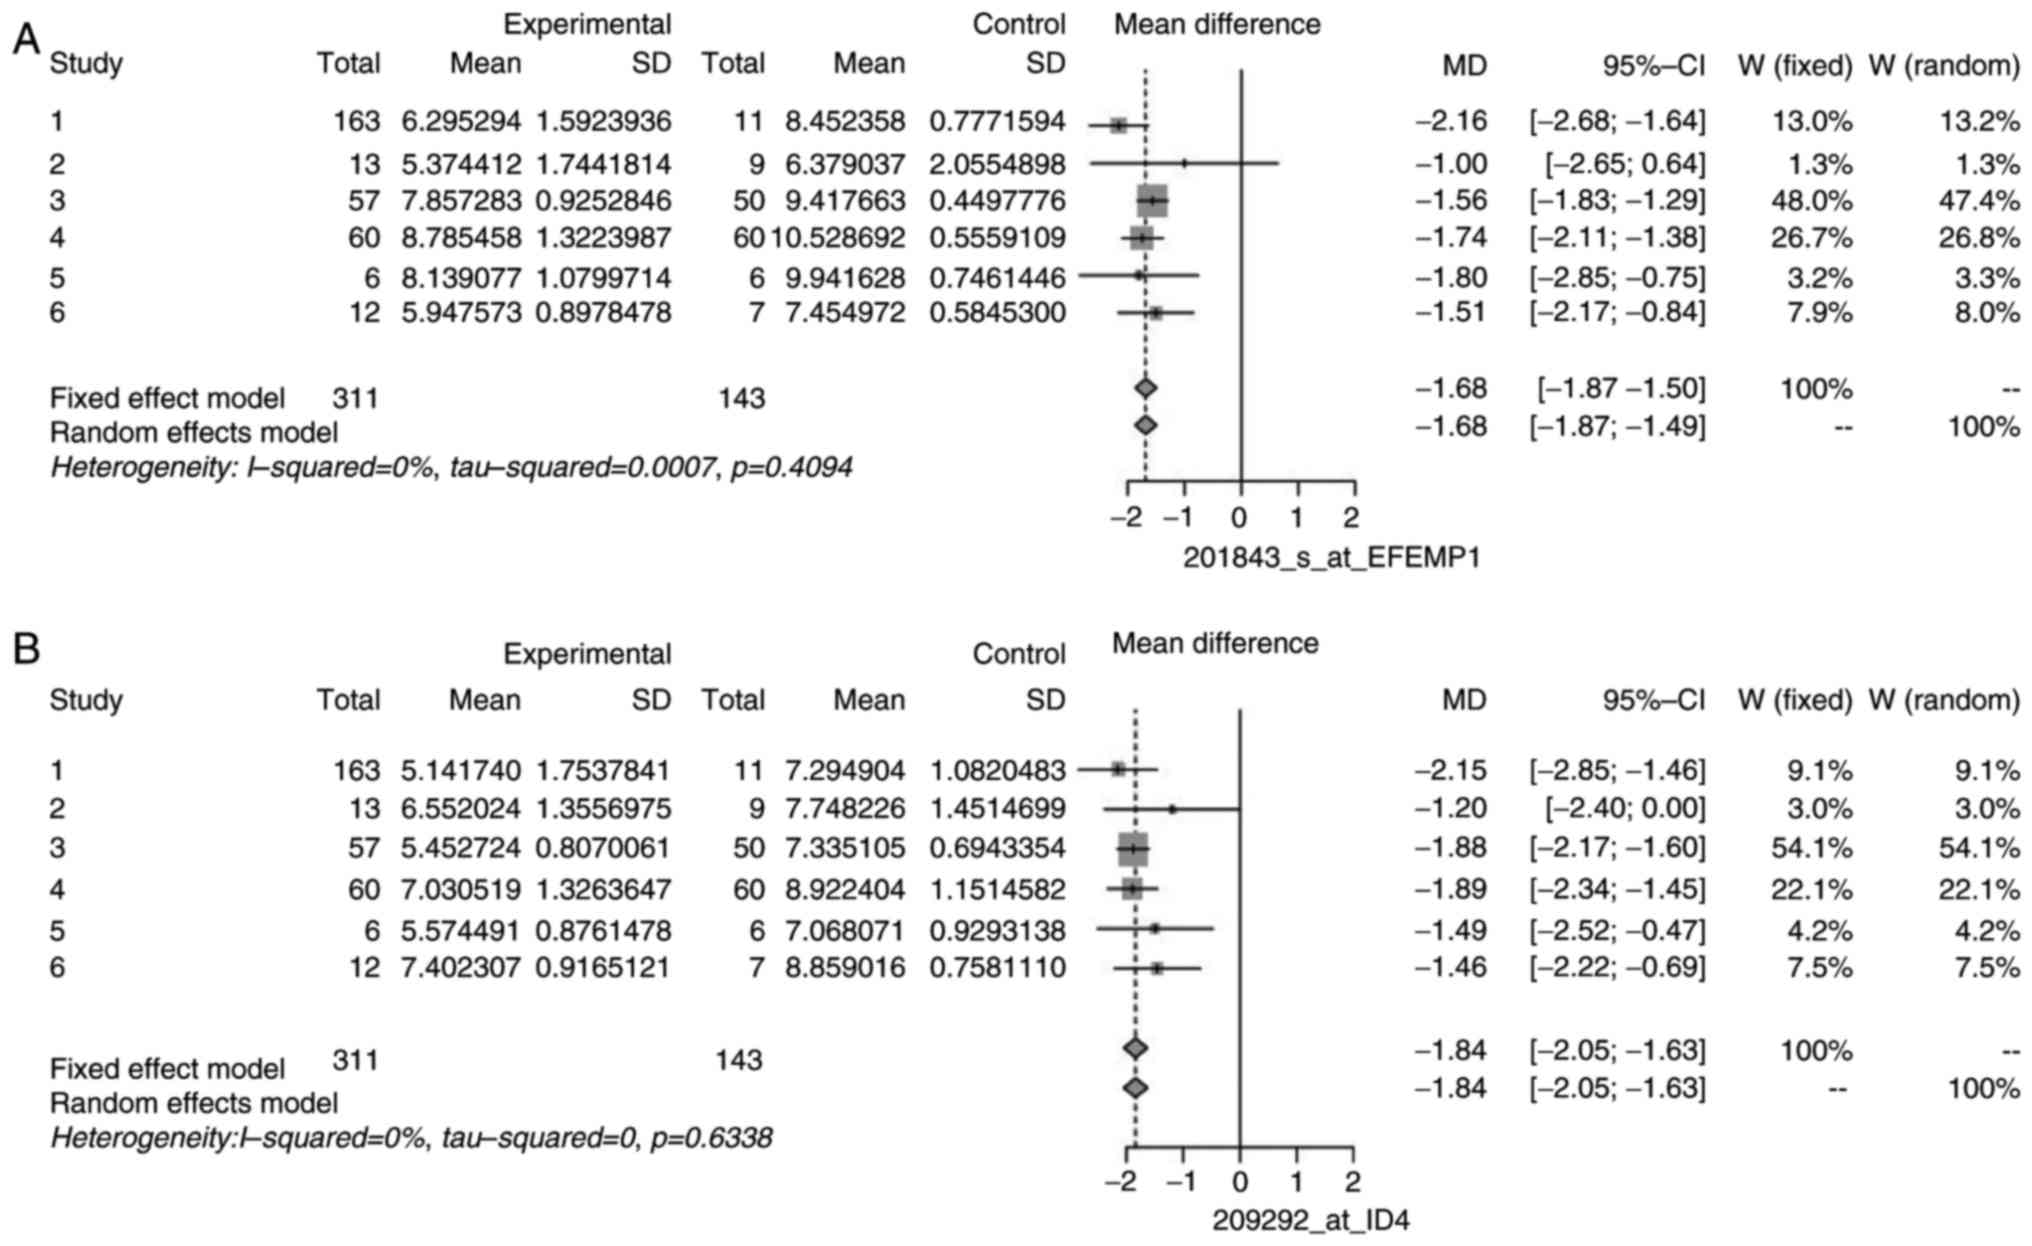
non-heterogeneous behavior was observed in 6 genes out of the list
of DEGs, namely CLU, EFEMP1, ID4, MCAM/MIR6756, PPAP2B, and DPT.
The gene DPT was mapped by two different probe IDs, and therefore
two different I2 values were obtained: one showed
considerable heterogeneity, while the other showed no
heterogeneity. The forest plots for some non-heterogeneous genes
are illustrated in Figs. 5 and
6 as an example. These plots
demonstrated that the mean difference of individual studies is very
close to, or almost similar to the mean of all the studies, which
is depicted by the dashed vertical line. Similar forest plots were
observed for all heterogeneous genes (data not shown).
| Table VI.Meta-analysis of differentially
expressed genes in the six microarray datasets. |
Table VI.
Meta-analysis of differentially
expressed genes in the six microarray datasets.
| Gene symbol | Probe ID | I2
(%) | Q | df | P-value |
|---|
| ANGPT1 | 205608_s_at | 96.10 | 129.21 | 5 | <0.0001 |
| AOX1 | 205083_at | 86.20 | 36.33 | 5 | <0.0001 |
| BIRC5 | 202095_s_at | 97.00 | 167.98 | 5 | <0.0001 |
| CAV1 | 212097_at | 91.80 | 60.9 | 5 | <0.0001 |
| CAV2 | 203323_at | 90.10 | 50.61 | 5 | <0.0001 |
| CDKN1C | 213348_at | 92.60 | 67.89 | 5 | <0.0001 |
| CFD | 205382_s_at | 95.90 | 120.82 | 5 | <0.0001 |
| CLU | 208791_at | 0.00 | 2.97 | 5 | 0.7051 |
| DPT | 213068_at | 76.10 | 20.93 | 5 | 0.0008 |
| DPT | 207977_s_at | 0.00 | 4.25 | 5 | 0.5133 |
| EFEMP1 | 201843_s_at | 1.10 | 5.05 | 5 | 0.4094 |
| ERG | 213541_s_at | 96.20 | 131.24 | 5 | <0.0001 |
| EZH2 | 203358_s_at | 97.00 | 164.74 | 5 | <0.0001 |
| FAM107A | 209074_s_at | 99.00 | 507.18 | 5 | <0.0001 |
| FERMT2 | 209209_s_at | 89.10 | 46 | 5 | <0.0001 |
| FHL1 | 210299_s_at | 86.80 | 37.87 | 5 | <0.0001 |
| FXYD6 | 217897_at | 27.10 | 6.86 | 5 | 0.2311 |
| GPM6A | 209469_at | 97.90 | 235.98 | 5 | <0.0001 |
| GPM6B | 209168_at | 86.10 | 35.99 | 5 | <0.0001 |
| HSPB8 | 221667_s_at | 65.50 | 14.47 | 5 | 0.0129 |
| ID4 | 209292_at | 0.00 | 3.43 | 5 | 0.6338 |
| KCNAB1 | 210078_s_at | 64.50 | 14.1 | 5 | 0.015 |
| KIF4A | 218355_at | 95.80 | 119.67 | 5 | <0.0001 |
| LAPTM4B | 208767_s_at | 96.90 | 163.18 | 5 | <0.0001 |
| MCAM ///
MIR6756 | 210869_s_at | 0.00 | 4.61 | 5 | 0.4657 |
| MYH11 | 201496_x_at | 91.50 | 58.49 | 5 | 0.001 |
| MYL9 | 201058_s_at | 73.80 | 19.12 | 5 | 0.0018 |
| MYLK | 202555_s_at | 90.00 | 49.86 | 5 | <0.0001 |
| NTRK2 | 221796_at | 88.60 | 43.8 | 5 | <0.0001 |
| NUSAP1 | 218039_at | 97 | 177.64 | 5 | <0.0001 |
| PCDH9 | 219737_s_at | 89.30 | 46.86 | 5 | <0.0001 |
| PPAP2B | 212226_s_at | 0.00 | 4.65 | 5 | 0.4606 |
| PTRF | 208789_at | 82.20 | 28.16 | 5 | <0.0001 |
| STIL | 205339_at | 95.20 | 103.46 | 5 | <0.0001 |
| TCEAL2 | 211276_at | 76.30 | 21.11 | 5 | 0.0008 |
| TIMP3 | 201147_s_at | 86.80 | 37.77 | 5 | <0.0001 |
Discussion
The present analysis was motivated by previous
research studies (42–44), where noteworthy genes were identified
through bioinformatics analysis. The objective of the present study
was to recognize common genetic indicators/biomarkers in lung,
breast and prostate cancer, and to confirm their relevance in
cancer by exploring NCBI citations using TARGETgene and by
functional annotations using GENECODIS and DAVID. A robust gene set
involved in the three cancer types was obtained, as microarray and
RNA-Seq data were analyzed in combination in the present study. The
RNA-Seq analysis proposed more genes compared with the microarray
analysis to be involved in the process of oncogenesis. Further
analysis would be required to classify these additional genes so
that normal physiology could be attained by targeting cancer
biomarkers. Further inspection of the obtained gene set for their
inter-experiment behavior was performed to identify heterogeneity
in expression. This is termed as meta-analysis as the normalized
expression values from all available microarray data are combined.
From this examination, it was evident that their comportment is
subject to change in different types of cancers. A systematic
review of between-study variance analysis demonstrated that some
genes had no observed heterogeneity. These genes were CLU, EFEMP1,
ID4, MCAM, PPAP2B and DPT, with I2 values 0, 1.1,
0, 0, 0 and 0% respectively. This indication of non-heterogeneous
behavior across studies has inordinate importance from a biological
perspective. Furthermore, some genes exhibited moderate
heterogeneity, HSPB8, KCNAB1 and FXYD6 with I2
values 65.50, 64.50 and 27.10%, respectively. The DPT gene
exhibited both types of behavior, which suggests that further
experimental validation is required. The remaining genes had
I2 values >70%, suggesting considerable
heterogeneity. Thus, the present analysis demonstrated the mining
of noteworthy gene markers by analysis of both microarray and
RNA-Seq data and by identifying a common set of genes relevant in
the three cancer conditions. By ensuring that the Affymetrix gene
chip platforms used for all the microarray data were similar,
technical variation between platforms were avoided. In addition, by
applying a similar method for normalizing expression and detecting
differential genes to all datasets, the present investigation led
to the discovery of a common subset of genes which displayed
significantly variable expression between tumor and normal samples
from microarray data analysis. Further analysis of RNA-Seq data
from the same cancer types to obtain overlapping results, resulted
in a more robust gene list. The e roles of these genes in
carcinogenesis were further confirmed by the results from GENECODIS
(17), DAVID (18), cancer genetics web (19), OMIM (20) and literature citations (by using
TARGETgene) (21). Finally,
statistical analysis of heterogeneity led to novel conclusions
about their performance in the three different cancer types.
Further studies would be of interest, including how the
deregulation of apoptotic pathways may be one of the major roles
the genes discovered in the present study may have.
Acknowledgements
Authors would like to acknowledge CSIR-National
Environmental Engineering Research Institute (Nagpur, India) for
providing essential resources and constant support for the present
research study. The authors would like to thank Dr Dhananjay Raje
for his guidance and feedback.
References
|
1
|
World Health Organization, . India-Cancer
Country Profile. 2014.
|
|
2
|
Stewart BW and Wild CP: World cancer
report 2014. World Heal Organ. 1–2. 2014.
|
|
3
|
American Cancer Society, . Cancer Facts
& Figures. Atlanta, USA: 2015
|
|
4
|
Barrett T, Wilhite SE, Ledoux P,
Evangelista C, Kim IF, Tomashevsky M, Marshall KA, Phillippy KH,
Sherman PM, Holko M, et al: NCBI GEO: Archive for functional
genomics data sets-Update. Nucleic Acids Res. 41(Database Issue):
D991–D995. 2013.PubMed/NCBI
|
|
5
|
Kolesnikov N, Hastings E, Keays M,
Melnichuk O, Tang YA, Williams E, Dylag M, Kurbatova N, Brandizi M,
Burdett T, et al: ArrayExpress update-simplifying data submissions.
Nucleic Acids Res. 43(Database Issue): D1113–D1116. 2015.
View Article : Google Scholar : PubMed/NCBI
|
|
6
|
Li J, Hou R, Niu X, Liu R, Wang Q, Wang C,
Li X, Hao Z, Yin G and Zhang K: Comparison of microarray and
RNA-Seq analysis of mRNA expression in dermal mesenchymal stem
cells. Biotechnol Lett. 38:33–41. 2016. View Article : Google Scholar : PubMed/NCBI
|
|
7
|
Fumagalli D, Blanchet-Cohen A, Brown D,
Desmedt C, Gacquer D, Michiels S, Rothé F, Majjaj S, Salgado R,
Larsimont D, et al: Transfer of clinically relevant gene expression
signatures in breast cancer: From Affymetrix microarray to Illumina
RNA-Sequencing technology. BMC Genomics. 15:10082014. View Article : Google Scholar : PubMed/NCBI
|
|
8
|
Zhao S, Fung-Leung WP, Bittner A, Ngo K
and Liu X: Comparison of RNA-Seq and microarray in transcriptome
profiling of activated T cells. PLoS One. 9:e786442014. View Article : Google Scholar : PubMed/NCBI
|
|
9
|
Yang X, Bentink S and Spang R: Detecting
common gene expression patterns in multiple cancer outcome
entities. Biomed Microdevices. 7:247–251. 2005. View Article : Google Scholar : PubMed/NCBI
|
|
10
|
Rhodes DR, Yu J, Shanker K, Deshpande N,
Varambally R, Ghosh D, Barrette T, Pandey A and Chinnaiyan AM:
Large-scale meta-analysis of cancer microarray data identifies
common transcriptional profiles of neoplastic transformation and
progression. Proc Natl Acad Sci USA. 101:pp. 9309–9314. 2004;
View Article : Google Scholar : PubMed/NCBI
|
|
11
|
Xu L, Geman D and Winslow RL: Large-scale
integration of cancer microarray data identifies a robust common
cancer signature. BMC Bioinformatics. 8:2752007. View Article : Google Scholar : PubMed/NCBI
|
|
12
|
Zhao P, Hu W, Wang H, Yu S, Li C, Bai J,
Gui S and Zhang Y: Identification of differentially expressed genes
in pituitary adenomas by integrating analysis of microarray data.
Int J Endocrinol. 2015:1640872015. View Article : Google Scholar : PubMed/NCBI
|
|
13
|
Yang Z, Chen Y, Fu Y, Yang Y, Zhang Y,
Chen Y and Li D: Meta-analysis of differentially expressed genes in
osteosarcoma based on gene expression data. BMC Med Genet.
15:802014. View Article : Google Scholar : PubMed/NCBI
|
|
14
|
Chan SK, Griffith OL, Tai IT and Jones SJ:
Meta-analysis of colorectal cancer gene expression profiling
studies identifies consistently reported candidate biomarkers.
Cancer Epidemiol Biomarkers Prev. 17:543–552. 2008. View Article : Google Scholar : PubMed/NCBI
|
|
15
|
Dopazo J: Functional profiling methods in
cancer. Methods Mol Biol. 576:363–374. 2010. View Article : Google Scholar : PubMed/NCBI
|
|
16
|
Griffith OL, Melck A, Jones SJ and Wiseman
SM: Meta-analysis and meta-review of thyroid cancer gene expression
profiling studies identifies important diagnostic biomarkers. J
Clin Oncol. 24:5043–5051. 2006. View Article : Google Scholar : PubMed/NCBI
|
|
17
|
Tabas-Madrid D, Nogales-Cadenas R and
Pascual-Montano A: GeneCodis3: A non-redundant and modular
enrichment analysis tool for functional genomics. Nucleic Acids
Res. 40(Web Server Issue): W478–W483. 2012. View Article : Google Scholar : PubMed/NCBI
|
|
18
|
Dennis G Jr, Sherman BT, Hosack DA, Yang
J, Gao W, Lane HC and Lempicki RA: DAVID: Database for annotation,
visualization, and integrated. Genome Biol. 4:P32003. View Article : Google Scholar : PubMed/NCBI
|
|
19
|
S.J. C: Home Page|Cancer Genetics Web.
|
|
20
|
McKusick VA: McKusick-Nathans Institute
for Genetic Medicine, Johns Hopkins University. National Center for
Biotechnology Information, National Library of Medicine B:
Home-OMIM-NCBI. 2004.
|
|
21
|
Wu CC, D'Argenio D, Asgharzadeh S and
Triche T: TARGETgene: A tool for identification of potential
therapeutic targets in cancer. PLoS One. 7:e433052012. View Article : Google Scholar : PubMed/NCBI
|
|
22
|
Gruosso T, Mieulet V, Cardon M, Bourachot
B, Kieffer Y, Devun F, Dubois T, Dutreix M, Vincent-Salomon A,
Miller KM and Mechta-Grigoriou F: Chronic oxidative stress promotes
H2AX protein degradation and enhances chemosensitivity in breast
cancer patients. EMBO Mol Med. 8:527–549. 2016. View Article : Google Scholar : PubMed/NCBI
|
|
23
|
Timmerman LA, Holton T, Yuneva M, Louie
RJ, Padró M, Daemen A, Hu M, Chan DA, Ethier SP, van't Veer LJ, et
al: Glutamine sensitivity analysis identifies the xct antiporter as
a common triple-negative breast tumor therapeutic target. Cancer
Cell. 24:450–465. 2013. View Article : Google Scholar : PubMed/NCBI
|
|
24
|
Lu T, Tsai MH, Lee JM, Hsu CP, Chen PC,
Lin CW, Shih JY, Yang PC, Hsiao CK, Lai LC and Chuang EY:
Identification of a novel biomarker, SEMA5A, for non-small cell
lung carcinoma in nonsmoking women. Cancer Epidemiol Biomarkers
Prev. 19:2590–2597. 2010. View Article : Google Scholar : PubMed/NCBI
|
|
25
|
Landi MT, Dracheva T, Rotunno M, Figueroa
JD, Liu H, Dasgupta A, Mann FE, Fukuoka J, Hames M, Bergen AW, et
al: Gene expression signature of cigarette smoking and its role in
lung adenocarcinoma development and survival. PLoS One.
3:e16512008. View Article : Google Scholar : PubMed/NCBI
|
|
26
|
Arredouani MS, Lu B, Bhasin M, Eljanne M,
Yue W, Mosquera JM, Bubley GJ, Li V, Rubin MA, Libermann TA and
Sanda MG: Identification of the transcription factor single-minded
Homologue 2 as a potential biomarker and immunotherapy target in
prostate cancer. Clin Cancer Res. 15:5794–5802. 2009. View Article : Google Scholar : PubMed/NCBI
|
|
27
|
Planche A, Bacac M, Provero P, Fusco C,
Delorenzi M, Stehle JC and Stamenkovic I: Identification of
prognostic molecular features in the reactive stroma of human
breast and prostate cancer. PLoS One. 6:e186402011. View Article : Google Scholar : PubMed/NCBI
|
|
28
|
Rahman M, Jackson LK, Johnson WE, Li DY,
Bild AH and Piccolo SR: Alternative preprocessing of RNA-Sequencing
data in the cancer genome atlas leads to improved analysis results.
Bioinformatics. 31:3666–3672. 2015. View Article : Google Scholar : PubMed/NCBI
|
|
29
|
Irizarry RA, Hobbs B, Collin F,
Beazer-Barclay YD, Antonellis KJ, Scherf U and Speed TP:
Exploration, normalization, and summaries of high density
oligonucleotide array probe level data. Biostatistics. 4:249–264.
2003. View Article : Google Scholar : PubMed/NCBI
|
|
30
|
Irizarry RA, Bolstad BM, Collin F, Cope
LM, Hobbs B and Speed TP: Summaries of Affymetrix GeneChip probe
level data. Nucleic Acids Res. 31:e152003. View Article : Google Scholar : PubMed/NCBI
|
|
31
|
Smyth GK: Linear models and empirical
bayes methods for assessing differential expression in microarray
experiments. Stat Appl Genet Mol Biol. 3:2004. View Article : Google Scholar : PubMed/NCBI
|
|
32
|
Ritchie ME, Phipson B, Wu D, Hu Y, Law CW,
Shi W and Smyth GK: Limma powers differential expression analyses
for RNA-sequencing and microarray studies. Nucleic Acids Res.
43:e472015. View Article : Google Scholar : PubMed/NCBI
|
|
33
|
Jeanmougin M, de Reynies A, Marisa L,
Paccard C, Nuel G and Guedj M: Should we abandon the t-Test in the
analysis of gene expression microarray data: A comparison of
variance modeling strategies. PLoS One. 5:e123362010. View Article : Google Scholar : PubMed/NCBI
|
|
34
|
Law CW, Chen Y, Shi W and Smyth GK: Voom:
Precision weights unlock linear model analysis tools for RNA-seq
read counts. Genome Biol. 15:R292014. View Article : Google Scholar : PubMed/NCBI
|
|
35
|
Higgins JP, Thompson SG, Deeks JJ and
Altman DG: Measuring inconsistency in meta-analyses. BMJ.
327:557–560. 2003. View Article : Google Scholar : PubMed/NCBI
|
|
36
|
Pathak M, Dwivedi SN, Deo SVS, Sreenivas V
and Thakur B: Which is the preferred measure of heterogeneity in
meta-analysis and why? A revisit. Biostat Biometrics. 2017.
|
|
37
|
Schwarzer G: Package ‘meta. ’ R News:.
7:40–45. 2007.
|
|
38
|
Ramasamy A, Mondry A, Holmes CC and Altman
DG: Key issues in conducting a meta-analysis of gene expression
microarray datasets. PLoS Med. 5:e1842008. View Article : Google Scholar : PubMed/NCBI
|
|
39
|
Yamada Y, Toyota M, Hirokawa Y, Suzuki H,
Takagi A, Matsuzaki T, Sugimura Y, Yatani R, Shiraishi T and
Watanabe M: Identification of differentially methylated CpG islands
in prostate cancer. Int J Cancer. 112:840–845. 2004. View Article : Google Scholar : PubMed/NCBI
|
|
40
|
Faltermeier CM, Drake JM, Clark PM, Smith
BA, Zong Y, Volpe C, Mathis C, Morrissey C, Castor B, Huang J and
Witte ON: Functional screen identifies kinases driving prostate
cancer visceral and bone metastasis. Proc Natl Acad Sci USA.
113:pp. E172–E181. 2016; View Article : Google Scholar : PubMed/NCBI
|
|
41
|
Kamalian L, Gosney JR, Forootan SS, Foster
CS, Bao ZZ, Beesley C and Ke Y: Increased expression of Id family
proteins in small cell lung cancer and its prognostic significance.
Clin Cancer Res. 14:2318–2325. 2008. View Article : Google Scholar : PubMed/NCBI
|
|
42
|
Chen D and Yang H: Integrated analysis of
differentially expressed genes in breast cancer pathogenesis. Oncol
Lett. 9:2560–2566. 2015. View Article : Google Scholar : PubMed/NCBI
|
|
43
|
Zhao Y, Fu D, Xu C, Yang J and Wang Z:
Identification of genes associated with tongue cancer in patients
with a history of tobacco and/or alcohol use. Oncol Lett.
13:629–638. 2017. View Article : Google Scholar : PubMed/NCBI
|
|
44
|
Huang Y, Tao Y, Li X, Chang S, Jiang B, Li
F and Wang Z: Bioinformatics analysis of key genes and latent
pathway interactions based on the anaplastic thyroid carcinoma gene
expression profile. Oncol Lett. 13:167–176. 2017. View Article : Google Scholar : PubMed/NCBI
|