Introduction
T-cell prolymphocytic leukemia (T-PLL) has an
aggressive course and poor response to conventional therapy, with
median survival times ranging between 7 and 30 months (1–4). Although
chemotherapeutic drugs, including alemtuzumab and analogues, have
significantly improved survival and response rates (5), the survival rate remains unsatisfactory.
Furthermore, the comprehensive molecular mechanisms underlying the
pathogenesis of T-PLL remain unknown.
The majority of T-PLL cells carry the recurrent
chromosome translocations t(14;14)(q11;q32)/inv(14)(q11q32) or
t(X;14)(q28;q11), which cause the activation of the genes T-cell
leukemia/lymphoma 1A (TCL1A) or mature T-cell proliferation
1 (6). These genes and their
associated pathways are likely to be involved in the progression of
T-PLL. Integrated genomic sequencing has proven the importance of
mutated DNA or genes in T-PLL (7).
Bergmann et al (8) indicated
that Janus kinase 3 (JAK3) inhibitors may be an option to
treat patients with T-PLL with recurrent activating JAK3
mutations. Genes including TCL1A (9) and SWI/SNF-related matrix-associated
actin dependent regulator of chromatin B1 (10) have been demonstrated to be associated
with the disease progress of T-PLL. Furthermore, apoptosis has been
induced in T-PLL by certain drugs, including bortezomib (11), and by the induction of certain
proteins, including p53 (12), which
indicates further the potential association between pathways
associated with apoptosis and T-PLL. Specific genes and chromosomal
loci are likely to be linked with disease progression in T-PLL
(13), and identifying the
significance of altered genes and pathways is vital to increasing
the understanding of T-PLL. However, these genes and pathways have
yet to be identified.
To investigate the molecular basis of T-PLL in the
present study, a bioinformatics analysis of gene expression profile
data (GSE5788) was performed. The differentially expressed genes
(DEGs) in T-PLL were identified by comparing the microarray data
from 6 T-cell T-PLL blood cell samples with those of 8 cluster of
differentiation 3 (CD3)+ T-cell samples from healthy
donors. Gene ontology (GO; http://www.geneontology.org/) function and Kyoto
Encyclopedia of Genes and Genomes (KEGG; http://www.genome.jp/kegg/) pathway enrichment
analyses were performed, followed by protein-protein interaction
(PPI) network and sub-PPI network analyses. The aim was to
elucidate the molecular mechanisms of T-PLL, which may aid in the
selection of appropriate treatment strategies and the development
of novel treatments for T-PLL.
Materials and methods
Samples
The expression profile dataset GSE5788 (13), which was created using the microarray
platform Affymetrix Human Genome U133 Plus 2.0 Array (Santa Clara,
CA, USA), was downloaded from the Gene Expression Omnibus (GEO;
http://www.ncbi.nlm.nih.gov/geo/). In
order to compare the difference between the T-PLL cells and the
normal T-cells, a total of 6 T-PLL blood cell samples including
GSM135264 (the experimental group), and 8 CD3+ normal
donor T-cell samples purified by immunomagnetic separation,
including GSM135270 (the control group), were included in GSE5788.
The preprocessing of the microarray data, including calculation of
the robust multi-array average (14),
was performed by using the Affy options in Bioconductor software
(15) and the Affy microarray probe
annotation file of Brain Array lab (16).
Screening DEGs
An empirical Bayes method based on the Limma package
(17) in R software (https://journal.r-project.org/) was used to
identify DEGs among the groups. A false discovery rate (FDR)
<0.05 and log. of fold-change >1 were selected as the
criteria for the identification of DEGs.
GO and pathway enrichment
analysis
GO (18) functional
enrichment analysis, including associated cellular component,
molecular function (6) and biological
process categories, was performed to identify functional enrichment
of DEGs. KEGG pathway enrichment (19) was performed to predict the pathways
that the previously identified DEGs were associated with. The
Database for Annotation, Visualization and Integrated Discovery
(DAVID 6.7 Jan. 2010) (20) was used
to identify GO categories and significant KEGG pathways with the
FDR set as <0.01.
Annotation of gene function
The Transcription Factor (TRANSFAC; http://www.gene-regulation.com/pub/databases.html)
database provides information on eukaryotic transcription factors,
binding sites, consensus binding sequences and regulated genes. All
DEGs were screened based on the TRANSFAC database to identify
whether they had a function in transcriptional regulation. Cancer
gene databases, including TSGene (a database of tumor suppressor
genes) (21) and a tumor-associated
gene (TAG) database as described by Chen et al (22), were used to screen for identified
cancer-promoting or -inhibiting genes.
PPI network and sub-PPI network
construction
The Search Tool for the Retrieval of Interacting
Genes (STRING, https://string-db.org/cgi/input.pl) (23) database made associations based on
predicted or experimental PPI information. From the STRING
database, protein encoding genes that interacted with specific
genes were assembled to construct a PPI network. As the non-DEGs of
the network may be associated with multiple DEGs, the result of
network analysis may be that the role of non-DEGs is greater
compared with that of the DEGs. To study the role of DEGs in PPI
and to avoid the interference of non DEGs, the non DEGs associated
with 1–2 DEGs were enrolled in the network. Interactions were
included when they had a combined score >0.95.
The sub-PPI network was additionally investigated
using BioNet software (24). The
modules were constructed based on the sub-PPI network. A false
discovery rate P≤0.005 was selected as the threshold for sub-PPI
network construction.
Results
Identification of DEGs
The GSE5788 expression profile data from GEO was
investigated to screen for DEGs between the experimental and
control groups. A total of 438 DEGs in T-PLL blood sample cells,
including 84 upregulated genes and 354 downregulated genes, were
revealed (Table I).
 | Table I.Differentially expressed genes in the
present study (FDR <0.05 and |logFC| >1). |
Table I.
Differentially expressed genes in the
present study (FDR <0.05 and |logFC| >1).
| Type | Transcript
count | Gene count |
|---|
| Downregulated | 1,249 | 354 |
| Upregulated |
305 | 84 |
| Total | 1,554 | 438 |
GO enrichment analysis
To investigate the function changes in tumor
development, GO enrichment analysis of the previously identified
DEGs was performed using DAVID. The top 10 up- and downregulated
DEGs according to P-value are listed in Table II. The downregulated DEGs were
frequently enriched for ontology labels associated with immune
function, including immune response (GO:0006955;
P=3.21×10⁻⁹), and tumor progression, including cell
death (GO:0008219; P=2.37×10⁻⁷). Upregulated DEGs were
frequently enriched in cell proliferation (GO:0008283;
P=7.12×10⁻⁴) and skin development (GO:0043588;
P=9.00×10⁻⁴).
| Table II.Top 10 upregulated and downregulated
differentially expressed gene ontologies identified by GO
functional enrichment analysis. |
Table II.
Top 10 upregulated and downregulated
differentially expressed gene ontologies identified by GO
functional enrichment analysis.
| A, Downregulated
genes |
|---|
|
|---|
| GO ID | Description | Gene count | P-value |
|---|
| GO:0006955 | Immune
response | 58 |
3.21×10⁻⁹ |
| GO:0002376 | Immune system
process | 77 | 1.40×10⁻⁸ |
| GO:0008219 | Cell death | 66 |
2.37×10⁻⁷ |
| GO:0016265 | Death | 66 | 2.53×10⁻⁷ |
| GO:0046649 | Lymphocyte
activation | 28 |
5.42×10⁻⁷ |
| GO:0042110 | T cell
activation | 23 | 5.57×10⁻⁷ |
| GO:0051249 | Regulation of
lymphocyte activation | 21 |
9.52×10⁻⁷ |
| GO:0030098 | Lymphocyte
differentiation | 18 | 1.44×10⁻⁶ |
| GO:0044267 | Cellular protein
metabolic process | 103 |
1.49×10⁻⁶ |
|
| B, Upregulated
genes |
|
| GO ID |
Description | Gene
count | P-value |
|
| GO:0045321 | Leukocyte
activation | 30 | 1.86×10⁻⁶ |
| GO:0008283 | Cell
proliferation | 18 |
7.12×10⁻⁴ |
| GO:0043588 | Skin
development | 7 | 8.97×10⁻⁴ |
| GO:0009913 | Epidermal cell
differentiation | 5 |
1.02×10⁻³ |
| GO:0006228 | UTP biosynthetic
process | 2 | 1.57×10⁻³ |
| GO:0042455 | Ribonucleoside
biosynthetic process | 4 |
1.61×10⁻³ |
| GO:0046051 | UTP metabolic
process | 2 | 1.85×10⁻³ |
| GO:0006213 | Pyrimidine
nucleoside metabolic process | 3 |
2.09×10⁻³ |
| GO:1901070 |
Guanosine-containing compound biosynthetic
process | 2 | 2.15×10⁻³ |
| GO:0009163 | Nucleoside
biosynthetic process | 4 |
2.21×10⁻³ |
| GO:1901659 | Glycosyl compound
biosynthetic process | 4 | 2.28×10⁻³ |
KEGG pathway enrichment analysis
KEGG pathway enrichment analysis using DAVID was
performed on the DEGs (Table III).
The results revealed that the upregulated DEGs were frequently
associated with tumor metastasis pathways, including apoptosis
(P=6.20×10⁻⁵), immune response pathways, including
graft-versus-host disease (P=1.61×10⁻⁴), and immune
response or antigen reaction pathways, including Chagas disease
(American trypanosomiasis; P=5.18×10⁻³). The
downregulated DEGs were enriched in the malaria pathway
(P=3.33×10⁻³).
| Table III.Top 10 downregulated pathways and a
unique upregulated pathway significantly enriched by DEGs in T-cell
prolymphocytic leukemia. |
Table III.
Top 10 downregulated pathways and a
unique upregulated pathway significantly enriched by DEGs in T-cell
prolymphocytic leukemia.
| Regulation | KEGG pathway | Gene count | P-value |
|---|
| Down | Apoptosis | 9 |
6.20×10⁻⁵ |
|
| Graft-versus-host
disease | 6 |
1.61×10⁻⁴ |
|
| T cell receptor
signaling pathway | 9 |
3.30×10⁻⁴ |
|
| Allograft
rejection | 5 |
8.48×10⁻⁴ |
|
| Type I diabetes
mellitus | 5 |
1.70×10⁻³ |
|
| Natural killer cell
mediated cytotoxicity | 9 |
1.75×10⁻³ |
|
| Autoimmune thyroid
disease | 5 |
3.96×10⁻³ |
|
| Antigen processing
and presentation | 6 |
4.39×10⁻³ |
|
| Chagas disease
(American trypanosomiasis) | 7 |
5.18×10⁻³ |
|
| Prion diseases | 4 |
5.33×10⁻³ |
| Up | Malaria | 3 |
3.33×10⁻³ |
Functional annotation of DEGs
From the T-PLL blood sample microarray data, a total
of 13 downregulated [including signal transducer and activator of
transcription 3 (STAT3)] and 4 upregulated [including
transcription factor 7 like 2 (TCF7L2)] transcription
factors, as well as 27 downregulated (including FYN) and 10
upregulated (including TCL1A) TAGs were revealed to be
associated with T-PLL (Table
IV).
| Table IV.Functional analysis of DEGs. |
Table IV.
Functional analysis of DEGs.
|
| Downregulated | Upregulated |
|---|
|
|
|
|
|---|
| Type | Count | DEGs | Count | DEGs |
|---|
| Transcription
factors | 13 | TBX21, STAT4,
STAT3, RORA, NR3C2, NR3C1, MAF, IRF1, ID2, GTF2B, GATA3, CDK7,
ARNTL | 4 | TCF7L2, NME2,
KLF4, ENO1 |
| Tumor-associated
genes | 27 |
| 10 |
|
|
Oncogenes | 4 | SET, KRAS,
GNA13, FYN | 1 | TCL1A |
| Tumor
suppressors | 16 | TGFBR3, TGFBR2,
SP100, RARRES3, PPP3CC, MFHAS1, IRF1, ING3, HOPX, HECA, HBP1, FHIT,
DOK2, CYLD, CDKN1B, CASP8 | 4 | TCF7L2, RAB25,
ESRP1, CDK2AP1 |
|
Others | 7 | STAT3, PRKCB,
MAP3K5, MAF, EVI2B, EPS15, ATM | 5 | KLF4, GSTM1, FES,
ENO1, DDR1 |
Using the Disease Ontology database (25), the downregulated genes, including
ARL6IP5, ATM, CCL4, CCL5, CDKN1B, CFLAR, FAS, GNLY, IL2RB,
KAT2B, MAP3K5, SET and TRIM22, were revealed to be
associated with leukemia and chronic lymphocytic leukemia.
PPI module investigation and pathway
regulation analysis
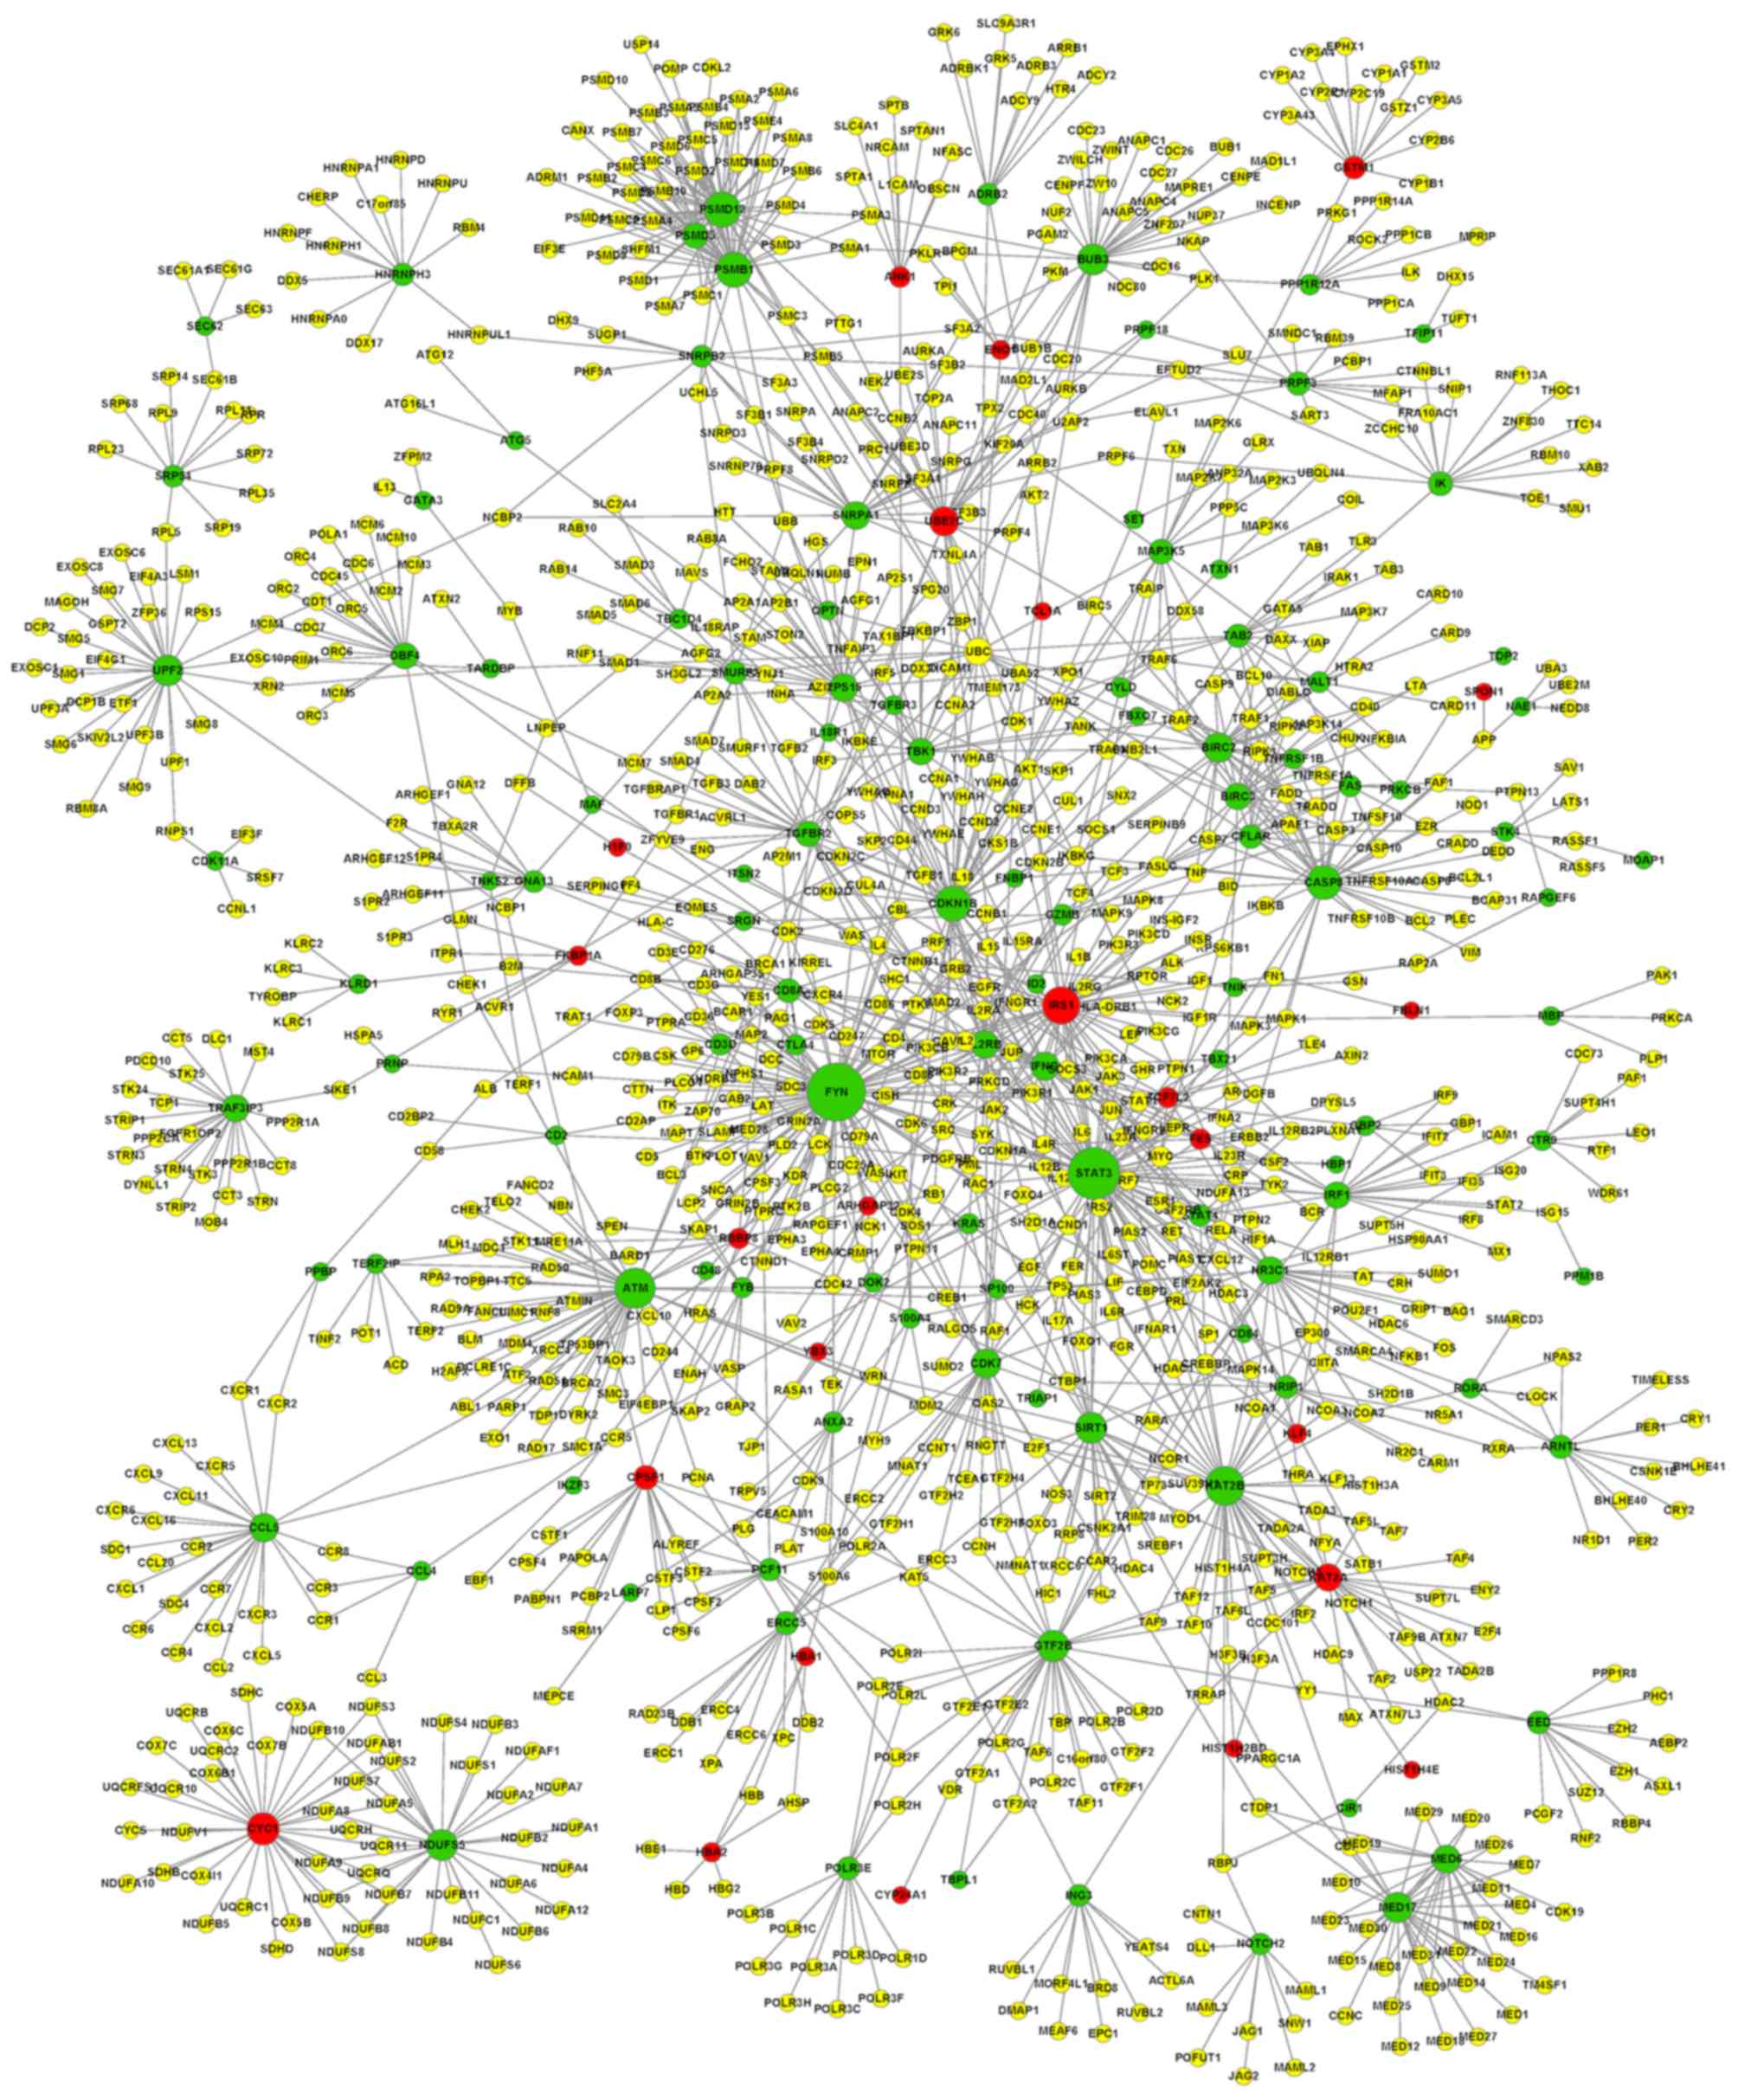
A PPI network of DEGs associated with T-PLL was
constructed based on the STRING database (Fig. 1). A total of 10 nodes with the highest
degree were selected, including FYN (degree, 90),
STAT3 (degree, 76), ATM (degree, 51), KAT2B
(degree, 48), IRS1 (insulin receptor substrate-1; degree,
45), PSMD12 (degree, 41), PSMB1 (degree, 40),
CDKN1B (degree, 40), CASP8 (degree, 38) and
CYC1 (degree, 34).
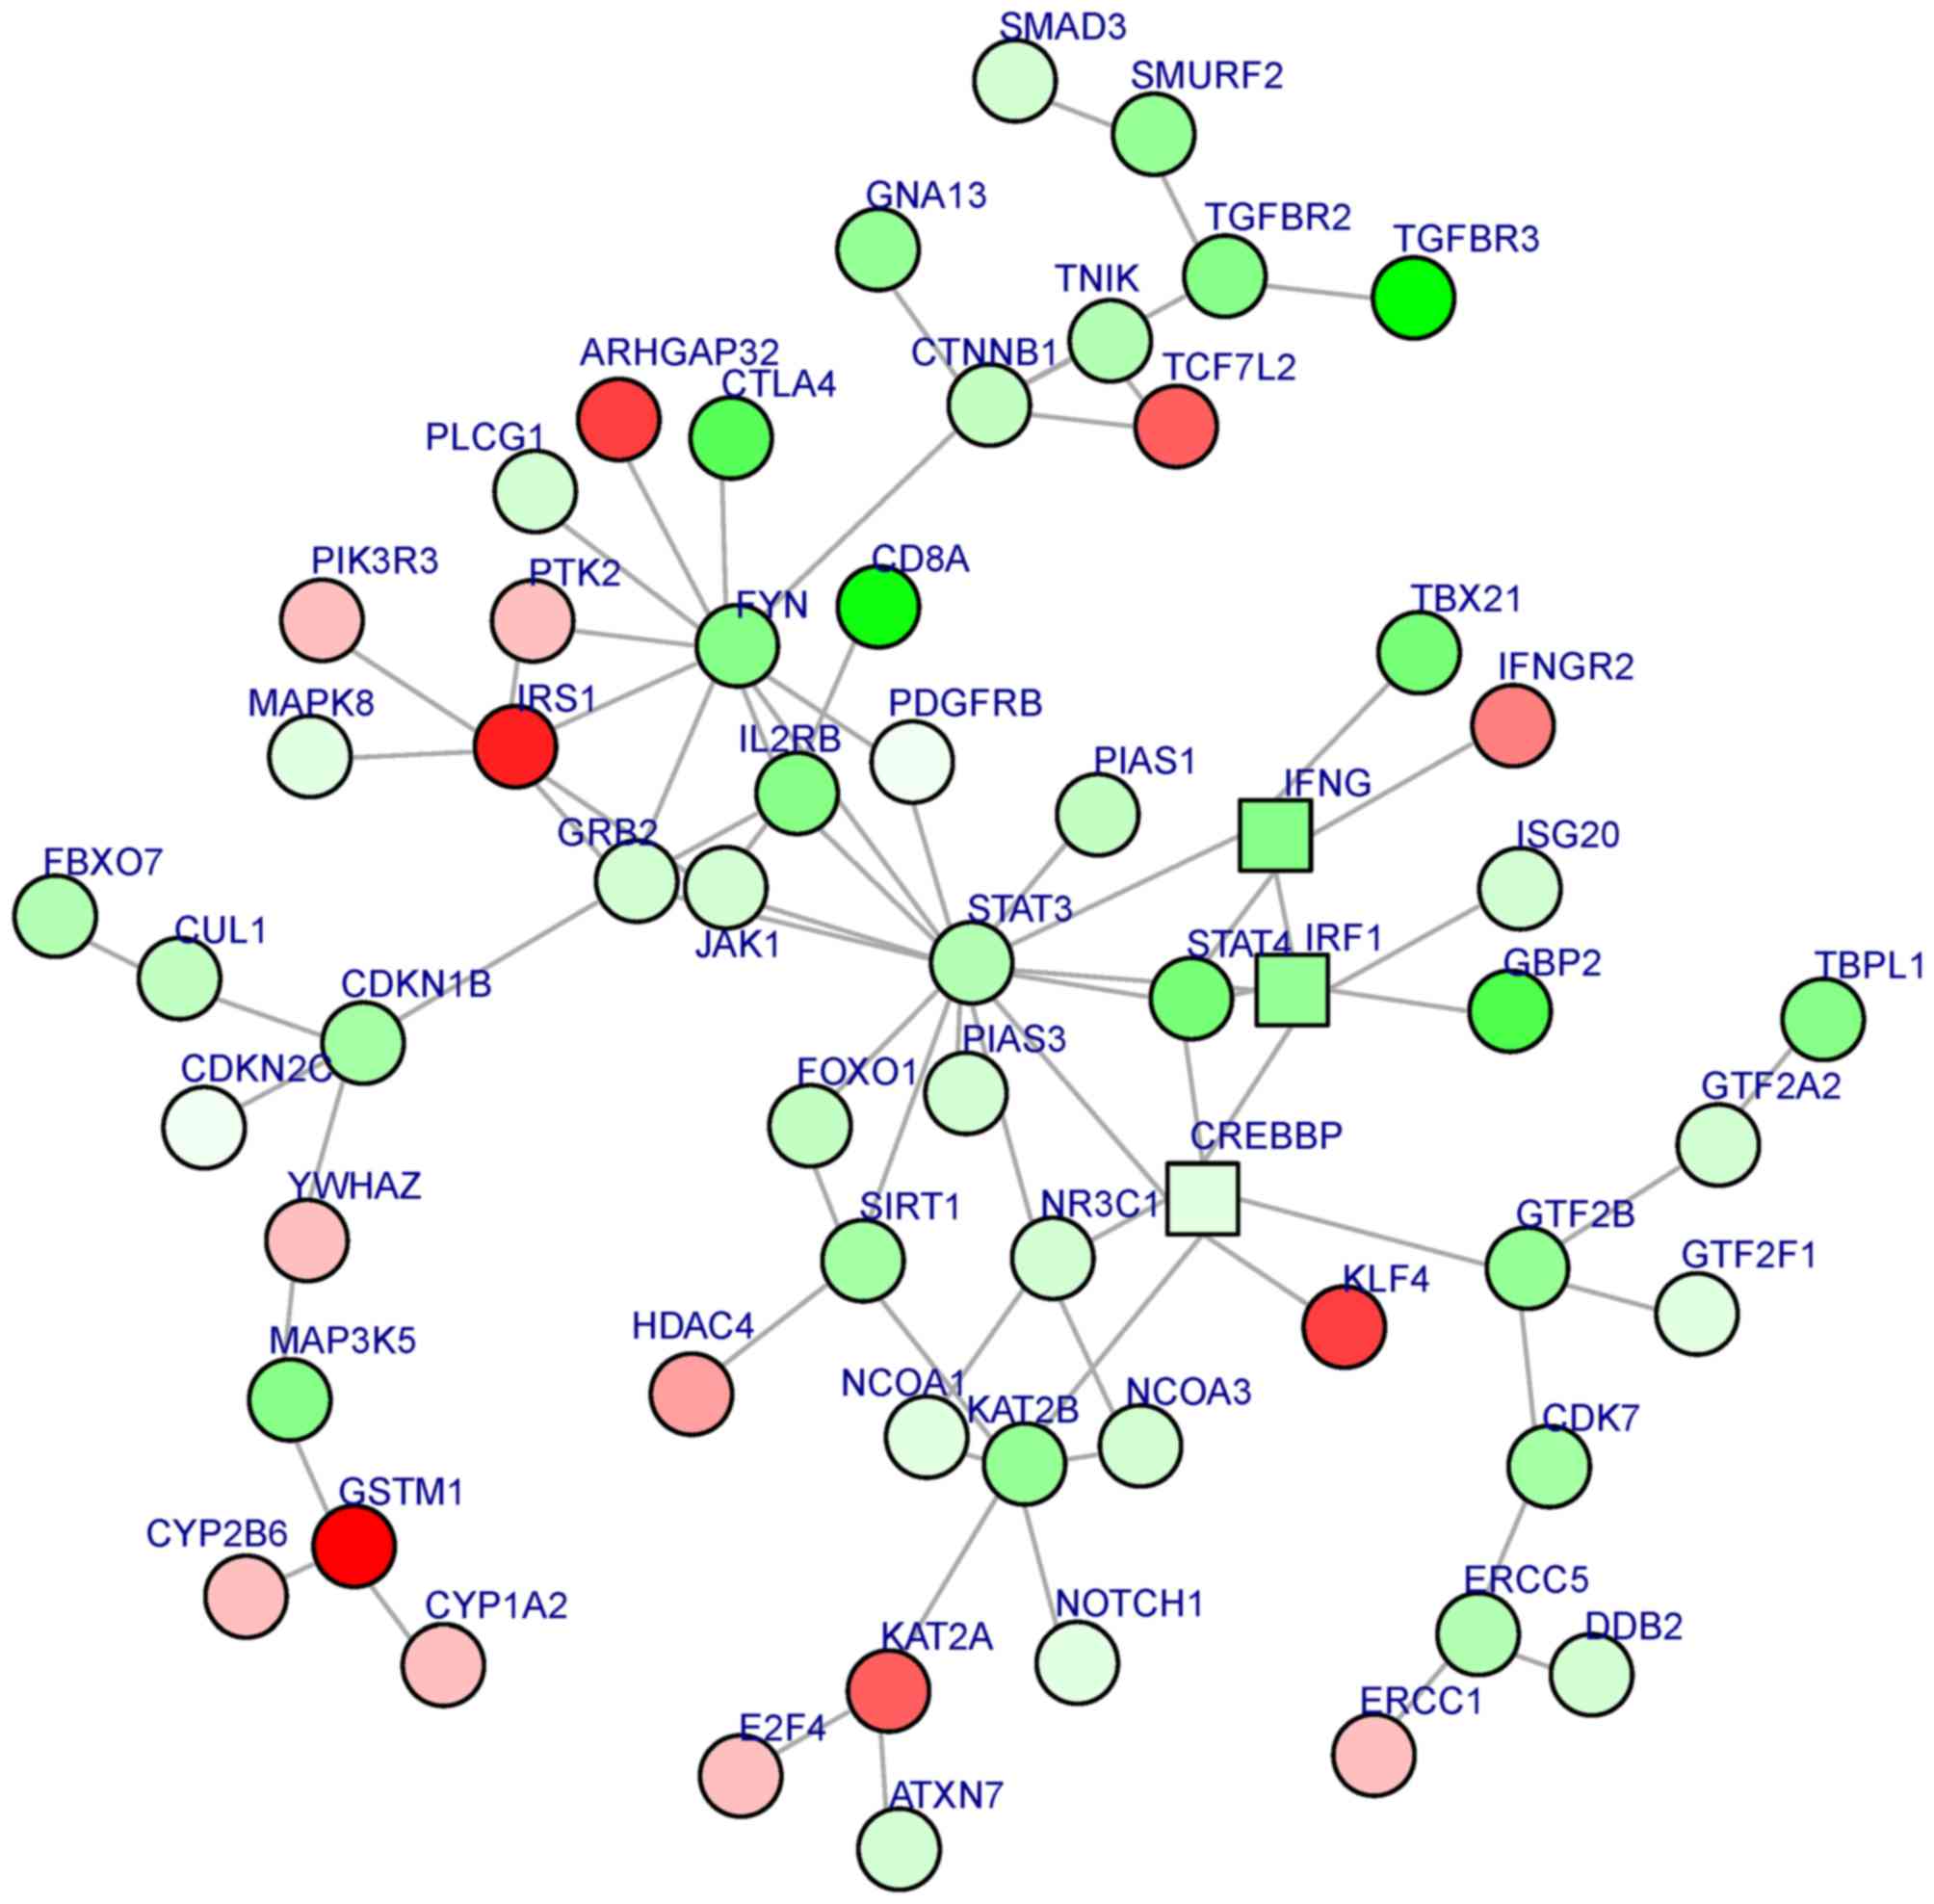
A sub-PPI network was constructed based on the
aforementioned PPI network. BioNet software was used to analyze the
sub-PPI network. A total of 61 gene nodes, including STAT3
(the most significantly downregulated gene in the sub-PPI network,
degree, 14) and IRS1 (the most significantly upregulated gene in
the sub-PPI network, degree, 6), were included in the sub-PPI
network (Fig. 2).
The KEGG pathway analysis was performed based on the
DEGs in the sub-PPI network. As presented in Table V, the sub-network of STAT3 is
involved in growth signal pathways [including the JAK-STAT
signaling pathway (P=3.0×10⁻⁸)], cell differentiation
pathways [including osteoclast differentiation
(P=7.5×10⁻⁶)], cancer-associated pathways [including
prostate cancer (P=4.7×10⁻⁷)], and viral
disease-associated pathways [including hepatitis C
(P=1.1×10⁻⁵)].
| Table V.The top 10 most KEGG-enriched
pathways for the network module. |
Table V.
The top 10 most KEGG-enriched
pathways for the network module.
| KEGG pathway | Gene count | P-value |
|---|
| Pathways in
cancer | 17 |
2.65×10⁻¹⁰ |
| JAK-STAT signaling
pathway | 11 |
2.97×10⁻⁸ |
| Prostate
cancer | 8 |
4.67×10⁻⁷ |
| TGF-β signaling
pathway | 7 |
4.37×10⁻⁶ |
| Cell cycle | 8 |
5.88×10⁻⁶ |
| Osteoclast
differentiation | 8 |
7.45×10⁻⁶ |
| Colorectal
cancer | 6 |
9.43×10⁻⁶ |
| Hepatitis C | 8 |
1.05×10⁻⁵ |
| Pancreatic
cancer | 6 |
1.91×10⁻⁵ |
| T cell receptor
signaling pathway | 7 |
2.32×10⁻⁵ |
Discussion
T-PLL is a rare, aggressive T-cell leukemia, which
has not been well characterized, particularly in terms of its
molecular mechanisms. In the present study, the molecular
pathogenesis of T-PLL was investigated based on a comprehensive
bioinformatics analysis. The results identified 84 upregulated and
354 downregulated genes in T-PLL sample microarrays. These DEGs
were associated with various functions including cell death, and
various pathways, including apoptosis. A total of 17 dysregulated
transcription factors and 37 dysregulated TAG were revealed based
on functional analysis of DEGs. A PPI network analysis identified a
total of 61 genes. The most significantly downregulated gene,
STAT3 (degree, 14), and upregulated gene, IRS1
(degree, 6), may have significant associations with the
pathogenesis and progression of T-PLL.
The dysregulation of specific genes, including
transcription factors, and associated pathways is commonly
associated with increased tumor cell proliferation, based on
previous bioinformatics analyses (26–28). These
genes and pathways perform important roles and are likely to be
significant in the development of cancer (29). STAT3 is activated in various
types of cancer, including gliomas and breast cancer (30,31). The
STAT3 signaling pathway, including the upstream JAK signal
transducer, has been reported to participate in the development of
various cancer types (32,33).
Previous studies indicate that JAK2-STAT3 signaling
is involved in the production of hepatic thrombopoietin (34) and the growth of hormone refractory
prostate cancer cells (35). In the
present study, the downregulated STAT3 was the core node of
the sub-PPI network, and the DEGs connected to STAT3 were
involved in pathways including JAK-STAT signaling. This result
confirms that STAT3 and the JAK2-STAT3 pathway are
associated with the progression of T-PLL.
Another gene identified to be significant was
IRS1, a critical component of insulin signaling, which is
also involved in cell proliferation and cancer development
(36). IRS1 is associated with
the progression of tumors, including lung cancer (37) and colorectal cancer (38). The significant upregulation of
IRS1 in the present study indicated the close association of
IRS1 with T-PLL, which was in accordance with the function
of IRS1 in cancer identified in previous studies. The
expression levels of various genes, including STAT3 and
IRS1, were significantly altered in the tumor compared with
the controls, implying they may be used as novel biomarkers for
establishing a prognosis in T-PLL.
Novel drugs targeting specific pathways can be
developed based on an understanding of the pathogenesis of T-PLL
(5). KEGG pathway analysis in the
present study revealed that apoptosis and T-cell receptor signaling
were included among the enriched pathways identified. The majority
of these outstanding pathways were enriched among the downregulated
genes, indicating that the downregulation of genes in these
pathways may act to inhibit T-cell activation, promoting disease
progression. However, additional investigations are required to
improve the understanding of the complex interaction of these
dysregulated genes and associated pathways.
In conclusion, the mechanism of T-PLL was observed
to be complicated. Various cell functions, including cell death,
and pathways, including apoptosis, may be involved in the process.
Identified candidate genes, including STAT3 and IRS1,
may be targets for the additional study of T-PLL.
Acknowledgements
Not applicable.
Funding
This work was supported by the Lateral projects of
Jilin University (Grant No. 3R216X133430 and 3R216X123430).
Availability of data and materials
The expression profile dataset GSE5788, was
downloaded from the Gene Expression Omnibus (GEO; http://www.ncbi.nlm.nih.gov/geo/).
Authors' contributions
ZS and HL designed the bioinformatics pipeline. JY,
HS, KC, JZ and QJ performed the bioinformatics analysis. ZS and JY
prepared the manuscript.
Ethics approval and consent to
participate
Not applicable.
Consent for publication
Not applicable.
Competing interests
The authors declare that they have no competing
interests.
References
|
1
|
Herling M, Khoury JD, Washington LT, Duvic
M, Keating MJ and Jones D: A systematic approach to diagnosis of
mature T-cell leukemias reveals heterogeneity among WHO categories.
Blood. 104:328–335. 2004. View Article : Google Scholar : PubMed/NCBI
|
|
2
|
Matutes E, Brito-Babapulle V, Swansbury J,
Ellis J, Morilla R, Dearden C, Sempere A and Catovsky D: Clinical
and laboratory features of 78 cases of T-prolymphocytic leukemia.
Blood. 78:3269–3274. 1991.PubMed/NCBI
|
|
3
|
Soulier J, Pierron G, Vecchione D, Garand
R, Brizard F, Sigaux F, Stern MH and Aurias A: A complex pattern of
recurrent chromosomal losses and gains in T-cell prolymphocytic
leukemia. Genes Chromosomes Cancer. 31:248–254. 2001. View Article : Google Scholar : PubMed/NCBI
|
|
4
|
Vivekanandarajah A, Atallah JP and Gupta
S: T-cell prolymphocytic leukaemia (T-PLL): A rare disease with a
grave prognosis. BMJ Case Rep. 2013:pii: bcr2013009808. 2013.
View Article : Google Scholar : PubMed/NCBI
|
|
5
|
K A and D C: T-cell prolymphocytic
leukemia. Clin Lymph Myelom. 9 Suppl 3:S239–S243. 2009. View Article : Google Scholar
|
|
6
|
Brito-Babapulle V, Pomfret M, Matutes E
and Catovsky D: Cytogenetic studies on prolymphocytic leukemia. II.
T cell prolymphocytic leukemia. Blood. 70:926–931. 1987.PubMed/NCBI
|
|
7
|
Kiel MJ, Velusamy T, Rolland D,
Sahasrabuddhe AA, Chung F, Bailey NG, Schrader A, Li B, Li JZ, Ozel
AB, et al: Integrated genomic sequencing reveals mutational
landscape of T-cell prolymphocytic leukemia. Blood. 124:1460–1472.
2014. View Article : Google Scholar : PubMed/NCBI
|
|
8
|
Bergmann AK, Schneppenheim S, Seifert M,
Betts MJ, Haake A, Lopez C, Maria Murga Penas E, Vater I, Jayne S,
Dyer MJ, et al: Recurrent mutation of JAK3 in T-cell prolymphocytic
leukemia. Genes Chromosomes Cancer. 53:309–316. 2014. View Article : Google Scholar : PubMed/NCBI
|
|
9
|
Yokohama A, Saitoh A, Nakahashi H, Mitsui
T, Koiso H, Kim Y, Uchiumi H, Saitoh T, Handa H, Jimbo T, et al:
TCL1A gene involvement in T-cell prolymphocytic leukemia in
Japanese patients. Int J Hematol. 95:77–85. 2012. View Article : Google Scholar : PubMed/NCBI
|
|
10
|
Bug S, Dürig J, Oyen F, Klein-Hitpass L,
Martin-Subero JI, Harder L, Baudis M, Arnold N, Kordes U, Dührsen
U, et al: Recurrent loss, but lack of mutations, of the SMARCB1
tumor suppressor gene in T-cell prolymphocytic leukemia with
TCL1A-TCRAD juxtaposition. Cancer Genet Cytogenet. 192:44–47. 2009.
View Article : Google Scholar : PubMed/NCBI
|
|
11
|
Ozpuyan F, Meyer P, Ni H, Al-Masri H and
Alkan S: Bortezomib induces apoptosis in T-cell prolymphocytic
leukemia (T-PLL). Leuk Lymphoma. 48:2247–2250. 2007. View Article : Google Scholar : PubMed/NCBI
|
|
12
|
Wang J, Hasui K, Utsunomiya A, Jia X,
Matsuyama T and Murata F: Association of high proliferation in
adult T-cell leukemia cells with apoptosis, and expression of p53
protein in acute type ATL. J Clin Exp Hematop. 48:1–10. 2008.
View Article : Google Scholar : PubMed/NCBI
|
|
13
|
Dürig J, Bug S, Klein-Hitpass L, Boes T,
Jöns T, Martin-Subero JI, Harder L, Baudis M, Dührsen U and Siebert
R: Combined single nucleotide polymorphism-based genomic mapping
and global gene expression profiling identifies novel chromosomal
imbalances, mechanisms and candidate genes important in the
pathogenesis of T-cell prolymphocytic leukemia with
inv(14)(q11q32). Leukemia. 21:2153–2163. 2007. View Article : Google Scholar : PubMed/NCBI
|
|
14
|
Irizarry RA, Hobbs B, Collin F,
Beazer-Barclay YD, Antonellis KJ, Scherf U and Speed TP:
Exploration, normalization and summaries of high density
oligonucleotide array probe level data. Biostatistics. 4:249–264.
2003. View Article : Google Scholar : PubMed/NCBI
|
|
15
|
Gautier L, Cope L, Bolstad BM and Irizarry
RA: Affy-analysis of Affymetrix GeneChip data at the probe level.
Bioinformatics. 20:307–315. 2004. View Article : Google Scholar : PubMed/NCBI
|
|
16
|
Wang P, Ding F, Chiang H, Thompson RC,
Watson SJ and Meng F: ProbeMatchDB-a web database for finding
equivalent probes across microarray platforms and species.
Bioinformatics. 18:488–489. 2002. View Article : Google Scholar : PubMed/NCBI
|
|
17
|
Smyth GK: Linear models and empirical
bayes methods for assessing differential expression in microarray
experiments. Stat Appl Genet Mol Biol. 3:Article32004. View Article : Google Scholar : PubMed/NCBI
|
|
18
|
Ashburner M, Ball CA, Blake JA, Botstein
D, Butler H, Cherry JM, Davis AP, Dolinski K, Dwight SS, Eppig JT,
et al: Gene ontology: Tool for the unification of biology. The Gene
Ontology Consortium. Nat Genet. 25:25–29. 2000. View Article : Google Scholar : PubMed/NCBI
|
|
19
|
Kanehisa M and Goto S: KEGG: Kyoto
encyclopedia of genes and genomes. Nucleic Acids Res. 28:27–30.
2000. View Article : Google Scholar : PubMed/NCBI
|
|
20
|
da Huang W, Sherman BT and Lempicki RA:
Systematic and integrative analysis of large gene lists using DAVID
bioinformatics resources. Nat Protoc. 4:44–57. 2009. View Article : Google Scholar : PubMed/NCBI
|
|
21
|
Zhao M, Sun J and Zhao Z: TSGene: A web
resource for tumor suppressor genes. Nucleic Acids Res.
41:(Database Issue). D970–D976. 2013. View Article : Google Scholar : PubMed/NCBI
|
|
22
|
Chen JS, Hung WS, Chan HH, Tsai SJ and Sun
HS: In silico identification of oncogenic potential of fyn-related
kinase in hepatocellular carcinoma. Bioinformatics. 29:420–427.
2013. View Article : Google Scholar : PubMed/NCBI
|
|
23
|
Franceschini A, Szklarczyk D, Frankild S,
Kuhn M, Simonovic M, Roth A, Lin J, Minguez P, Bork P, von Mering C
and Jensen LJ: STRING v9.1: Protein-protein interaction networks,
with increased coverage and integration. Nucleic Acids Res.
41:(Database Issue). D808–D815. 2013. View Article : Google Scholar : PubMed/NCBI
|
|
24
|
Beisser D, Klau GW, Dandekar T, Müller T
and Dittrich MT: BioNet: An R-Package for the functional analysis
of biological networks. Bioinformatics. 26:1129–1130. 2010.
View Article : Google Scholar : PubMed/NCBI
|
|
25
|
Kibbe WA, Arze C, Felix V, Mitraka E,
Bolton E, Fu G, Mungall CJ, Binder JX, Malone J, Vasant D, et al:
Disease Ontology 2015 update: An expanded and updated database of
human diseases for linking biomedical knowledge through disease
data. Nucleic Acids Res. 43:(Database Issue). D1071–D1078. 2015.
View Article : Google Scholar : PubMed/NCBI
|
|
26
|
Liu YJ, Zhu Y, Yuan HX, Zhang JP, Guo JM
and Lin ZM: Overexpression of HOXC11 homeobox gene in clear cell
renal cell carcinoma induces cellular proliferation and is
associated with poor prognosis. Tumour Biol. 36:2821–2829. 2015.
View Article : Google Scholar : PubMed/NCBI
|
|
27
|
Li W, Li K, Zhao L and Zou H:
Bioinformatics analysis reveals disturbance mechanism of MAPK
signaling pathway and cell cycle in Glioblastoma multiforme. Gene.
547:346–350. 2014. View Article : Google Scholar : PubMed/NCBI
|
|
28
|
Verstrepen L and Beyaert R: Receptor
proximal kinases in NF-κB signaling as potential therapeutic
targets in cancer and inflammation. Biochem Pharmacol. 92:519–529.
2014. View Article : Google Scholar : PubMed/NCBI
|
|
29
|
Liu J, Li J, Li H, Li A, Liu B and Han L:
A comprehensive analysis of candidate genes and pathways in
pancreatic cancer. Tumour Biol. 36:1849–1857. 2015. View Article : Google Scholar : PubMed/NCBI
|
|
30
|
Kim HS, Li A, Ahn S, Song H and Zhang W:
Inositol Polyphosphate-5-Phosphatase F (INPP5F) inhibits STAT3
activity and suppresses gliomas tumorigenicity. Sci Rep.
4:73302014. View Article : Google Scholar : PubMed/NCBI
|
|
31
|
Tell RW and Horvath CM: Bioinformatic
analysis reveals a pattern of STAT3-associated gene expression
specific to basal-like breast cancers in human tumors. Proc Natl
Acad Sci USA. 111:12787–12792. 2014. View Article : Google Scholar : PubMed/NCBI
|
|
32
|
Santillán-Benítez JG, Mendieta-Zerón H,
Gómez-Oliván LM, Quiroz Ordóñez A, Torres-Juárez JJ and
González-Bañales JM: JAK2, STAT3 and SOCS3 gene expression in women
with and without breast cancer. Gene. 547:70–76. 2014. View Article : Google Scholar : PubMed/NCBI
|
|
33
|
Gao SM, Chen CQ, Wang LY, Hong LL, Wu JB,
Dong PH and Yu FJ: Histone deacetylases inhibitor sodium butyrate
inhibits JAK2/STAT signaling through upregulation of SOCS1 and
SOCS3 mediated by HDAC8 inhibition in myeloproliferative neoplasms.
Exp Hematol. 41:261–270.e4. 2013. View Article : Google Scholar : PubMed/NCBI
|
|
34
|
Grozovsky R, Begonja AJ, Liu K, Visner G,
Hartwig JH, Falet H and Hoffmeister KM: The Ashwell-Morell receptor
regulates hepatic thrombopoietin production via JAK2-STAT3
signaling. Nat Med. 21:47–54. 2015. View Article : Google Scholar : PubMed/NCBI
|
|
35
|
Jorvig JE and Chakraborty A: Zerumbone
inhibits growth of hormone refractory prostate cancer cells by
inhibiting JAK2/STAT3 pathway and increases paclitaxel sensitivity.
Anticancer Drugs. 26:160–166. 2015. View Article : Google Scholar : PubMed/NCBI
|
|
36
|
Ozoe A, Sone M, Fukushima T, Kataoka N,
Arai T, Chida K, Asano T, Hakuno F and Takahashi S: Insulin
receptor substrate-1 (IRS-1) forms a ribonucleoprotein complex
associated with polysomes. FEBS Lett. 587:2319–2324. 2013.
View Article : Google Scholar : PubMed/NCBI
|
|
37
|
Hu Y, He K, Wang D, Yuan X, Liu Y, Ji H
and Song J: TMEPAI regulates EMT in lung cancer cells by modulating
the ROS and IRS-1 signaling pathways. Carcinogenesis. 34:1764–1772.
2013. View Article : Google Scholar : PubMed/NCBI
|
|
38
|
Li P, Wang L, Liu L, Jiang H, Ma C and Hao
T: Association between IRS-1 Gly972Arg polymorphism and colorectal
cancer risk. Tumour Biol. 35:6581–6585. 2014. View Article : Google Scholar : PubMed/NCBI
|