Introduction
In the United States of America (USA), breast cancer
is the most common malignant tumor type in women, and recurrence is
the primary reason for the high mortality rates that result from
this disease (1,2). A previous study demonstrated that 3–10%
of patients with breast cancer present with metastatic disease at
diagnosis in Europe and the United States (3). According to previously published,
recurrent and metastatic rates of breast cancer are as high as
20–30% in USA (4). Assessment of
tumor burden changes is an important feature used for the clinical
evaluation of cancer therapeutic methods, and predicting the
efficacy of direct individual therapy is a clinical challenge
(5). Response evaluation criteria in
solid tumors (RECIST), which is an anatomical assessment of tumor
burdens using imaging methods including computed tomography (CT)
and magnetic resonance imaging (MRI), has been used to evaluate
therapeutic efficacy; however, its sensitivity and accuracy is
limited (6). Tumor types with
necrosis or fibrosis are difficult to distinguish from one another,
and there is a time lag between tumor shrinking and tumor cell
death as metabolic tissue changes precede morphological changes
(7). Fluorine-18 fludeoxyglucose
positron emission tomography-CT (18F-FDG PET/CT) imaging
may not only provide anatomical information, including tumor size,
but may also reflect biochemical and metabolic changes in the body
at the cellular and molecular level (8). This is important as these biochemical
and metabolic changes occur earlier than anatomical changes
(9). A key question considered by the
RECIST Working Group in developing RECIST is whether it is
appropriate to move from an anatomical unidimensional assessment of
tumor burden to a functional assessment using PET/CT, as it still
requires appropriate clinical validation (10). 18F-FDG PET/CT has been
documented to predict the curative effect of neoadjuvant
chemotherapy in patients with breast cancer, however whether
18F-FDG PET/CT may predict the curative effect of
chemotherapy for patients with recurrent or metastatic breast
cancer is unexplored (11–13). Therefore, the value of
18F-FDG PET/CT for the early prediction of the response
rate and survival for patients with recurrent or metastatic breast
cancer was investigated in the present study.
Materials and methods
Patients
A total of 24 female patients (mean age, 49.54; age
range, 31–73 years) were included in the present study between
January 2009 and December 2014 at Suzhou Kowloon Hospital (Jiangsu,
China) and Renji Hospital (Shanghai, China). Inclusion criteria
included patients with biopsy-proven recurrent or metastatic breast
cancer who were administrated anthracyclines or taxene regimens
(capecitabine/docetaxel, or epirubicin/paclitaxel) as a first-line
treatment. Exclusion criteria were as follows: Patients with
pregnancy or known diabetes; aged younger than 18 years; not able
to undergo serial PET/CT scans; no tumor uptake at baseline, or
ineligibility for first-line chemotherapy with anthracyclines or
taxene regimes. Ethical approval of the Human Clinical and Research
Ethics Committees of Kowloon Hospital was obtained and all the
patients provided written informed consent. Patient data are
presented in Table I.
 | Table I.Clinical characteristics of patients
with breast cancer. |
Table I.
Clinical characteristics of patients
with breast cancer.
| Characteristic | Number of patients
(%) |
|---|
| Number of
patients | 24 (100) |
| Mean age, years
(range) | 49.54 (31–73) |
| Organ
metastasis |
|
| Single
organ metastasis | 10 (41.67) |
|
Multiple organ metastasis | 14 (58.33) |
| Histological
grade |
|
| G2 | 8 (33.33) |
| G3 | 16 (66.67) |
|
Estrogen/progesterone receptor status |
|
|
Positive | 14 (58.33) |
|
Negative | 10 (41.67) |
| Her-2 status |
|
|
Positive | 10 (41.67) |
|
Negative | 14 (58.33) |
| Treatment
condition |
|
|
First-line treatment | 20 (83.33) |
|
Second-line treatment | 4 (16.67) |
Objective remission (OR) patients included those who
acquired complete remission and partial remission following
chemotherapy, and the remaining patients were considered non-OR.
Tumor response was determined clinically and radiographically based
on CT or MRI data using RECIST1.1 criteria for every 2 courses of
treatment (50 mg/m2 D1 epirubicin and 150
mg/m2 D1 paclitaxel i.v., every 21 days; or 1,000
mg/m2 capecitabine bid po d1-14 and 75 mg/m2
doxetaxel d1 i.v., every 21 days) (10).
18F-FDG PET/CT imaging and
image analysis
For PET/CT, a GE Discovery LS PET/CT scanner
(Siemens AG, Munich, Germany) was used, and the half-high width of
the PET horizontal space resolution was 4.8 mm. 18F-FDG
(purity >95%) was provided by Shanghai Kexin Biotech Co., Ltd.
(Shanghai, China).
All patients were imaged prior to and following
chemotherapy, and fasted for 6–8 h prior to imaging. Patients were
administered 18F-FDG (0.15 mCi/kg) through the
contralateral elbow vein of the diseased breast. Patients were
positioned and scanned using 16 row helical CT (160 kV; 100 mA;
slice thickness 5 mm), and PET was conducted in the same range. For
the whole body, 6–8 bed positions were scanned with 3 min per bed
position and 3D data were collected. CT and PET fused images were
reconstructed iteratively using a 3-dimensional row action maximum
likelihood algorithm with a CT-derived attenuation correction, as
previously described (11).
Image analysis
Maximal standard uptake values (SUVmax)
were established by automatically drawing regions of interest using
software (PET Syngo, version 4.1.1; Siemens AG), based on the plane
with the SUVmax cross-section with a threshold of 50%
SUVmax. The PET/CT1 examination was performed within 2
weeks prior to treatment initiation, and the PET/CT2 examination
was performed at the end of the first treatment course. The SUV
calculation was based on the following formula: SUV = C (kBq/g)/[ID
(kBq)/W (g)], where C represents the radioactive concentration of
local tissue, ID represents the injected dose, and W represents
body weight. The change in SUV was calculated using the following
formula: ΔSUVmax = PET/CT1 SUVmax - PET/CT2
SUVmax. The metabolic response was calculated using the
following formula: SUV change rate (ΔSUVmax%) =
[(PET/CT1 SUVmax - PET/CT2 SUVmax)/PET/CT1
SUVmax] ×100%. The SUVmax threshold between the tumor
tissue and normal breast tissue was 2.5. The ΔSUVmax
threshold was 20%. Sensitivity and specificity were 88 and 100%,
respectively. Patients with a ΔSUVmax ≥20% were
considered to be metabolic responding, and patients with a
ΔSUVmax <20% were classed as metabolic
non-responders.
Statistical analysis
The data were analyzed using SPSS 17.0 (SPSS, Inc.,
Chicago, IL, USA). Measurement data were presented as the mean ±
standard deviation analyzed using an unpaired Student's t-test. A
χ2 test was used to analyze the metabolic response. The
survival curve was produced using the Kaplan-Meier method. Cox
regression analysis was used to analyze the association between SUV
change rate and patient overall survival (OS). P<0.05 was
considered to indicate a statistically significant difference.
Results
Comparisons of ΔSUVmax,
ΔSUVmax%, and OS between OR and non-OR groups
Statistical analysis indicated that the difference
in PET/CT1 SUVmax between OR and non-OR groups was not
statistically significant (Fig. 1A;
Table II). Although the PET/CT2
SUVmax of the OR group was lower compared with the
non-OR group following chemotherapy, this difference was not
statistically significant (Fig. 1B;
Table II). The ΔSUVmax
and ΔSUVmax% of the OR group were revealed to be
significantly higher compared with the non-OR group (P<0.001;
Fig. 1C and D; Table II). Survival analysis indicated that
the survival time for the OR group was significantly longer
compared with that of the non-OR group (P<0.001; Fig. 1E; Table
III).
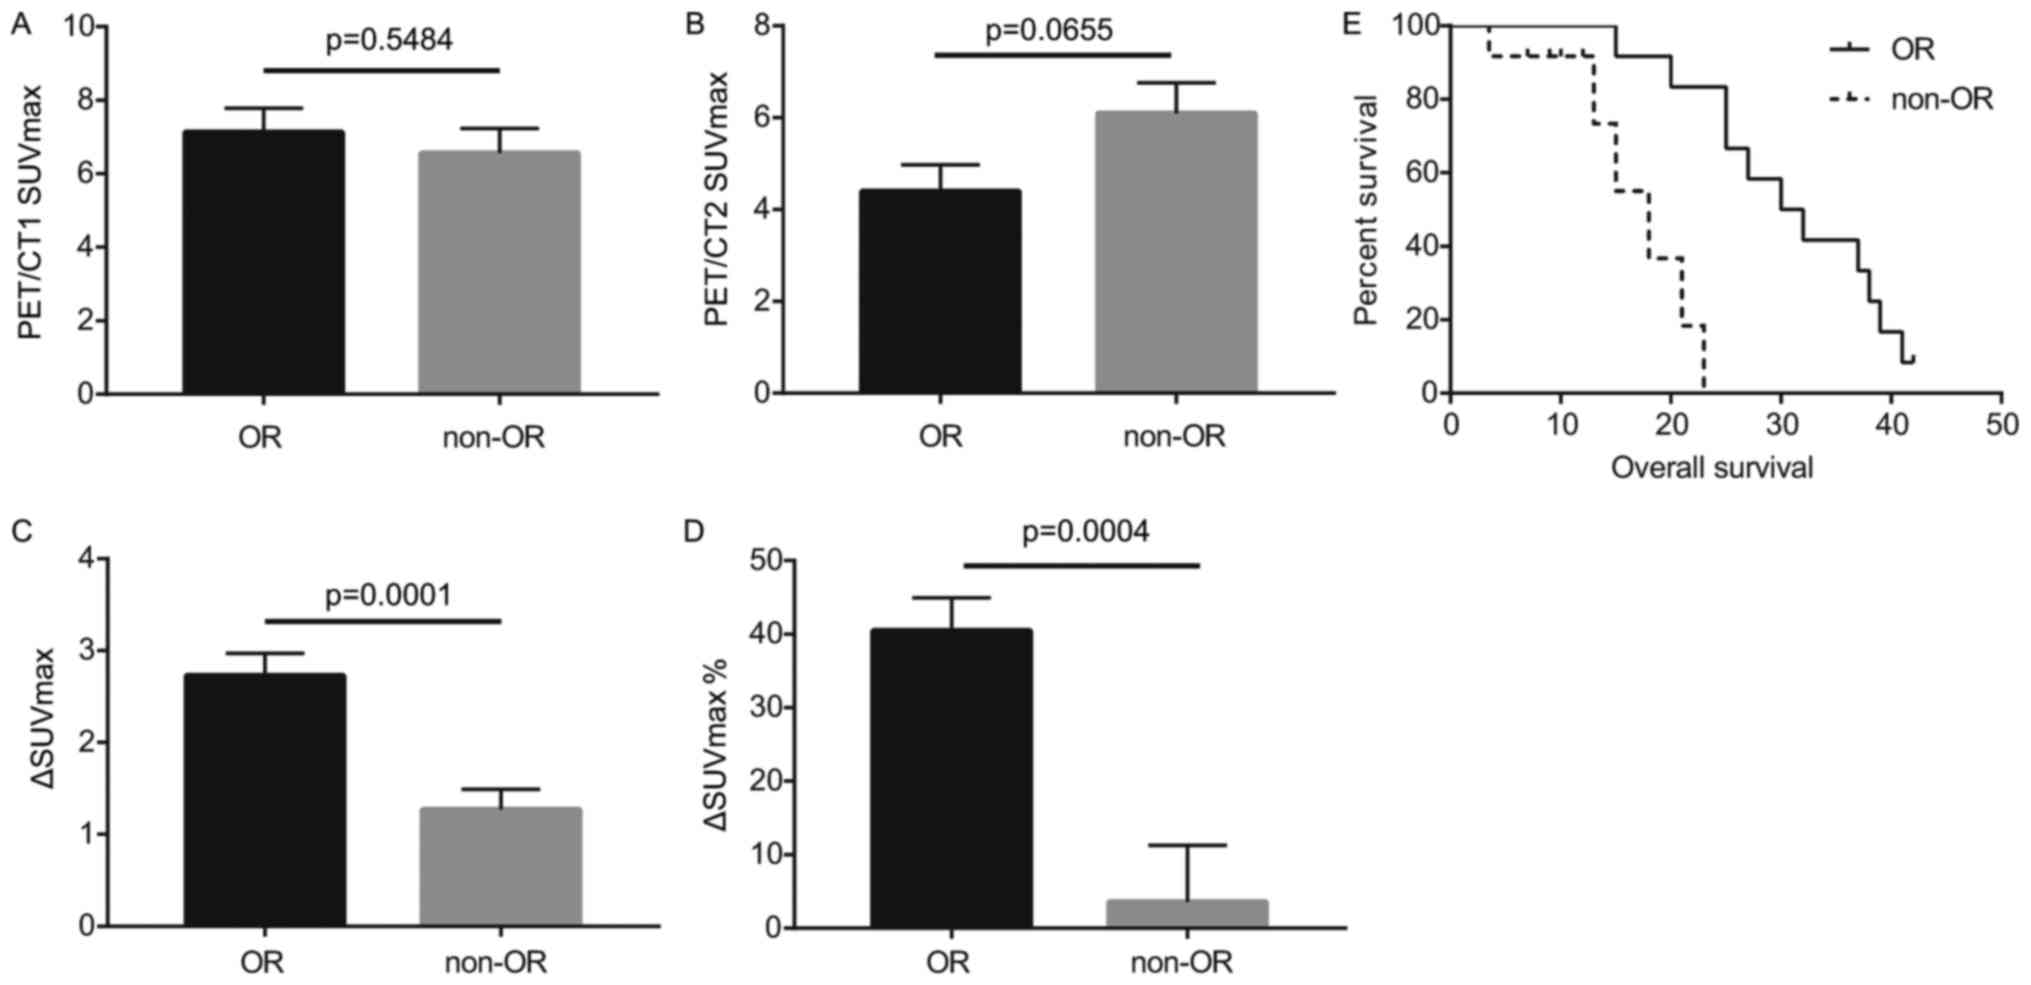 | Figure 1.Comparisons of the PET/CT1
SUVmax, PET/CT2 SUVmax, ΔSUVmax,
ΔSUVmax%, and OS between OR and non-OR groups. (A)
Comparison of PET/CT1 SUVmax between OR and non-OR
groups. (B) Comparison of PET/CT2 SUVmax between OR and
non-OR groups. (C) Comparison of ΔSUVmax between OR and
non-OR groups. (D) Comparison of ΔSUVmax% between OR and
non-OR groups. Comparisons shown by lines. (E) Comparison of OS
between OR and non-OR groups. PET/CT1, positron emission
tomography-computed tomography prior to chemotherapy; PET/CT2,
positron emission tomography-computed tomography following
chemotherapy; SUVmax, maximal standardized uptake value;
ΔSUVmax, change in standardized uptake value; OR,
objective remission; OS, overall survival. |
| Table II.Comparisons of PET/CT1 SUVmax,
PET/CT2 SUVmax, ΔSUVmax and ΔSUVmax% between OR and non-OR
groups. |
Table II.
Comparisons of PET/CT1 SUVmax,
PET/CT2 SUVmax, ΔSUVmax and ΔSUVmax% between OR and non-OR
groups.
| Groups | N | Mean ± standard
deviation | P-value | 95% CI |
|---|
| PET/CT1 SUVmax |
|
| 0.5484 | −1.370–2.510 |
| OR | 12 | 7.128±0.654 |
|
|
|
Non-OR | 12 | 6.558±0.668 |
|
|
| PET/CT2 SUVmax |
|
| 0.0655 | −3.519–0.119 |
| OR | 12 | 4.398±0.581 |
|
|
|
Non-OR | 12 | 6.098±0.657 |
|
|
| ΔSUVmax |
|
| 0.0001 | 1.266–3.274 |
| OR | 12 | 2.730±0.241 |
|
|
|
Non-OR | 12 | 0.460±0.420 |
|
|
| ΔSUVmax% |
|
| 0.0004 | 19.380–55.750 |
| OR | 12 | 41.190±4.318 |
|
|
|
Non-OR | 12 | 3.622±7.633 |
|
|
| Table III.Comparison of the survival between OR
and non-OR groups. |
Table III.
Comparison of the survival between OR
and non-OR groups.
| Groups | N | Survival time
(months) (mean ± standard deviation) | P-value | 95% CI |
|---|
| OR | 12 | 30.917±2.411 | 0.0004 | 26.192–35.642 |
| Non-OR | 12 | 16.792±2.085 |
| 12.704–20.879 |
| Overall | 24 | 26.134±2.382 |
| 21.464–30.803 |
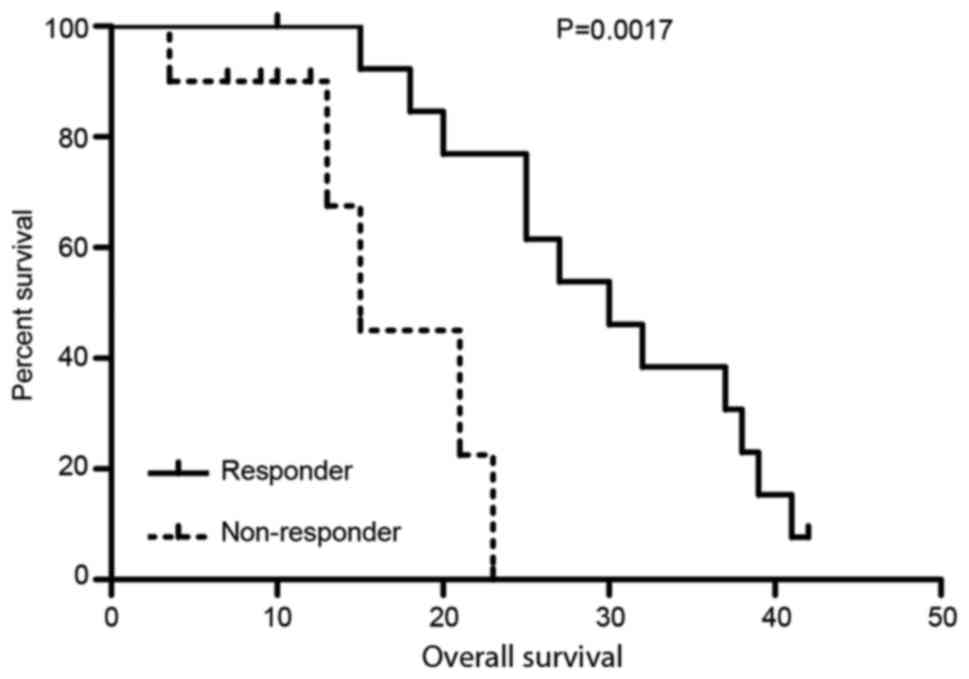
Comparison of OS between metabolic
responders and metabolic non-responders
The ΔSUVmax threshold was 20%. Patients
with a ΔSUVmax of ≥20% were classed as the metabolic
responding group, and patients with a ΔSUVmax of <20%
were classed as the metabolic non-responders group. The OS for the
metabolic responders group was significantly better compared with
the non-responders group (P<0.01; Fig.
2; Table IV).
| Table IV.Comparison of the overall survival
between metabolic responders and non-responders. |
Table IV.
Comparison of the overall survival
between metabolic responders and non-responders.
| Groups | N | Survival time
(months) (mean ± standard deviation) | P-value | 95% CI |
|---|
| Responder | 14 | 29.923±2.421 | 0.0017 | 25.177–34.669 |
| Non-rwesponder | 10 | 16.550±2.582 |
| 11.489–21.611 |
| Overall | 24 | 26.134±2.382 |
| 21.464–30.803 |
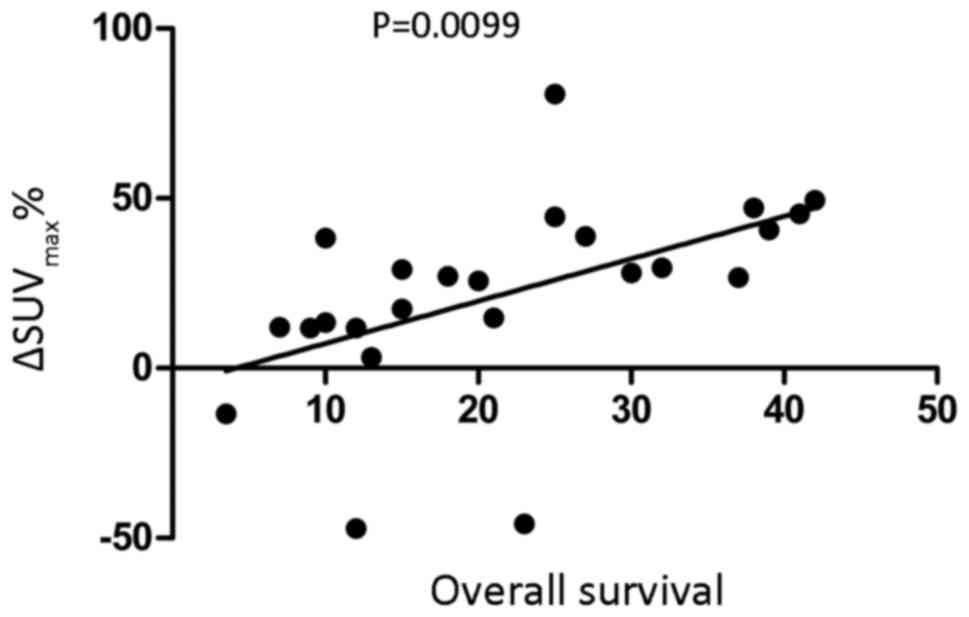
Association between
ΔSUVmax% and patient OS
ΔSUVmax% and OS of patients were revealed
to be significantly positively associated (r2=0.266,
P<0.01; Fig. 3; Table V).
| Table V.Association between SUVmax change
rate and patient overall survival. |
Table V.
Association between SUVmax change
rate and patient overall survival.
| Variable | N | Mean ± standard
deviation | r2 | P-value |
|---|
| SUVmax change rate
(%) | 24 | 22.058±28.319 | 0.266 | 0.0099 |
| Survival time
(months) | 24 | 21.854±11.727 |
|
|
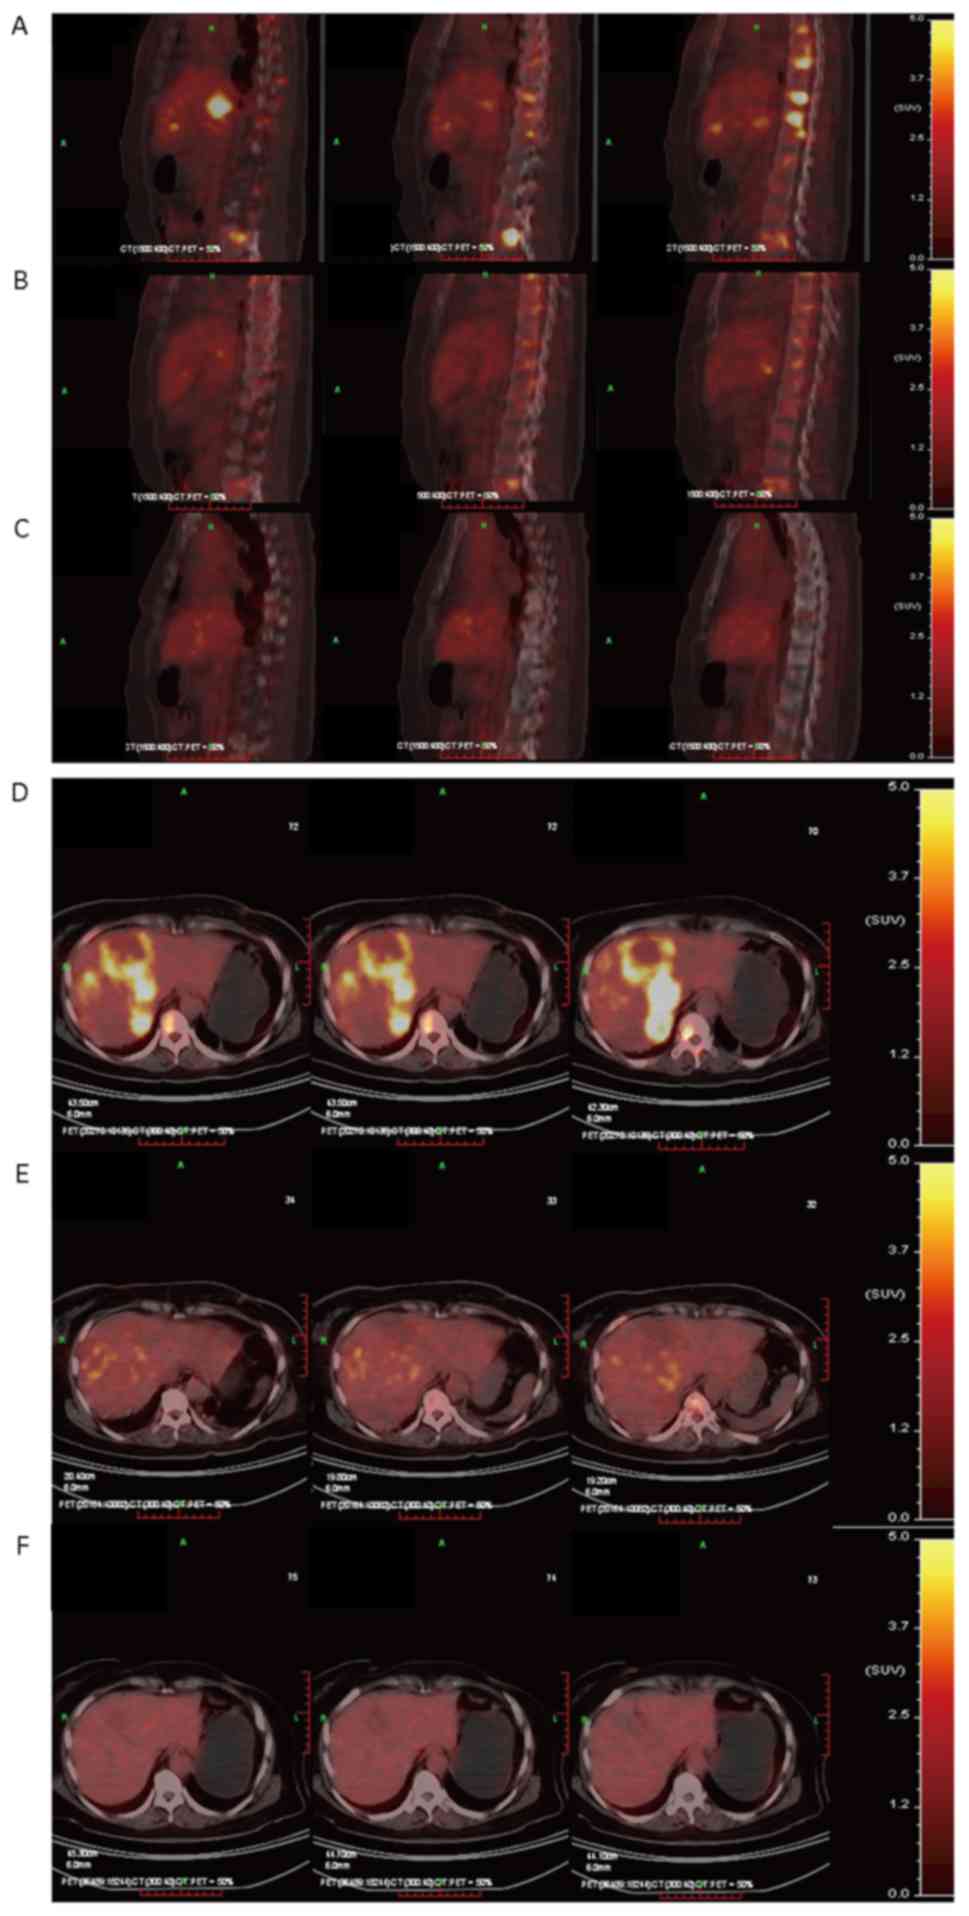
Case study
In March 2009, a 60-year-old female patient who
presented with left breast masses and received a left breast
modified radical operation was admitted to the Suzhou Kowloon
Hospital, Shanghai Jiaotong School of Medicine (Suzhou, China).
Postoperative pathology indicated left breast infiltrating ductal
carcinoma, and metastasis was identified in 3/12 ipsilateral
axillary lymph nodes from the lymphadenectomy procedure.
Immunohistochemistry analysis was performed as described in our
previous study (14). The present
study identified that the patient was estrogen receptor (ER)
negative, progesterone receptor (PR) positive and human epidermal
growth factor receptor (Her)2++. Fluorescence in
situ hybridization (FISH) confirmation for Her-2 and antigen
Ki67 was not performed at this time. The patient was administered
chemotherapy with a 5-fluorouracil, epidoxorubicin and
cyclophosphamide regimen for 6 cycles and tamoxifen as endocrine
therapy for 1.5 years. By March 2011, the patient had whole body
bone pain and presented with redness and swelling, and nodular
changes of the left chest wall. Physical examination confirmed
multiple swollen superficial lymph nodes, an enlarged liver and
multiple areas of bone pain. PET/CT indicated an increased FDG
metabolism on the left side of the chest wall, left supraclavicular
lymph nodes, left axillary lymph nodes, and lesions in the liver
and the vertebra bones. The pathological results of a chest wall
rebiopsy confirmed an infiltrating ductal carcinoma.
Immunohistochemistry revealed that the patient was ER+,
PR−, Her-2++ and FISH confirmation was
performed for Her-2 (15). The
patient was administered chemotherapy with a paclitaxel,
carboplatin and Herceptin® regimen. At the end of the
first cycle, PET/CT confirmed that the SUV of the patient's left
chest wall, bone and liver metastases were significantly lower than
before. In the first and second years following chemotherapy,
PET/CT confirmed a normal SUV (Fig. 4A
and B; Table VI). The patient
remained in long-term follow-up, and was still alive with a stable
disease status at 52 months post-evaluation and her overall
survival was 76 months post-operative.
| Table VI.SUV and ΔSUVmax for fludeoxyglucose F
18 positron emission tomography-computed tomography imaging of
metastases following chemotherapy. |
Table VI.
SUV and ΔSUVmax for fludeoxyglucose F
18 positron emission tomography-computed tomography imaging of
metastases following chemotherapy.
| Metastasis | SUVmax | SUVmax (following
the first cycle chemotherapy) | ΔSUVmax | SUV change rate
(%) | SUVmax (two years
following chemotherapy) |
|---|
| Liver | 8.4 | 4.1 | −51.19 | 51.19 | 2.2 |
| Bone | 7.75 | 3.6 | −53.55 | 53.55 | 2.3 |
Therefore, following one cycle of chemotherapy, the
SUV of the liver and bone metastases was notably decreased, the
ΔSUVmax exceeded 50% and the SUVmax reached
the threshold. Thus, tumor proliferation was inhibited. In the
first year following chemotherapy, tumor proliferation continued to
be strongly inhibited and metastases disappeared.
Discussion
In the past 20 years, 18F-FDG PET/CT had
been increasingly used for cancer imaging, diagnosis, staging,
restaging and treatment monitoring (16). 18F-FDG PET/CT scans may
distinguish tumor necrosis from viable tumor types, so it was
introduced for the sequential monitoring of the tumor response to
treatment for breast cancer in 1993, and responding patients
exhibited a rapid and significant decline in SUV, whereas
non-responding patients did not (7).
Since that report, numerous studies have confirmed that PET is
useful for response assessment for various other tumor types
(17–20). There is interest in using
18F-FDG PET/CT to quickly assess tumor responses to
therapy, and the fact that PET may identify patients that respond
to treatment is attractive for personalized health care (16). A baseline PET scan prior to and
following 1 or 2 cycles of treatment may be used to confirm
effective treatment for that specific tumor and patient (21). Rapid readouts of the effect of
treatment and prompt patient shifting to more suitable therapy
types for that particular patient could save money, time and
preserve the patient's health (12,16).
PET for the identification of patients who will
respond to treatment for breast cancer has been investigated in
several clinical studies. Previous studies reported that PET,
following a single pulse of chemotherapy, may predict complete
pathologic response (sensitivity 90%; specificity 74%) (20,22). A
substudy from the NeoALTTO trial investigated the efficacy of
18F-FDG PET/CT to identify patients with a greater
likelihood of complete response following treatment with
trastuzumab, lapatinib or the two drugs combined, and increased
complete responses were associated with greater SUVmax
reductions (23). In another trial,
PET/CT assessments were used to identify Her-2-positive early
responders to docetaxel plus trastuzumab therapy, and early PET
assessment following two cycles helped identify non-responders to
neoadjuvant therapy (24).
Pathological complete responses were noted in 37 (53.6%, 95% CI
41.2–65.7) of the PET-predicted responders and 6 (24.0%, 95% CI
9.4–45.1) non-responders, so PET may be used to select treatment
responders (24).
In contrast, a study of 98 women with stage II–III
breast cancer indicated that PET/CT scans may not accurately
predict neoadjuvant chemotherapy responses (25). However, a number of studies suggest
that 18F-FDG PET/CT may predict the curative effect of
chemotherapy in patients with recurrent or metastatic breast
cancer. Gennari et al (26)
reported that semi-quantitative FDG-PET scanning of metastatic
breast cancer sites revealed a rapid and significant decrease in
tumor glucose metabolism soon following the first course of
treatment in patients (N=6) responsive to first-line chemotherapy,
but no significant decrease was observed in non-responding patients
(N=3 with stable disease). Retrospective analysis performed with
102 women indicated that decreased SUV following treatment was an
independent predictor of response duration in patients with bone
metastases (27), smaller decreases
in SUV (or increases in SUV) were associated with a shorter time to
progression, and that SUVmax tertiles are valuable as a
prognostic variables (28,29). Another retrospective study with 122
patients with recurrent/metastatic breast cancer confirmed these
results (30). Several studies have
indicated that changes in PET/CT SUV are associated with changes in
tumor volume as determined by bone scans, MRI and/or CT (9,11,31). However, to the best of our knowledge,
no studies to evaluate comparative test performance between
modalities have been performed, and associations between imaging
results and subsequent clinical decisions are unclear. Evidence for
imaging effectiveness in predicting treatment response amongst
patients with metastatic breast cancer with visceral metastasis is
limited, thus more rigorous research is required to confirm the
value of imaging in this patient population. Here,
ΔSUVmax and ΔSUVmax% were significantly
higher in the OR group compared with the non-OR group (P<0.001).
Survival was significantly prolonged in the OR and the metabolic
responders group compared with the respective control groups
(P<0.001 and P<0.01, respectively) and the
ΔSUVmax% was significantly positively associated with
survival time (r2=0.266, P<0.01). To the best of our
knowledge, this is the first prospective study with a large
population to confirm the early prediction of the response and
survival of patients with non-bone metastatic breast cancer.
Qualitative and quantitative approaches to
18F-FDG PET response assessment have been applied and
require a consistent PET methodology (9). The cutoff value used to distinguish
responders from non-responders has been inconsistent between
different studies (16,32,33).
Statistically significant changes in tumor SUV occur in careful
test-retest studies of high-SUV tumor types, with a change of up to
20% in SUVs of a region that is 1 cm or larger in diameter;
however, medically relevant beneficial changes are often associated
with a 30% or greater decline in SUVs (34). The more extensive the therapy, the
greater the decline in SUVs with the most effective treatments
(32). Important components of the
proposed RECIST criteria requiring a 30% decline in SUVs for
‘response’ and criteria to define the progression of tumor-absent
new lesions are uncertain (34). The
optimum cutoff was 20% for the present study, and this value is not
dissimilar from the 2–30% thresholds used by other studies
(35–37).
The optimal method for standardizing PET assessment
for response in breast cancer cases is not certain. Initially,
women with newly diagnosed breast cancer exhibit a rapid and
significant decline in SUVs within 8 d of the start of effective
treatment. These parameters decline with each progressive treatment
in responding patients, antedating changes in tumor size (34). Qualitative visual analysis for six
responding patients revealed a decreased delineation of tumor
masses from background activity soon following the first course of
treatment (26) whereas other
investigators used two, three and six cycles of chemotherapy for
monitoring responses to chemotherapy in metastatic breast cancer
cases or for targeted therapy (23,38–40). This
raises the question on the optimal timing of assessment. The
multi-center design, not compensated by a real standardization
effort, and differences in assessment timing may explain the lower
positive predictive value and the negative predictive value data
recorded in the present study compared with single-center studies
(16,32,33).
Therefore, there is a predictive value in PET/CT
results and for an international consensus for standardizing PET/CT
assessments. The results of the present study revealed that PET
analysis two weeks following one cycle of salvage chemotherapy may
be a viable option in this setting, but these results require
validation with larger, randomized phase 3 trials. These data will
help to design future studies and clarify the usefulness of PET/CT
in treatment decisions and expand the arsenal of response-adaptive
or risk-adaptive treatment approaches.
Acknowledgements
Not applicable.
Funding
The present study was supported by the National
Natural Science Fund (grant nos. 81102015 and 81301858), the
Shanghai Pujiang Program (grant no. 11PJ1406500), the National
Program on Key Basic Research Project (973 Program; grant no.
2013CB967201), the Special Funds for Technological Innovation of
Shanghai Jiaotong University (grant no. YG2012MS46) and Suzhou
Science and Technology Project (grant nos. SYS201404 and
SYS201508).
Availability of data and materials
The datasets generated and analyzed during the
current study are not publicly available due to unpublished data
but are available from the corresponding author on reasonable
request.
Author's contributions
All authors have seen the manuscript and approved
submission. FCZ, HYX, YML and YCX designed the project, collected
and analyzed the data and wrote the manuscript. JJL, YFX, BC, YJY,
NNY and SLS were involved in selecting eligible patients. YML and
YCX supervised the project and checked the manuscript.
Ethics approval and consent to
participate
Ethical approval was obtained from the Human
Clinical and Research Ethics Committees of Kowloon hospital and all
patients signed written informed consent.
Consent for publication
Written informed consent for the publication of the
patient's clinical details was obtained.
Competing interests
The authors declare that they have no competing
interests.
References
|
1
|
Wang D, Lu P, Zhang H, Luo M, Zhang X, Wei
X, Gao J, Zhao Z and Liu C: Oct-4 and Nanog promote the
epithelial-mesenchymal transition of breast cancer stem cells and
are associated with poor prognosis in breast cancer patients.
Oncotarget. 5:10803–10815. 2014.PubMed/NCBI
|
|
2
|
Jemal A, Bray F, Center MM, Ferlay J, Ward
E and Forman D: Global cancer statistics. CA Cancer J Clin.
61:69–90. 2011. View Article : Google Scholar : PubMed/NCBI
|
|
3
|
Suryanarayana Deo SV and Jha D: Role of
Loco-regional surgery in metastatic breast cancer. J Cancer Res
Ther. 9:181–186. 2013. View Article : Google Scholar : PubMed/NCBI
|
|
4
|
Berman AT, Thukral AD, Hwang WT, Solin LJ
and Vapiwala N: Incidence and patterns of distant metastases for
patients with early-stage breast cancer after breast conservation
treatment. Clin Breast Cancer. 13:88–94. 2013. View Article : Google Scholar : PubMed/NCBI
|
|
5
|
Shanbhogue AK, Karnad AB and Prasad SR:
Tumor response evaluation in oncology: Current update. J Comput
Assist Tomogr. 34:479–484. 2010. View Article : Google Scholar : PubMed/NCBI
|
|
6
|
Coloff JL, Macintyre AN, Nichols AG, Liu
T, Gallo CA, Plas DR and Rathmell JC: Akt-dependent glucose
metabolism promotes Mcl-1 synthesis to maintain cell survival and
resistance to Bcl-2 inhibition. Cancer Res. 71:5204–5213. 2011.
View Article : Google Scholar : PubMed/NCBI
|
|
7
|
Wahl RL, Zasadny K, Helvie M, Hutchins GD,
Weber B and Cody R: Metabolic monitoring of breast cancer
chemohormonotherapy using positron emission tomography: Initial
evaluation. J Clin Oncol. 11:2101–2111. 1993. View Article : Google Scholar : PubMed/NCBI
|
|
8
|
Kim SJ and Lee SW: Diagnostic accuracy of
18F-FDG PET/CT for detection of peritoneal carcinomatosis; a
systematic review and meta-analysis. Br J Radiol. 91:201705192018.
View Article : Google Scholar : PubMed/NCBI
|
|
9
|
Fuss M: Strategies of assessing and
quantifying radiation treatment metabolic tumor response using F18
FDG positron emission tomography (PET). Acta Oncol. 49:948–955.
2010. View Article : Google Scholar : PubMed/NCBI
|
|
10
|
Eisenhauer EA, Therasse P, Bogaerts J,
Schwartz LH, Sargent D, Ford R, Dancey J, Arbuck S, Gwyther S,
Mooney M, et al: New response evaluation criteria in solid tumours:
Revised RECIST guideline (version 1.1). Eur J Cancer. 45:228–247.
2009. View Article : Google Scholar : PubMed/NCBI
|
|
11
|
Humbert O, Cochet A, Riedinger JM,
Berriolo-Riedinger A, Arnould L, Coudert B, Desmoulins I, Toubeau
M, Dygai-Cochet I, Guiu S, et al: HER2-positive breast cancer:
18F-FDG PET for early prediction of response to trastuzumab plus
taxane-based neoadjuvant chemotherapy. Eur J Nucl Med Mol Imaging.
41:1525–1533. 2014. View Article : Google Scholar : PubMed/NCBI
|
|
12
|
Couturier O, Jerusalem G, N'Guyen JM and
Hustinx R: Sequential positron emission tomography using
[18F]fluorodeoxyglucose for monitoring response to chemotherapy in
metastatic breast cancer. Clin Cancer Res. 12:6437–6443. 2006.
View Article : Google Scholar : PubMed/NCBI
|
|
13
|
Mortazavi-Jehanno N, Giraudet AL, Champion
L, Lerebours F, Le Stanc E, Edeline V, Madar O, Bellet D, Pecking
AP and Alberini JL: Assessment of response to endocrine therapy
using FDG PET/CT in metastatic breast cancer: A pilot study. Eur J
Nucl Med Mol Imaging. 39:450–460. 2012. View Article : Google Scholar : PubMed/NCBI
|
|
14
|
Xu L, Liang S, Yan N, Zhang L, Gu H, Fei
X, Xu Y and Zhang F: Metastatic gastric cancer from breast
carcinoma: A report of 78 cases. Oncol Lett. 14:4069–4077. 2017.
View Article : Google Scholar : PubMed/NCBI
|
|
15
|
Frithiof H, Aaltonen K and Rydén L: A
FISH-based method for assessment of HER-2 amplification status in
breast cancer circulating tumor cells following CellSearch
isolation. Onco Targets Ther. 9:7095–7103. 2016. View Article : Google Scholar : PubMed/NCBI
|
|
16
|
Rousseau C, Devillers A, Sagan C, Ferrer
L, Bridji B, Campion L, Ricaud M, Bourbouloux E, Doutriaux I,
Clouet M, et al: Monitoring of early response to neoadjuvant
chemotherapy in stage II and III breast cancer by
[18F]fluorodeoxyglucose positron emission tomography. J Clin Oncol.
24:5366–5372. 2006. View Article : Google Scholar : PubMed/NCBI
|
|
17
|
Juweid ME and Cheson BD: Positron-emission
tomography and assessment of cancer therapy. N Engl J Med.
354:496–507. 2006. View Article : Google Scholar : PubMed/NCBI
|
|
18
|
Kidd EA, Siegel BA, Dehdashti F and
Grigsby PW: The standardized uptake value for F-18
fluorodeoxyglucose is a sensitive predictive biomarker for cervical
cancer treatment response and survival. Cancer. 110:1738–1744.
2007. View Article : Google Scholar : PubMed/NCBI
|
|
19
|
Weber WA: Positron emission tomography as
an imaging biomarker. J Clin Oncol. 24:3282–3292. 2006. View Article : Google Scholar : PubMed/NCBI
|
|
20
|
Larson SM and Schwartz LH: 18F-FDG PET as
a candidate for ‘qualified biomarker’: Functional assessment of
treatment response in oncology. J Nucl Med. 47:901–903.
2006.PubMed/NCBI
|
|
21
|
Ege Aktas G, Taştekin E and Sarikaya A:
Assessment of biological and clinical aggressiveness of invasive
ductal breast cancer using baseline 18F-FDG PET/CT-derived
volumetric parameters. Nucl Med Commun. 39:83–93. 2018. View Article : Google Scholar : PubMed/NCBI
|
|
22
|
Smith IC, Welch AE, Hutcheon AW, Miller
ID, Payne S, Chilcott F, Waikar S, Whitaker T, Ah-See AK, Eremin O,
et al: Positron emission tomography using
[(18)F]-fluorodeoxy-D-glucose to predict the pathologic response of
breast cancer to primary chemotherapy. J Clin Oncol. 18:1676–1688.
2000. View Article : Google Scholar : PubMed/NCBI
|
|
23
|
Gebhart G, Gámez C, Holmes E, Robles J,
Garcia C, Cortés M, de Azambuja E, Fauria K, Van Dooren V, Aktan G,
et al: 18F-FDG PET/CT for early prediction of response to
neoadjuvant lapatinib, trastuzumab, and their combination in
HER2-positive breast cancer: Results from Neo-ALTTO. J Nucl Med.
54:1862–1868. 2013. View Article : Google Scholar : PubMed/NCBI
|
|
24
|
Coudert B, Pierga JY, Mouret-Reynier MA,
Kerrou K, Ferrero JM, Petit T, Kerbrat P, Dupré PF, Bachelot T,
Gabelle P, et al: Use of [(18)F]-FDG PET to predict response to
neoadjuvant trastuzumab and docetaxel in patients with
HER2-positive breast cancer, and addition of bevacizumab to
neoadjuvant trastuzumab and docetaxel in [(18)F]-FDG PET-predicted
non-responders (AVATAXHER): An open-label, randomised phase 2
trial. Lancet Oncol. 15:1493–1502. 2014. View Article : Google Scholar : PubMed/NCBI
|
|
25
|
Koolen BB, Pengel KE, Wesseling J, Vogel
WV, Vrancken Peeters MJ, Vincent AD, Gilhuijs KG, Rodenhuis S,
Rutgers EJ and Valdés Olmos RA: FDG PET/CT during neoadjuvant
chemotherapy may predict response in ER-positive/HER2-negative and
triple negative, but not in HER2-positive breast cancer. Breast.
22:691–697. 2013. View Article : Google Scholar : PubMed/NCBI
|
|
26
|
Gennari A, Donati S, Salvadori B,
Giorgetti A, Salvadori PA, Sorace O, Puccini G, Pisani P, Poli M,
Dani D, et al: Role of 2-[18F]-fluorodeoxyglucose (FDG) positron
emission tomography (PET) in the early assessment of response to
chemotherapy in metastatic breast cancer patients. Clin Breast
Cancer. 1:156–163. 2000. View Article : Google Scholar : PubMed/NCBI
|
|
27
|
Tateishi U, Gamez C, Dawood S, Yeung HW,
Cristofanilli M and Macapinlac HA: Bone metastases in patients with
metastatic breast cancer: Morphologic and metabolic monitoring of
response to systemic therapy with integrated PET/CT. Radiology.
247:189–196. 2008. View Article : Google Scholar : PubMed/NCBI
|
|
28
|
Specht JM, Tam SL, Kurland BF, Gralow JR,
Livingston RB, Linden HM, Ellis GK, Schubert EK, Dunnwald LK and
Mankoff DA: Serial 2-[18F] fluoro-2-deoxy-D-glucose positron
emission tomography (FDG-PET) to monitor treatment of bone-dominant
metastatic breast cancer predicts time to progression (TTP). Breast
Cancer Res Treat. 105:87–94. 2007. View Article : Google Scholar : PubMed/NCBI
|
|
29
|
Morris PG, Ulaner GA, Eaton A, Fazio M,
Jhaveri K, Patil S, Evangelista L, Park JY, Serna-Tamayo C, Howard
J, et al: Standardized uptake value by positron emission
tomography/computed tomography as a prognostic variable in
metastatic breast cancer. Cancer. 118:5454–5462. 2012. View Article : Google Scholar : PubMed/NCBI
|
|
30
|
Constantinidou A, Martin A, Sharma B and
Johnston SR: Positron emission tomography/computed tomography in
the management of recurrent/metastatic breast cancer: A large
retrospective study from the Royal Marsden Hospital. Ann Oncol.
22:307–314. 2011. View Article : Google Scholar : PubMed/NCBI
|
|
31
|
Lee CI, Gold LS, Nelson HD, Chou R, Ramsey
SD and Sullivan SD: Comparative effectiveness of imaging modalities
to determine metastatic breast cancer treatment response. Breast.
24:3–11. 2015. View Article : Google Scholar : PubMed/NCBI
|
|
32
|
Pahk K, Rhee S, Cho J, Seo M, Lee S, Park
T, Park S, Lee E, Park KH, Kim C, et al: The role of interim
18F-FDG PET/CT in predicting early response to neoadjuvant
chemotherapy in breast cancer. Anticancer Res. 34:4447–4455.
2014.PubMed/NCBI
|
|
33
|
Schelling M, Avril N, Nährig J, Kuhn W,
Römer W, Sattler D, Werner M, Dose J, Jänicke F, Graeff H and
Schwaiger M: Positron emission tomography using
[(18)F]Fluorodeoxyglucose for monitoring primary chemotherapy in
breast cancer. J Clin Oncol. 18:1689–1695. 2000. View Article : Google Scholar : PubMed/NCBI
|
|
34
|
Wahl RL, Jacene H, Kasamon Y and Lodge MA:
From RECIST to PERCIST: Evolving considerations for PET response
criteria in solid tumors. J Nucl Med. 1 50 Suppl:122S–150S. 2009.
View Article : Google Scholar
|
|
35
|
Kim MK, Ryu JS, Kim SB, Ahn JH, Kim SY,
Park SI, Kim YH, Song HY, Shin JH, Jung HY, et al: Value of
complete metabolic response by (18)F-fluorodeoxyglucose-positron
emission tomography in oesophageal cancer for prediction of
pathologic response and survival after preoperative
chemoradiotherapy. Eur J Cancer. 43:1385–1391. 2007. View Article : Google Scholar : PubMed/NCBI
|
|
36
|
Ott K, Herrmann K, Lordick F, Wieder H,
Weber WA, Becker K, Buck AK, Dobritz M, Fink U, Ulm K, et al: Early
metabolic response evaluation by fluorine-18 fluorodeoxyglucose
positron emission tomography allows in vivo testing of
chemosensitivity in gastric cancer: Long-term results of a
prospective study. Clin Cancer Res. 14:2012–2018. 2008. View Article : Google Scholar : PubMed/NCBI
|
|
37
|
Gayed I, Vu T, Iyer R, Johnson M,
Macapinlac H, Swanston N and Podoloff D: The role of 18F-FDG PET in
staging and early prediction of response to therapy of recurrent
gastrointestinal stromal tumors. J Nucl Med. 45:17–21.
2004.PubMed/NCBI
|
|
38
|
Dose Schwarz J, Bader M, Jenicke L,
Hemminger G, Jänicke F and Avril N: Early prediction of response to
chemotherapy in metastatic breast cancer using sequential 18F-FDG
PET. J Nucl Med. 46:1144–1150. 2005.PubMed/NCBI
|
|
39
|
Couturier O, Jerusalem G, N'Guyen JM and
Hustinx R: Sequential positron emission tomography using
[18F]fluorodeoxyglucose for monitoring response to chemotherapy in
metastatic breast cancer. Clin Cancer Res. 12:6437–6443. 2006.
View Article : Google Scholar : PubMed/NCBI
|
|
40
|
Groheux D, Giacchetti S, Hatt M, Marty M,
Vercellino L, de Roquancourt A, Cuvier C, Coussy F, Espié M and
Hindié E: HER2-overexpressing breast cancer: FDG uptake after two
cycles of chemotherapy predicts the outcome of neoadjuvant
treatment. Br J Cancer. 109:1157–1164. 2013. View Article : Google Scholar : PubMed/NCBI
|