Introduction
Oral squamous cell carcinoma (OSCC) represents the
sixth most common type of cancer worldwide (1). Several biomarkers for OSCC have been
demonstrated previously (2–7) and may be useful for the diagnosis and
prognosis of oral cancer. As carcinogenesis is a multistep process,
a number of genes involved in the diagnosis of oral cancer have not
been identified.
Integrins are a family of transmembrane-type
receptor proteins on the cell surface, composed of heterodimeric
complexes of 1α chain and 1β chain. The 18α and 8β subunits
comprise ~24 different integrin receptors, each of which is capable
of binding to a specific type of cell surface and extracellular
matrix (ECM) protein ligand (8). They
function in specific signal transduction and adhesive interactions
between cells, and between cells and the ECM. Integrin signaling
may modulate several different functions involved in cell motility,
invasion, proliferation and migration (9,10).
Furthermore, integrin signaling may also affect vascular neogenesis
(11). Therefore, integrins serve an
important role in tumor growth and metastasis (12–14).
Integrin subunit α3 (ITGA3), which combines with
integrin subunit β1 (ITGB1) to form integrin α3β1, is the receptor
for ECM molecules including fibronectin, laminin and collagen
(8,12). Integrin α3β1 has been demonstrated to
function in cell proliferation, migration and motility, and in the
maintenance of basement membrane integrity (15–18).
Several previous studies identified that integrin α3β1 was
overexpressed and associated with tumor invasion and metastasis in
the majority of types of cancer, including lung (19) and breast (20) cancer cell lines. Integrin subunit α5
(ITGA5) often combines with ITGB1 to form integrin α5β1, and serves
as a receptor for fibronectin and fibrinogen to participate in cell
differentiation, cell development and wound healing (8,12). It was
identified that the emergence of integrin α5β1 expression is
associated with tumor progression in lung cancer (21). ITGA5 may also promote tumor metastasis
in oral cancer cell lines (22).
Integrin subunit β6 (ITGB6) is the β subunit of integrin αvβ6,
which is a receptor for fibronectin and cytotactin, and regulates
cell invasion, inhibits apoptosis, modulates matrix
metalloproteases and activates transforming growth factor β1
(8,23). Overexpression of integrin αvβ6
promotes epithelial-to-mesenchymal transition and is associated
with cell invasion in oral cancer cell lines (24,25).
However, the majority of these previous studies were focused on
OSCC cell line models or non-quantitative immunohistochemical
analyses of OSCC tissues. These studies did not use
receiver-operating characteristic (ROC) curve analyses, which
provide sensitivity and specificity data for the evaluation of OSCC
biomarker performances.
In the present study, the reverse
transcription-quantitative polymerase chain reaction (RT-qPCR)
analysis was used to determine the mRNA expression levels of
ITGA3, ITGA5, ITGB1 and ITGB6 genes in OSCC tissues
from different tumor locations for ROC curve analyses, in order to
identify suitable biomarker genes for the diagnosis of early-stage
OSCC. The mRNA expression of ITGA3, ITGA5, ITGB1, and
ITGB6 genes were identified as potential OSCC biomarkers.
Furthermore, cumulative ROC analysis of integrin OSCC biomarkers
had an improved diagnostic performance compared with individual ROC
analysis.
Materials and methods
Tissue samples
The present study was approved by the Institutional
Review Board at Kaohsiung Medical University (Kaohsiung, Taiwan)
(approval no. KMUH-IRB-930104), and all patients provided written
informed consent. A total of 55 oral tumors and 55 matched normal
oral control tissues (at least 2.5 cm between tumor and control
tissues) were collected (December 2004 to December 2009) from the
Department of Oral and Maxillofacial Surgery, Kaohsiung Medical
University Hospital. The age range of this patient cohort is 30-90
years and the median age is 50 years. All samples were blindly
examined by at least three pathologists of the Department of
pathology, Kaohsiung Medical University Hospital. All control
tissues underwent pathological diagnosis for confirmation as
non-tumor. All oral tumors underwent pathological diagnosis for
OSCC and tumor stage classification used the Tumor-Node-Metastasis
(TNM) system (26). The
characteristics of the patients with OSCC are summarized in
Table I, this basic patient
information has been described previously (6).
 | Table I.Basic characteristics of patients and
tissue samples. |
Table I.
Basic characteristics of patients and
tissue samples.
|
| (OSCC/matched
control oral tissue) |
|---|
|
|
|
|---|
|
Characteristics | n (total=55) | (%) |
|---|
| Age, years |
|
≤40 | 8 | 14.55 |
|
41-50 | 21 | 38.18 |
|
51-60 | 21 | 38.18 |
|
≥61 | 5 | 9.09 |
| Sex |
|
Male | 50 | 90.91 |
|
Female | 5 | 9.09 |
| TNM stage |
| I | 10 | 18.18 |
| II | 9 | 16.36 |
|
III | 16 | 29.09 |
| IV | 20 | 36.37 |
| Lesion
location |
| Buccal
mucosa/retromolar area | 23 | 41.82 |
|
Tongue/mouth floor | 17 | 30.91 |
|
Edentulous ridge | 8 | 14.55 |
|
Others | 7 | 12.72 |
| Carcinogenic
factors |
|
Alcohol |
|
(+) | 46 | 83.64 |
|
(−) | 9 | 16.36 |
| Betel quid |
|
(+) | 50 | 90.91 |
|
(−) | 5 | 9.09 |
| Cigarette
smoking |
|
(+) | 48 | 87.27 |
|
(−) | 7 | 12.73 |
RT-qPCR
Tissues were sliced and placed into 1.5 ml
microcentrifuge tubes containing TRIzol® reagent (Thermo
Fisher Scientific, Inc., Waltham, MA, USA) for homogenization using
a disposable tissue grinder pestle. Subsequently, the homogenized
mixtures were used for total RNA extraction according to the
manufacturer's protocol. RT was performed using an OmniScript RT
kit (Qiagen GmbH, Hilden, Germany). qPCR was performed using an iQ
SYBR Green Supermix (Bio-Rad Laboratories, Inc., Hercules, CA, USA)
in an iCycler MyiQ real-time machine (Bio-Rad Laboratories, Inc.).
The relative mRNA expressions of ITGA3, ITGA5, ITGB1 and ITGB6
genes in OSCCs and controls were examined. The forward and reverse
primer sequences, and the lengths of PCR products, for these genes
are provided in Table II. The
thermocycling conditions are as follows: 94°C for 1 min; 4 cycles
of 94°C for 15 sec, 64°C for 15 sec and 70°C for 15 sec; 4 cycles
of 94°C for 15 sec, 61°C for 15 sec and 70°C for 15 sec; 4 cycles
of 94°C for 15 sec, 58°C for 15 sec and 70°C for 15 sec; 60 cycles
of 94°C for 15 sec, 55°C for 15 sec and 70°C for 15 sec; and
finally 94°C for 1 min and 60°C for 5 min. The PCR assay was
performed in duplicate. The relative mRNA expression levels
(OSCC/oral tissue from the tumor-free margin ratio) for ITGA3,
ITGA5, ITGB1 and ITGB6 genes were evaluated using the
2−ΔΔCq method (27). The
threshold cycle (Cq) value of each integrin gene was subtracted
from the Cq value for the GAPDH reference housekeeping gene.
Melting curve analyses by qPCR analysis and gel electrophoresis by
1.5% agarose containing 0.5 µg/ml ethidium bromide for
visualization under a UV box were used to validate the PCR products
as described previously (28).
| Table II.Forward and reverse primer sequences
and the lengths of PCR products for ITGA3, ITGA5,
ITGB1, ITGB6, and GAPDH genes. |
Table II.
Forward and reverse primer sequences
and the lengths of PCR products for ITGA3, ITGA5,
ITGB1, ITGB6, and GAPDH genes.
| Gene names | Primer
sequences | Length of PCR
products, bp |
|---|
| ITGA3 | Forward:
5′-TGCTGTGGAAGTGCGGCT-3′ | 206 |
|
| Reverse:
5′-GCGTGGTACTTGGGCATGAT-3′ |
|
| ITGA5 | Forward:
5′-TCATCTACATCCTCTACAAGCTTGG-3′ | 204 |
|
| Reverse:
5′-GCCGTCAGCACCTTCAAGA-3′ |
|
| ITGB1 | Forward:
5′-CGTATTCAGTGAATGGGAACAAC-3′ | 231 |
|
| Reverse:
5′-GATTTTCACCCGTGTCCCAT-3′ |
|
| ITGB6 | Forward:
5′-ACATGAAAGTGGGAGACACAGC-3′ | 215 |
|
| Reverse:
5′-ACACACCCCACACTGGAAAGA-3′ |
|
| GAPDH | Forward:
5′-GCATCCTGGGCTACACTGA-3′ | 162 |
|
| Reverse:
5′-CCACCACCCTGTTGCTGTA-3′ |
|
Statistical analysis
Data were analyzed by the Mann-Whitney test and
Kruskal-Wallis test using SPSS version 17.0 software (SPSS, Inc.,
Chicago, IL, USA). ROC curve analyses were commonly used to
evaluate the performance of cancer diagnosis (29–34).
Accordingly, ROC curves were used to examine the performance of
ITGA3, ITGA5, ITGB1 and ITGB6 genes as predictive biomarkers for
detecting OSCC. Cut-off values for individual ROC curves were
calculated using the 60-ΔCq value, where 60 represents the total
PCR cycle number, and no signal was assigned to the Cq value for
60, as described previously (5,6). For
individual ROC analysis, the area under the ROC curve (AUC) of each
biomarker was used to evaluate its performance as an OSCC
biomarker.
To consider the combined effect of each biomarker,
the cumulative ROC analysis of biomarkers was performed for OSCC
prediction. At first, the critical (cut-off) point of the ROC curve
for each biomarker was identified using JMP version 10 statistic
software (SAS Institute Inc., Cary, NC, USA). Subsequently,
biomarkers that were more relevant to the OSCC (those with values
greater than the cut-off point in AUC of individual ROC results)
were assigned a score of 1 (for example, values greater than the
cut-off point from the AUC analysis of the individual ROC results),
and the remaining biomarkers were assigned a score of 0. The
combined scores for different combinations of biomarkers were
calculated using the formula function in JMP 10. Finally, the
combined scores were used for cumulative ROC analysis of biomarkers
for comparison.
Results
Comparison of clinicopathological
features and relative mRNA expressions of ITGA3, ITGA5, ITGB1 and
ITGB6 genes in patients with OSCC
To evaluate the performance of the OSCC biomarkers,
mRNA expression levels of ITGA3, ITGA5, ITGB1 and ITGB6 genes of
OSCC samples were evaluated by comparing tumor samples with control
samples (oral tissues from the tumor-free margin). In different
locations (Table III), the
differences in ITGA3 and ITGB6 gene expression levels were
significant (P=0.05 and 0.005, respectively by Kruskal-Wallis
test); however, the differences in the ITGA5 and ITGB1 gene
expression levels were non-significant. In contrast, the
differences in mRNA expression levels of ITGA3, ITGA5, ITGB1 and
ITGB6 genes were non-significant at different stages (I–IV)
(P=0.19, 0.58, 0.92, and 0.53, respectively by Kruskal-Wallis test)
and for the T parameter (1–4) of the TNM staging system (a measure of
tumor diameter/dimension) among patients with OSCC (P=0.36, 0.97,
0.75, and 0.83, respectively by Kruskal-Wallis test).
| Table III.Comparison of clinicopathological
features and relative mRNA expression levels of ITGA3, ITGA5,
ITGB1 and ITGB6 genes in oral squamous cell carcinoma
tumor samples with control samples (oral tissue from the tumor-free
margin). |
Table III.
Comparison of clinicopathological
features and relative mRNA expression levels of ITGA3, ITGA5,
ITGB1 and ITGB6 genes in oral squamous cell carcinoma
tumor samples with control samples (oral tissue from the tumor-free
margin).
|
|
| ITGA3 | ITGA5 | ITGB1 | ITGB6 |
|---|
|
|
|
|
|
|
|
|---|
| Clinical data | n (total=55) | Mean ± SD |
P-valuea | Mean ± SD |
P-valuea | Mean ± SD |
P-valuea | Mean ± SD |
P-valuea |
|---|
|
Locationb |
|
| 0.01 |
| 0.33 |
| 0.16 |
| 0.05 |
| 1 | 23 | 1.95±5.37 |
| 1.29±4.87 |
| 2.58±11.30 |
| 0.71±6.19 |
|
| 2 | 17 | 4.32±4.74 |
| 4.04±4.99 |
| 2.41±3.23 |
| 0.91±11.08 |
|
| 3 | 8 | 6.25±5.20 |
| 1.82±8.40 |
| 2.94±3.03 |
| 5.07±5.30 |
|
| 4 | 7 | −6.87±14.91 |
| −1.74±12.27 |
| 2.15±3.58 |
| 2.66±5.95 |
|
| TNM |
|
| 0.19 |
| 0.58 |
| 0.92 |
| 0.53 |
| T1 | 14 | 1.52±12.93 |
| 2.88±5.64 |
| 1.20±4.29 |
| −2.12±13.83 |
|
| T2 | 21 | 1.04±4.84 |
| 0.65±7.58 |
| 1.29±3.66 |
| 1.67±4.95 |
|
| T3 and T4 | 20 | 3.86±5.48 |
| 2.34±6.82 |
| 4.74±11.37 |
| 2.66±3.69 |
|
| Stage |
|
| 0.36 |
| 0.97 |
| 0.75 |
| 0.83 |
| I | 10 | 8.26±15.43 |
| 2.53±5.56 |
| 0.87±5.03 |
| 0.16±9.95 |
|
| II | 9 | 0.30±5.13 |
| 2.10±4.09 |
| 0.83±4.47 |
| 0.83±5.86 |
|
| III and IV | 36 | 3.03±4.99 |
| 1.57±7.07 |
| 3.41±8.70 |
| 1.37±8.02 |
|
Comparison of patient habits and
relative mRNA expression of ITGA3, ITGA5, ITGB1, and ITGB6 genes in
patients with OSCC
As indicated in Table
IV, the differences in mRNA expression levels of ITGA3, ITGA5,
ITGB1 and ITGB6 genes were not associated with cancer-causing
habits, including alcohol consumption (P=0.83, 0.11, 0.68, and
0.18, respectively), betel nut chewing (P=0.65, 0.55, 0.81, and
0.75, respectively) and cigarette smoking (P=0.84, 0.45, 0.86, and
0.40, respectively by Mann-Whitney test).
| Table IV.Comparison of patient habits and
relative mRNA expression levels of ITGA3, ITGA5,
ITGB1 and ITGB6 genes in oral squamous cell carcinoma
samples with control samples (oral tissue from the tumor-free
margin). |
Table IV.
Comparison of patient habits and
relative mRNA expression levels of ITGA3, ITGA5,
ITGB1 and ITGB6 genes in oral squamous cell carcinoma
samples with control samples (oral tissue from the tumor-free
margin).
|
|
| ITGA3 | ITGA5 | ITGB1 | ITGB6 |
|---|
|
|
|
|
|
|
|
|---|
| Habits | n (total=55) | Mean ± SD |
P-valuea | Mean ± SD |
P-valuea | Mean ± SD |
P-valuea | Mean ± SD |
P-valuea |
|---|
| Alcohol |
|
| 0.83 |
| 0.11 |
| 0.68 |
| 0.18 |
| No | 9 | 3.02±3.60 |
| 4.66±3.38 |
| 1.91±2.26 |
| 4.53±5.73 |
|
| Yes | 46 | 2.02±8.42 |
| 1.27±7.18 |
| 2.65±8.27 |
| 0.39±8.22 |
|
| Betel quid
chewing |
|
| 0.65 |
| 0.33 |
| 0.81 |
| 0.75 |
| No | 5 | 3.59±5.84 |
| 4.25±5.21 |
| 0.73±3.33 |
| 3.74±7.03 |
|
| Yes | 50 | 2.05±8.02 |
| 1.59±6.93 |
| 2.70±7.90 |
| 0.80±8.08 |
|
| Cigarette
smoking |
|
| 0.84 |
| 0.45 |
| 0.86 |
| 0.40 |
| No | 5 | 3.51±4.90 |
| 3.53±6.61 |
| 1.13±2.31 |
| 4.56±6.98 |
|
| Yes | 50 | 2.05±8.07 |
| 1.66±6.86 |
| 2.66±7.94 |
| 0.71±8.05 |
|
AUC performances of individual OSCC
biomarkers of ITGA3, ITGA5, ITGB1, and ITGB6 genes
To test the predictive performance of each of the
test biomarkers in OSCC diagnosis, individual ROC curves for ITGA3,
ITGA5, ITGB1 and ITGB6 mRNA expression were constructed by
comparing the mRNA expression level between OSCC tumor tissues and
their controls (oral tissue from the tumor-free margin). The
individual AUCs of the relative mRNA expression for ITGA3, ITGA5,
ITGB1 and ITGB6 genes were 0.724 [95% confidence interval (CI),
0.630-0.819], 0.698 (95% CI, 0.600-0.796), 0.640 (95% CI,
0.536-0.743) and 0.657 (95% CI, 0.555-0.759), respectively
(Fig. 1A). At a specificity of 50.91%
for all locations (Table V, part A),
sensitivities of relative mRNA expression for ITGA3, ITGA5, ITGB1
and ITGB6 were 90.91, 83.64, 70.91 and 74.55%, respectively. At a
specificity of 61.82%, sensitivities of relative mRNA expression
for ITGA3 and ITGA5 genes were decreased slightly to 85.45 and
78.18%, respectively. However, ITGB1 and ITGB6 genes were decreased
to 50.91 and 61.82%, respectively. At a specificity of 67.27%,
sensitivities of relative mRNA expression for ITGA3, ITGA5, ITGB1
and ITGB6 genes were markedly decreased, particularly for the ITGB1
gene (45.45%). Therefore, analysis of different sensitivities
suggested that the ITGA3 and ITGA5 genes exhibited an improved
specificity performance compared with ITGB1 and ITGB6 genes for all
locations.
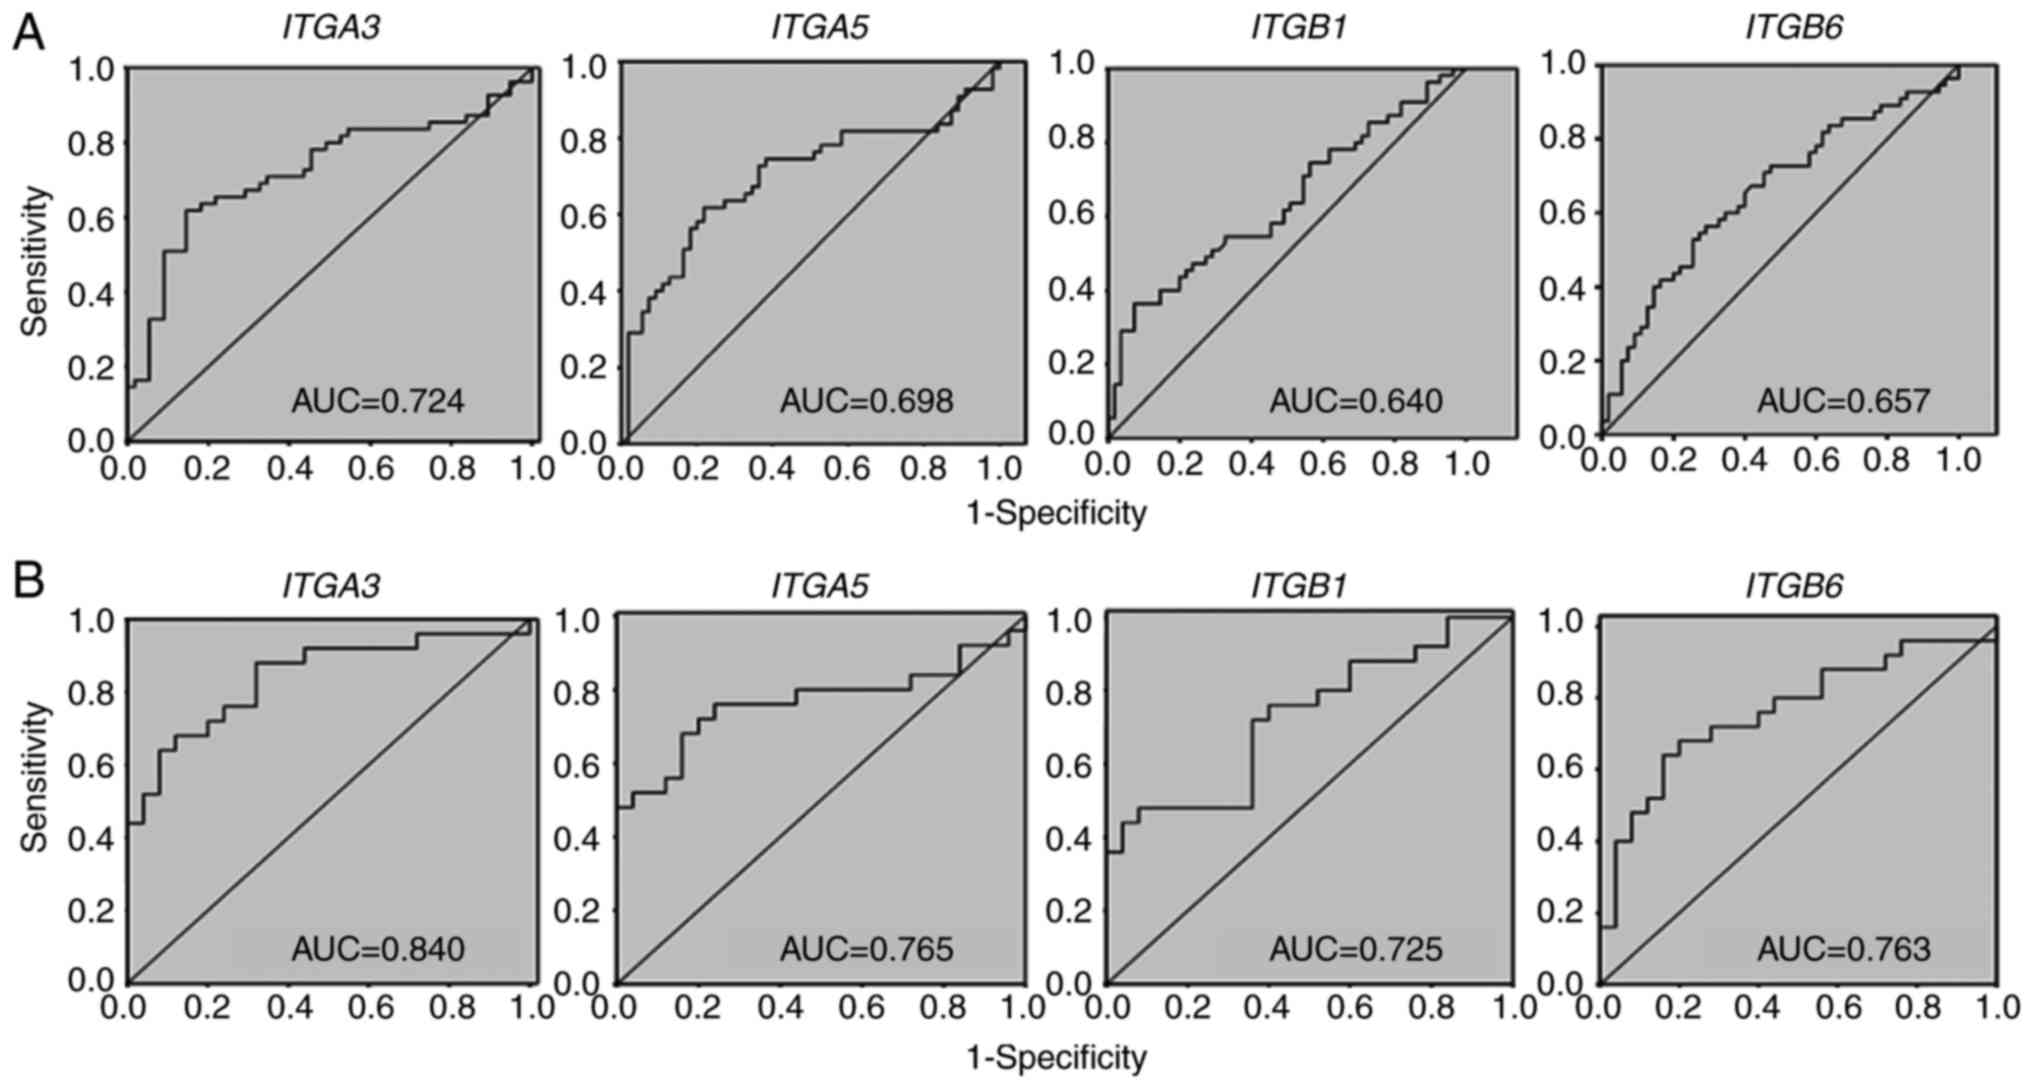 | Figure 1.AUC values of ITGA3, ITGA5,
ITGB1 and ITGB6 genes as individual oral squamous cell
carcinoma biomarkers. (A) All tumor locations (locations 1-4). (B)
Only tumor locations 2/3. Location 1, buccal mucosa/retromolar
area; location 2, tongue/mouth floor; location 3, edentulous ridge;
location 4, others (lower lip/vestibule/soft palate); ITGA3,
integrin subunit α3; ITGA5, integrin subunit α5; ITGB1, integrin
subunit β1; ITGB6, integrin subunit β6; AUC, area under the
curve. |
| Table V.Different cut-offs and their relative
sensitivity and specificity for ITGA3, ITGA5,
ITGB1 and ITGB6 genes in patients with oral squamous
cell carcinoma. |
Table V.
Different cut-offs and their relative
sensitivity and specificity for ITGA3, ITGA5,
ITGB1 and ITGB6 genes in patients with oral squamous
cell carcinoma.
| A, All
locations |
|
| ITGA3 | ITGA5 | ITGB1 | ITGB6 |
|---|
|
|
|
|
|
|
|---|
| Sensitivity, % | Specificity, % | Cut-off | Specificity, % | Cut-off | Specificity, % | Cut-off | Specificity, % | Cut-off |
|---|
| 50.91 | 90.91 | 63.20 | 83.64 | 56.26 | 70.91 | 61.93 | 74.55 | 57.90 |
| 61.82 | 85.45 | 62.87 | 78.18 | 55.00 | 50.91 | 61.17 | 61.82 | 57.21 |
| 67.27 | 67.27 | 61.94 | 63.64 | 54.35 | 45.45 | 60.96 | 58.18 | 57.06 |
|
| B, Locations
2/3 |
|
|
|
ITGA3 |
ITGA5 |
ITGB1 |
ITGB6 |
|
|
|
|
|
|
| Sensitivity,
% | Specificity,
% | Cut-off | Specificity,
% | Cut-off | Specificity,
% | Cut-off | Specificity,
% | Cut-off |
|
| 64.00 | 92.00 | 62.97 | 84.00 | 55.00 | 64.00 | 61.07 | 84.00 | 57.90 |
| 68.00 | 88.00 | 62.67 | 84.00 | 55.00 | 64.00 | 60.99 | 80.00 | 57.65 |
| 76.00 | 76.00 | 61.73 | 76.00 | 53.94 | 60.00 | 60.78 | 60.00 | 56.61 |
As the differences in ITGA3 and ITGB6
gene expression by location were significant (Table III), whether the different locations
of OSCC may affect the mRNA expression levels of these four
integrin genes was additionally investigated. In the example of
locations 2 and 3 combined (locations 2/3), i.e., the tongue/mouth
floor and edentulous ridge (Fig. 1B),
it was demonstrated that the AUC values of relative mRNA expression
for ITGA3, ITGA5, ITGB1 and ITGB6 genes in the
tongue/mouth floor and edentulous ridge were 0.840 (95% CI,
0.728-0.952), 0.765 (95% CI, 0.632-0.898), 0.725 (95% CI,
0.584-0.866) and 0.762 (95% CI, 0.630-0.896), respectively.
Notably, the AUC values of locations 2/3 combined (Fig. 1B) for these four integrin genes were
increased compared with those of all locations together (Fig. 1A). Analysis of different sensitivities
suggested that ITGA3 and ITGA5 genes exhibited an
improved specificity performance compared with that of ITGB1
and ITGB6 genes for locations 2/3 (Table V, part B).
AUC performances of cumulative ROC
analyses for different combinations of ITGA3, ITGA5, ITGB1, and
ITGB6 biomarkers
To evaluate the diagnostic power of different
combinations of these biomarkers, their cumulative ROC curves
between OSCC and controls (oral tissue from the tumor-free margin)
were calculated. The AUC values for different combinations (two,
three and four) of the biomarkers are summarized in Table VI. The combination of ITGA3, ITGA5
and ITGB1 genes demonstrated the highest AUC values of 0.809 (CI,
0.728-0.890) and 0.871 (CI, 0.770-0.972), for the two types of
locations (all locations and locations 2/3, respectively). The
combination of ITGA3, ITGA5, ITGB1 and ITGB6 genes provided similar
AUC values for the two locations.
| Table VI.Performances of cumulative ROC
analyses for different combinations of ITGA3, ITGA5,
ITGB1 and ITGB6 biomarkers in patients with OSCC. |
Table VI.
Performances of cumulative ROC
analyses for different combinations of ITGA3, ITGA5,
ITGB1 and ITGB6 biomarkers in patients with OSCC.
|
| AUC of combined
biomarkers for OSCCa |
|---|
|
| AUC of combined
biomarkers for OSCCa |
|---|
| Locations |
ITGA3/ITGA5 |
ITGA3/ITGB1 |
ITGA3/ITGB6 |
ITGA5/ITGB1 |
ITGA5/ITGB6 |
ITGB1/ITGB6 |
ITGA3/ITGA5/ITGB1 |
ITGA3/ITGA5/ITGB6 |
ITGA5/ITGB1/ITGB6 |
ITGA3/ITGA5/ITGB1/ITGB6 |
|---|
| Allb | 0.777 | 0.775 | 0.758 | 0.762 | 0.720 | 0.686 | 0.809c | 0.780 | 0.750 | 0.797 |
| 2/3 | 0.847 | 0.829 | 0.850 | 0.823 | 0.792 | 0.788 | 0.871c | 0.855 | 0.825 | 0.870 |
Discussion
The overexpression of ITGA3, ITGA5, ITGB1 and
ITGB6 genes has been demonstrated in several types of cancer
(19–25); however, the suitability for ITGA3,
ITGA5, ITGB1 and ITGB6 genes as OSCC biomarkers has
rarely been considered.
The results of the present study identified that
ITGA3 and ITGB1 mRNA were overexpressed in patients
with OSCC. Similarly, it was demonstrated previously that ITGA3 and
ITGB1 proteins were overexpressed in prostate tumor tissues, and
knockdown of ITGA3 and ITGB1 genes by small
interfering RNAs inhibited cell migration and invasion in prostate
cancer cells (35). In the present
study, ITGA5 mRNA was overexpressed in patients with OSCC.
Similarly, ITGA5 and ITGB1 genes have been suggested
to be potential biomarkers for non-small cell lung cancer (36). In addition, the ITGB6 gene may
be a prognostic biomarker for invasive breast cancer (37). However, to the best of our knowledge,
these integrin biomarkers have rarely been investigated in
OSCC.
In the present study, individual ROC analyses for
all locations identified ITGA3 and ITGA5 genes as
good biomarkers for OSCC (AUC=0.724 and 0.698, respectively), but
ITGB1 and ITGB6 genes performed poorly for OSCC
prediction (AUC <0.66). Compared with all locations, improved
AUC values for ITGA3, ITGA5, ITGB1 and ITGB6 genes
were observed in combined locations 2 and 3 (the tongue/mouth part
and edentulous ridge).
Previous studies have indicated that a combination
of several variants generally provides an improved diagnostic power
for ROC analysis compared with ROC analysis of individual markers
(38–41). A combination of several biomarkers may
therefore improve the diagnostic results for tumors, as has been
demonstrated in thyroid cancer (42).
Similarly, with the exception of the combination of ITGB1
and ITGB6 (AUC=0.686), the present study identified that the
majority of the biomarker combinations, including a combination of
two (ITGA3/ITGA5, ITGA3/ITGB1, ITGA3/ITGB6,
ITGA5/ITGB1 and ITGA5/ITGB6), three
(ITGA3/ITGA5/ITGB1,
ITGA3/ITGA5/ITGB6 and
ITGA5/IGB1/ITGB6) and four
(ITGA3/ITGA5/ITGB1/ITGB6) genes,
exhibited improved AUC values for all locations (ranging between
0.750 and 0.809) compared with the individual AUC values of
individual integrin genes (ranging between 0.640 and 0.724). With
the exception of the combinations of ITGA3/ITGB1,
ITGA5/ITGB1, ITGA5/ITGB6, ITGB1/ITGB6 and
ITGA5/ITGB1/ITGB6 genes (AUC values ranging
between 0.788 and 0.829), it was identified that other combined
biomarkers, including two, three and four genes, demonstrated
improved AUC values for locations 2 and 3 (ranging between 0.847
and 0.871) compared with that of the individual AUC values of these
integrin genes (ranging between 0.725 and 0.840). Among them,
ITGA3, ITGA5 and ITGB1 genes exhibited the highest
AUC values for all locations and locations 2 and 3 combined.
Therefore, the cumulative ROC analysis, as a method of sensitive
and specific evaluation, suggested a combination of multiple
biomarkers for the diagnosis of OSCC.
mRNA has been repeatedly demonstrated to be a
reliable material for the diagnosis of oral cancer (5,6,43,44). For
example, tissue and salivary mRNA biomarkers are suggested to be
associated with clinicopathological parameters for the diagnosis of
OSCC (44). In clinical practice, the
data from the present study of combined integrin biomarkers may be
applied for non-invasive diagnosis of OSCC using saliva material
for OSCC in the future.
An advantage of the proposed methods of the present
study is a potential improvement of the AUC performance by using
accumulative ROC analysis for the mRNA expression of a combination
of integrin biomarkers. A disadvantage of this method is that it is
based on tissue samples for mRNA evaluation, which are susceptible
to degradation by RNase contamination (45). Additionally, expression at mRNA
transcriptome levels will not always be consistent with those at
protein levels in cases of posttranslational modification (46). Additionally, the present study did not
provide information concerning depth of invasion, which is
important for clinicians. Additional protein evaluation for ITGA3,
ITGA5, ITGB1 and ITGB6 using immunohistochemistry is warranted. In
addition, 5/55 the patients included in the present study were
female, which may provide a gender bias for these biomarker
predictions for oral cancer. Therefore, it is suggested that a
larger cohort of female and male patients should be studied in the
future to provide an unbiased prediction using these integrins. In
the present study, the association between integrin expression and
prognosis, was not analyzed which would have been beneficial to
improve the reliability of the proposed integrin mRNA biomarker
combination for oral cancer prediction.
Alcohol drinking, betel quid chewing and cigarette
smoking are well-known risk factors for oral cancer (47), although non-smoking and betel quid
non-chewing individuals may also suffer from oral cancer (48). It is possible that these habits may
affect the initiation and progression of oral carcinogenesis, but
do not directly affect the overexpression of certain genes in
patients with OSCC. For example, no significant differences in the
expression levels of the ITGA3, ITGA5, ITGB1 and
ITGB6 biomarkers were observed between the OSCC and control
tissues for each of these variables.
In conclusion, individual ROC analysis provides a
sensitive and specific evaluation of biomarkers for OSCC diagnosis
and prognosis. The results of the present study demonstrated that
ITGA3 and ITGA5 genes were improved prognostic OSCC
biomarkers for all locations compared with ITGB1 and
ITGB6 genes, based on individual ROC analysis. However,
ITGA3, ITGA5, ITGB1 and ITGB6 genes became more
promising OSCC biomarkers when considering specific tumor locations
(2 and 3; tongue/mouth part and edentulous ridge, respectively).
Additionally, the cumulative ROC analyses indicated that the
combination of ITGA3, ITGA5 and ITGB1 genes exhibited
the highest AUC values for locations 2/3 and all locations.
Therefore, ITGA3, ITGA5, ITGB1 and ITGB6 genes are
suggested to be good OSCC biomarkers, and cumulative ROC analysis
is hypothesized to provide an improved strategy for cancer
biomarker identification.
Acknowledgements
The authors would like to thank Dr Hans-Uwe Dahms;
Department of Biomedical Science and Environmental Biology,
Kaohsiung Medical University, (Kaohsiung, Taiwan) for English
editing.
Funding
The present study was partly supported by funds of
the Ministry of Science and Technology, Taiwan (grant no. MOST
104-2320-B-037-013-MY3), the Health and Welfare Surcharge of
Tobacco Products, the Ministry of Health and Welfare, Taiwan,
Republic of China (grant no. MOHW107-TDU-B-212-114016), ChiMei-KMU
Joint Project (grant no. 106CM-KMU-05) and the National Sun Yat-sen
University-KMU Joint Research Project (grant no. NSYSU-KMU
107-p001).
Availability of data and materials
The datasets used and/or analyzed in the current
study are available from the corresponding author on reasonable
request.
Authors' contributions
HWC and CYY contributed significantly in writing the
manuscript and data discussion/interpretation. CHC, JHT, and YHK
collected the samples and analyzed pathological diagnosis of OSCC.
HWC instructed JHT and YTC to extract RNA for qPCR analysis. JYT,
YYW, and SSY assisted in clinical data collection and performed
statistical analysis. SYL was responsible for study conception and
overview. All authors read and approved the final manuscript.
Ethics approval and consent to
participate
The present study was approved by the Institutional
Review Board at Kaohsiung Medical University (Kaohsiung, Taiwan)
(KMUH-IRB-930104), and patients provided written informed
consent.
Patient consent for publication
Patient provided written informed consent for the
publication of associated data.
Competing interests
The authors declare that they have no competing
interests.
References
|
1
|
Shah JP and Gil Z: Current concepts in
management of oral cancer-surgery. Oral Oncol. 45:394–401. 2009.
View Article : Google Scholar : PubMed/NCBI
|
|
2
|
Dumache R, Rogobete AF, Andreescu N and
Puiu M: Genetic and epigenetic biomarkers of molecular alterations
in oral carcinogenesis. Clin Lab. 61:1373–1381. 2015. View Article : Google Scholar : PubMed/NCBI
|
|
3
|
Nagata M, Noman AA, Suzuki K, Kurita H,
Ohnishi M, Ohyama T, Kitamura N, Kobayashi T, Uematsu K, Takahashi
K, et al: ITGA3 and ITGB4 expression biomarkers estimate the risks
of locoregional and hematogenous dissemination of oral squamous
cell carcinoma. BMC Cancer. 13:4102013. View Article : Google Scholar : PubMed/NCBI
|
|
4
|
Elashoff D, Zhou H, Reiss J, Wang J, Xiao
H, Henson B, Hu S, Arellano M, Sinha U, Le A, et al: Prevalidation
of salivary biomarkers for oral cancer detection. Cancer Epidemiol
Biomarkers Prev. 21:664–672. 2012. View Article : Google Scholar : PubMed/NCBI
|
|
5
|
Yen CY, Chen CH, Chang CH, Tseng HF, Liu
SY, Chuang LY, Wen CH and Chang HW: Matrix metalloproteinases (MMP)
1 and MMP10 but not MMP12 are potential oral cancer markers.
Biomarkers. 14:244–249. 2009. View Article : Google Scholar : PubMed/NCBI
|
|
6
|
Yen CY, Huang CY, Hou MF, Yang YH, Chang
CH, Huang HW, Chen CH and Chang HW: Evaluating the performance of
fibronectin 1 (FN1), integrin α4β1 (ITGA4), syndecan-2 (SDC2) and
glycoprotein CD44 as the potential biomarkers of oral squamous cell
carcinoma (OSCC). Biomarkers. 18:63–72. 2013. View Article : Google Scholar : PubMed/NCBI
|
|
7
|
Wang S, Sun M, Gu C, Wang X, Chen D, Zhao
E, Jiao X and Zheng J: Expression of CD163, interleukin-10, and
interferon-gamma in oral squamous cell carcinoma: Mutual
relationships and prognostic implications. Eur J Oral Sci.
122:202–209. 2014. View Article : Google Scholar : PubMed/NCBI
|
|
8
|
Barczyk M, Carracedo S and Gullberg D:
Integrins. Cell Tissue Res. 339:269–280. 2010. View Article : Google Scholar : PubMed/NCBI
|
|
9
|
Hood JD and Cheresh DA: Role of integrins
in cell invasion and migration. Nat Rev Cancer. 2:91–100. 2002.
View Article : Google Scholar : PubMed/NCBI
|
|
10
|
Desgrosellier JS and Cheresh DA: Integrins
in cancer: Biological implications and therapeutic opportunities.
Nat Rev Cancer. 10:9–22. 2010. View
Article : Google Scholar : PubMed/NCBI
|
|
11
|
Malinin NL, Pluskota E and Byzova TV:
Integrin signaling in vascular function. Curr Opin Hematol.
19:206–211. 2012. View Article : Google Scholar : PubMed/NCBI
|
|
12
|
Mizejewski GJ: Role of integrins in
cancer: Survey of expression patterns. Proc Soc Exp Biol Med.
222:124–138. 1999. View Article : Google Scholar : PubMed/NCBI
|
|
13
|
Hwang R and Varner J: The role of
integrins in tumor angiogenesis. Hematol Oncol Clin North Am.
18:991–1006, vii. 2004. View Article : Google Scholar : PubMed/NCBI
|
|
14
|
Hynes RO: Integrins: Versatility,
modulation, and signaling in cell adhesion. Cell. 69:11–25. 1992.
View Article : Google Scholar : PubMed/NCBI
|
|
15
|
Yamaguchi M, Ebihara N, Shima N, Kimoto M,
Funaki T, Yokoo S, Murakami A and Yamagami S: Adhesion, migration,
and proliferation of cultured human corneal endothelial cells by
laminin-5. Invest Ophthalmol Vis Sci. 52:679–684. 2011. View Article : Google Scholar : PubMed/NCBI
|
|
16
|
DiPersio CM, Hodivala-Dilke KM, Jaenisch
R, Kreidberg JA and Hynes RO: alpha3beta1 Integrin is required for
normal development of the epidermal basement membrane. J Cell Biol.
137:729–742. 1997. View Article : Google Scholar : PubMed/NCBI
|
|
17
|
Kreidberg JA: Functions of alpha3beta1
integrin. Curr Opin Cell Biol. 12:548–553. 2000. View Article : Google Scholar : PubMed/NCBI
|
|
18
|
Tsuji T: Physiological and pathological
roles of alpha3beta1 integrin. J Membr Biol. 200:115–132. 2004.
View Article : Google Scholar : PubMed/NCBI
|
|
19
|
Takenaka K, Shibuya M, Takeda Y, Hibino S,
Gemma A, Ono Y and Kudoh S: Altered expression and function of
beta1 integrins in a highly metastatic human lung adenocarcinoma
cell line. Int J Oncol. 17:1187–1194. 2000.PubMed/NCBI
|
|
20
|
Coopman PJ, Thomas DM, Gehlsen KR and
Mueller SC: Integrin alpha 3 beta 1 participates in the
phagocytosis of extracellular matrix molecules by human breast
cancer cells. Mol Biol Cell. 7:1789–1804. 1996. View Article : Google Scholar : PubMed/NCBI
|
|
21
|
Adachi M, Taki T, Higashiyama M, Kohno N,
Inufusa H and Miyake M: Significance of integrin alpha5 gene
expression as a prognostic factor in node-negative non-small cell
lung cancer. Clin Cancer Res. 6:96–101. 2000.PubMed/NCBI
|
|
22
|
Ryu MH, Park HM, Chung J, Lee CH and Park
HR: Hypoxia-inducible factor-1alpha mediates oral squamous cell
carcinoma invasion via upregulation of alpha5 integrin and
fibronectin. Biochem Biophys Res Commun. 393:11–15. 2010.
View Article : Google Scholar : PubMed/NCBI
|
|
23
|
Bandyopadhyay A and Raghavan S: Defining
the role of integrin alphavbeta6 in cancer. Curr Drug Targets.
10:645–652. 2009. View Article : Google Scholar : PubMed/NCBI
|
|
24
|
Ramos DM, Dang D and Sadler S: The role of
the integrin alpha v beta6 in regulating the epithelial to
mesenchymal transition in oral cancer. Anticancer Res. 29:125–130.
2009.PubMed/NCBI
|
|
25
|
Ramos DM, But M, Regezi J, Schmidt BL,
Atakilit A, Dang D, Ellis D, Jordan R and Li X: Expression of
integrin beta 6 enhances invasive behavior in oral squamous cell
carcinoma. Matrix Biol. 21:297–307. 2002. View Article : Google Scholar : PubMed/NCBI
|
|
26
|
Greene FL, Page DL, Fleming ID, Fritz AG,
Balch CM, Haller DG and Morrow M: AJCC cancer staging manual.
Springer-Verlag; New York: 2002, View Article : Google Scholar
|
|
27
|
Livak KJ and Schmittgen TD: Analysis of
relative gene expression data using real-time quantitative PCR and
the 2(−Delta Delta C(T)) method. Methods. 25:402–408. 2001.
View Article : Google Scholar : PubMed/NCBI
|
|
28
|
Chang HW, Cheng CA, Gu DL, Chang CC, Su
SH, Wen CH, Chou YC, Chou TC, Yao CT, Tsai CL and Cheng CC:
High-throughput avian molecular sexing by SYBR green-based
real-time PCR combined with melting curve analysis. BMC Biotechnol.
8:122008. View Article : Google Scholar : PubMed/NCBI
|
|
29
|
Shih IeM, Salani R, Fiegl M, Wang TL,
Soosaipillai A, Marth C, Müller-Holzner E, Gastl G, Zhang Z and
Diamandis EP: Ovarian cancer specific kallikrein profile in
effusions. Gynecol Oncol. 105:501–507. 2007. View Article : Google Scholar : PubMed/NCBI
|
|
30
|
Wong HS and Chang WC: Correlation of
clinical features and genetic profiles of stromal interaction
molecule 1 (STIM1) in colorectal cancers. Oncotarget.
6:42169–42182. 2015. View Article : Google Scholar : PubMed/NCBI
|
|
31
|
Castilho LS, Cotta FV, Bueno AC, Moreira
AN, Ferreira EF and Magalhães CS: Validation of DIAGNOdent laser
fluorescence and the international caries detection and assessment
system (ICDAS) in diagnosis of occlusal caries in permanent teeth:
An in vivo study. Eur J Oral Sci. 124:188–194. 2016. View Article : Google Scholar : PubMed/NCBI
|
|
32
|
Zhang B, Zhang Z, Zhang X, Gao X,
Kernstine KH and Zhong L: Serological antibodies against LY6K as a
diagnostic biomarker in esophageal squamous cell carcinoma.
Biomarkers. 17:372–378. 2012. View Article : Google Scholar : PubMed/NCBI
|
|
33
|
Cai C, Shi R, Gao Y, Zeng J, Wei M, Wang
H, Zheng W and Ma W: Reduced expression of sushi domain containing
2 is associated with progression of non-small cell lung cancer.
Oncol Lett. 10:3619–3624. 2015. View Article : Google Scholar : PubMed/NCBI
|
|
34
|
Sun L, Xu S, Liang L, Zhao L and Zhang L:
Analysis of ROC: The value of HPV16 E6 protein in the diagnosis of
early stage cervical carcinoma and precancerous lesions. Oncol
Lett. 12:1769–1772. 2016. View Article : Google Scholar : PubMed/NCBI
|
|
35
|
Kurozumi A, Goto Y, Matsushita R, Fukumoto
I, Kato M, Nishikawa R, Sakamoto S, Enokida H, Nakagawa M, Ichikawa
T and Seki N: Tumor-suppressive microRNA-223 inhibits cancer cell
migration and invasion by targeting ITGA3/ITGB1 signaling in
prostate cancer. Cancer Sci. 107:84–94. 2016. View Article : Google Scholar : PubMed/NCBI
|
|
36
|
Zheng W, Jiang C and Li R: Integrin and
gene network analysis reveals that ITGA5 and ITGB1 are prognostic
in non-small-cell lung cancer. Onco Targets Ther. 9:2317–2327.
2016. View Article : Google Scholar : PubMed/NCBI
|
|
37
|
Desai K, Nair MG, Prabhu JS, Vinod A,
Korlimarla A, Rajarajan S, Aiyappa R, Kaluve RS, Alexander A, Hari
PS, et al: High expression of integrin β6 in association with the
Rho-Rac pathway identifies a poor prognostic subgroup within HER2
amplified breast cancers. Cancer Med. 5:2000–2011. 2016. View Article : Google Scholar : PubMed/NCBI
|
|
38
|
He M, Zhao Y, Yi H, Sun H, Liu X and Ma S:
The combination of TP53INP1, TP53INP2 and AXIN2: Potential
biomarkers in papillary thyroid carcinoma. Endocrine. 48:712–717.
2015. View Article : Google Scholar : PubMed/NCBI
|
|
39
|
Rozalski R, Gackowski D, Siomek-Gorecka A,
Starczak M, Modrzejewska M, Banaszkiewicz Z and Olinski R: Urinary
5-hydroxymethyluracil and 8-oxo-7,8-dihydroguanine as potential
biomarkers in patients with colorectal cancer. Biomarkers.
20:287–291. 2015. View Article : Google Scholar : PubMed/NCBI
|
|
40
|
El-mezayen HA, Metwally FM and Darwish H:
A novel discriminant score based on tumor-associated trypsin
inhibitor for accurate diagnosis of metastasis in patients with
breast cancer. Tumour Biol. 35:2759–2767. 2014. View Article : Google Scholar : PubMed/NCBI
|
|
41
|
Yin MZ, Tan S, Li X, Hou Y, Cao G, Li K,
Kou J and Lou G: Identification of phosphatidylcholine and
lysophosphatidylcholine as novel biomarkers for cervical cancers in
a prospective cohort study. Tumour Biol. 37:5485–5492. 2016.
View Article : Google Scholar : PubMed/NCBI
|
|
42
|
Arcolia V, Journe F, Renaud F, Leteurtre
E, Gabius HJ, Remmelink M and Saussez S: Combination of galectin-3,
CK19 and HBME-1 immunostaining improves the diagnosis of thyroid
cancer. Oncol Lett. 14:4183–4189. 2017. View Article : Google Scholar : PubMed/NCBI
|
|
43
|
Michailidou E, Tzimagiorgis G,
Chatzopoulou F, Vahtsevanos K, Antoniadis K, Kouidou S, Markopoulos
A and Antoniades D: Salivary mRNA markers having the potential to
detect oral squamous cell carcinoma segregated from oral
leukoplakia with dysplasia. Cancer Epidemiol. 43:112–118. 2016.
View Article : Google Scholar : PubMed/NCBI
|
|
44
|
Bu J, Bu X, Liu B, Chen F and Chen P:
Increased expression of tissue/salivary transgelin mRNA predicts
poor prognosis in patients with oral squamous cell carcinoma
(OSCC). Med Sci Monit. 21:2275–2281. 2015. View Article : Google Scholar : PubMed/NCBI
|
|
45
|
Grady LJ, Campbell WP and North AB: A
comparison of several procedures for reducing RNase contamination
in preparations of DNase and a particularly successful combination
of methods. Anal Biochem. 101:118–122. 1980. View Article : Google Scholar : PubMed/NCBI
|
|
46
|
Febbraio F, Andolfo A, Tanfani F, Briante
R, Gentile F, Formisano S, Vaccaro C, Scirè A, Bertoli E, Pucci P
and Nucci R: Thermal stability and aggregation of sulfolobus
solfataricus beta-glycosidase are dependent upon the
N-epsilon-methylation of specific lysyl residues: Critical role of
in vivo post-translational modifications. J Biol Chem.
279:10185–10194. 2004. View Article : Google Scholar : PubMed/NCBI
|
|
47
|
Ko YC, Huang YL, Lee CH, Chen MJ, Lin LM
and Tsai CC: Betel quid chewing, cigarette smoking and alcohol
consumption related to oral cancer in Taiwan. J Oral Pathol Med.
24:450–453. 1995. View Article : Google Scholar : PubMed/NCBI
|
|
48
|
Petti S, Mohd M and Scully C: Revisiting
the association between alcohol drinking and oral cancer in
nonsmoking and betel quid non-chewing individuals. Cancer
Epidemiol. 36:e1–e6. 2012. View Article : Google Scholar : PubMed/NCBI
|


