Introduction
As in most other countries, breast cancer is now the
most common cancer in Chinese women, cases in China account for
12.2% of all newly diagnosed breast cancers and 9.6% of all deaths
from breast cancer worldwide (1).
Ki-67 is one of the major markers of tumor proliferation, assessed
by immunohistochemistry (IHC) with the anti-Ki-67 antibody called
MIB-1 (2). Many investigations have
reported that Ki-67 is an independent predictive and prognostic
marker in patients with operable breast cancer (3,4). Thus,
assessment of Ki-67 is already introduced into daily practice in
order to discriminate breast cancer subtypes, predict oncological
outcomes, or decide on indications for adjuvant treatment (5). Current preoperative assessment of Ki-67
is mostly based on IHC, which requires tissue specimens typically
obtained by needle biopsy. Due to the relatively small tissue
sample size and tumor heterogeneity, the Ki-67 expression
assessment performed on a needle biopsy sample may not be
representative of the tumor entirety. Moreover, Ki-67 assessment
can be unavailable in many critical cases where biopsy is in
feasible.
Recently, several studies have hypothesized that
tumor characteristics at the cellular and genetic levels are
reflected in the phenotypic patterns and can be captured with
medical imaging (6–8). On this theoretical basis, the radiomics
methodology has been proposed that objectively characterizes tumor
phenotypes using the advanced quantitative features of medical
images. These features, referred to as the radiomics features, are
extracted from medical images using advanced mathematical
algorithms in a high-throughput way, and can discover tumor
characteristics that may fail to be appreciated by the naked eye
(9–12).
To date, the previous research on the radiomics
features of breast cancer has focused majorly on the separation of
the benign and malignant (13,14),
molecular receptor status of estrogen receptor (ER)+ and
ER−, progesterone receptor (PR)+ and
PR−, human epidermal growth factor receptor 2
(HER2)+ and HER2− for dynamic
contrast-enhanced magnetic resonance imaging (DCE-MRI) (15–20). No
report has been released on analyzing the Ki-67 expression with
radiomics features. Therefore, the goal of this study is to explore
the association of extracted radiomics features with Ki-67
expression on breast DCE-MRI, which could provide a noninvasive
means to better understand the proliferation of breast cancer and
further providing valuable information for personalized
therapy.
Materials and methods
Clinical data
The present retrospective study was approved by the
Institutional Review Board of Tianjin Medical University (Tianjin,
China). Three hundred seventy-seven (377) Chinese women with
invasive breast cancer that were confirmed by pathology and
underwent breast DCE-MRI were divided into two groups based on
their Ki-67 proliferation index: Low-Ki-67 group-Ki-67
proliferation index less than 14%; high-Ki-67 group-Ki-67
proliferation index more than 14% (5). This breast DCE-MRI data was
prospectively collected from January 2015 to September 2015 at our
institution. In the entire data set, the low-Ki-67 group was
composed of 53 low-Ki-67 expressed lesions that accounts for 14.06%
of the total cases. For a preliminary analysis, 106 high-Ki-67
expressed lesions (double of the low-Ki-67 expressed group) were
selected at random from the total data set as the high-Ki-67 group.
The ages of the patients ranged from 30 to 68 years old (49±10,
median 48) in the low-Ki-67 group and from 29 to 72 years old in
high-Ki-67 group (47±9, median 50). There was no statistically
significant difference in age between the two groups (P=0.483).
Imaging data
The DCE-MRI examinations were performed on a 3.0T
scanner using a dedicated 8-channel phased-array breast coil
(Discovery MR750; GE Healthcare, Shanghai, China). Sagittal data
was obtained by the volume imaging for breast assessment bilateral
breast imaging technique, with TR=6.1 ms, TE=2.9 ms, flip
angle=15°, matrix size=256×128, field of view=26×26 cm, NEX=1,
slice thickness=1.8 mm. Before injection of the contrast agent,
serial mask images were obtained. Successively, the contrast agent
(Gd-DTPA, 0.2 ml/kg body weight, flow rate 2.0 ml/sec) was manually
injected using an automatic MR-compatible power injector, and
thereafter flushed with the same total dose of saline solution. The
dynamic MRI acquisitions were started immediately after the
injection. The acquisition was repeated five times, and each phase
took 90–100 sec. The radiomics analysis was conducted at the first
post-contrast time-point of the MRI.
Lesion segmentation
The contour of the lesion region of interest (ROI)
in the largest DCE-MRI slice of each lesion was automatically
constructed using the localizing region-based active contours
algorithm (21). Figs. 1 and 2
show the segmented results of two MRI images.
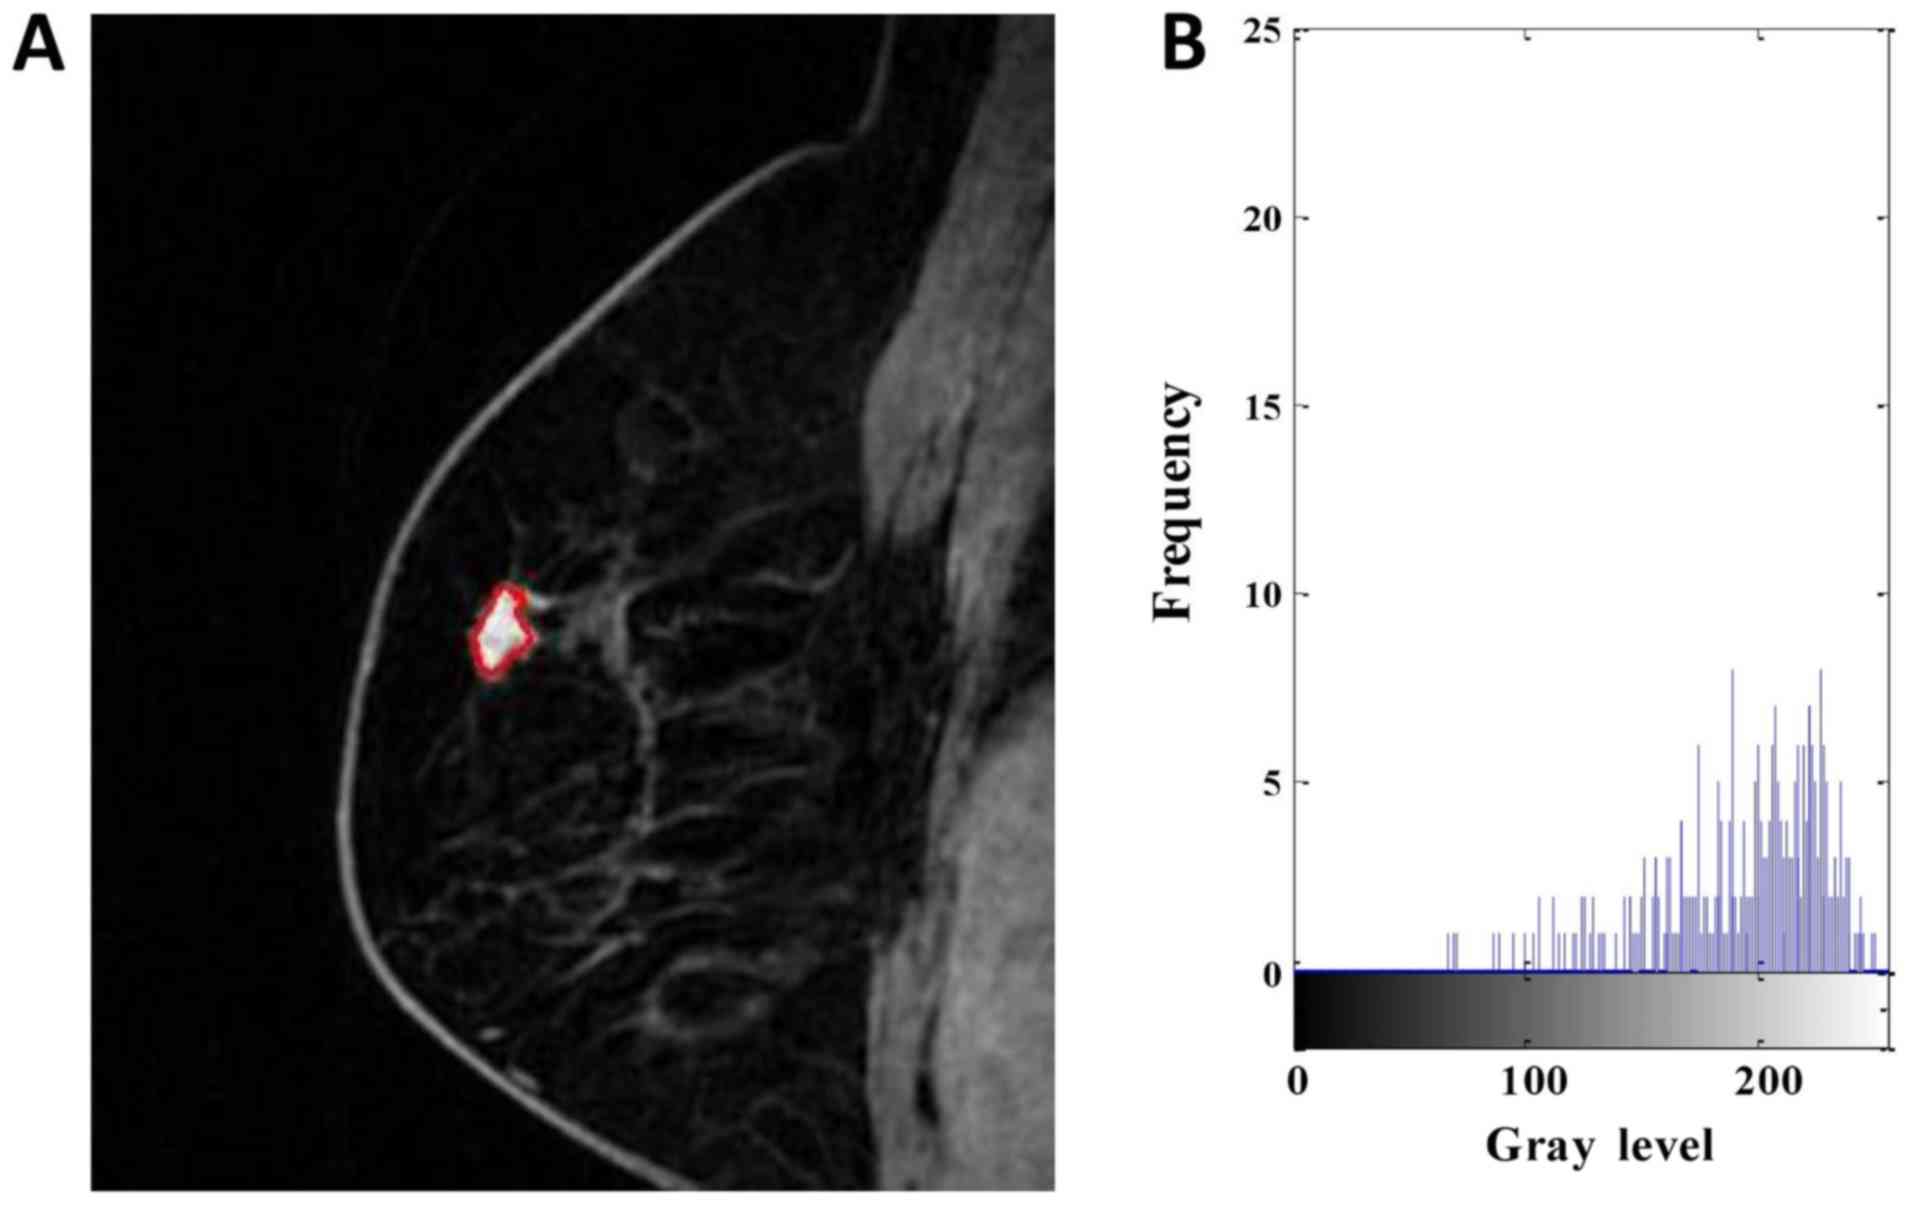 | Figure 1.DCE-MRI of a 63-year-old woman with
low-Ki-67 expression. (A) Segmentation outlines obtained from the
active contours segmentation method. (B) The gray-scale histogram
of the region of interest. The values of the area, SD, skewness,
kurtosis, entropy, contrast, homogeneity and inverse differential
moment were 436, 48.784, −0.535, 2.242, 6.120, 4.597, 0.529 and
0.079, respectively. DCE-MRI, dynamic contrast-enhanced magnetic
resonance imaging. SD, standard deviation. |
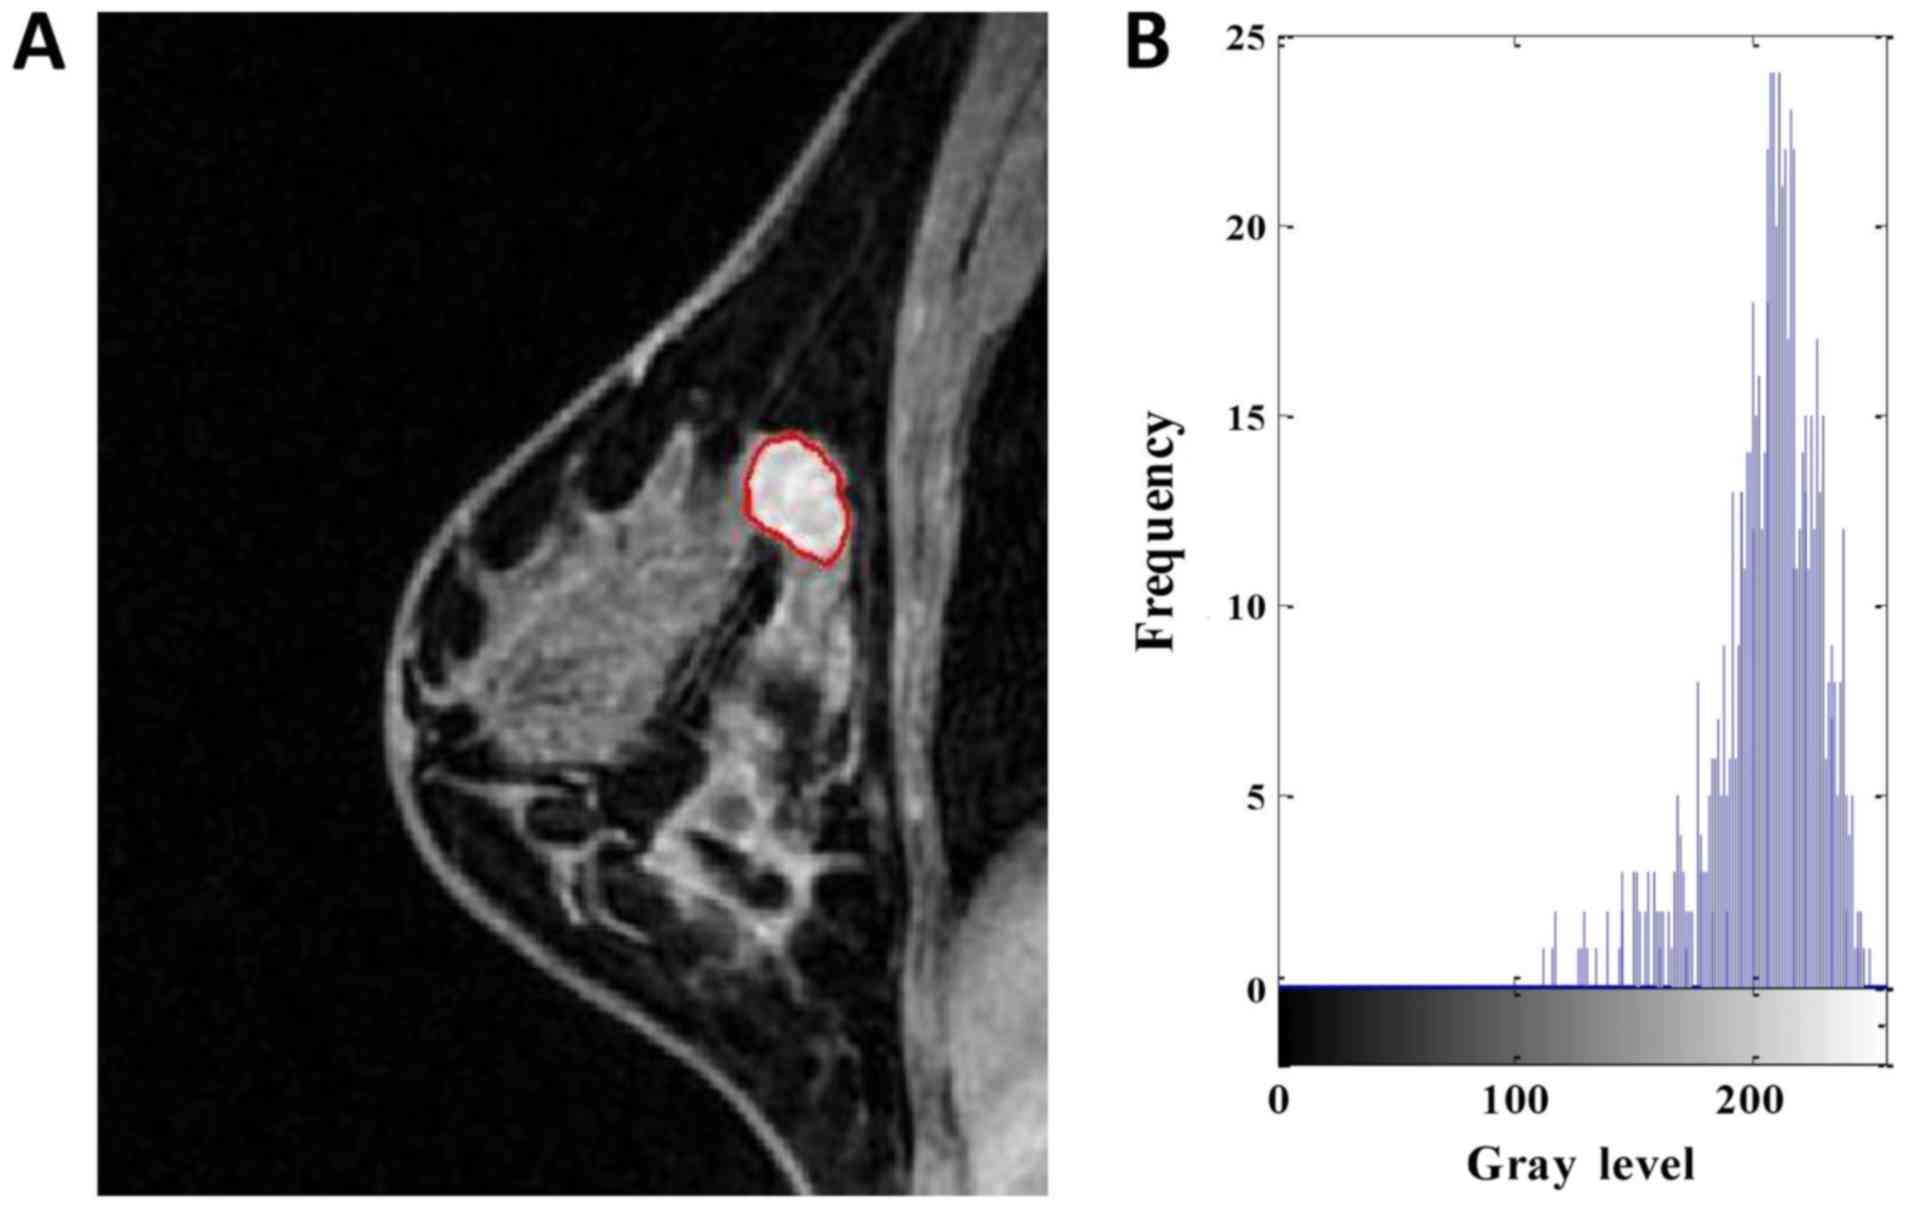 | Figure 2.DCE-MRI of a 43-year-old woman with
high-Ki-67 expression. (A) Segmentation outlines obtained from the
active contours segmentation method. (B) The gray-scale histogram
of the region of interest. The values of the area, SD, skewness,
kurtosis, entropy, contrast, homogeneity and inverse differential
moment were 810, 31.746, −1.231, 3.985, 4.738, 1.704, 0.675 and
0.076, respectively. DCE-MRI, dynamic contrast-enhanced magnetic
resonance imaging. SD, standard deviation. |
Radiomics features
Radiomics features provide an objective and
quantitative metrics to assess tumor phenotype. In this work, 15
features were extracted from each ROI, including 5 morphological
features, 4 gray-scale histograms and 6 texture features, as
explained below.
Morphological features
Five metrics, including area, normalized radial
length (NRL), roundness, compactness and concavity rate, were
calculated for the morphological description of the images. Area is
one of the most basic characteristics to describe image ROI, and
normally defined as the number of the pixels in the ROI. NRL
defined as the Euclidean distance from the center of the lesion ROI
to each of its contour pixels and normalized to the maximum radial
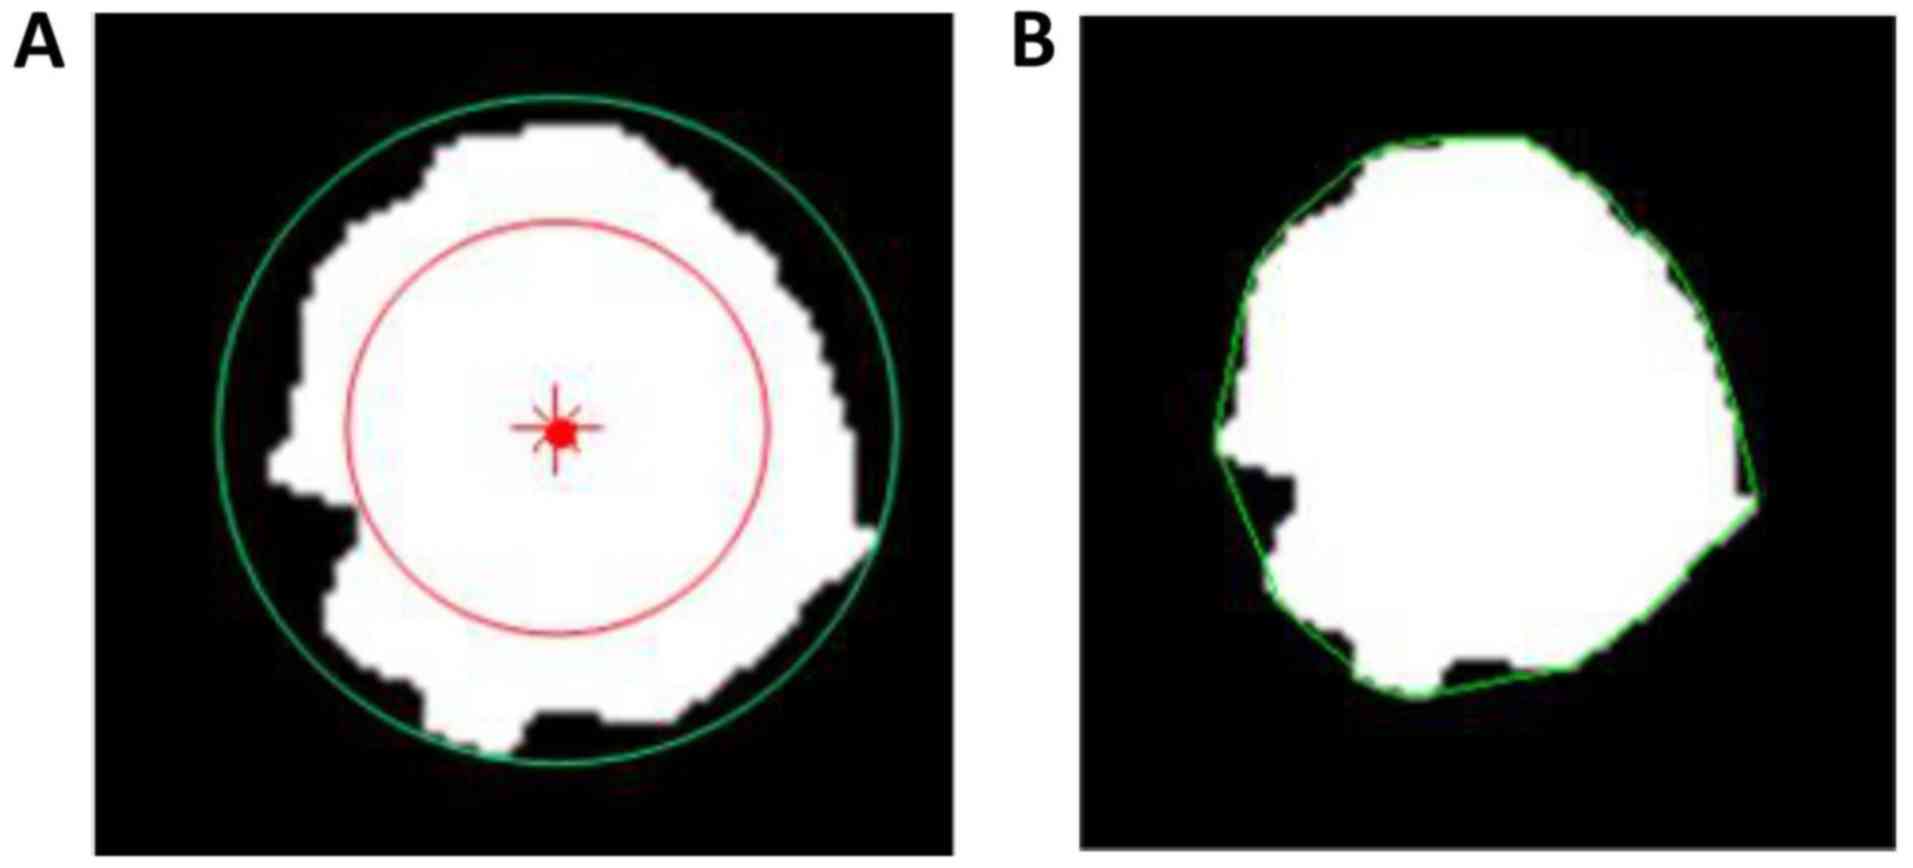
length of the lesion. Roundness is the measure of how closely the
shape of an object approaches that of a mathematically perfect
circle, and defined as the ratio of the circumcircle radius to the
inscribed circle radius of the lesion ROI. The circum and inscribed
circles are defined as circles with their radii being the maximum
and minimum distances from a boundary point to the center of the
lesion ROI, respectively, as shown in Fig. 3A. Compactness and concavity are
associated with shape and margin of the lesion. Compactness is
defined as the 4πxA/P2, where A is the cross-sectional area of the
tumor and P is the measured length of the perimeter of the lesion.
Concavity rate is defined as abs (A-B)/B, where B is the area of
the convex hull calculated for the lesion region, as illustrated in
Fig. 3B, and ‘abs’ denotes the
absolute value.
Gray-scale histograms features
Four features were computed for each lesion
according to the definitions of the gray-scale histogram: Mean,
standard deviation (SD), skewness and kurtosis. Their definition
can be found in literatures (22).
Texture features
Texture is a repeating pattern of local variations
in image intensity, and is characterized by the spatial
distribution of intensity levels in a neighborhood. Six gray-level
co-occurrence matrix (GLCM) texture features were obtained for each
lesion as defined by Haralick et al (23), including energy, entropy, contrast,
correlation, homogeneity and inverse differential moment (IDM). The
ROI extraction and radiomics feature calculations were performed
using programs written with MATLAB 2014b.
Statistical methods
To compare the differences in morphologic,
gray-scale histograms and texture features of low- and high-Ki-67
expression by using radiomics analysis method, the statistical
method used was the Mann-Whitney U test, with the significance
level set as α=0.05. Statistical analysis was performed using R
3.4.3 software (www.R-project.org). P<0.05 was considered to
indicate a statistically significant difference.
Results
The average values and SD of the radiomics features
are compared in Table I. No
statistically significant differences were observed in roundness,
NRL, compactness, concavity rate, mean, energy, entropy and
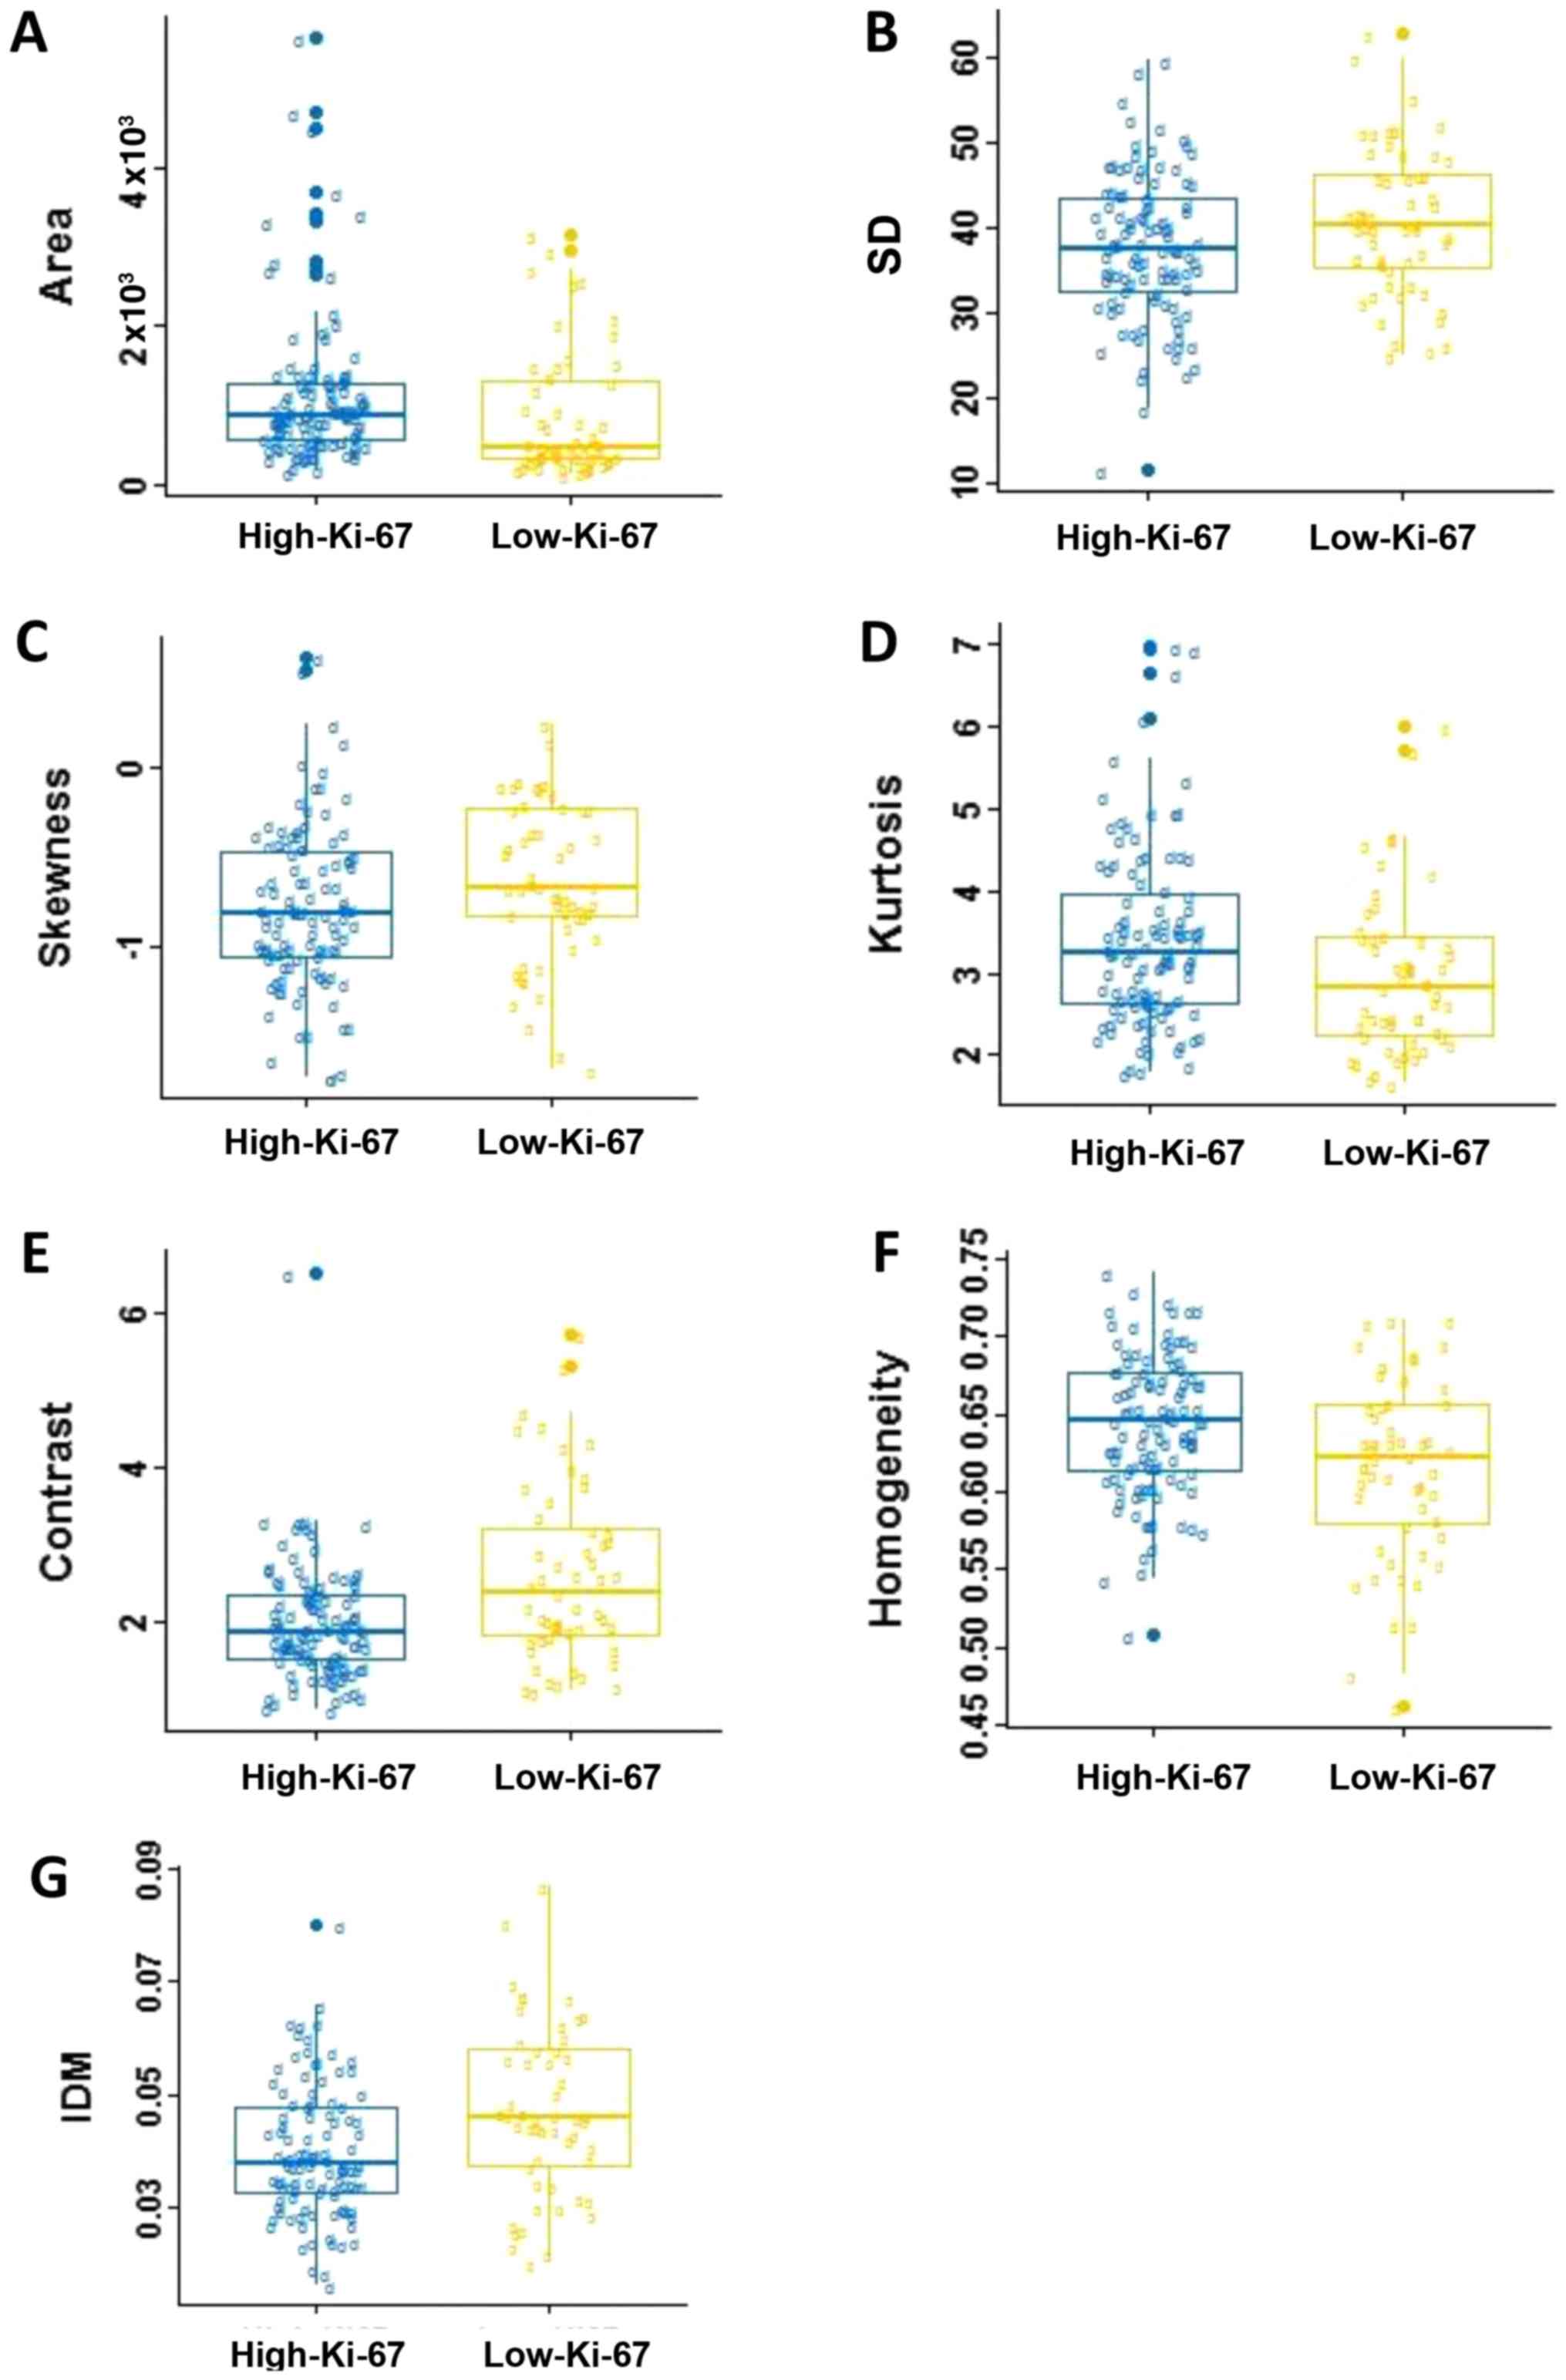
correlation between two groups (P>0.05). Fig. 4 shows the box and whisker plots of the
radiomics parameters values of two groups for P<0.05. It
displays the center and spread of a numeric variable in a
format.
 | Table I.Feature parameters in association with
Ki-67 expression. |
Table I.
Feature parameters in association with
Ki-67 expression.
|
| Mean ± SD |
|
|---|
|
|
|
|
|---|
| Feature
parameters | High-Ki-67 | Low-Ki-67 | P-value |
|---|
| Morphologic |
|
|
|
| Area | 1,125.7±936.2 | 868.6±814.1 | 0.002 |
| NRL | 0.275±0.040 | 0.271±0.035 | 0.261 |
|
Roundness | 0.745±0.148 | 0.732±0.146 | 0.619 |
|
Compactness | 0.707±0.135 | 0.705±0.157 | 0.991 |
| Concavity
rate | 0.112±0.075 | 0.128±0.106 | 0.449 |
| Gray-level
histogram |
|
|
|
| Mean | 167.164±22.689 | 170.095±23.550 | 0.342 |
| SD | 37.713±8.495 | 40.874±8.686 | 0.043 |
|
Skewness | −0.781±0.449 | −0.636±0.438 | 0.021 |
|
Kurtosis | 3.423±1.084 | 2.980±0.970 | 0.005 |
| GLCM |
|
|
|
|
Energy | 0.044±0.015 | 0.041±0.016 | 0.075 |
|
Entropy | 5.238±0.403 | 5.342±0.384 | 0.061 |
|
Contrast | 1.976±0.754 | 2.627±1.151 | <0.001 |
|
Correlation | 0.847±0.054 | 0.832±0.055 | 0.053 |
|
Homogeneity | 0.644±0.045 | 0.616±0.583 | 0.005 |
|
IDM | 0.040±0.012 | 0.047±0.015 | 0.002 |
In the five morphological parameters, only one
feature, area, which indicating statistical significance in
differentiating the low-Ki-67 expression from the high-Ki-67
expression (P=0.002). As shown in Table
I and Fig. 4A, the high-Ki-67
cases tended to have larger lesion size. There was no significant
difference in roundness, NRL, compactness and concavity between two
groups (P>0.05).
For the gray-scale histograms features, SD, skewness
and kurtosis showed statistical significance between the two groups
(P=0.043, 0.021 and 0.005). The values of the SD and skewness in
the low-Ki-67 group is larger than those in the high-Ki-67 group
(Fig. 4B and C), and it is on the
contrary for the kurtosis (Table I;
Fig. 4D). The histogram is an
effective graphical technique for showing both the skewness and
kurtosis in the data set (Figs. 1 and
2). Notice that the shape of the two
histograms is quite different. It seems that the histograms of the
high-Ki-67 cases tend to densely distribute in a narrow area.
For texture features, contrast, homogeneity and IDM
showed statistical significance between two groups (P=0.0004, 0.005
and 0.002). The value of contrast, and IDM in the low-Ki-67 group
was significantly larger than those in the high-Ki-67 group
(Table I; Fig. 4E-G). The homogeneity in the low-Ki-67
group was smaller than that in the high-Ki-67 group (Fig. 4F). As can be seen in Figs. 1 and 2,
the kurtosis of the high-Ki-67 case was larger than that of the
low-Ki-67. On the contrary, the contrast of the high-Ki-67 case was
smaller than that of the low-Ki-67 case (High-Ki-67: Contrast
index=1.704, IDM index=0.076, entropy index=4.738, homogeneity
index=0.675; Low-Ki-67: Contrast index=4.597, IDM index=0.079,
entropy index=6.120, homogeneity index=0.529). The spread of IDM in
the low-Ki-67 group is more spread out than that in the high-Ki-67
group (Fig. 4G). This phenomenon can
also be found in Fig. 4E.
Discussion
In oncology, biomarkers describe the characteristics
of a malignancy on various levels (clinical, histological,
molecular and so on) and predict patient's outcome and treatment
response, which is the reason why they are increasingly integrated
into the clinical routine. Based on the radiomics theory, multiple
features can be extracted and linked to clinical, genomic, and
histopathological data. Extracted traits describe radiological
shape, grey intensity and texture characteristics and can be
analyzed on routinely performed images. In this study, these
specific radiomic markers and patterns were developed for
discriminating between low- and high-Ki-67 expressions of breast in
DCE-MRI for the first time. Breast cancer with high-Ki-67
expression responds better to chemotherapy but is associated with
poor prognosis (6,24).
In our study a total of 5 morphological features, 4
gray-scale histograms and 6 texture features were extracted to
characterize each lesion. The Mann-Whitney test were performed to
assess the statistical significance of the difference between the
low- and high-Ki-67 expressions. The result shows that the lesion
area, SD, skewness, kurtosis, homogeneity and IDM are significantly
associated with the Ki-67 expression level.
Morphology is a theory and technique for the
analysis and processing of geometrical structures. Clinically, the
doctor relies to a large extent on the morphology of the lesion for
diagnosis. Li et al (25)
indicated that the Ki-67 expression level in breast cancer tissue
significantly correlated with the tumor size. This is consistent
with the results of this study that the lesion area is
significantly associated with the Ki-67 expression. We can find
that the values of the area in the low-Ki-67 expression were much
smaller than that in the high-Ki-67 expression. This indicated that
the increased expression of Ki-67 may predict the increased
proliferation of breast cancer cells, enhanced invasiveness, and
faster growth of the tumor. Nevertheless, since the definition
diagnosis times of the patient cases were difficulty to accurately
control in present, the above observation needs to be further
validated under an identical condition or by using dynamic analysis
in the future investigation.
Skewness describes asymmetrical properties of pixel
distribution. A distribution is symmetric if it looks the same to
the left and right of the center point. The skewness for a normal
distribution is zero, and any symmetric data should have a skewness
near zero. Negative values for the skewness indicate data that are
skewed left and positive values for the skewness indicate data that
are skewed right. We can find in Fig.
4C that two groups almost all data skewed left, and the
high-Ki-67 expression was more to the left. Kurtosis is a measure
of whether the data are heavy-tailed or light-tailed relative to a
normal distribution. We can find in Fig.
4D that the high-Ki-67 group had higher kurtosis. In general,
this means that lesions with many voxels of similar uptake are
likely to be more biologically proliferating.
Table I indicates that
the high-Ki-67 expressed lesions were likely to show more
homogeneous. This can be explained that high-Ki-67 lesions have
more biologically proliferating, and hence have more voxels of
similar uptake that appears to be more homogenous. Most of the GLCM
texture features were highly correlated with each other. A
homogenously enhanced lesion has lower entropy and higher energy
compared to a heterogeneously enhanced lesion. The larger the
enhancement texture entropy, the more heterogeneous the tumor. As
shown in Figs. 1 and 2, a homogeneously enhanced lesion has lower
entropy compared to the heterogeneously enhanced one. Entropy
quantifies complexity of the image. The higher values in entropy of
the low-Ki-67 expression lesions may suggest that these images are
more complex than the high-Ki-67 expression images. The contrast
reflects the clarity of the image and the texture of the groove
depth. The deeper the groove depth and the greater the contrast,
the image is clearer. On the other hand, the contrast value is
small, the image is vaguer. IDM reflects the sharpness of the
image. A higher value of IDM indicates the image texture is
clearer. Fig. 4G indicates that there
is a little difference in image clarity in the high-Ki-67 group and
the value in the low-Ki-67 group larger than high-Ki-67 group
overall. Together, the representation of these features indicates
the high-Ki-67 expressed lesions are more likely to be
heterogeneous.
Despite our encouraging results, some limitations
exist in the present work. First, the automatically extracted
features were investigated on the largest axial slice and the value
was used to represent the whole lesion. The true texture analysis
relies on 3D isotropic image acquisition. However, the 3D whole
lesion analysis is computationally more complex and time-consuming.
Second, we have only considered the tumor images at the 2nd
enhancement phase, and not analyzed the pre-contrasts, other
enhancement images and mammary gland tissues. Third, we did not
analyze the kinetic features that are important parameters in
diagnosis of benign and malignant breast masses. Finally, the
patient sample set was relatively small, and hence results of this
pilot study are somewhat preliminary. In future study we will work
on a larger data set and address these limitations to verify the
preliminary results.
In conclusion, our study illustrates the feasibility
of the use of radiomics analysis in evaluating the Ki-67 expression
level. The low-Ki-67 expression cases tend to be smaller and more
heterogeneous than the high-Ki-67 expression cases. Identification
of the Ki-67 expression helps provide complementary information for
precision medicine to aid clinical decision making. Based on this
study, the next aim is to classify the lesion for the low and
high-Ki-67 expressions by introducing the machine learning
method.
Acknowledgements
Not applicable.
Funding
The present study was supported by The Key Project
of Tianjin Science and Technology Committee Foundation grant (grant
no. 12ZCDZSY16000) and The Tianjin Municipal Government of China
(grant no. 15JCQNJC14500).
Availability of data and materials
The datasets used and/or analysed during the current
study are available from the corresponding author on reasonable
request.
Authors' contributions
MWJ designed the study and edited the manuscript. JY
and LJJ performed the statistical analysis. GXP and SPF collected
the imaging data. LPF analyzed and interpreted the data.
Ethics approval and consent to
participate
The present retrospective study was approved by the
Institutional Review Board of Tianjin Medical University (Tianjin,
China).
Consent for publication
Not applicable.
Competing interests
The authors declare that they have no competing
interests.
References
|
1
|
Fan L, Strasser-Weippl K, Li JJ, St Louis
J, Finkelstein DM, Yu KD, Chen WQ, Shao ZM and Goss PE: Breast
cancer in China. Lancet Oncol. 15:e279–e289. 2014. View Article : Google Scholar : PubMed/NCBI
|
|
2
|
Gerdes J, Li L, Schlueter C, Duchrow M,
Wohlenberg C, Gerlach C, Stahmer I, Kloth S, Brandt E and Flad HD:
Immunobiochemical and molecular biologic characterization of the
cell proliferation-associated nuclear antigen that is defined by
monoclonal antibody Ki-67. Am J Pathol. 138:867–873.
1991.PubMed/NCBI
|
|
3
|
de Azambuja E, Cardoso F, de Castro G Jr,
Colozza M, Mano MS, Durbecq V, Sotiriou C, Larsimont D,
Piccart-Gebhart MJ and Paesmans M: Ki-67 as prognostic marker in
early breast cancer: A meta-analysis of published studies involving
12,155 patients. Br J Cancer. 96:1504–1513. 2007. View Article : Google Scholar : PubMed/NCBI
|
|
4
|
Colozza M, Azambuja E, Cardoso F, Sotiriou
C, Larsimont D and Piccart MJ: Proliferative markers as prognostic
and predictive tools in early breast cancer: Where are we now? Ann
Oncol. 16:1723–1739. 2005. View Article : Google Scholar : PubMed/NCBI
|
|
5
|
Goldhirsch A, Winer EP, Coates AS, Gelber
RD, Piccart-Gebhart M, Thürlimann B and Senn HJ: Panel members:
Personalizing the treatment of women with early breast cancer:
highlights of the St Gallen International Expert Consensus on the
Primary Therapy of Ealy Breast Cancer 2013. Ann Oncol.
24:2206–2223. 2013. View Article : Google Scholar : PubMed/NCBI
|
|
6
|
Brown JR, DiGiovanna MP, Killelea B,
Lannin DR and Rimm DL: Quantitative assessment Ki-67 score for
prediction of response to neoadjuvant chemotherapy in breast
cancer. Lab Invest. 94:98–106. 2014. View Article : Google Scholar : PubMed/NCBI
|
|
7
|
Diehn M, Nardini C, Wang DS, McGovern S,
Jayaraman M, Liang Y, Aldape K, Cha S and Kuo MD: Identification of
noninvasive imaging surrogates for brain tumor gene-expression
modules. Proc Natl AcadSci USA. 105:5213–5218. 2008. View Article : Google Scholar
|
|
8
|
Basu S, Kwee TC, Gatenby R, Saboury B,
Torigian DA and Alavi A: Evolving role of molecular imaging with
PET in detecting and characterizing heterogeneity of cancer tissue
at the primary and metastatic sites, a plausible explanation for
failed attempts to cure malignant disorders. Eur J Nucl Med Mol
Imaging. 38:987–991. 2011. View Article : Google Scholar : PubMed/NCBI
|
|
9
|
Rutman AM and Kuo MD: Radiogenomics:
Creating a link between molecular diagnostics and diagnostic
imaging. Eur J Radiol. 70:232–241. 2009. View Article : Google Scholar : PubMed/NCBI
|
|
10
|
Yip SS and Aerts HJ: Applications and
limitations of radiomics. Phys Med Biol. 61:R150–R166. 2016.
View Article : Google Scholar : PubMed/NCBI
|
|
11
|
Lambin P, Rios-Velazquez E, Leijenaar R,
Carvalho S, van Stiphout RG, Granton P, Zegers CM, Gillies R,
Boellard R, Dekker A and Aerts HJ: Radiomics: Extracting more
information from medical images using advanced feature analysis.
Eur J Cancer. 48:441–446. 2012. View Article : Google Scholar : PubMed/NCBI
|
|
12
|
Kumar V, Gu Y, Basu S, Berglund A,
Eschrich SA, Schabath MB, Forster K, Aerts HJ, Dekker A,
Fenstermacher D, et al: Radiomics: The process and the challenges.
Magn Reson Imaging. 30:1234–1248. 2012. View Article : Google Scholar : PubMed/NCBI
|
|
13
|
Limkin EJ, Sun R, Dercle L, Zacharaki EI,
Robert C, Reuzé S, Schernberg A, Paragios N, Deutsch E and Ferté C:
Promises and challenges for the implementation of computational
medical imaging (radiomics) in oncology. Ann Oncol. 28:1191–1206.
2017. View Article : Google Scholar : PubMed/NCBI
|
|
14
|
Nie K, Chen JH, Yu HJ, Chu Y, Nalcioglu O
and Su MY: Quantitative analysis of lesion morphology and texture
features for diagnostic prediction in breast MRI. Acad Radiol.
15:1513–1525. 2008. View Article : Google Scholar : PubMed/NCBI
|
|
15
|
Kim SG, Freed M, Leite APK, Zhang J, Seuss
C and Moy L: Separation of benign and malignant breast lesions
using dynamic contrast enhanced MRI in a biopsy cohort. J Magn
Reson Imaging. 45:1385–1393. 2017. View Article : Google Scholar : PubMed/NCBI
|
|
16
|
Chang RF, Chen HH, Chang YC, Huang CS,
Chen JH and Lo CM: Quantification of breast tumor heterogeneity for
ER status, HER2 status, and TN molecular subtype evaluation on
DCE-MRI. Magn Reson Imaging. 34:809–819. 2016. View Article : Google Scholar : PubMed/NCBI
|
|
17
|
Fan M, Li H, Wang S, Zheng B, Zhang J and
Li L: Radiomic analysis reveals DCE-MRI features for prediction of
molecular subtypes of breast cancer. PLoS One. 12:e01716832017.
View Article : Google Scholar : PubMed/NCBI
|
|
18
|
Chou SS, Gombos EC, Chikarmane SA, Giess
CS and Jayender J: Computer-aided heterogeneity analysis in breast
MR imaging assessment of ductal carcinoma in situ: Correlating
histologic grade and receptor status. J Magn Reson Imaging.
46:1748–1759. 2017. View Article : Google Scholar : PubMed/NCBI
|
|
19
|
Agner SC, Rosen MA, Englander S,
Tomaszewski JE, Feldman MD, Zhang P, Mies C, Schnall MD and
Madabhushi A: Computerized image analysis for identifying
triple-negative breast cancers and differentiating them from other
molecular subtypes of breast cancer on dynamic contrast-enhanced MR
images: A feasibility study. Radiology. 272:91–99. 2014. View Article : Google Scholar : PubMed/NCBI
|
|
20
|
Sutton EJ, Dashevsky BZ, Oh JH,
Veeraraghavan H, Apte AP, Thakur SB, Morris EA and Deasy JO: Breast
cancer molecular subtype classifier that incorporates MRI features.
J Magn Reson Imaging. 44:122–129. 2016. View Article : Google Scholar : PubMed/NCBI
|
|
21
|
Lankton S and Tannenbaum A: Localizing
region-based active contours. IEEE Trans Image Process.
17:2029–2039. 2008. View Article : Google Scholar : PubMed/NCBI
|
|
22
|
Rodenacker K and Bengtsson E: A feature
set for cytometry on digitized microscopic images. Anal Cell
Pathol. 25:1–36. 2003. View Article : Google Scholar : PubMed/NCBI
|
|
23
|
Haralick R, Shanmugam K and Dinstein I:
Texture parameters for image classification. IEEE Trans SMC.
3:610–621. 1973.
|
|
24
|
Matsubara N, Mukai H, Masumoto M, Sasaki
M, Naito Y, Fujii S and Wada N: Survival outcome and reduction rate
of Ki-67 between pre- and post-neoadjuvant chemotherapy in breast
cancer patients with non-pCR. Breast Cancer Res Treat. 147:95–102.
2014. View Article : Google Scholar : PubMed/NCBI
|
|
25
|
Li H, Han X, Liu Y, Liu G and Dong G: Ki67
as a predictor of poor prognosis in patients with triple-negative
breast cancer. Oncol Lett. 9:149–152. 2015. View Article : Google Scholar : PubMed/NCBI
|